Zip Codes with the Highest Child Poverty Level Among Boys Under the Age of 16 in New Orleans, LA

RELATED REPORTS & OPTIONS

Highest Poverty | Boys 0-16
Population
Families and Households
Female Fertility
Female Fertility (Unmarried)
Race (Community Size)
Race (Percentage)
Ancestry (Community Size)
AfricanAlaska NativeAlbanianAlsatianAmericanApacheArabArgentineanArmenianAustralianAustrianBarbadianBasqueBelgianBelizeanBhutaneseBlackfeetBolivianBrazilianBritishBritish West IndianBulgarianBurmeseCajunCanadianCelticCentral AmericanCentral American IndianCherokeeChickasawChileanChippewaChoctawColombianCosta RicanCreekCroatianCubanCzechCzechoslovakianDanishDominicanDutchEastern EuropeanEcuadorianEgyptianEnglishEstonianEthiopianEuropeanFilipinoFinnishFrenchFrench CanadianGermanGhanaianGreekGuamanian / ChamorroGuatemalanGuyaneseHaitianHonduranHoumaHungarianIndian (Asian)IranianIrishIroquoisIsraeliItalianJamaicanJapaneseKenyanKoreanLaotianLatvianLebaneseLithuanianLuxembourgerMexicanMexican American IndianMongolianMoroccanNative HawaiianNavajoNicaraguanNigerianNorthern EuropeanNorwegianPakistaniPalestinianPanamanianParaguayanPennsylvania GermanPeruvianPolishPortuguesePuerto RicanRomanianRussianSalvadoranSamoanScandinavianScotch-IrishScottishSeminoleSenegaleseSerbianSiouxSlavicSlovakSloveneSouth AfricanSouth AmericanSouth American IndianSpaniardSpanishSri LankanSubsaharan AfricanSwedishSwissSyrianThaiTrinidadian and TobagonianTurkishUgandanUkrainianUruguayanVenezuelanVietnameseWelshWest IndianYugoslavian
Ancestry (Percentage)
AfricanAlaska NativeAlbanianAlsatianAmericanApacheArabArgentineanArmenianAustralianAustrianBarbadianBasqueBelgianBelizeanBhutaneseBlackfeetBolivianBrazilianBritishBritish West IndianBulgarianBurmeseCajunCanadianCelticCentral AmericanCentral American IndianCherokeeChickasawChileanChippewaChoctawColombianCosta RicanCreekCroatianCubanCzechCzechoslovakianDanishDominicanDutchEastern EuropeanEcuadorianEgyptianEnglishEstonianEthiopianEuropeanFilipinoFinnishFrenchFrench CanadianGermanGhanaianGreekGuamanian / ChamorroGuatemalanGuyaneseHaitianHonduranHoumaHungarianIndian (Asian)IranianIrishIroquoisIsraeliItalianJamaicanJapaneseKenyanKoreanLaotianLatvianLebaneseLithuanianLuxembourgerMexicanMexican American IndianMongolianMoroccanNative HawaiianNavajoNicaraguanNigerianNorthern EuropeanNorwegianPakistaniPalestinianPanamanianParaguayanPennsylvania GermanPeruvianPolishPortuguesePuerto RicanRomanianRussianSalvadoranSamoanScandinavianScotch-IrishScottishSeminoleSenegaleseSerbianSiouxSlavicSlovakSloveneSouth AfricanSouth AmericanSouth American IndianSpaniardSpanishSri LankanSubsaharan AfricanSwedishSwissSyrianThaiTrinidadian and TobagonianTurkishUgandanUkrainianUruguayanVenezuelanVietnameseWelshWest IndianYugoslavian
Immigrant Origin (Total)
AfricaAlbaniaArgentinaAsiaAustraliaAustriaBangladeshBarbadosBelgiumBelizeBoliviaBrazilBulgariaCambodiaCameroonCanadaCaribbeanCentral AmericaChileChinaColombiaCosta RicaCubaCzechoslovakiaDominicaDominican RepublicEastern AfricaEastern AsiaEastern EuropeEcuadorEl SalvadorEnglandEritreaEthiopiaEuropeFranceGermanyGreeceGuatemalaGuyanaHaitiHondurasHong KongHungaryIndiaIndonesiaIranIraqIrelandIsraelItalyJamaicaJapanKenyaKoreaLaosLatin AmericaLebanonMalaysiaMexicoMiddle AfricaNetherlandsNicaraguaNigeriaNorthern AfricaNorthern EuropeNorwayOceaniaPakistanPanamaPeruPhilippinesPolandRomaniaRussiaSaudi ArabiaScotlandSenegalSouth AfricaSouth AmericaSouth Central AsiaSouth Eastern AsiaSouthern EuropeSpainSwedenSwitzerlandSyriaTaiwanThailandTrinidad and TobagoTurkeyUgandaUkraineVenezuelaVietnamWest IndiesWestern AfricaWestern AsiaWestern Europe
Immigrant Origin (Percentage)
AfricaAlbaniaArgentinaAsiaAustraliaAustriaBangladeshBarbadosBelgiumBelizeBoliviaBrazilBulgariaCambodiaCameroonCanadaCaribbeanCentral AmericaChileChinaColombiaCosta RicaCubaCzechoslovakiaDominicaDominican RepublicEastern AfricaEastern AsiaEastern EuropeEcuadorEl SalvadorEnglandEritreaEthiopiaEuropeFranceGermanyGreeceGuatemalaGuyanaHaitiHondurasHong KongHungaryIndiaIndonesiaIranIraqIrelandIsraelItalyJamaicaJapanKenyaKoreaLaosLatin AmericaLebanonMalaysiaMexicoMiddle AfricaNetherlandsNicaraguaNigeriaNorthern AfricaNorthern EuropeNorwayOceaniaPakistanPanamaPeruPhilippinesPolandRomaniaRussiaSaudi ArabiaScotlandSenegalSouth AfricaSouth AmericaSouth Central AsiaSouth Eastern AsiaSouthern EuropeSpainSwedenSwitzerlandSyriaTaiwanThailandTrinidad and TobagoTurkeyUgandaUkraineVenezuelaVietnamWest IndiesWestern AfricaWestern AsiaWestern Europe
Income
Income (Families)
Income (Households)
Poverty
Poverty (Families)
Unemployment
Employment Occupations
Employment Industries
Employer Class
Commute Time
Commute Means
School Enrollment
Education by Degree Field
Occupancy
Finances
Physical Characteristics
New Orleans
Compare Zip Codes
Comparison Subject

Map of Zip Codes with the Highest Child Poverty Level Among Boys Under the Age of 16 in New Orleans

3.7%
53.0%
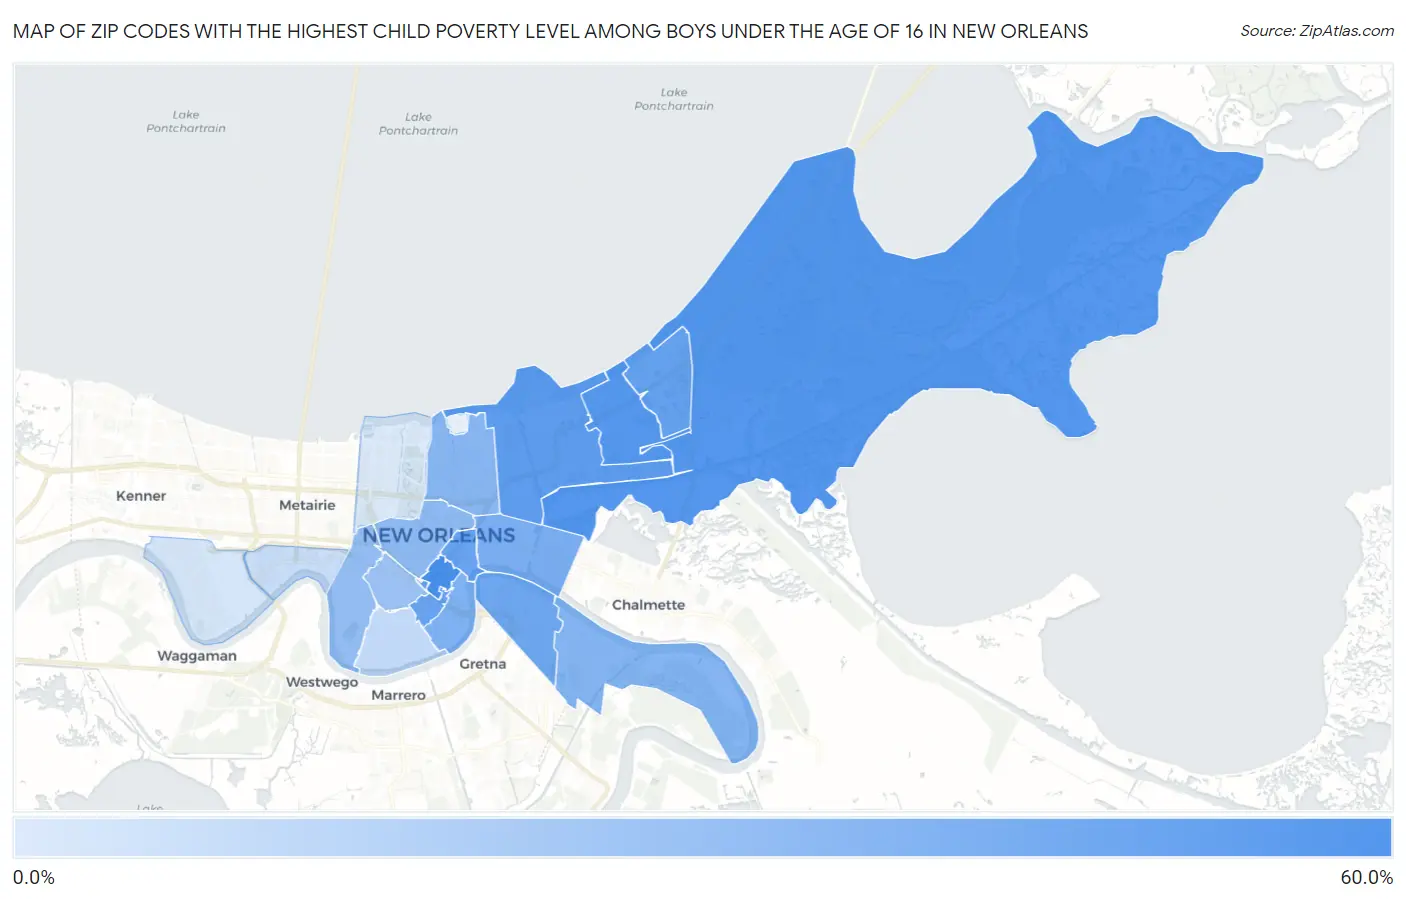
Zip Codes with the Highest Child Poverty Level Among Boys Under the Age of 16 in New Orleans Map

Zip Codes with the Highest Child Poverty Level Among Boys Under the Age of 16 in New Orleans, LA

Zip Code Child Poverty (Boys) vs State vs National
1. 70112 53.0% 26.5% (+26.4)#60 16.9% (+36.0)#1,741
2. 70127 47.4% 26.5% (+20.8)#79 16.9% (+30.5)#2,288
3. 70129 47.4% 26.5% (+20.8)#80 16.9% (+30.5)#2,295
4. 70126 44.0% 26.5% (+17.5)#94 16.9% (+27.1)#2,713
5. 70128 41.6% 26.5% (+15.1)#106 16.9% (+24.7)#3,081
6. 70116 40.5% 26.5% (+14.0)#109 16.9% (+23.6)#3,263
7. 70113 40.5% 26.5% (+13.9)#110 16.9% (+23.6)#3,276
8. 70114 38.5% 26.5% (+12.0)#121 16.9% (+21.6)#3,628
9. 70117 34.0% 26.5% (+7.47)#151 16.9% (+17.1)#4,606
10. 70130 32.2% 26.5% (+5.71)#165 16.9% (+15.3)#5,078
11. 70131 30.6% 26.5% (+4.02)#179 16.9% (+13.7)#5,579
12. 70122 29.5% 26.5% (+3.01)#186 16.9% (+12.6)#5,889
13. 70119 26.9% 26.5% (+0.411)#203 16.9% (+10.0)#6,788
14. 70118 25.3% 26.5% (-1.19)#219 16.9% (+8.44)#7,417
15. 70125 22.5% 26.5% (-3.99)#236 16.9% (+5.63)#8,628
16. 70115 11.1% 26.5% (-15.4)#343 16.9% (-5.79)#15,423
17. 70121 9.2% 26.5% (-17.4)#364 16.9% (-7.74)#17,032
18. 70123 5.9% 26.5% (-20.7)#392 16.9% (-11.0)#19,953
19. 70124 3.7% 26.5% (-22.8)#407 16.9% (-13.2)#21,888

Common Questions

What are the Top 10 Zip Codes with the Highest Child Poverty Level Among Boys Under the Age of 16 in New Orleans, LA?
Top 10 Zip Codes with the Highest Child Poverty Level Among Boys Under the Age of 16 in New Orleans, LA are:
#1
53.0%
#2
47.4%
#3
47.4%
#4
44.0%
#5
41.6%
#6
40.5%
#7
40.5%
#8
38.5%
#9
34.0%
#10
32.2%
What zip code has the Highest Child Poverty Level Among Boys Under the Age of 16 in New Orleans, LA?
70112 has the Highest Child Poverty Level Among Boys Under the Age of 16 in New Orleans, LA with 53.0%.
What is the Poverty Level Among Boys Under the Age of 16 in New Orleans, LA?
Poverty Level Among Boys Under the Age of 16 in New Orleans is 31.8%.
What is the Poverty Level Among Boys Under the Age of 16 in Louisiana?
Poverty Level Among Boys Under the Age of 16 in Louisiana is 26.5%.
What is the Poverty Level Among Boys Under the Age of 16 in the United States?
Poverty Level Among Boys Under the Age of 16 in the United States is 16.9%.