Zip Codes with the Highest Percentage of Households Heated by Bottled Gas / Liquid Propane in Noblesville, IN
RELATED REPORTS & OPTIONS
Bottled Gas / LP Heating
Noblesville
Compare Zip Codes
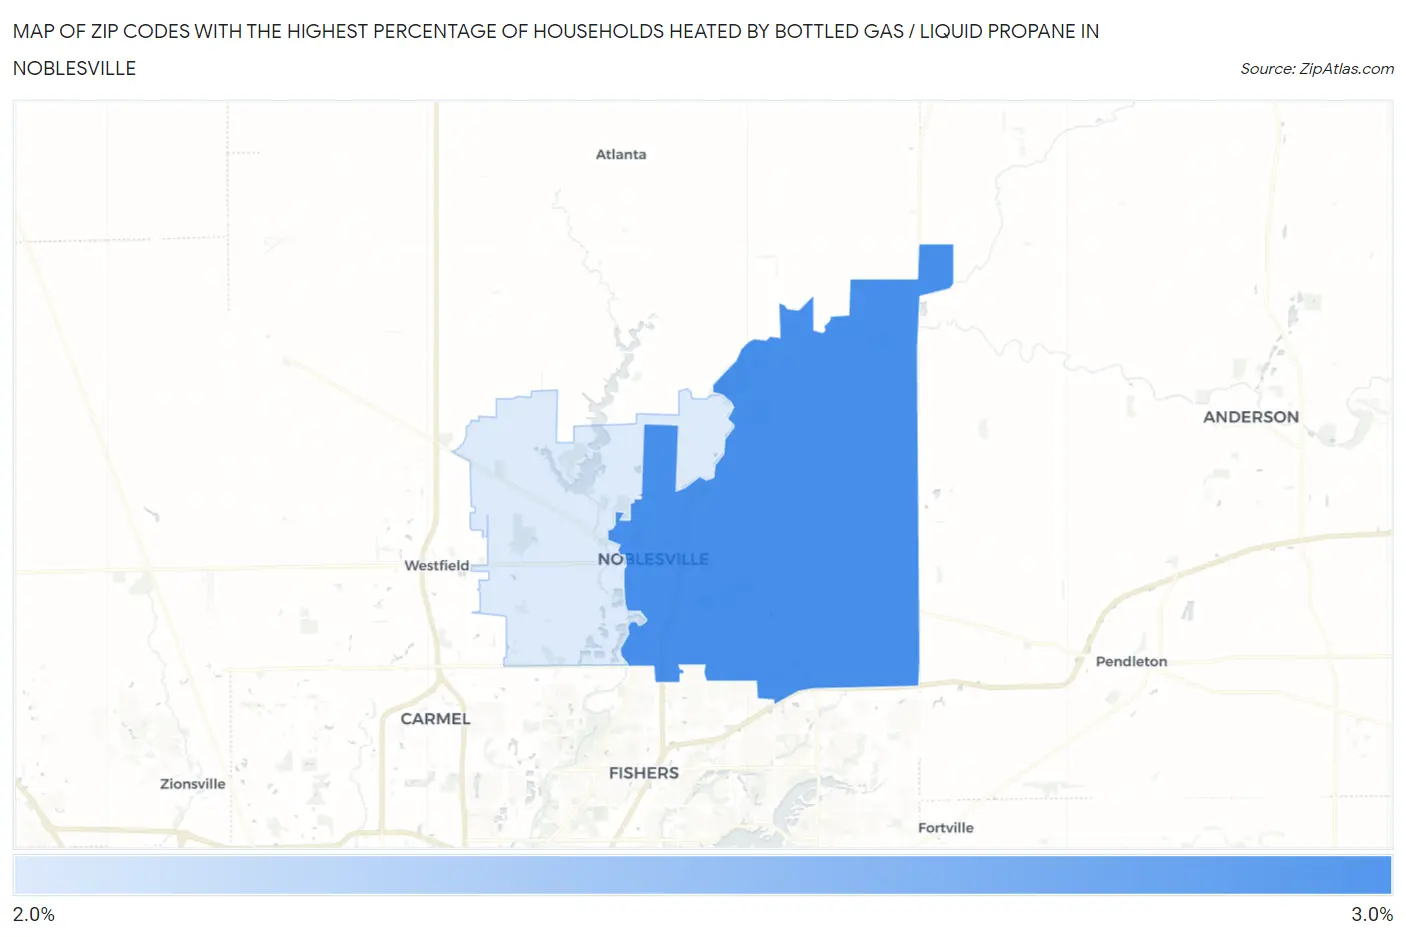
Map of Zip Codes with the Highest Percentage of Households Heated by Bottled Gas / Liquid Propane in Noblesville
2.2%
2.8%
Zip Codes with the Highest Percentage of Households Heated by Bottled Gas / Liquid Propane in Noblesville, IN
| Zip Code | Bottled Gas / LP Heating | vs State | vs National | |
| 1. | 46060 | 2.8% | 7.3%(-4.50)#574 | 4.9%(-2.10)#21,321 |
| 2. | 46062 | 2.2% | 7.3%(-5.10)#599 | 4.9%(-2.70)#22,600 |
1
Common Questions
What are the Top Zip Codes with the Highest Percentage of Households Heated by Bottled Gas / Liquid Propane in Noblesville, IN?
Top Zip Codes with the Highest Percentage of Households Heated by Bottled Gas / Liquid Propane in Noblesville, IN are:
What zip code has the Highest Percentage of Households Heated by Bottled Gas / Liquid Propane in Noblesville, IN?
46060 has the Highest Percentage of Households Heated by Bottled Gas / Liquid Propane in Noblesville, IN with 2.8%.
What is the Percentage of Households Heated by Bottled Gas / Liquid Propane in Noblesville, IN?
Percentage of Households Heated by Bottled Gas / Liquid Propane in Noblesville is 0.80%.
What is the Percentage of Households Heated by Bottled Gas / Liquid Propane in Indiana?
Percentage of Households Heated by Bottled Gas / Liquid Propane in Indiana is 7.3%.
What is the Percentage of Households Heated by Bottled Gas / Liquid Propane in the United States?
Percentage of Households Heated by Bottled Gas / Liquid Propane in the United States is 4.9%.