Macedonian vs French Canadian College, Under 1 year
COMPARE
Macedonian
French Canadian
College, Under 1 year
College, Under 1 year Comparison
Macedonians
French Canadians
67.6%
COLLEGE, UNDER 1 YEAR
95.7/ 100
METRIC RATING
112th/ 347
METRIC RANK
64.2%
COLLEGE, UNDER 1 YEAR
16.3/ 100
METRIC RATING
201st/ 347
METRIC RANK
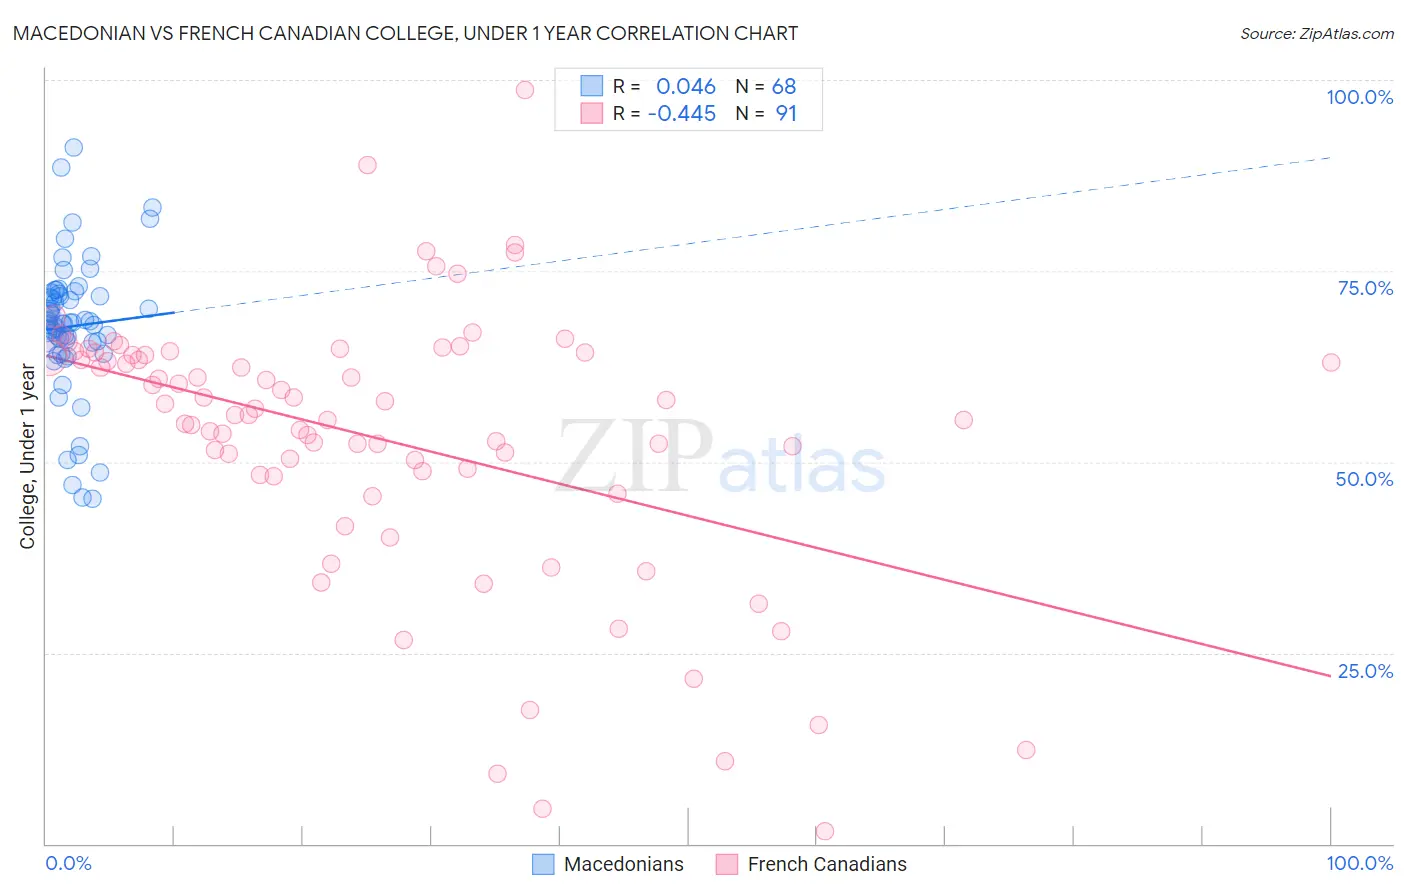
Macedonian vs French Canadian College, Under 1 year Correlation Chart
The statistical analysis conducted on geographies consisting of 132,646,607 people shows no correlation between the proportion of Macedonians and percentage of population with at least college, under 1 year education in the United States with a correlation coefficient (R) of 0.046 and weighted average of 67.6%. Similarly, the statistical analysis conducted on geographies consisting of 502,676,235 people shows a moderate negative correlation between the proportion of French Canadians and percentage of population with at least college, under 1 year education in the United States with a correlation coefficient (R) of -0.445 and weighted average of 64.2%, a difference of 5.3%.
College, Under 1 year Correlation Summary
| Measurement | Macedonian | French Canadian |
| Minimum | 45.2% | 1.7% |
| Maximum | 91.1% | 98.8% |
| Range | 45.9% | 97.1% |
| Mean | 67.7% | 53.0% |
| Median | 68.1% | 56.2% |
| Interquartile 25% (IQ1) | 65.6% | 48.3% |
| Interquartile 75% (IQ3) | 71.8% | 64.1% |
| Interquartile Range (IQR) | 6.2% | 15.8% |
| Standard Deviation (Sample) | 8.9% | 17.8% |
| Standard Deviation (Population) | 8.8% | 17.7% |
Similar Demographics by College, Under 1 year
Demographics Similar to Macedonians by College, Under 1 year
In terms of college, under 1 year, the demographic groups most similar to Macedonians are Scandinavian (67.7%, a difference of 0.020%), Assyrian/Chaldean/Syriac (67.7%, a difference of 0.020%), Ukrainian (67.7%, a difference of 0.020%), Syrian (67.6%, a difference of 0.030%), and Immigrants from Egypt (67.7%, a difference of 0.080%).
| Demographics | Rating | Rank | College, Under 1 year |
| Afghans | 96.6 /100 | #105 | Exceptional 67.8% |
| Immigrants | Croatia | 96.6 /100 | #106 | Exceptional 67.8% |
| Austrians | 96.4 /100 | #107 | Exceptional 67.8% |
| Immigrants | Egypt | 96.0 /100 | #108 | Exceptional 67.7% |
| Scandinavians | 95.8 /100 | #109 | Exceptional 67.7% |
| Assyrians/Chaldeans/Syriacs | 95.8 /100 | #110 | Exceptional 67.7% |
| Ukrainians | 95.8 /100 | #111 | Exceptional 67.7% |
| Macedonians | 95.7 /100 | #112 | Exceptional 67.6% |
| Syrians | 95.6 /100 | #113 | Exceptional 67.6% |
| Chileans | 95.3 /100 | #114 | Exceptional 67.6% |
| Basques | 95.2 /100 | #115 | Exceptional 67.6% |
| Immigrants | Nepal | 94.9 /100 | #116 | Exceptional 67.5% |
| Pakistanis | 94.8 /100 | #117 | Exceptional 67.5% |
| Immigrants | Ukraine | 94.7 /100 | #118 | Exceptional 67.5% |
| Lebanese | 94.6 /100 | #119 | Exceptional 67.5% |
Demographics Similar to French Canadians by College, Under 1 year
In terms of college, under 1 year, the demographic groups most similar to French Canadians are South American (64.2%, a difference of 0.010%), Nigerian (64.3%, a difference of 0.040%), Uruguayan (64.2%, a difference of 0.050%), Panamanian (64.3%, a difference of 0.060%), and Tsimshian (64.3%, a difference of 0.13%).
| Demographics | Rating | Rank | College, Under 1 year |
| Immigrants | Cameroon | 24.6 /100 | #194 | Fair 64.6% |
| Immigrants | South Eastern Asia | 22.1 /100 | #195 | Fair 64.5% |
| Tongans | 21.2 /100 | #196 | Fair 64.5% |
| Costa Ricans | 19.6 /100 | #197 | Poor 64.4% |
| Tsimshian | 17.9 /100 | #198 | Poor 64.3% |
| Panamanians | 17.0 /100 | #199 | Poor 64.3% |
| Nigerians | 16.7 /100 | #200 | Poor 64.3% |
| French Canadians | 16.3 /100 | #201 | Poor 64.2% |
| South Americans | 16.2 /100 | #202 | Poor 64.2% |
| Uruguayans | 15.6 /100 | #203 | Poor 64.2% |
| Immigrants | Zaire | 14.6 /100 | #204 | Poor 64.1% |
| Peruvians | 13.7 /100 | #205 | Poor 64.1% |
| Whites/Caucasians | 12.8 /100 | #206 | Poor 64.0% |
| Colombians | 12.4 /100 | #207 | Poor 64.0% |
| Immigrants | Vietnam | 12.1 /100 | #208 | Poor 64.0% |