Macedonian vs German College, Under 1 year
COMPARE
Macedonian
German
College, Under 1 year
College, Under 1 year Comparison
Macedonians
Germans
67.6%
COLLEGE, UNDER 1 YEAR
95.7/ 100
METRIC RATING
112th/ 347
METRIC RANK
65.6%
COLLEGE, UNDER 1 YEAR
55.7/ 100
METRIC RATING
170th/ 347
METRIC RANK
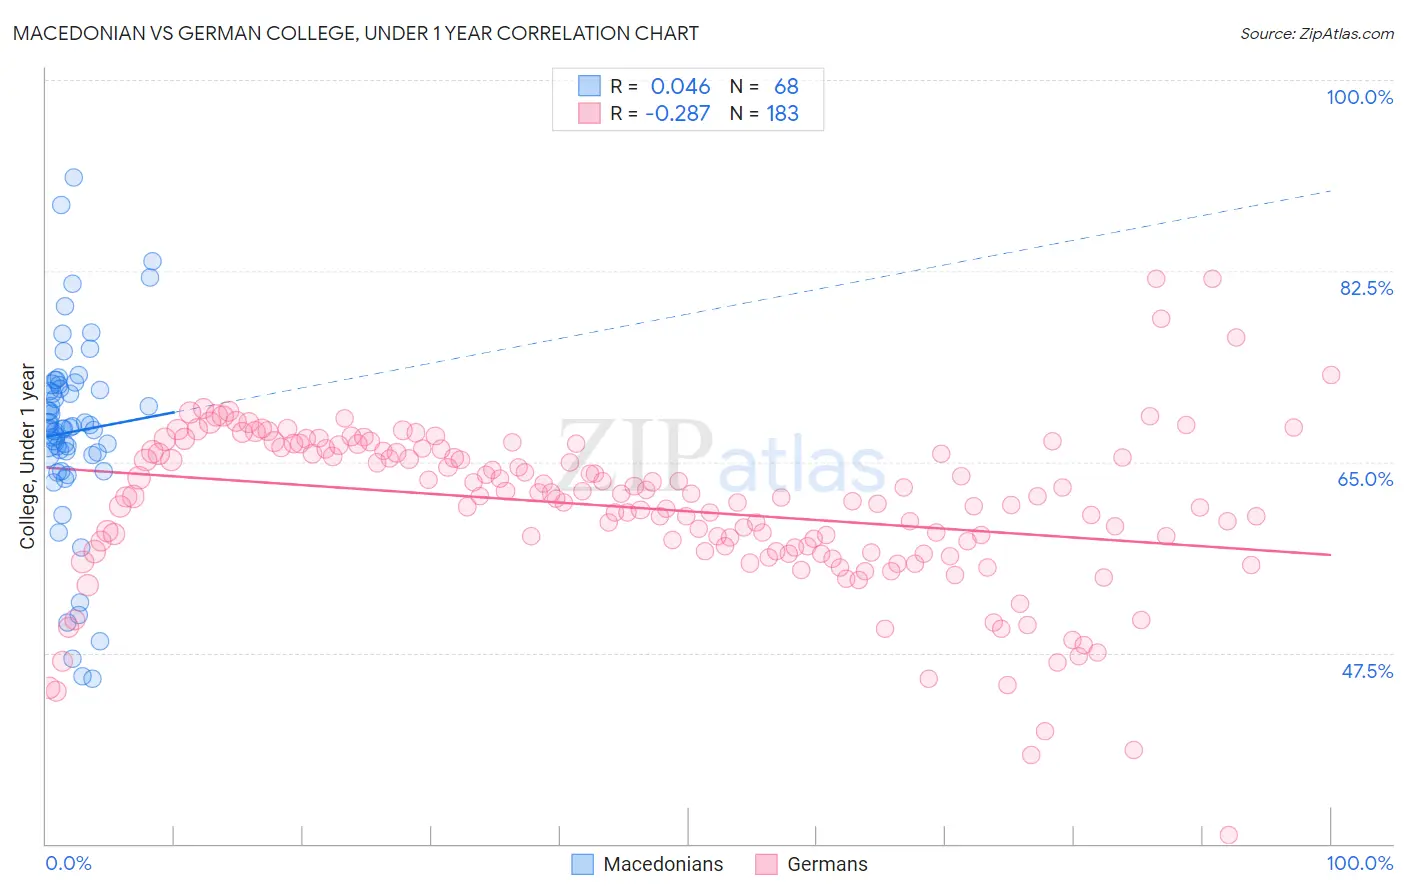
Macedonian vs German College, Under 1 year Correlation Chart
The statistical analysis conducted on geographies consisting of 132,646,607 people shows no correlation between the proportion of Macedonians and percentage of population with at least college, under 1 year education in the United States with a correlation coefficient (R) of 0.046 and weighted average of 67.6%. Similarly, the statistical analysis conducted on geographies consisting of 581,283,713 people shows a weak negative correlation between the proportion of Germans and percentage of population with at least college, under 1 year education in the United States with a correlation coefficient (R) of -0.287 and weighted average of 65.6%, a difference of 3.2%.
College, Under 1 year Correlation Summary
| Measurement | Macedonian | German |
| Minimum | 45.2% | 30.8% |
| Maximum | 91.1% | 81.8% |
| Range | 45.9% | 51.0% |
| Mean | 67.7% | 60.8% |
| Median | 68.1% | 61.8% |
| Interquartile 25% (IQ1) | 65.6% | 56.8% |
| Interquartile 75% (IQ3) | 71.8% | 66.1% |
| Interquartile Range (IQR) | 6.2% | 9.4% |
| Standard Deviation (Sample) | 8.9% | 7.5% |
| Standard Deviation (Population) | 8.8% | 7.5% |
Similar Demographics by College, Under 1 year
Demographics Similar to Macedonians by College, Under 1 year
In terms of college, under 1 year, the demographic groups most similar to Macedonians are Scandinavian (67.7%, a difference of 0.020%), Assyrian/Chaldean/Syriac (67.7%, a difference of 0.020%), Ukrainian (67.7%, a difference of 0.020%), Syrian (67.6%, a difference of 0.030%), and Immigrants from Egypt (67.7%, a difference of 0.080%).
| Demographics | Rating | Rank | College, Under 1 year |
| Afghans | 96.6 /100 | #105 | Exceptional 67.8% |
| Immigrants | Croatia | 96.6 /100 | #106 | Exceptional 67.8% |
| Austrians | 96.4 /100 | #107 | Exceptional 67.8% |
| Immigrants | Egypt | 96.0 /100 | #108 | Exceptional 67.7% |
| Scandinavians | 95.8 /100 | #109 | Exceptional 67.7% |
| Assyrians/Chaldeans/Syriacs | 95.8 /100 | #110 | Exceptional 67.7% |
| Ukrainians | 95.8 /100 | #111 | Exceptional 67.7% |
| Macedonians | 95.7 /100 | #112 | Exceptional 67.6% |
| Syrians | 95.6 /100 | #113 | Exceptional 67.6% |
| Chileans | 95.3 /100 | #114 | Exceptional 67.6% |
| Basques | 95.2 /100 | #115 | Exceptional 67.6% |
| Immigrants | Nepal | 94.9 /100 | #116 | Exceptional 67.5% |
| Pakistanis | 94.8 /100 | #117 | Exceptional 67.5% |
| Immigrants | Ukraine | 94.7 /100 | #118 | Exceptional 67.5% |
| Lebanese | 94.6 /100 | #119 | Exceptional 67.5% |
Demographics Similar to Germans by College, Under 1 year
In terms of college, under 1 year, the demographic groups most similar to Germans are Yugoslavian (65.6%, a difference of 0.0%), Hungarian (65.6%, a difference of 0.010%), Immigrants from Somalia (65.6%, a difference of 0.030%), Immigrants from Oceania (65.6%, a difference of 0.030%), and Moroccan (65.6%, a difference of 0.040%).
| Demographics | Rating | Rank | College, Under 1 year |
| Somalis | 62.7 /100 | #163 | Good 65.8% |
| Czechoslovakians | 62.6 /100 | #164 | Good 65.8% |
| Immigrants | Uzbekistan | 61.6 /100 | #165 | Good 65.8% |
| Moroccans | 56.7 /100 | #166 | Average 65.6% |
| Immigrants | Somalia | 56.4 /100 | #167 | Average 65.6% |
| Hungarians | 55.9 /100 | #168 | Average 65.6% |
| Yugoslavians | 55.7 /100 | #169 | Average 65.6% |
| Germans | 55.7 /100 | #170 | Average 65.6% |
| Immigrants | Oceania | 55.0 /100 | #171 | Average 65.6% |
| South American Indians | 54.4 /100 | #172 | Average 65.5% |
| Swiss | 53.9 /100 | #173 | Average 65.5% |
| Immigrants | Bosnia and Herzegovina | 50.0 /100 | #174 | Average 65.4% |
| Scotch-Irish | 49.5 /100 | #175 | Average 65.4% |
| French | 48.9 /100 | #176 | Average 65.4% |
| Immigrants | North Macedonia | 48.6 /100 | #177 | Average 65.4% |