Macedonian vs Potawatomi College, Under 1 year
COMPARE
Macedonian
Potawatomi
College, Under 1 year
College, Under 1 year Comparison
Macedonians
Potawatomi
67.6%
COLLEGE, UNDER 1 YEAR
95.7/ 100
METRIC RATING
112th/ 347
METRIC RANK
61.8%
COLLEGE, UNDER 1 YEAR
0.6/ 100
METRIC RATING
248th/ 347
METRIC RANK
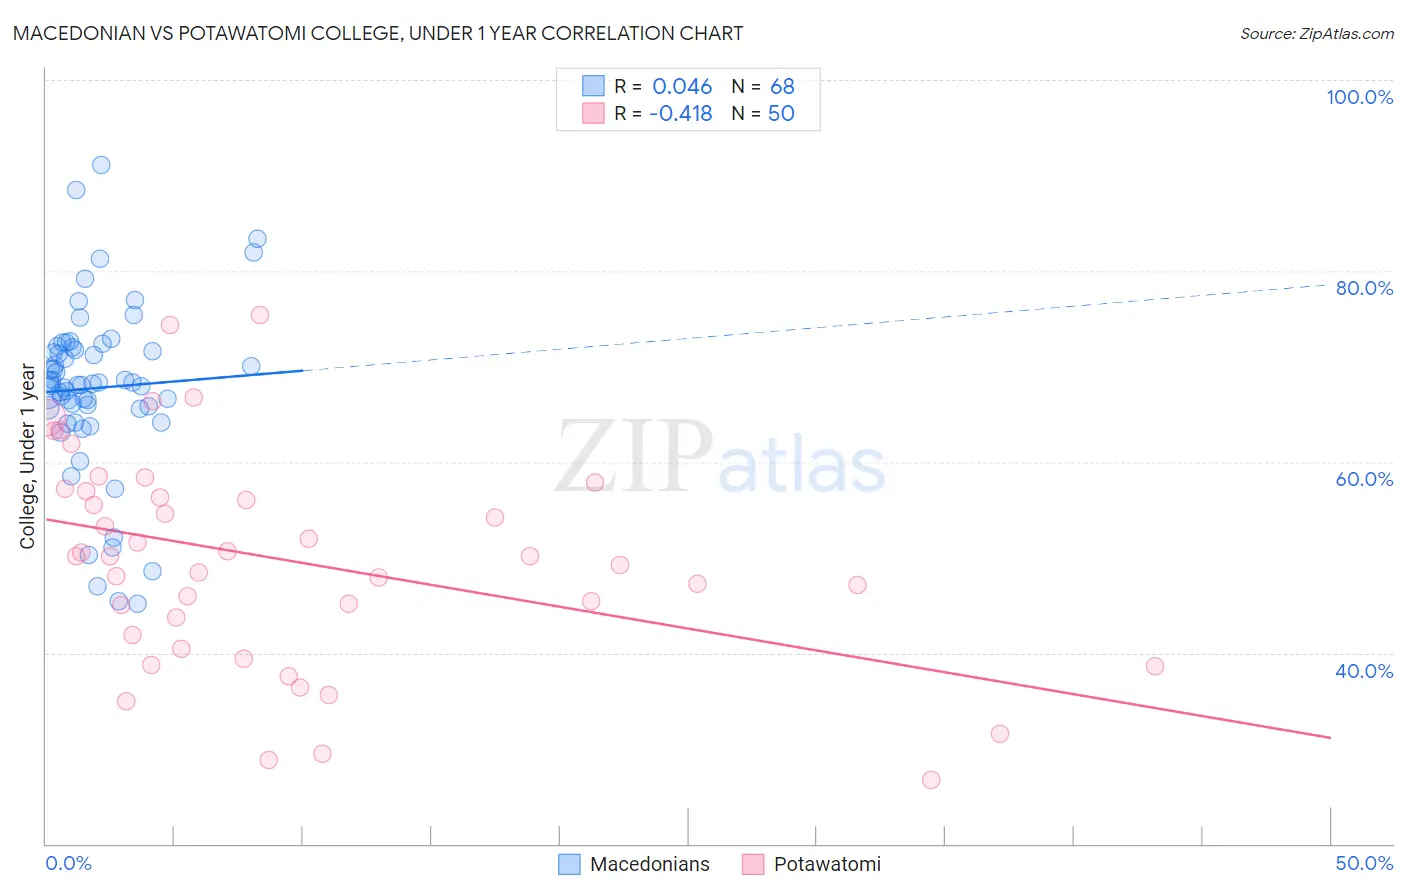
Macedonian vs Potawatomi College, Under 1 year Correlation Chart
The statistical analysis conducted on geographies consisting of 132,646,607 people shows no correlation between the proportion of Macedonians and percentage of population with at least college, under 1 year education in the United States with a correlation coefficient (R) of 0.046 and weighted average of 67.6%. Similarly, the statistical analysis conducted on geographies consisting of 117,773,444 people shows a moderate negative correlation between the proportion of Potawatomi and percentage of population with at least college, under 1 year education in the United States with a correlation coefficient (R) of -0.418 and weighted average of 61.8%, a difference of 9.5%.
College, Under 1 year Correlation Summary
| Measurement | Macedonian | Potawatomi |
| Minimum | 45.2% | 26.7% |
| Maximum | 91.1% | 75.4% |
| Range | 45.9% | 48.7% |
| Mean | 67.7% | 49.6% |
| Median | 68.1% | 50.1% |
| Interquartile 25% (IQ1) | 65.6% | 41.9% |
| Interquartile 75% (IQ3) | 71.8% | 56.9% |
| Interquartile Range (IQR) | 6.2% | 15.0% |
| Standard Deviation (Sample) | 8.9% | 11.2% |
| Standard Deviation (Population) | 8.8% | 11.1% |
Similar Demographics by College, Under 1 year
Demographics Similar to Macedonians by College, Under 1 year
In terms of college, under 1 year, the demographic groups most similar to Macedonians are Scandinavian (67.7%, a difference of 0.020%), Assyrian/Chaldean/Syriac (67.7%, a difference of 0.020%), Ukrainian (67.7%, a difference of 0.020%), Syrian (67.6%, a difference of 0.030%), and Immigrants from Egypt (67.7%, a difference of 0.080%).
| Demographics | Rating | Rank | College, Under 1 year |
| Afghans | 96.6 /100 | #105 | Exceptional 67.8% |
| Immigrants | Croatia | 96.6 /100 | #106 | Exceptional 67.8% |
| Austrians | 96.4 /100 | #107 | Exceptional 67.8% |
| Immigrants | Egypt | 96.0 /100 | #108 | Exceptional 67.7% |
| Scandinavians | 95.8 /100 | #109 | Exceptional 67.7% |
| Assyrians/Chaldeans/Syriacs | 95.8 /100 | #110 | Exceptional 67.7% |
| Ukrainians | 95.8 /100 | #111 | Exceptional 67.7% |
| Macedonians | 95.7 /100 | #112 | Exceptional 67.6% |
| Syrians | 95.6 /100 | #113 | Exceptional 67.6% |
| Chileans | 95.3 /100 | #114 | Exceptional 67.6% |
| Basques | 95.2 /100 | #115 | Exceptional 67.6% |
| Immigrants | Nepal | 94.9 /100 | #116 | Exceptional 67.5% |
| Pakistanis | 94.8 /100 | #117 | Exceptional 67.5% |
| Immigrants | Ukraine | 94.7 /100 | #118 | Exceptional 67.5% |
| Lebanese | 94.6 /100 | #119 | Exceptional 67.5% |
Demographics Similar to Potawatomi by College, Under 1 year
In terms of college, under 1 year, the demographic groups most similar to Potawatomi are Vietnamese (61.7%, a difference of 0.16%), Immigrants from Congo (61.7%, a difference of 0.16%), Immigrants from Liberia (61.9%, a difference of 0.23%), Marshallese (61.9%, a difference of 0.26%), and Immigrants from Micronesia (61.5%, a difference of 0.35%).
| Demographics | Rating | Rank | College, Under 1 year |
| Ottawa | 1.1 /100 | #241 | Tragic 62.2% |
| Malaysians | 1.1 /100 | #242 | Tragic 62.2% |
| Hawaiians | 1.1 /100 | #243 | Tragic 62.1% |
| Colville | 1.0 /100 | #244 | Tragic 62.1% |
| Delaware | 0.9 /100 | #245 | Tragic 62.1% |
| Marshallese | 0.8 /100 | #246 | Tragic 61.9% |
| Immigrants | Liberia | 0.8 /100 | #247 | Tragic 61.9% |
| Potawatomi | 0.6 /100 | #248 | Tragic 61.8% |
| Vietnamese | 0.5 /100 | #249 | Tragic 61.7% |
| Immigrants | Congo | 0.5 /100 | #250 | Tragic 61.7% |
| Immigrants | Micronesia | 0.5 /100 | #251 | Tragic 61.5% |
| West Indians | 0.4 /100 | #252 | Tragic 61.5% |
| Japanese | 0.4 /100 | #253 | Tragic 61.5% |
| Immigrants | Cambodia | 0.4 /100 | #254 | Tragic 61.5% |
| Comanche | 0.4 /100 | #255 | Tragic 61.4% |