Macedonian vs Turkish College, Under 1 year
COMPARE
Macedonian
Turkish
College, Under 1 year
College, Under 1 year Comparison
Macedonians
Turks
67.6%
COLLEGE, UNDER 1 YEAR
95.7/ 100
METRIC RATING
112th/ 347
METRIC RANK
70.7%
COLLEGE, UNDER 1 YEAR
99.9/ 100
METRIC RATING
32nd/ 347
METRIC RANK
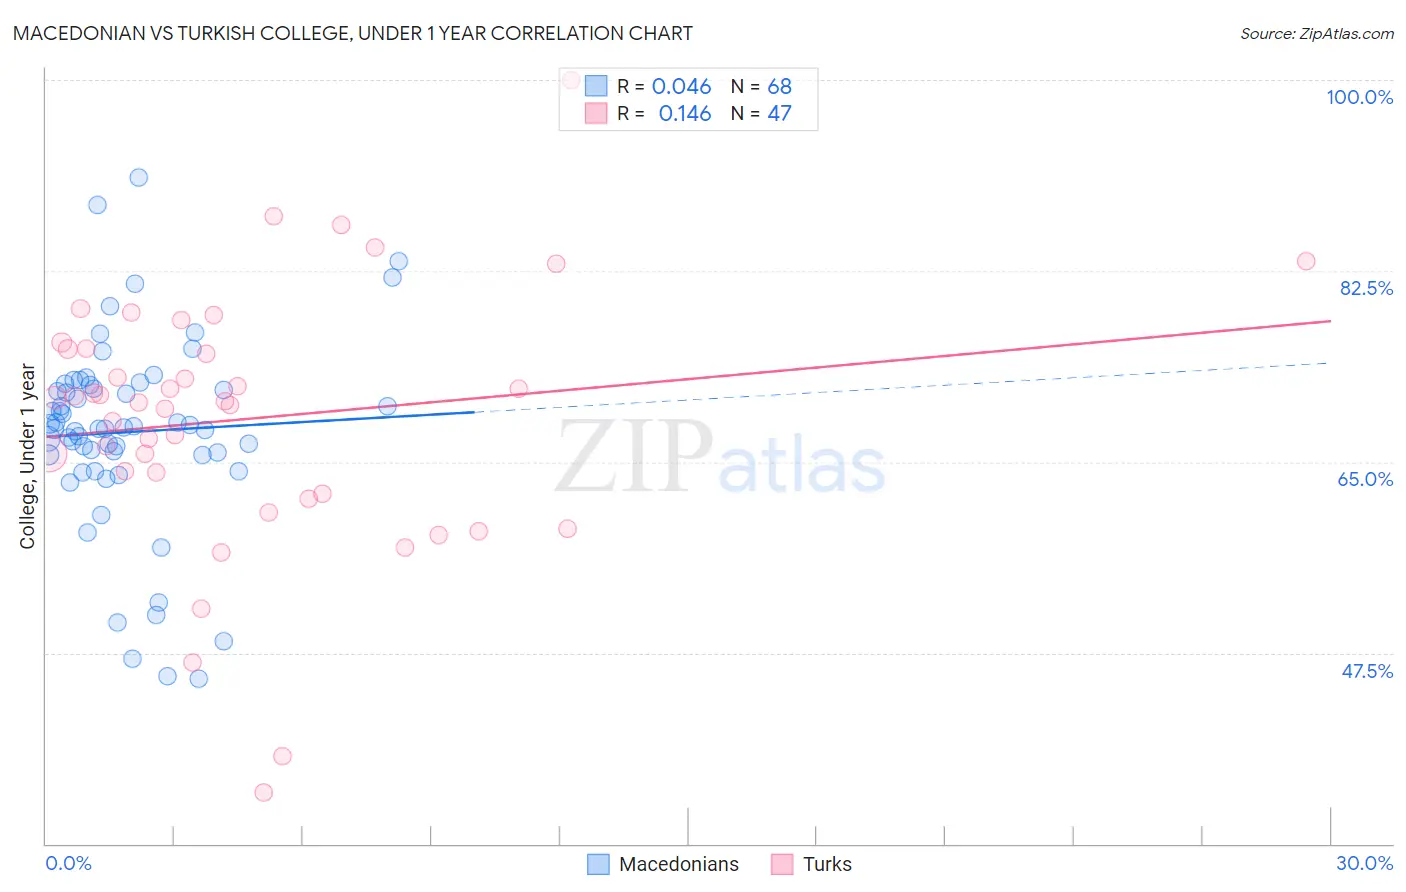
Macedonian vs Turkish College, Under 1 year Correlation Chart
The statistical analysis conducted on geographies consisting of 132,646,607 people shows no correlation between the proportion of Macedonians and percentage of population with at least college, under 1 year education in the United States with a correlation coefficient (R) of 0.046 and weighted average of 67.6%. Similarly, the statistical analysis conducted on geographies consisting of 271,864,133 people shows a poor positive correlation between the proportion of Turks and percentage of population with at least college, under 1 year education in the United States with a correlation coefficient (R) of 0.146 and weighted average of 70.7%, a difference of 4.5%.
College, Under 1 year Correlation Summary
| Measurement | Macedonian | Turkish |
| Minimum | 45.2% | 34.7% |
| Maximum | 91.1% | 100.0% |
| Range | 45.9% | 65.3% |
| Mean | 67.7% | 69.0% |
| Median | 68.1% | 70.5% |
| Interquartile 25% (IQ1) | 65.6% | 62.0% |
| Interquartile 75% (IQ3) | 71.8% | 75.3% |
| Interquartile Range (IQR) | 6.2% | 13.3% |
| Standard Deviation (Sample) | 8.9% | 12.1% |
| Standard Deviation (Population) | 8.8% | 11.9% |
Similar Demographics by College, Under 1 year
Demographics Similar to Macedonians by College, Under 1 year
In terms of college, under 1 year, the demographic groups most similar to Macedonians are Scandinavian (67.7%, a difference of 0.020%), Assyrian/Chaldean/Syriac (67.7%, a difference of 0.020%), Ukrainian (67.7%, a difference of 0.020%), Syrian (67.6%, a difference of 0.030%), and Immigrants from Egypt (67.7%, a difference of 0.080%).
| Demographics | Rating | Rank | College, Under 1 year |
| Afghans | 96.6 /100 | #105 | Exceptional 67.8% |
| Immigrants | Croatia | 96.6 /100 | #106 | Exceptional 67.8% |
| Austrians | 96.4 /100 | #107 | Exceptional 67.8% |
| Immigrants | Egypt | 96.0 /100 | #108 | Exceptional 67.7% |
| Scandinavians | 95.8 /100 | #109 | Exceptional 67.7% |
| Assyrians/Chaldeans/Syriacs | 95.8 /100 | #110 | Exceptional 67.7% |
| Ukrainians | 95.8 /100 | #111 | Exceptional 67.7% |
| Macedonians | 95.7 /100 | #112 | Exceptional 67.6% |
| Syrians | 95.6 /100 | #113 | Exceptional 67.6% |
| Chileans | 95.3 /100 | #114 | Exceptional 67.6% |
| Basques | 95.2 /100 | #115 | Exceptional 67.6% |
| Immigrants | Nepal | 94.9 /100 | #116 | Exceptional 67.5% |
| Pakistanis | 94.8 /100 | #117 | Exceptional 67.5% |
| Immigrants | Ukraine | 94.7 /100 | #118 | Exceptional 67.5% |
| Lebanese | 94.6 /100 | #119 | Exceptional 67.5% |
Demographics Similar to Turks by College, Under 1 year
In terms of college, under 1 year, the demographic groups most similar to Turks are Indian (Asian) (70.8%, a difference of 0.080%), Immigrants from South Africa (70.6%, a difference of 0.17%), Estonian (70.6%, a difference of 0.18%), Immigrants from China (70.9%, a difference of 0.19%), and Russian (70.5%, a difference of 0.27%).
| Demographics | Rating | Rank | College, Under 1 year |
| Bulgarians | 100.0 /100 | #25 | Exceptional 71.1% |
| Immigrants | Denmark | 100.0 /100 | #26 | Exceptional 71.0% |
| Immigrants | Ireland | 100.0 /100 | #27 | Exceptional 71.0% |
| Immigrants | Hong Kong | 100.0 /100 | #28 | Exceptional 71.0% |
| Immigrants | France | 100.0 /100 | #29 | Exceptional 71.0% |
| Immigrants | China | 99.9 /100 | #30 | Exceptional 70.9% |
| Indians (Asian) | 99.9 /100 | #31 | Exceptional 70.8% |
| Turks | 99.9 /100 | #32 | Exceptional 70.7% |
| Immigrants | South Africa | 99.9 /100 | #33 | Exceptional 70.6% |
| Estonians | 99.9 /100 | #34 | Exceptional 70.6% |
| Russians | 99.9 /100 | #35 | Exceptional 70.5% |
| Immigrants | Sri Lanka | 99.9 /100 | #36 | Exceptional 70.5% |
| Immigrants | Saudi Arabia | 99.9 /100 | #37 | Exceptional 70.4% |
| Australians | 99.9 /100 | #38 | Exceptional 70.4% |
| Bhutanese | 99.9 /100 | #39 | Exceptional 70.3% |