Afghan vs Cuban College, Under 1 year
COMPARE
Afghan
Cuban
College, Under 1 year
College, Under 1 year Comparison
Afghans
Cubans
67.8%
COLLEGE, UNDER 1 YEAR
96.6/ 100
METRIC RATING
105th/ 347
METRIC RANK
58.6%
COLLEGE, UNDER 1 YEAR
0.0/ 100
METRIC RATING
299th/ 347
METRIC RANK
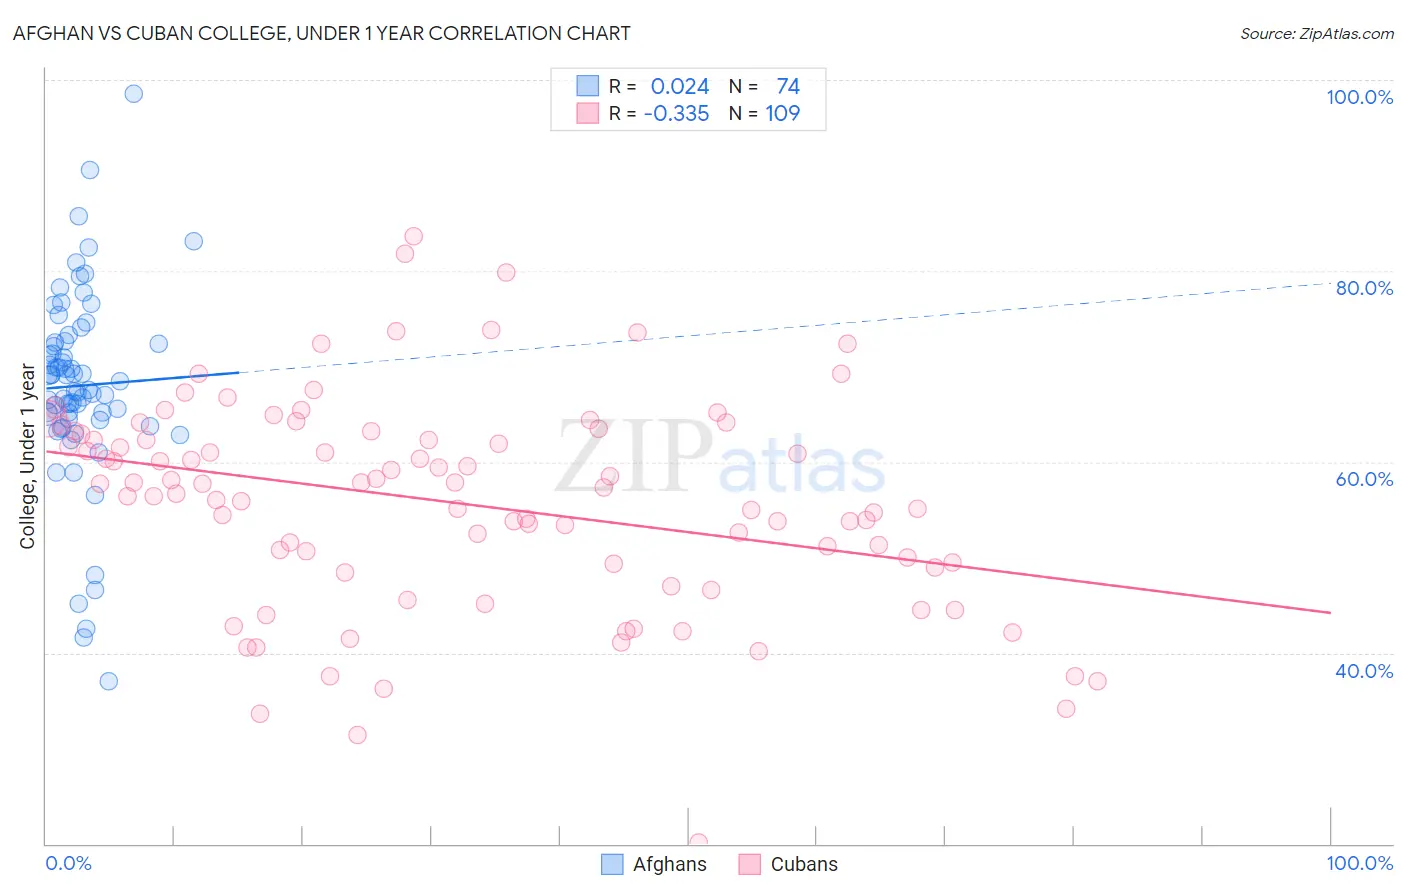
Afghan vs Cuban College, Under 1 year Correlation Chart
The statistical analysis conducted on geographies consisting of 148,874,947 people shows no correlation between the proportion of Afghans and percentage of population with at least college, under 1 year education in the United States with a correlation coefficient (R) of 0.024 and weighted average of 67.8%. Similarly, the statistical analysis conducted on geographies consisting of 449,373,028 people shows a mild negative correlation between the proportion of Cubans and percentage of population with at least college, under 1 year education in the United States with a correlation coefficient (R) of -0.335 and weighted average of 58.6%, a difference of 15.7%.
College, Under 1 year Correlation Summary
| Measurement | Afghan | Cuban |
| Minimum | 37.1% | 20.1% |
| Maximum | 98.6% | 83.6% |
| Range | 61.5% | 63.5% |
| Mean | 68.0% | 55.7% |
| Median | 68.0% | 57.3% |
| Interquartile 25% (IQ1) | 64.5% | 49.1% |
| Interquartile 75% (IQ3) | 72.5% | 63.0% |
| Interquartile Range (IQR) | 8.0% | 13.9% |
| Standard Deviation (Sample) | 10.2% | 11.1% |
| Standard Deviation (Population) | 10.2% | 11.1% |
Similar Demographics by College, Under 1 year
Demographics Similar to Afghans by College, Under 1 year
In terms of college, under 1 year, the demographic groups most similar to Afghans are Immigrants from Western Asia (67.8%, a difference of 0.0%), Immigrants from Croatia (67.8%, a difference of 0.010%), Austrian (67.8%, a difference of 0.070%), Palestinian (67.9%, a difference of 0.080%), and Carpatho Rusyn (67.9%, a difference of 0.080%).
| Demographics | Rating | Rank | College, Under 1 year |
| Paraguayans | 97.1 /100 | #98 | Exceptional 67.9% |
| Immigrants | Bolivia | 97.0 /100 | #99 | Exceptional 67.9% |
| Immigrants | Argentina | 97.0 /100 | #100 | Exceptional 67.9% |
| Immigrants | Eastern Europe | 96.9 /100 | #101 | Exceptional 67.9% |
| Palestinians | 96.9 /100 | #102 | Exceptional 67.9% |
| Carpatho Rusyns | 96.8 /100 | #103 | Exceptional 67.9% |
| Immigrants | Western Asia | 96.6 /100 | #104 | Exceptional 67.8% |
| Afghans | 96.6 /100 | #105 | Exceptional 67.8% |
| Immigrants | Croatia | 96.6 /100 | #106 | Exceptional 67.8% |
| Austrians | 96.4 /100 | #107 | Exceptional 67.8% |
| Immigrants | Egypt | 96.0 /100 | #108 | Exceptional 67.7% |
| Scandinavians | 95.8 /100 | #109 | Exceptional 67.7% |
| Assyrians/Chaldeans/Syriacs | 95.8 /100 | #110 | Exceptional 67.7% |
| Ukrainians | 95.8 /100 | #111 | Exceptional 67.7% |
| Macedonians | 95.7 /100 | #112 | Exceptional 67.6% |
Demographics Similar to Cubans by College, Under 1 year
In terms of college, under 1 year, the demographic groups most similar to Cubans are Immigrants from Ecuador (58.7%, a difference of 0.13%), Immigrants from Guyana (58.5%, a difference of 0.26%), Guyanese (59.0%, a difference of 0.63%), Central American Indian (59.0%, a difference of 0.68%), and Immigrants from Grenada (59.1%, a difference of 0.72%).
| Demographics | Rating | Rank | College, Under 1 year |
| Nicaraguans | 0.0 /100 | #292 | Tragic 59.2% |
| Seminole | 0.0 /100 | #293 | Tragic 59.1% |
| Immigrants | Belize | 0.0 /100 | #294 | Tragic 59.1% |
| Immigrants | Grenada | 0.0 /100 | #295 | Tragic 59.1% |
| Central American Indians | 0.0 /100 | #296 | Tragic 59.0% |
| Guyanese | 0.0 /100 | #297 | Tragic 59.0% |
| Immigrants | Ecuador | 0.0 /100 | #298 | Tragic 58.7% |
| Cubans | 0.0 /100 | #299 | Tragic 58.6% |
| Immigrants | Guyana | 0.0 /100 | #300 | Tragic 58.5% |
| Mexican American Indians | 0.0 /100 | #301 | Tragic 58.1% |
| Apache | 0.0 /100 | #302 | Tragic 58.0% |
| Immigrants | Dominica | 0.0 /100 | #303 | Tragic 57.9% |
| Kiowa | 0.0 /100 | #304 | Tragic 57.8% |
| Haitians | 0.0 /100 | #305 | Tragic 57.8% |
| Immigrants | Portugal | 0.0 /100 | #306 | Tragic 57.7% |