Afghan vs Immigrants from Lebanon College, Under 1 year
COMPARE
Afghan
Immigrants from Lebanon
College, Under 1 year
College, Under 1 year Comparison
Afghans
Immigrants from Lebanon
67.8%
COLLEGE, UNDER 1 YEAR
96.6/ 100
METRIC RATING
105th/ 347
METRIC RANK
68.3%
COLLEGE, UNDER 1 YEAR
98.3/ 100
METRIC RATING
86th/ 347
METRIC RANK
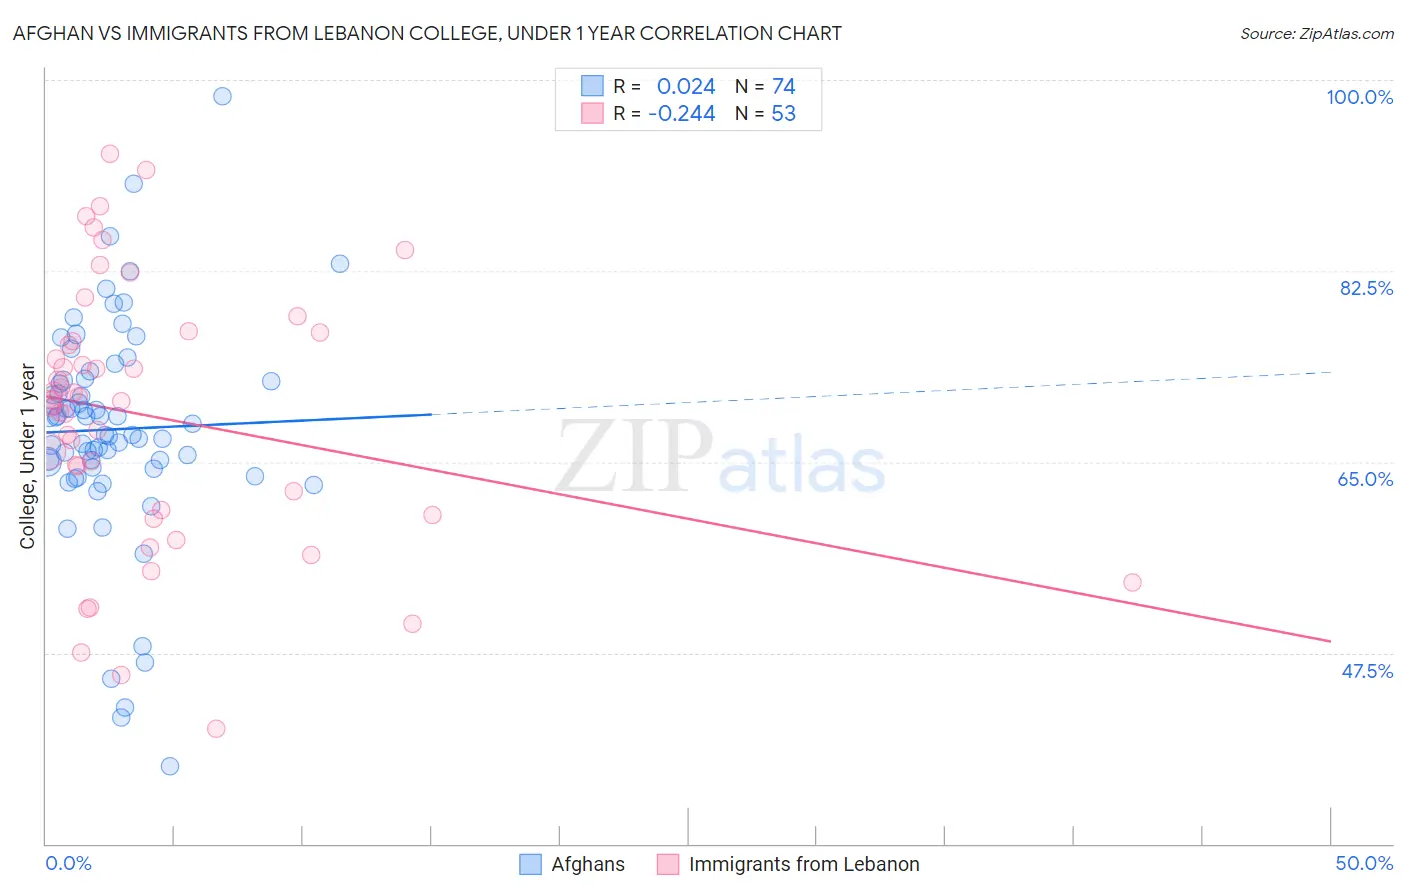
Afghan vs Immigrants from Lebanon College, Under 1 year Correlation Chart
The statistical analysis conducted on geographies consisting of 148,874,947 people shows no correlation between the proportion of Afghans and percentage of population with at least college, under 1 year education in the United States with a correlation coefficient (R) of 0.024 and weighted average of 67.8%. Similarly, the statistical analysis conducted on geographies consisting of 217,164,247 people shows a weak negative correlation between the proportion of Immigrants from Lebanon and percentage of population with at least college, under 1 year education in the United States with a correlation coefficient (R) of -0.244 and weighted average of 68.3%, a difference of 0.76%.
College, Under 1 year Correlation Summary
| Measurement | Afghan | Immigrants from Lebanon |
| Minimum | 37.1% | 40.6% |
| Maximum | 98.6% | 93.2% |
| Range | 61.5% | 52.6% |
| Mean | 68.0% | 69.2% |
| Median | 68.0% | 70.6% |
| Interquartile 25% (IQ1) | 64.5% | 60.3% |
| Interquartile 75% (IQ3) | 72.5% | 76.5% |
| Interquartile Range (IQR) | 8.0% | 16.1% |
| Standard Deviation (Sample) | 10.2% | 12.1% |
| Standard Deviation (Population) | 10.2% | 12.0% |
Demographics Similar to Afghans and Immigrants from Lebanon by College, Under 1 year
In terms of college, under 1 year, the demographic groups most similar to Afghans are Immigrants from Western Asia (67.8%, a difference of 0.0%), Palestinian (67.9%, a difference of 0.080%), Carpatho Rusyn (67.9%, a difference of 0.080%), Immigrants from Eastern Europe (67.9%, a difference of 0.090%), and Immigrants from Argentina (67.9%, a difference of 0.13%). Similarly, the demographic groups most similar to Immigrants from Lebanon are Egyptian (68.3%, a difference of 0.0%), Chinese (68.3%, a difference of 0.020%), Croatian (68.3%, a difference of 0.040%), Ethiopian (68.3%, a difference of 0.050%), and Icelander (68.3%, a difference of 0.11%).
| Demographics | Rating | Rank | College, Under 1 year |
| Egyptians | 98.3 /100 | #85 | Exceptional 68.3% |
| Immigrants | Lebanon | 98.3 /100 | #86 | Exceptional 68.3% |
| Chinese | 98.3 /100 | #87 | Exceptional 68.3% |
| Croatians | 98.2 /100 | #88 | Exceptional 68.3% |
| Ethiopians | 98.2 /100 | #89 | Exceptional 68.3% |
| Icelanders | 98.1 /100 | #90 | Exceptional 68.3% |
| Europeans | 98.1 /100 | #91 | Exceptional 68.2% |
| Luxembourgers | 98.1 /100 | #92 | Exceptional 68.2% |
| Romanians | 97.9 /100 | #93 | Exceptional 68.2% |
| Armenians | 97.7 /100 | #94 | Exceptional 68.1% |
| Immigrants | Pakistan | 97.5 /100 | #95 | Exceptional 68.0% |
| Jordanians | 97.4 /100 | #96 | Exceptional 68.0% |
| Immigrants | Ethiopia | 97.3 /100 | #97 | Exceptional 68.0% |
| Paraguayans | 97.1 /100 | #98 | Exceptional 67.9% |
| Immigrants | Bolivia | 97.0 /100 | #99 | Exceptional 67.9% |
| Immigrants | Argentina | 97.0 /100 | #100 | Exceptional 67.9% |
| Immigrants | Eastern Europe | 96.9 /100 | #101 | Exceptional 67.9% |
| Palestinians | 96.9 /100 | #102 | Exceptional 67.9% |
| Carpatho Rusyns | 96.8 /100 | #103 | Exceptional 67.9% |
| Immigrants | Western Asia | 96.6 /100 | #104 | Exceptional 67.8% |
| Afghans | 96.6 /100 | #105 | Exceptional 67.8% |