Inupiat vs Immigrants from Nigeria Male Disability
COMPARE
Inupiat
Immigrants from Nigeria
Male Disability
Male Disability Comparison
Inupiat
Immigrants from Nigeria
13.0%
MALE DISABILITY
0.0/ 100
METRIC RATING
297th/ 347
METRIC RANK
10.8%
MALE DISABILITY
95.1/ 100
METRIC RATING
104th/ 347
METRIC RANK
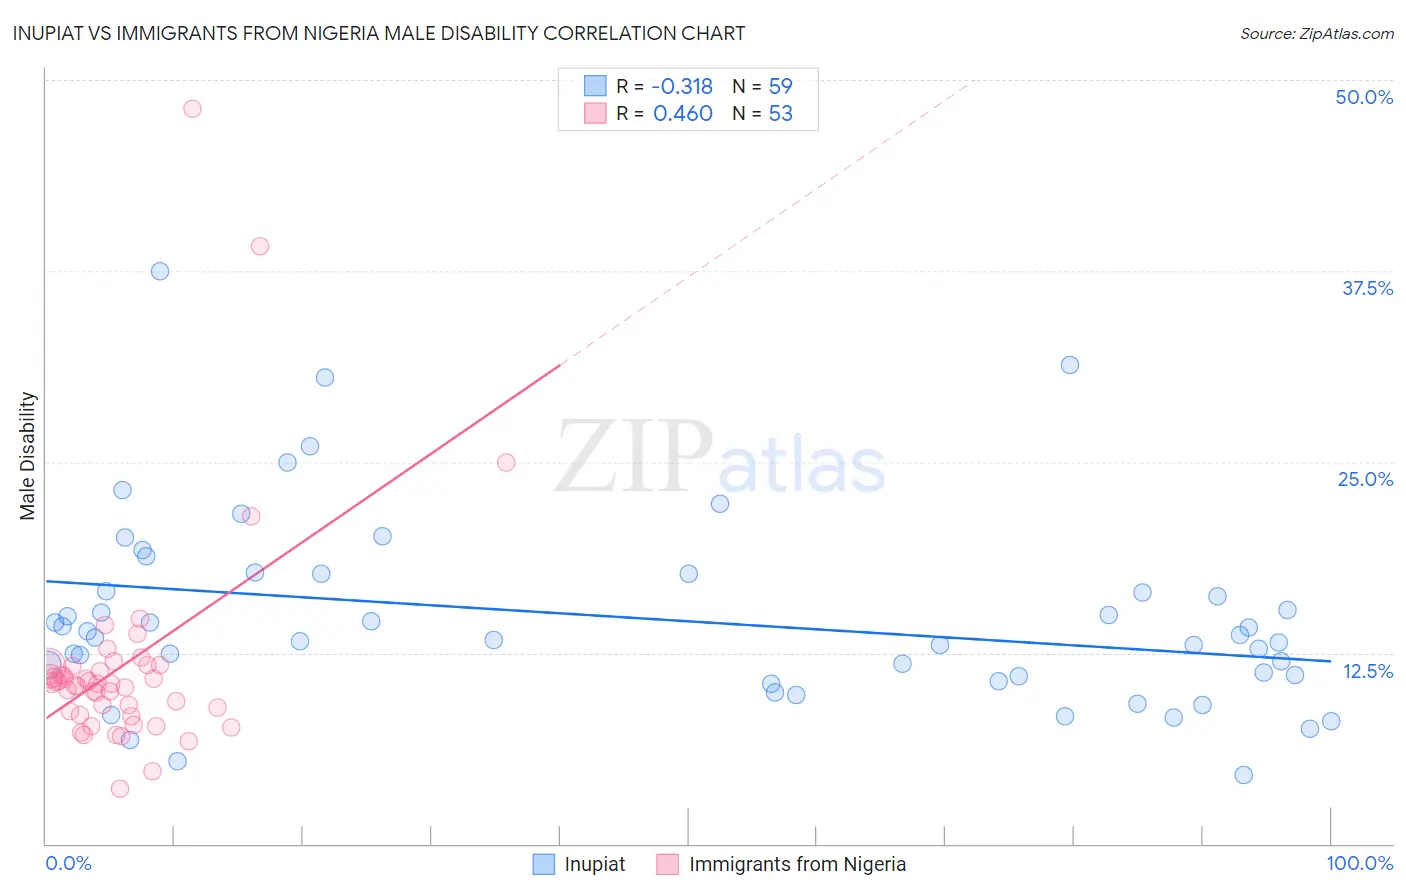
Inupiat vs Immigrants from Nigeria Male Disability Correlation Chart
The statistical analysis conducted on geographies consisting of 96,329,518 people shows a mild negative correlation between the proportion of Inupiat and percentage of males with a disability in the United States with a correlation coefficient (R) of -0.318 and weighted average of 13.0%. Similarly, the statistical analysis conducted on geographies consisting of 283,467,451 people shows a moderate positive correlation between the proportion of Immigrants from Nigeria and percentage of males with a disability in the United States with a correlation coefficient (R) of 0.460 and weighted average of 10.8%, a difference of 20.4%.
Male Disability Correlation Summary
| Measurement | Inupiat | Immigrants from Nigeria |
| Minimum | 4.5% | 3.6% |
| Maximum | 37.5% | 48.1% |
| Range | 33.0% | 44.5% |
| Mean | 14.8% | 11.7% |
| Median | 13.5% | 10.5% |
| Interquartile 25% (IQ1) | 11.0% | 8.5% |
| Interquartile 75% (IQ3) | 17.6% | 11.6% |
| Interquartile Range (IQR) | 6.7% | 3.1% |
| Standard Deviation (Sample) | 6.3% | 7.3% |
| Standard Deviation (Population) | 6.2% | 7.2% |
Similar Demographics by Male Disability
Demographics Similar to Inupiat by Male Disability
In terms of male disability, the demographic groups most similar to Inupiat are Nonimmigrants (12.9%, a difference of 0.11%), Immigrants from Micronesia (12.9%, a difference of 0.17%), Pennsylvania German (13.0%, a difference of 0.20%), Marshallese (12.9%, a difference of 0.27%), and Yaqui (12.9%, a difference of 0.51%).
| Demographics | Rating | Rank | Male Disability |
| Pima | 0.0 /100 | #290 | Tragic 12.8% |
| Whites/Caucasians | 0.0 /100 | #291 | Tragic 12.8% |
| English | 0.0 /100 | #292 | Tragic 12.8% |
| Yaqui | 0.0 /100 | #293 | Tragic 12.9% |
| Marshallese | 0.0 /100 | #294 | Tragic 12.9% |
| Immigrants | Micronesia | 0.0 /100 | #295 | Tragic 12.9% |
| Immigrants | Nonimmigrants | 0.0 /100 | #296 | Tragic 12.9% |
| Inupiat | 0.0 /100 | #297 | Tragic 13.0% |
| Pennsylvania Germans | 0.0 /100 | #298 | Tragic 13.0% |
| Celtics | 0.0 /100 | #299 | Tragic 13.0% |
| Cheyenne | 0.0 /100 | #300 | Tragic 13.0% |
| French | 0.0 /100 | #301 | Tragic 13.0% |
| Crow | 0.0 /100 | #302 | Tragic 13.1% |
| Scotch-Irish | 0.0 /100 | #303 | Tragic 13.2% |
| Blacks/African Americans | 0.0 /100 | #304 | Tragic 13.2% |
Demographics Similar to Immigrants from Nigeria by Male Disability
In terms of male disability, the demographic groups most similar to Immigrants from Nigeria are Immigrants from Brazil (10.8%, a difference of 0.010%), Uruguayan (10.7%, a difference of 0.060%), Immigrants from Syria (10.8%, a difference of 0.060%), Immigrants from Eastern Europe (10.7%, a difference of 0.080%), and Immigrants from Greece (10.7%, a difference of 0.17%).
| Demographics | Rating | Rank | Male Disability |
| Immigrants | Armenia | 96.6 /100 | #97 | Exceptional 10.7% |
| Immigrants | Romania | 96.5 /100 | #98 | Exceptional 10.7% |
| Immigrants | Switzerland | 96.1 /100 | #99 | Exceptional 10.7% |
| Immigrants | Kazakhstan | 95.9 /100 | #100 | Exceptional 10.7% |
| Immigrants | Greece | 95.6 /100 | #101 | Exceptional 10.7% |
| Immigrants | Eastern Europe | 95.3 /100 | #102 | Exceptional 10.7% |
| Uruguayans | 95.3 /100 | #103 | Exceptional 10.7% |
| Immigrants | Nigeria | 95.1 /100 | #104 | Exceptional 10.8% |
| Immigrants | Brazil | 95.0 /100 | #105 | Exceptional 10.8% |
| Immigrants | Syria | 94.9 /100 | #106 | Exceptional 10.8% |
| Immigrants | Eastern Africa | 94.3 /100 | #107 | Exceptional 10.8% |
| Immigrants | Belgium | 94.2 /100 | #108 | Exceptional 10.8% |
| Immigrants | Uganda | 94.0 /100 | #109 | Exceptional 10.8% |
| Immigrants | Immigrants | 93.9 /100 | #110 | Exceptional 10.8% |
| Immigrants | Uruguay | 93.8 /100 | #111 | Exceptional 10.8% |