Inupiat vs Immigrants from Latvia Male Disability
COMPARE
Inupiat
Immigrants from Latvia
Male Disability
Male Disability Comparison
Inupiat
Immigrants from Latvia
13.0%
MALE DISABILITY
0.0/ 100
METRIC RATING
297th/ 347
METRIC RANK
10.9%
MALE DISABILITY
85.5/ 100
METRIC RATING
128th/ 347
METRIC RANK
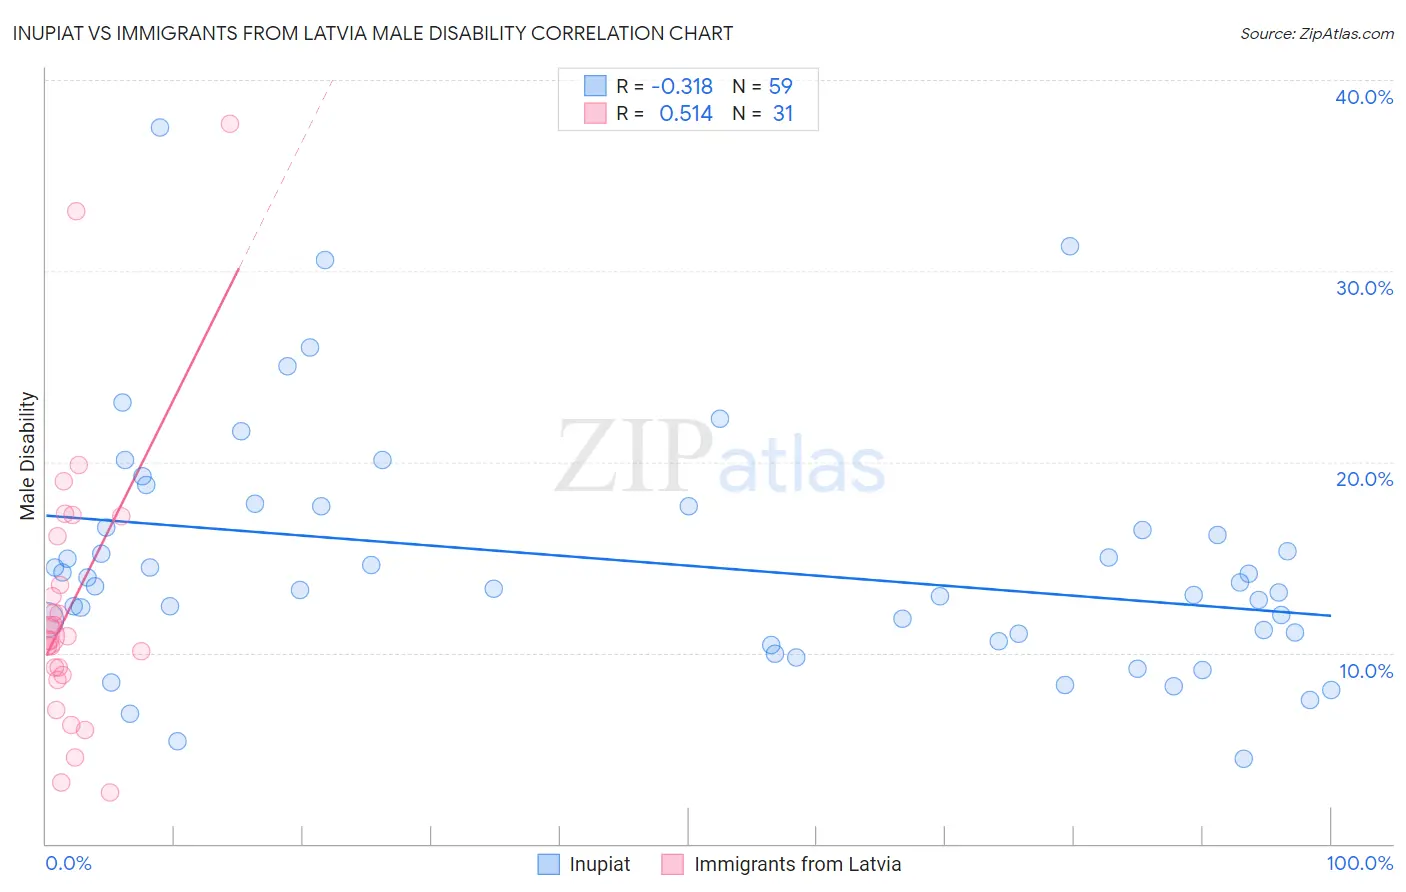
Inupiat vs Immigrants from Latvia Male Disability Correlation Chart
The statistical analysis conducted on geographies consisting of 96,329,518 people shows a mild negative correlation between the proportion of Inupiat and percentage of males with a disability in the United States with a correlation coefficient (R) of -0.318 and weighted average of 13.0%. Similarly, the statistical analysis conducted on geographies consisting of 113,739,259 people shows a substantial positive correlation between the proportion of Immigrants from Latvia and percentage of males with a disability in the United States with a correlation coefficient (R) of 0.514 and weighted average of 10.9%, a difference of 18.4%.
Male Disability Correlation Summary
| Measurement | Inupiat | Immigrants from Latvia |
| Minimum | 4.5% | 2.7% |
| Maximum | 37.5% | 37.7% |
| Range | 33.0% | 35.1% |
| Mean | 14.8% | 12.6% |
| Median | 13.5% | 10.8% |
| Interquartile 25% (IQ1) | 11.0% | 8.9% |
| Interquartile 75% (IQ3) | 17.6% | 16.1% |
| Interquartile Range (IQR) | 6.7% | 7.2% |
| Standard Deviation (Sample) | 6.3% | 7.5% |
| Standard Deviation (Population) | 6.2% | 7.4% |
Similar Demographics by Male Disability
Demographics Similar to Inupiat by Male Disability
In terms of male disability, the demographic groups most similar to Inupiat are Nonimmigrants (12.9%, a difference of 0.11%), Immigrants from Micronesia (12.9%, a difference of 0.17%), Pennsylvania German (13.0%, a difference of 0.20%), Marshallese (12.9%, a difference of 0.27%), and Yaqui (12.9%, a difference of 0.51%).
| Demographics | Rating | Rank | Male Disability |
| Pima | 0.0 /100 | #290 | Tragic 12.8% |
| Whites/Caucasians | 0.0 /100 | #291 | Tragic 12.8% |
| English | 0.0 /100 | #292 | Tragic 12.8% |
| Yaqui | 0.0 /100 | #293 | Tragic 12.9% |
| Marshallese | 0.0 /100 | #294 | Tragic 12.9% |
| Immigrants | Micronesia | 0.0 /100 | #295 | Tragic 12.9% |
| Immigrants | Nonimmigrants | 0.0 /100 | #296 | Tragic 12.9% |
| Inupiat | 0.0 /100 | #297 | Tragic 13.0% |
| Pennsylvania Germans | 0.0 /100 | #298 | Tragic 13.0% |
| Celtics | 0.0 /100 | #299 | Tragic 13.0% |
| Cheyenne | 0.0 /100 | #300 | Tragic 13.0% |
| French | 0.0 /100 | #301 | Tragic 13.0% |
| Crow | 0.0 /100 | #302 | Tragic 13.1% |
| Scotch-Irish | 0.0 /100 | #303 | Tragic 13.2% |
| Blacks/African Americans | 0.0 /100 | #304 | Tragic 13.2% |
Demographics Similar to Immigrants from Latvia by Male Disability
In terms of male disability, the demographic groups most similar to Immigrants from Latvia are Immigrants from Philippines (10.9%, a difference of 0.0%), Brazilian (10.9%, a difference of 0.0%), Macedonian (11.0%, a difference of 0.14%), Immigrants from Ukraine (10.9%, a difference of 0.16%), and Immigrants from Fiji (11.0%, a difference of 0.16%).
| Demographics | Rating | Rank | Male Disability |
| Immigrants | South Eastern Asia | 89.2 /100 | #121 | Excellent 10.9% |
| Immigrants | Ghana | 89.0 /100 | #122 | Excellent 10.9% |
| Immigrants | Czechoslovakia | 88.4 /100 | #123 | Excellent 10.9% |
| South American Indians | 88.1 /100 | #124 | Excellent 10.9% |
| Immigrants | North Macedonia | 88.1 /100 | #125 | Excellent 10.9% |
| Immigrants | Trinidad and Tobago | 86.9 /100 | #126 | Excellent 10.9% |
| Immigrants | Ukraine | 86.8 /100 | #127 | Excellent 10.9% |
| Immigrants | Latvia | 85.5 /100 | #128 | Excellent 10.9% |
| Immigrants | Philippines | 85.4 /100 | #129 | Excellent 10.9% |
| Brazilians | 85.4 /100 | #130 | Excellent 10.9% |
| Macedonians | 84.2 /100 | #131 | Excellent 11.0% |
| Immigrants | Fiji | 84.0 /100 | #132 | Excellent 11.0% |
| Ugandans | 83.9 /100 | #133 | Excellent 11.0% |
| Bhutanese | 83.4 /100 | #134 | Excellent 11.0% |
| Trinidadians and Tobagonians | 83.3 /100 | #135 | Excellent 11.0% |