American vs Belgian Male Disability
COMPARE
American
Belgian
Male Disability
Male Disability Comparison
Americans
Belgians
13.8%
MALE DISABILITY
0.0/ 100
METRIC RATING
319th/ 347
METRIC RANK
12.1%
MALE DISABILITY
0.3/ 100
METRIC RATING
259th/ 347
METRIC RANK
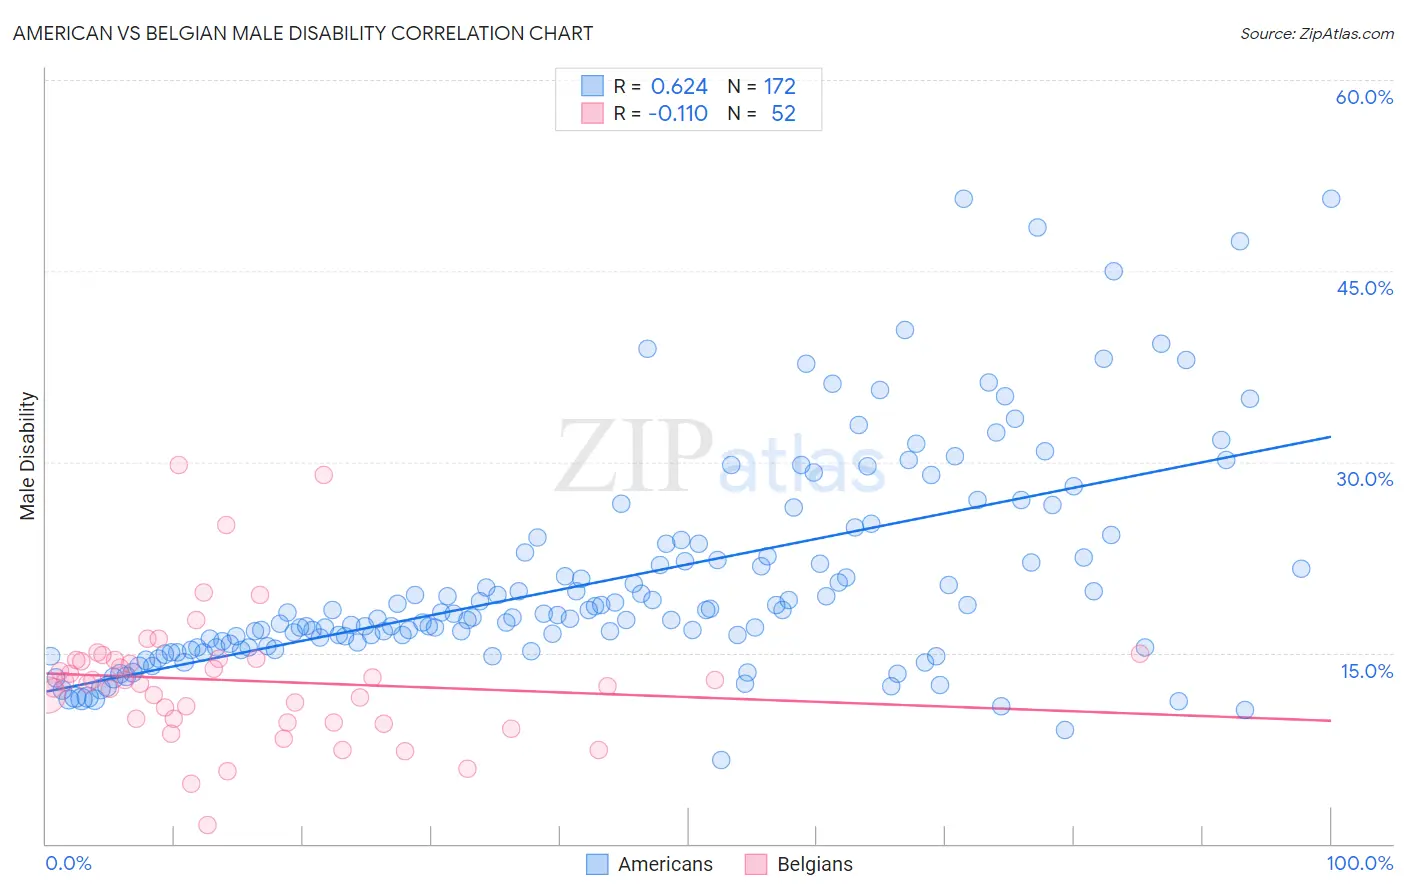
American vs Belgian Male Disability Correlation Chart
The statistical analysis conducted on geographies consisting of 581,581,297 people shows a significant positive correlation between the proportion of Americans and percentage of males with a disability in the United States with a correlation coefficient (R) of 0.624 and weighted average of 13.8%. Similarly, the statistical analysis conducted on geographies consisting of 355,990,096 people shows a poor negative correlation between the proportion of Belgians and percentage of males with a disability in the United States with a correlation coefficient (R) of -0.110 and weighted average of 12.1%, a difference of 13.6%.
Male Disability Correlation Summary
| Measurement | American | Belgian |
| Minimum | 6.6% | 1.4% |
| Maximum | 50.7% | 29.8% |
| Range | 44.1% | 28.3% |
| Mean | 20.7% | 12.8% |
| Median | 18.0% | 12.7% |
| Interquartile 25% (IQ1) | 15.4% | 9.7% |
| Interquartile 75% (IQ3) | 23.2% | 14.5% |
| Interquartile Range (IQR) | 7.8% | 4.8% |
| Standard Deviation (Sample) | 8.4% | 5.2% |
| Standard Deviation (Population) | 8.4% | 5.1% |
Similar Demographics by Male Disability
Demographics Similar to Americans by Male Disability
In terms of male disability, the demographic groups most similar to Americans are Cree (13.7%, a difference of 0.41%), Tlingit-Haida (13.8%, a difference of 0.49%), Shoshone (13.8%, a difference of 0.54%), Paiute (13.7%, a difference of 0.62%), and Alaska Native (13.6%, a difference of 1.4%).
| Demographics | Rating | Rank | Male Disability |
| Yakama | 0.0 /100 | #312 | Tragic 13.5% |
| Puget Sound Salish | 0.0 /100 | #313 | Tragic 13.5% |
| Aleuts | 0.0 /100 | #314 | Tragic 13.5% |
| Iroquois | 0.0 /100 | #315 | Tragic 13.6% |
| Alaska Natives | 0.0 /100 | #316 | Tragic 13.6% |
| Paiute | 0.0 /100 | #317 | Tragic 13.7% |
| Cree | 0.0 /100 | #318 | Tragic 13.7% |
| Americans | 0.0 /100 | #319 | Tragic 13.8% |
| Tlingit-Haida | 0.0 /100 | #320 | Tragic 13.8% |
| Shoshone | 0.0 /100 | #321 | Tragic 13.8% |
| Apache | 0.0 /100 | #322 | Tragic 14.0% |
| Osage | 0.0 /100 | #323 | Tragic 14.0% |
| Comanche | 0.0 /100 | #324 | Tragic 14.1% |
| Ottawa | 0.0 /100 | #325 | Tragic 14.1% |
| Natives/Alaskans | 0.0 /100 | #326 | Tragic 14.2% |
Demographics Similar to Belgians by Male Disability
In terms of male disability, the demographic groups most similar to Belgians are Basque (12.1%, a difference of 0.040%), Swedish (12.1%, a difference of 0.070%), Swiss (12.1%, a difference of 0.24%), European (12.1%, a difference of 0.24%), and Slavic (12.2%, a difference of 0.43%).
| Demographics | Rating | Rank | Male Disability |
| Slovenes | 0.5 /100 | #252 | Tragic 12.0% |
| Guamanians/Chamorros | 0.5 /100 | #253 | Tragic 12.0% |
| British | 0.4 /100 | #254 | Tragic 12.1% |
| Chinese | 0.4 /100 | #255 | Tragic 12.1% |
| Swiss | 0.3 /100 | #256 | Tragic 12.1% |
| Europeans | 0.3 /100 | #257 | Tragic 12.1% |
| Basques | 0.3 /100 | #258 | Tragic 12.1% |
| Belgians | 0.3 /100 | #259 | Tragic 12.1% |
| Swedes | 0.3 /100 | #260 | Tragic 12.1% |
| Slavs | 0.2 /100 | #261 | Tragic 12.2% |
| Norwegians | 0.2 /100 | #262 | Tragic 12.2% |
| Canadians | 0.2 /100 | #263 | Tragic 12.2% |
| Nepalese | 0.2 /100 | #264 | Tragic 12.2% |
| Immigrants | Portugal | 0.1 /100 | #265 | Tragic 12.3% |
| Hawaiians | 0.1 /100 | #266 | Tragic 12.3% |