American vs Immigrants from North Macedonia Male Disability
COMPARE
American
Immigrants from North Macedonia
Male Disability
Male Disability Comparison
Americans
Immigrants from North Macedonia
13.8%
MALE DISABILITY
0.0/ 100
METRIC RATING
319th/ 347
METRIC RANK
10.9%
MALE DISABILITY
88.1/ 100
METRIC RATING
125th/ 347
METRIC RANK
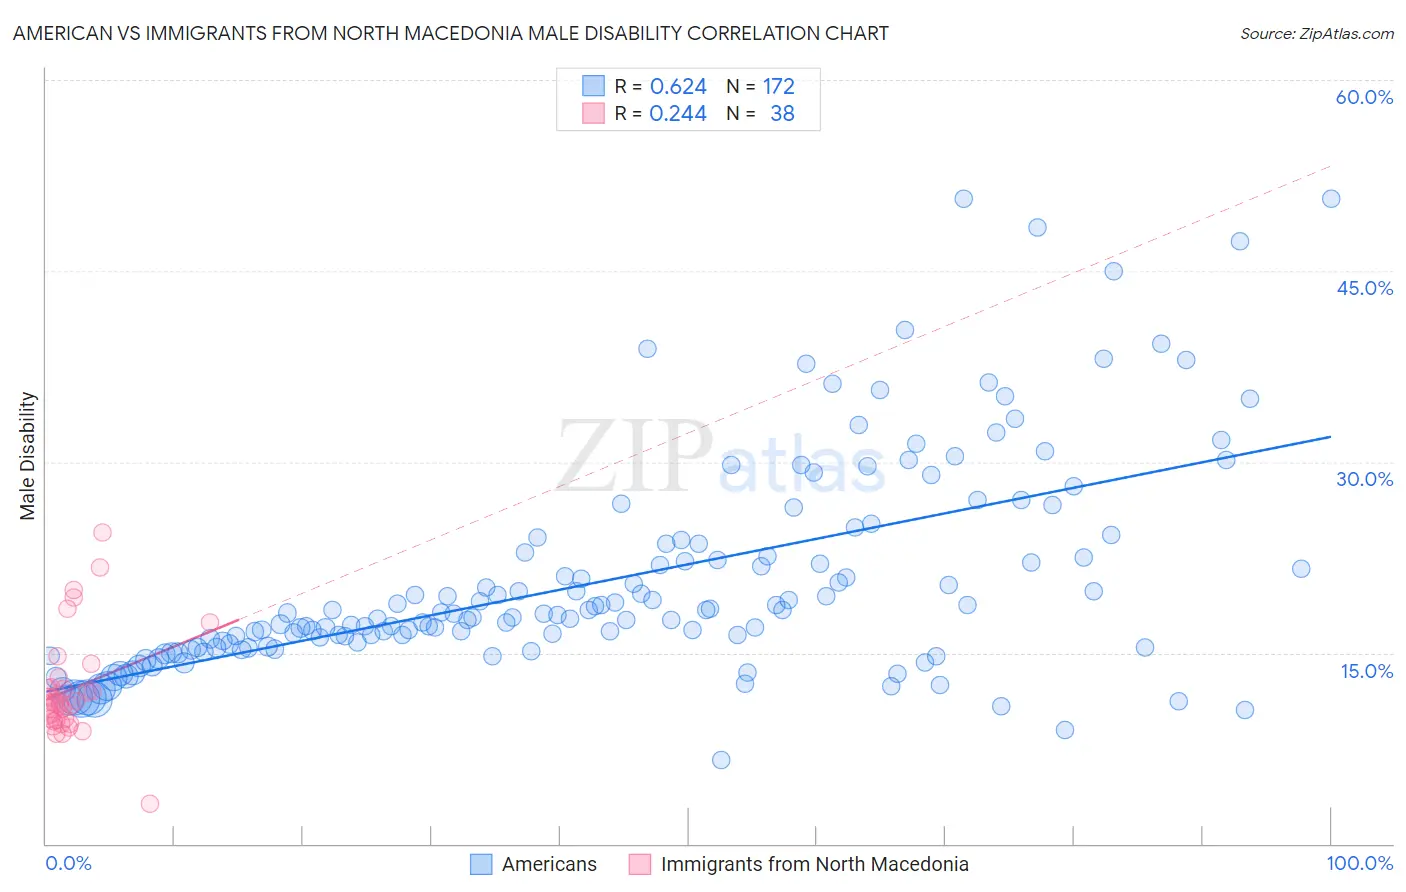
American vs Immigrants from North Macedonia Male Disability Correlation Chart
The statistical analysis conducted on geographies consisting of 581,581,297 people shows a significant positive correlation between the proportion of Americans and percentage of males with a disability in the United States with a correlation coefficient (R) of 0.624 and weighted average of 13.8%. Similarly, the statistical analysis conducted on geographies consisting of 74,317,186 people shows a weak positive correlation between the proportion of Immigrants from North Macedonia and percentage of males with a disability in the United States with a correlation coefficient (R) of 0.244 and weighted average of 10.9%, a difference of 26.3%.
Male Disability Correlation Summary
| Measurement | American | Immigrants from North Macedonia |
| Minimum | 6.6% | 3.1% |
| Maximum | 50.7% | 24.4% |
| Range | 44.1% | 21.3% |
| Mean | 20.7% | 12.1% |
| Median | 18.0% | 11.1% |
| Interquartile 25% (IQ1) | 15.4% | 9.7% |
| Interquartile 75% (IQ3) | 23.2% | 12.3% |
| Interquartile Range (IQR) | 7.8% | 2.6% |
| Standard Deviation (Sample) | 8.4% | 4.1% |
| Standard Deviation (Population) | 8.4% | 4.1% |
Similar Demographics by Male Disability
Demographics Similar to Americans by Male Disability
In terms of male disability, the demographic groups most similar to Americans are Cree (13.7%, a difference of 0.41%), Tlingit-Haida (13.8%, a difference of 0.49%), Shoshone (13.8%, a difference of 0.54%), Paiute (13.7%, a difference of 0.62%), and Alaska Native (13.6%, a difference of 1.4%).
| Demographics | Rating | Rank | Male Disability |
| Yakama | 0.0 /100 | #312 | Tragic 13.5% |
| Puget Sound Salish | 0.0 /100 | #313 | Tragic 13.5% |
| Aleuts | 0.0 /100 | #314 | Tragic 13.5% |
| Iroquois | 0.0 /100 | #315 | Tragic 13.6% |
| Alaska Natives | 0.0 /100 | #316 | Tragic 13.6% |
| Paiute | 0.0 /100 | #317 | Tragic 13.7% |
| Cree | 0.0 /100 | #318 | Tragic 13.7% |
| Americans | 0.0 /100 | #319 | Tragic 13.8% |
| Tlingit-Haida | 0.0 /100 | #320 | Tragic 13.8% |
| Shoshone | 0.0 /100 | #321 | Tragic 13.8% |
| Apache | 0.0 /100 | #322 | Tragic 14.0% |
| Osage | 0.0 /100 | #323 | Tragic 14.0% |
| Comanche | 0.0 /100 | #324 | Tragic 14.1% |
| Ottawa | 0.0 /100 | #325 | Tragic 14.1% |
| Natives/Alaskans | 0.0 /100 | #326 | Tragic 14.2% |
Demographics Similar to Immigrants from North Macedonia by Male Disability
In terms of male disability, the demographic groups most similar to Immigrants from North Macedonia are South American Indian (10.9%, a difference of 0.0%), Immigrants from Czechoslovakia (10.9%, a difference of 0.040%), Immigrants from Ghana (10.9%, a difference of 0.14%), Immigrants from South Eastern Asia (10.9%, a difference of 0.15%), and Immigrants from Trinidad and Tobago (10.9%, a difference of 0.16%).
| Demographics | Rating | Rank | Male Disability |
| Immigrants | Cuba | 90.2 /100 | #118 | Exceptional 10.9% |
| Armenians | 90.1 /100 | #119 | Exceptional 10.9% |
| Immigrants | Africa | 89.4 /100 | #120 | Excellent 10.9% |
| Immigrants | South Eastern Asia | 89.2 /100 | #121 | Excellent 10.9% |
| Immigrants | Ghana | 89.0 /100 | #122 | Excellent 10.9% |
| Immigrants | Czechoslovakia | 88.4 /100 | #123 | Excellent 10.9% |
| South American Indians | 88.1 /100 | #124 | Excellent 10.9% |
| Immigrants | North Macedonia | 88.1 /100 | #125 | Excellent 10.9% |
| Immigrants | Trinidad and Tobago | 86.9 /100 | #126 | Excellent 10.9% |
| Immigrants | Ukraine | 86.8 /100 | #127 | Excellent 10.9% |
| Immigrants | Latvia | 85.5 /100 | #128 | Excellent 10.9% |
| Immigrants | Philippines | 85.4 /100 | #129 | Excellent 10.9% |
| Brazilians | 85.4 /100 | #130 | Excellent 10.9% |
| Macedonians | 84.2 /100 | #131 | Excellent 11.0% |
| Immigrants | Fiji | 84.0 /100 | #132 | Excellent 11.0% |