American vs Icelander Male Disability
COMPARE
American
Icelander
Male Disability
Male Disability Comparison
Americans
Icelanders
13.8%
MALE DISABILITY
0.0/ 100
METRIC RATING
319th/ 347
METRIC RANK
11.6%
MALE DISABILITY
10.1/ 100
METRIC RATING
208th/ 347
METRIC RANK
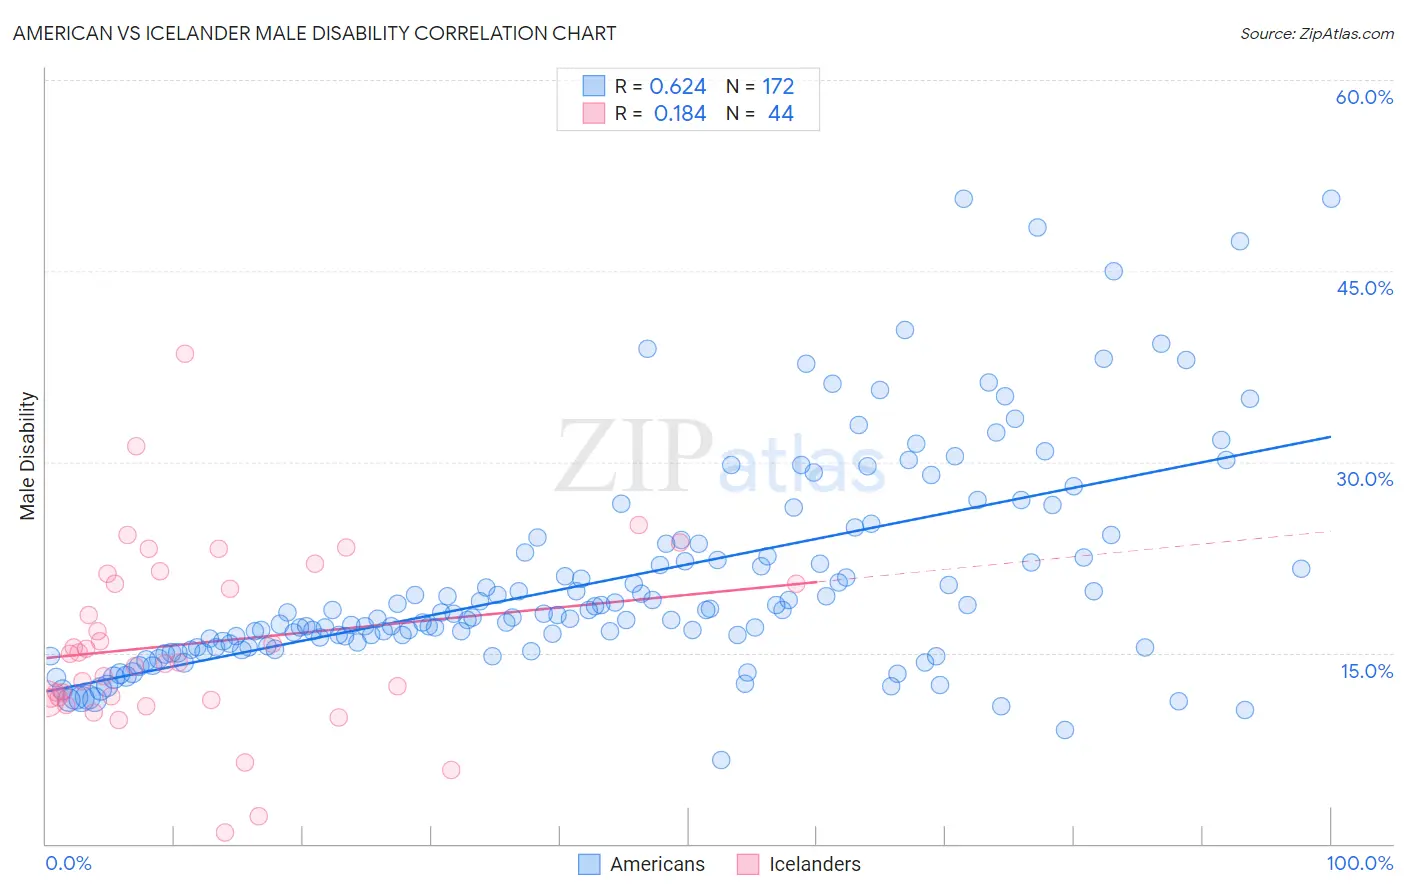
American vs Icelander Male Disability Correlation Chart
The statistical analysis conducted on geographies consisting of 581,581,297 people shows a significant positive correlation between the proportion of Americans and percentage of males with a disability in the United States with a correlation coefficient (R) of 0.624 and weighted average of 13.8%. Similarly, the statistical analysis conducted on geographies consisting of 159,644,082 people shows a poor positive correlation between the proportion of Icelanders and percentage of males with a disability in the United States with a correlation coefficient (R) of 0.184 and weighted average of 11.6%, a difference of 19.2%.
Male Disability Correlation Summary
| Measurement | American | Icelander |
| Minimum | 6.6% | 0.92% |
| Maximum | 50.7% | 38.5% |
| Range | 44.1% | 37.5% |
| Mean | 20.7% | 15.8% |
| Median | 18.0% | 14.6% |
| Interquartile 25% (IQ1) | 15.4% | 11.4% |
| Interquartile 75% (IQ3) | 23.2% | 20.8% |
| Interquartile Range (IQR) | 7.8% | 9.4% |
| Standard Deviation (Sample) | 8.4% | 7.2% |
| Standard Deviation (Population) | 8.4% | 7.1% |
Similar Demographics by Male Disability
Demographics Similar to Americans by Male Disability
In terms of male disability, the demographic groups most similar to Americans are Cree (13.7%, a difference of 0.41%), Tlingit-Haida (13.8%, a difference of 0.49%), Shoshone (13.8%, a difference of 0.54%), Paiute (13.7%, a difference of 0.62%), and Alaska Native (13.6%, a difference of 1.4%).
| Demographics | Rating | Rank | Male Disability |
| Yakama | 0.0 /100 | #312 | Tragic 13.5% |
| Puget Sound Salish | 0.0 /100 | #313 | Tragic 13.5% |
| Aleuts | 0.0 /100 | #314 | Tragic 13.5% |
| Iroquois | 0.0 /100 | #315 | Tragic 13.6% |
| Alaska Natives | 0.0 /100 | #316 | Tragic 13.6% |
| Paiute | 0.0 /100 | #317 | Tragic 13.7% |
| Cree | 0.0 /100 | #318 | Tragic 13.7% |
| Americans | 0.0 /100 | #319 | Tragic 13.8% |
| Tlingit-Haida | 0.0 /100 | #320 | Tragic 13.8% |
| Shoshone | 0.0 /100 | #321 | Tragic 13.8% |
| Apache | 0.0 /100 | #322 | Tragic 14.0% |
| Osage | 0.0 /100 | #323 | Tragic 14.0% |
| Comanche | 0.0 /100 | #324 | Tragic 14.1% |
| Ottawa | 0.0 /100 | #325 | Tragic 14.1% |
| Natives/Alaskans | 0.0 /100 | #326 | Tragic 14.2% |
Demographics Similar to Icelanders by Male Disability
In terms of male disability, the demographic groups most similar to Icelanders are Spanish American Indian (11.6%, a difference of 0.010%), Immigrants from Somalia (11.5%, a difference of 0.040%), Ukrainian (11.5%, a difference of 0.070%), Serbian (11.5%, a difference of 0.080%), and Immigrants from Cambodia (11.5%, a difference of 0.090%).
| Demographics | Rating | Rank | Male Disability |
| Immigrants | Panama | 13.0 /100 | #201 | Poor 11.5% |
| Immigrants | Mexico | 12.6 /100 | #202 | Poor 11.5% |
| Jamaicans | 10.9 /100 | #203 | Poor 11.5% |
| Immigrants | Cambodia | 10.8 /100 | #204 | Poor 11.5% |
| Serbians | 10.7 /100 | #205 | Poor 11.5% |
| Ukrainians | 10.6 /100 | #206 | Poor 11.5% |
| Immigrants | Somalia | 10.4 /100 | #207 | Poor 11.5% |
| Icelanders | 10.1 /100 | #208 | Poor 11.6% |
| Spanish American Indians | 10.1 /100 | #209 | Poor 11.6% |
| Ute | 9.4 /100 | #210 | Tragic 11.6% |
| Immigrants | Thailand | 8.4 /100 | #211 | Tragic 11.6% |
| Immigrants | Scotland | 8.2 /100 | #212 | Tragic 11.6% |
| Mexican American Indians | 7.8 /100 | #213 | Tragic 11.6% |
| Lithuanians | 6.6 /100 | #214 | Tragic 11.6% |
| Indonesians | 5.9 /100 | #215 | Tragic 11.6% |