American vs Immigrants from France Male Disability
COMPARE
American
Immigrants from France
Male Disability
Male Disability Comparison
Americans
Immigrants from France
13.8%
MALE DISABILITY
0.0/ 100
METRIC RATING
319th/ 347
METRIC RANK
10.6%
MALE DISABILITY
97.6/ 100
METRIC RATING
91st/ 347
METRIC RANK
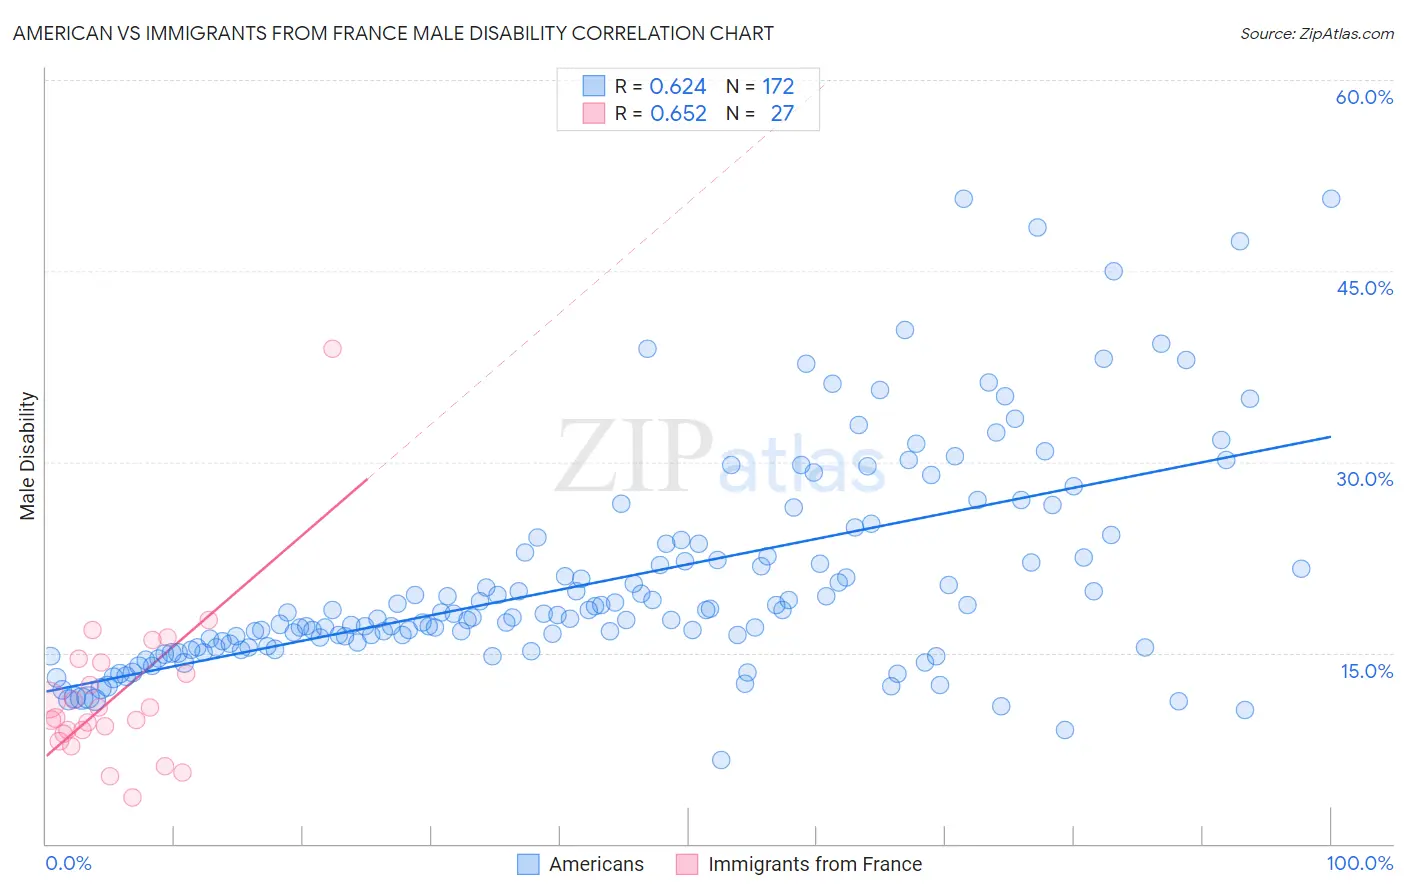
American vs Immigrants from France Male Disability Correlation Chart
The statistical analysis conducted on geographies consisting of 581,581,297 people shows a significant positive correlation between the proportion of Americans and percentage of males with a disability in the United States with a correlation coefficient (R) of 0.624 and weighted average of 13.8%. Similarly, the statistical analysis conducted on geographies consisting of 287,902,577 people shows a significant positive correlation between the proportion of Immigrants from France and percentage of males with a disability in the United States with a correlation coefficient (R) of 0.652 and weighted average of 10.6%, a difference of 29.4%.
Male Disability Correlation Summary
| Measurement | American | Immigrants from France |
| Minimum | 6.6% | 3.6% |
| Maximum | 50.7% | 38.9% |
| Range | 44.1% | 35.3% |
| Mean | 20.7% | 11.7% |
| Median | 18.0% | 9.9% |
| Interquartile 25% (IQ1) | 15.4% | 8.6% |
| Interquartile 75% (IQ3) | 23.2% | 14.2% |
| Interquartile Range (IQR) | 7.8% | 5.6% |
| Standard Deviation (Sample) | 8.4% | 6.5% |
| Standard Deviation (Population) | 8.4% | 6.4% |
Similar Demographics by Male Disability
Demographics Similar to Americans by Male Disability
In terms of male disability, the demographic groups most similar to Americans are Cree (13.7%, a difference of 0.41%), Tlingit-Haida (13.8%, a difference of 0.49%), Shoshone (13.8%, a difference of 0.54%), Paiute (13.7%, a difference of 0.62%), and Alaska Native (13.6%, a difference of 1.4%).
| Demographics | Rating | Rank | Male Disability |
| Yakama | 0.0 /100 | #312 | Tragic 13.5% |
| Puget Sound Salish | 0.0 /100 | #313 | Tragic 13.5% |
| Aleuts | 0.0 /100 | #314 | Tragic 13.5% |
| Iroquois | 0.0 /100 | #315 | Tragic 13.6% |
| Alaska Natives | 0.0 /100 | #316 | Tragic 13.6% |
| Paiute | 0.0 /100 | #317 | Tragic 13.7% |
| Cree | 0.0 /100 | #318 | Tragic 13.7% |
| Americans | 0.0 /100 | #319 | Tragic 13.8% |
| Tlingit-Haida | 0.0 /100 | #320 | Tragic 13.8% |
| Shoshone | 0.0 /100 | #321 | Tragic 13.8% |
| Apache | 0.0 /100 | #322 | Tragic 14.0% |
| Osage | 0.0 /100 | #323 | Tragic 14.0% |
| Comanche | 0.0 /100 | #324 | Tragic 14.1% |
| Ottawa | 0.0 /100 | #325 | Tragic 14.1% |
| Natives/Alaskans | 0.0 /100 | #326 | Tragic 14.2% |
Demographics Similar to Immigrants from France by Male Disability
In terms of male disability, the demographic groups most similar to Immigrants from France are Immigrants from Morocco (10.6%, a difference of 0.040%), Immigrants from Western Asia (10.6%, a difference of 0.090%), Immigrants from Nicaragua (10.6%, a difference of 0.090%), Palestinian (10.7%, a difference of 0.15%), and Immigrants from Vietnam (10.6%, a difference of 0.16%).
| Demographics | Rating | Rank | Male Disability |
| Bulgarians | 98.1 /100 | #84 | Exceptional 10.6% |
| Sri Lankans | 97.9 /100 | #85 | Exceptional 10.6% |
| Immigrants | Ireland | 97.9 /100 | #86 | Exceptional 10.6% |
| Immigrants | Vietnam | 97.9 /100 | #87 | Exceptional 10.6% |
| Immigrants | Western Asia | 97.8 /100 | #88 | Exceptional 10.6% |
| Immigrants | Nicaragua | 97.8 /100 | #89 | Exceptional 10.6% |
| Immigrants | Morocco | 97.7 /100 | #90 | Exceptional 10.6% |
| Immigrants | France | 97.6 /100 | #91 | Exceptional 10.6% |
| Palestinians | 97.4 /100 | #92 | Exceptional 10.7% |
| Immigrants | St. Vincent and the Grenadines | 97.1 /100 | #93 | Exceptional 10.7% |
| Immigrants | Sweden | 96.9 /100 | #94 | Exceptional 10.7% |
| Chileans | 96.9 /100 | #95 | Exceptional 10.7% |
| Nicaraguans | 96.6 /100 | #96 | Exceptional 10.7% |
| Immigrants | Armenia | 96.6 /100 | #97 | Exceptional 10.7% |
| Immigrants | Romania | 96.5 /100 | #98 | Exceptional 10.7% |