Alaska Native vs Czech Male Disability
COMPARE
Alaska Native
Czech
Male Disability
Male Disability Comparison
Alaska Natives
Czechs
13.6%
MALE DISABILITY
0.0/ 100
METRIC RATING
316th/ 347
METRIC RANK
11.9%
MALE DISABILITY
1.1/ 100
METRIC RATING
240th/ 347
METRIC RANK
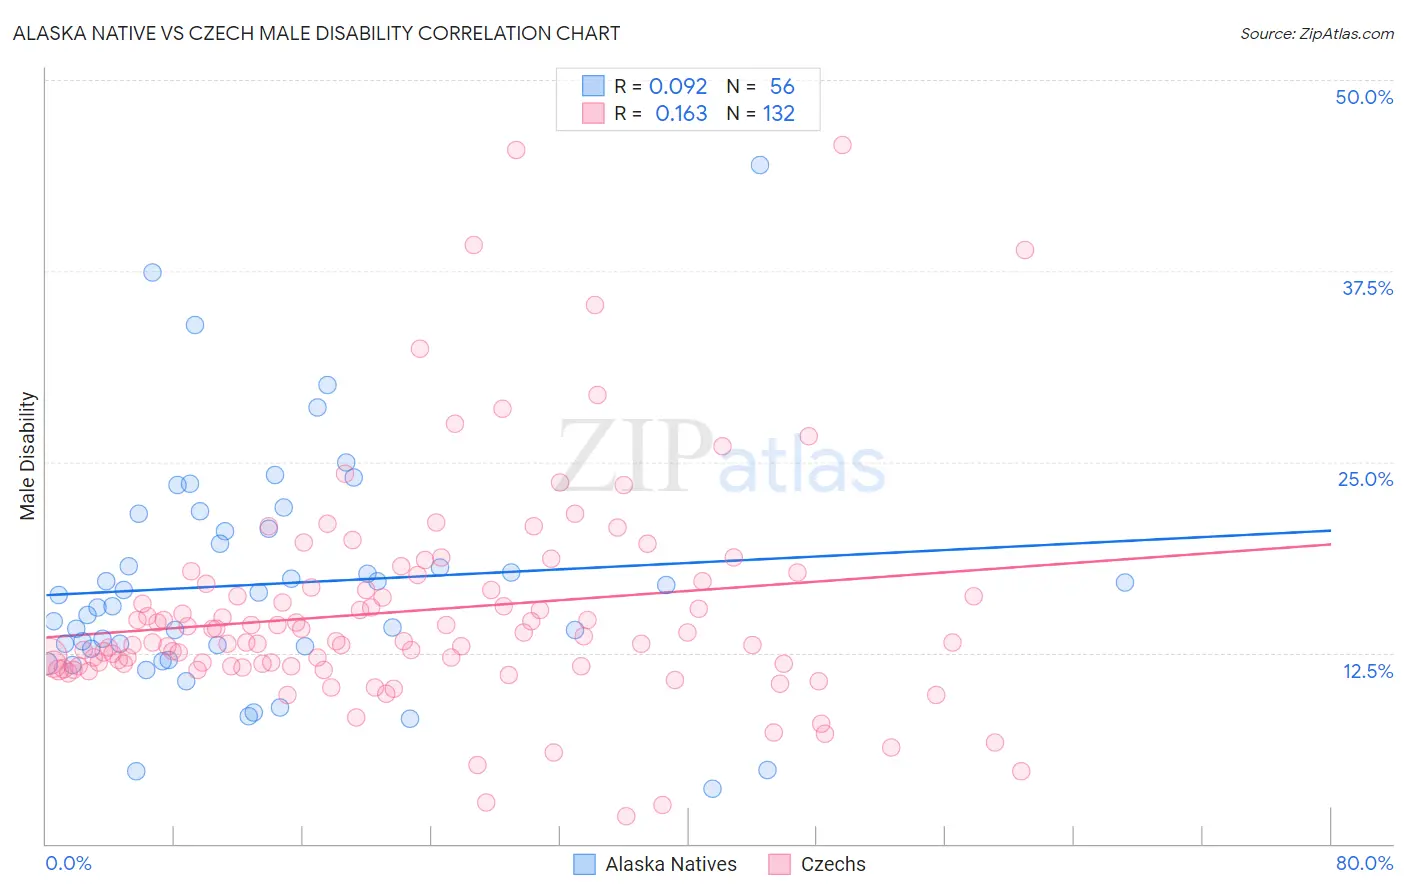
Alaska Native vs Czech Male Disability Correlation Chart
The statistical analysis conducted on geographies consisting of 76,765,214 people shows a slight positive correlation between the proportion of Alaska Natives and percentage of males with a disability in the United States with a correlation coefficient (R) of 0.092 and weighted average of 13.6%. Similarly, the statistical analysis conducted on geographies consisting of 484,720,527 people shows a poor positive correlation between the proportion of Czechs and percentage of males with a disability in the United States with a correlation coefficient (R) of 0.163 and weighted average of 11.9%, a difference of 14.0%.
Male Disability Correlation Summary
| Measurement | Alaska Native | Czech |
| Minimum | 3.6% | 1.8% |
| Maximum | 44.4% | 45.8% |
| Range | 40.8% | 44.0% |
| Mean | 17.0% | 15.3% |
| Median | 15.9% | 13.3% |
| Interquartile 25% (IQ1) | 12.8% | 11.6% |
| Interquartile 75% (IQ3) | 20.5% | 16.9% |
| Interquartile Range (IQR) | 7.7% | 5.3% |
| Standard Deviation (Sample) | 7.6% | 7.2% |
| Standard Deviation (Population) | 7.6% | 7.2% |
Similar Demographics by Male Disability
Demographics Similar to Alaska Natives by Male Disability
In terms of male disability, the demographic groups most similar to Alaska Natives are Iroquois (13.6%, a difference of 0.050%), Aleut (13.5%, a difference of 0.21%), Puget Sound Salish (13.5%, a difference of 0.27%), Yakama (13.5%, a difference of 0.29%), and Paiute (13.7%, a difference of 0.80%).
| Demographics | Rating | Rank | Male Disability |
| Blackfeet | 0.0 /100 | #309 | Tragic 13.4% |
| Immigrants | Azores | 0.0 /100 | #310 | Tragic 13.4% |
| Delaware | 0.0 /100 | #311 | Tragic 13.5% |
| Yakama | 0.0 /100 | #312 | Tragic 13.5% |
| Puget Sound Salish | 0.0 /100 | #313 | Tragic 13.5% |
| Aleuts | 0.0 /100 | #314 | Tragic 13.5% |
| Iroquois | 0.0 /100 | #315 | Tragic 13.6% |
| Alaska Natives | 0.0 /100 | #316 | Tragic 13.6% |
| Paiute | 0.0 /100 | #317 | Tragic 13.7% |
| Cree | 0.0 /100 | #318 | Tragic 13.7% |
| Americans | 0.0 /100 | #319 | Tragic 13.8% |
| Tlingit-Haida | 0.0 /100 | #320 | Tragic 13.8% |
| Shoshone | 0.0 /100 | #321 | Tragic 13.8% |
| Apache | 0.0 /100 | #322 | Tragic 14.0% |
| Osage | 0.0 /100 | #323 | Tragic 14.0% |
Demographics Similar to Czechs by Male Disability
In terms of male disability, the demographic groups most similar to Czechs are Bahamian (11.9%, a difference of 0.040%), Italian (11.9%, a difference of 0.050%), Northern European (11.9%, a difference of 0.050%), Samoan (11.9%, a difference of 0.080%), and Yugoslavian (11.9%, a difference of 0.10%).
| Demographics | Rating | Rank | Male Disability |
| Mexicans | 1.7 /100 | #233 | Tragic 11.8% |
| Immigrants | Canada | 1.6 /100 | #234 | Tragic 11.9% |
| Immigrants | North America | 1.5 /100 | #235 | Tragic 11.9% |
| U.S. Virgin Islanders | 1.3 /100 | #236 | Tragic 11.9% |
| Carpatho Rusyns | 1.3 /100 | #237 | Tragic 11.9% |
| Yugoslavians | 1.2 /100 | #238 | Tragic 11.9% |
| Italians | 1.2 /100 | #239 | Tragic 11.9% |
| Czechs | 1.1 /100 | #240 | Tragic 11.9% |
| Bahamians | 1.1 /100 | #241 | Tragic 11.9% |
| Northern Europeans | 1.1 /100 | #242 | Tragic 11.9% |
| Samoans | 1.1 /100 | #243 | Tragic 11.9% |
| Immigrants | Laos | 1.0 /100 | #244 | Tragic 11.9% |
| Immigrants | Liberia | 1.0 /100 | #245 | Tragic 11.9% |
| Danes | 0.9 /100 | #246 | Tragic 11.9% |
| Hungarians | 0.8 /100 | #247 | Tragic 12.0% |