Alaska Native vs German Male Disability
COMPARE
Alaska Native
German
Male Disability
Male Disability Comparison
Alaska Natives
Germans
13.6%
MALE DISABILITY
0.0/ 100
METRIC RATING
316th/ 347
METRIC RANK
12.7%
MALE DISABILITY
0.0/ 100
METRIC RATING
283rd/ 347
METRIC RANK
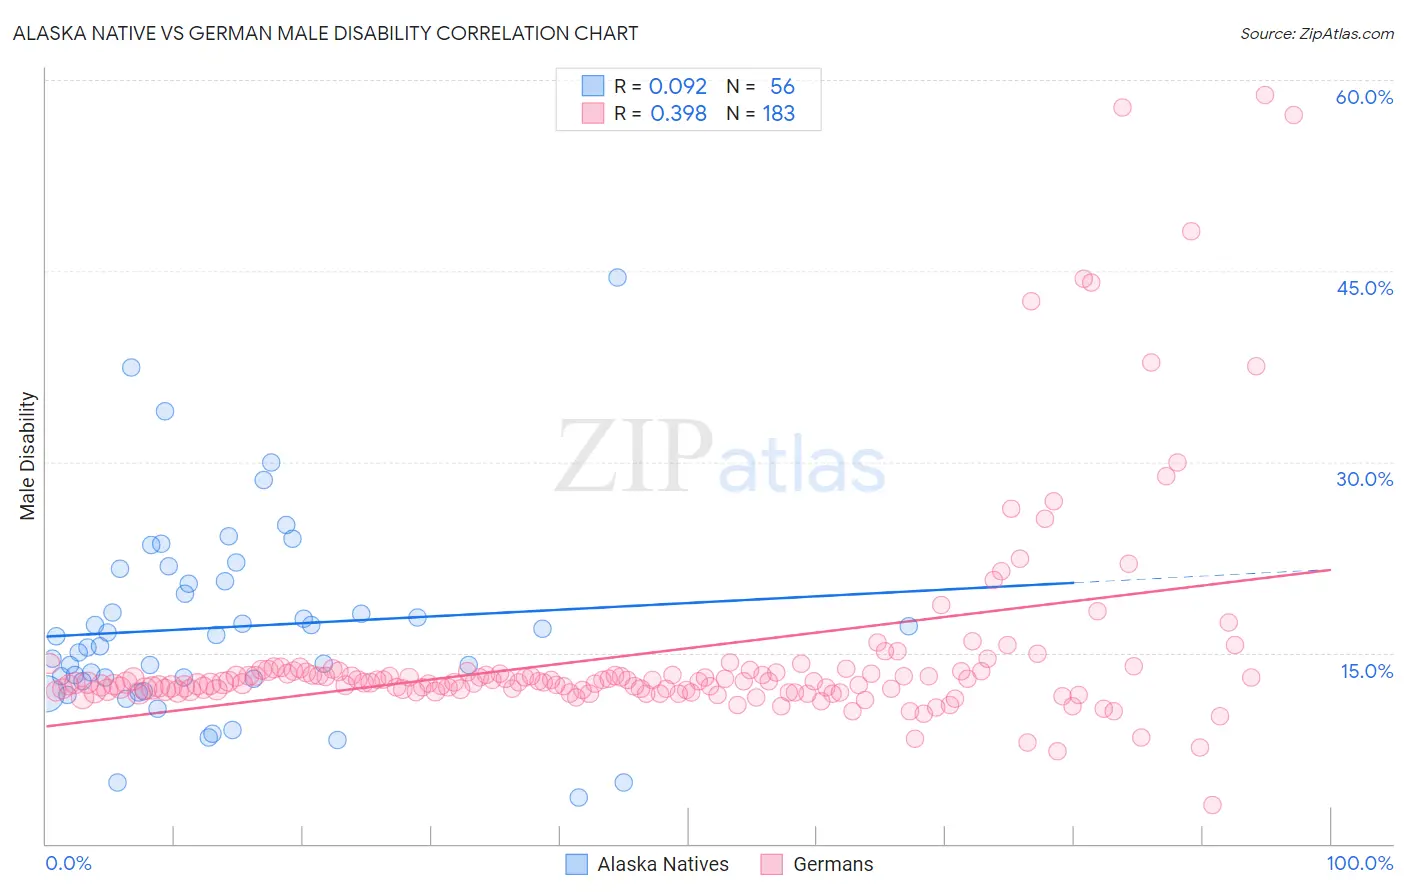
Alaska Native vs German Male Disability Correlation Chart
The statistical analysis conducted on geographies consisting of 76,765,214 people shows a slight positive correlation between the proportion of Alaska Natives and percentage of males with a disability in the United States with a correlation coefficient (R) of 0.092 and weighted average of 13.6%. Similarly, the statistical analysis conducted on geographies consisting of 580,769,413 people shows a mild positive correlation between the proportion of Germans and percentage of males with a disability in the United States with a correlation coefficient (R) of 0.398 and weighted average of 12.7%, a difference of 6.8%.
Male Disability Correlation Summary
| Measurement | Alaska Native | German |
| Minimum | 3.6% | 3.0% |
| Maximum | 44.4% | 58.8% |
| Range | 40.8% | 55.8% |
| Mean | 17.0% | 14.9% |
| Median | 15.9% | 12.7% |
| Interquartile 25% (IQ1) | 12.8% | 12.1% |
| Interquartile 75% (IQ3) | 20.5% | 13.5% |
| Interquartile Range (IQR) | 7.7% | 1.4% |
| Standard Deviation (Sample) | 7.6% | 8.3% |
| Standard Deviation (Population) | 7.6% | 8.3% |
Similar Demographics by Male Disability
Demographics Similar to Alaska Natives by Male Disability
In terms of male disability, the demographic groups most similar to Alaska Natives are Iroquois (13.6%, a difference of 0.050%), Aleut (13.5%, a difference of 0.21%), Puget Sound Salish (13.5%, a difference of 0.27%), Yakama (13.5%, a difference of 0.29%), and Paiute (13.7%, a difference of 0.80%).
| Demographics | Rating | Rank | Male Disability |
| Blackfeet | 0.0 /100 | #309 | Tragic 13.4% |
| Immigrants | Azores | 0.0 /100 | #310 | Tragic 13.4% |
| Delaware | 0.0 /100 | #311 | Tragic 13.5% |
| Yakama | 0.0 /100 | #312 | Tragic 13.5% |
| Puget Sound Salish | 0.0 /100 | #313 | Tragic 13.5% |
| Aleuts | 0.0 /100 | #314 | Tragic 13.5% |
| Iroquois | 0.0 /100 | #315 | Tragic 13.6% |
| Alaska Natives | 0.0 /100 | #316 | Tragic 13.6% |
| Paiute | 0.0 /100 | #317 | Tragic 13.7% |
| Cree | 0.0 /100 | #318 | Tragic 13.7% |
| Americans | 0.0 /100 | #319 | Tragic 13.8% |
| Tlingit-Haida | 0.0 /100 | #320 | Tragic 13.8% |
| Shoshone | 0.0 /100 | #321 | Tragic 13.8% |
| Apache | 0.0 /100 | #322 | Tragic 14.0% |
| Osage | 0.0 /100 | #323 | Tragic 14.0% |
Demographics Similar to Germans by Male Disability
In terms of male disability, the demographic groups most similar to Germans are Irish (12.7%, a difference of 0.010%), Sioux (12.7%, a difference of 0.070%), Dutch (12.7%, a difference of 0.12%), Slovak (12.7%, a difference of 0.17%), and Spanish (12.7%, a difference of 0.27%).
| Demographics | Rating | Rank | Male Disability |
| Africans | 0.0 /100 | #276 | Tragic 12.6% |
| Finns | 0.0 /100 | #277 | Tragic 12.6% |
| Central American Indians | 0.0 /100 | #278 | Tragic 12.7% |
| Slovaks | 0.0 /100 | #279 | Tragic 12.7% |
| Dutch | 0.0 /100 | #280 | Tragic 12.7% |
| Sioux | 0.0 /100 | #281 | Tragic 12.7% |
| Irish | 0.0 /100 | #282 | Tragic 12.7% |
| Germans | 0.0 /100 | #283 | Tragic 12.7% |
| Spanish | 0.0 /100 | #284 | Tragic 12.7% |
| Welsh | 0.0 /100 | #285 | Tragic 12.7% |
| Scottish | 0.0 /100 | #286 | Tragic 12.8% |
| Cape Verdeans | 0.0 /100 | #287 | Tragic 12.8% |
| Yup'ik | 0.0 /100 | #288 | Tragic 12.8% |
| Immigrants | Cabo Verde | 0.0 /100 | #289 | Tragic 12.8% |
| Pima | 0.0 /100 | #290 | Tragic 12.8% |