Alaska Native vs Immigrants from Armenia Male Disability
COMPARE
Alaska Native
Immigrants from Armenia
Male Disability
Male Disability Comparison
Alaska Natives
Immigrants from Armenia
13.6%
MALE DISABILITY
0.0/ 100
METRIC RATING
316th/ 347
METRIC RANK
10.7%
MALE DISABILITY
96.6/ 100
METRIC RATING
97th/ 347
METRIC RANK
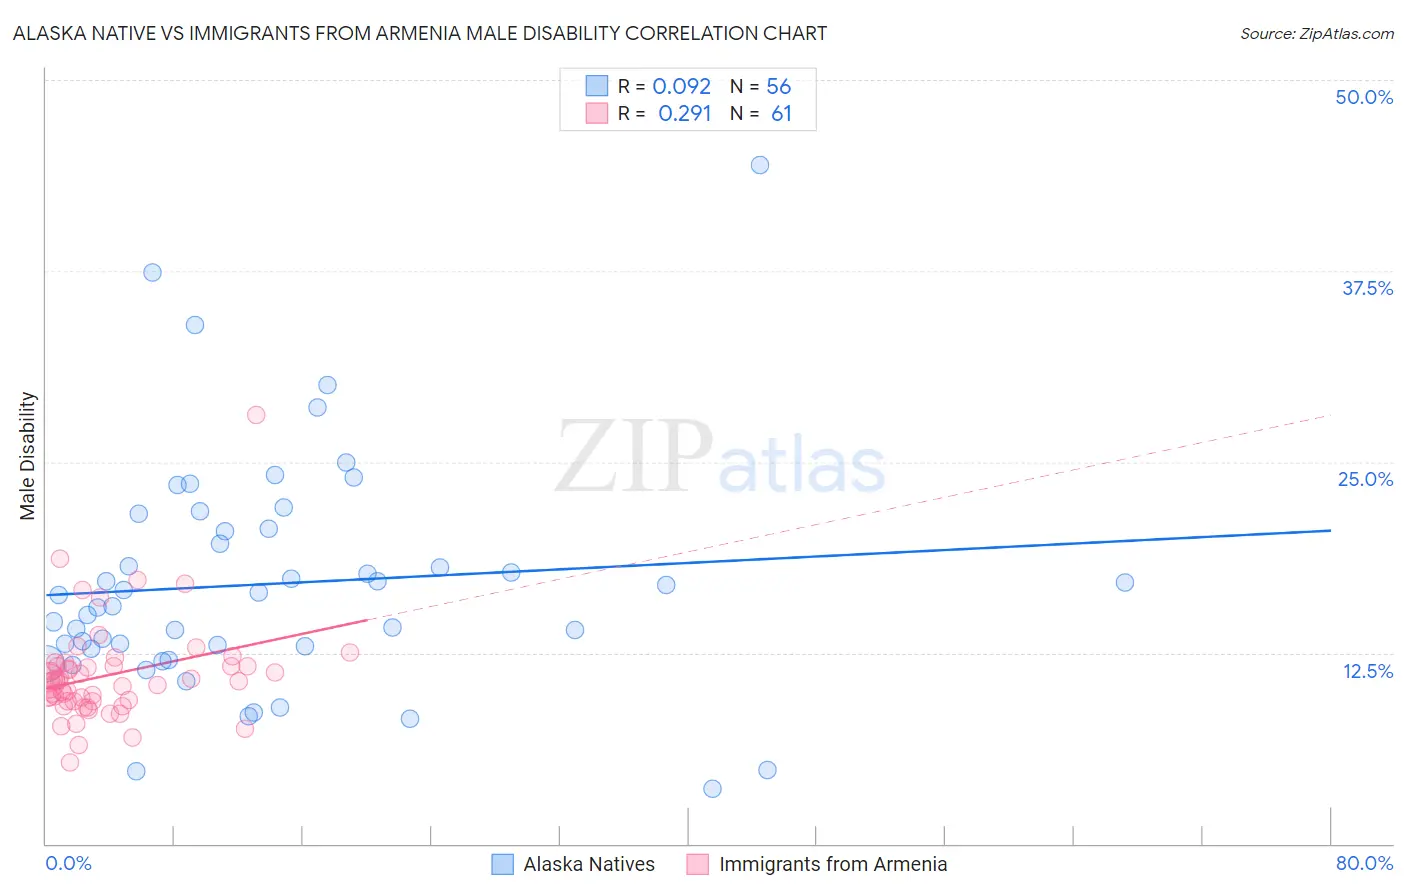
Alaska Native vs Immigrants from Armenia Male Disability Correlation Chart
The statistical analysis conducted on geographies consisting of 76,765,214 people shows a slight positive correlation between the proportion of Alaska Natives and percentage of males with a disability in the United States with a correlation coefficient (R) of 0.092 and weighted average of 13.6%. Similarly, the statistical analysis conducted on geographies consisting of 97,710,322 people shows a weak positive correlation between the proportion of Immigrants from Armenia and percentage of males with a disability in the United States with a correlation coefficient (R) of 0.291 and weighted average of 10.7%, a difference of 26.9%.
Male Disability Correlation Summary
| Measurement | Alaska Native | Immigrants from Armenia |
| Minimum | 3.6% | 5.3% |
| Maximum | 44.4% | 28.0% |
| Range | 40.8% | 22.8% |
| Mean | 17.0% | 11.1% |
| Median | 15.9% | 10.6% |
| Interquartile 25% (IQ1) | 12.8% | 9.4% |
| Interquartile 75% (IQ3) | 20.5% | 11.6% |
| Interquartile Range (IQR) | 7.7% | 2.3% |
| Standard Deviation (Sample) | 7.6% | 3.3% |
| Standard Deviation (Population) | 7.6% | 3.3% |
Similar Demographics by Male Disability
Demographics Similar to Alaska Natives by Male Disability
In terms of male disability, the demographic groups most similar to Alaska Natives are Iroquois (13.6%, a difference of 0.050%), Aleut (13.5%, a difference of 0.21%), Puget Sound Salish (13.5%, a difference of 0.27%), Yakama (13.5%, a difference of 0.29%), and Paiute (13.7%, a difference of 0.80%).
| Demographics | Rating | Rank | Male Disability |
| Blackfeet | 0.0 /100 | #309 | Tragic 13.4% |
| Immigrants | Azores | 0.0 /100 | #310 | Tragic 13.4% |
| Delaware | 0.0 /100 | #311 | Tragic 13.5% |
| Yakama | 0.0 /100 | #312 | Tragic 13.5% |
| Puget Sound Salish | 0.0 /100 | #313 | Tragic 13.5% |
| Aleuts | 0.0 /100 | #314 | Tragic 13.5% |
| Iroquois | 0.0 /100 | #315 | Tragic 13.6% |
| Alaska Natives | 0.0 /100 | #316 | Tragic 13.6% |
| Paiute | 0.0 /100 | #317 | Tragic 13.7% |
| Cree | 0.0 /100 | #318 | Tragic 13.7% |
| Americans | 0.0 /100 | #319 | Tragic 13.8% |
| Tlingit-Haida | 0.0 /100 | #320 | Tragic 13.8% |
| Shoshone | 0.0 /100 | #321 | Tragic 13.8% |
| Apache | 0.0 /100 | #322 | Tragic 14.0% |
| Osage | 0.0 /100 | #323 | Tragic 14.0% |
Demographics Similar to Immigrants from Armenia by Male Disability
In terms of male disability, the demographic groups most similar to Immigrants from Armenia are Nicaraguan (10.7%, a difference of 0.020%), Immigrants from Romania (10.7%, a difference of 0.060%), Chilean (10.7%, a difference of 0.12%), Immigrants from Sweden (10.7%, a difference of 0.15%), and Immigrants from Switzerland (10.7%, a difference of 0.20%).
| Demographics | Rating | Rank | Male Disability |
| Immigrants | Morocco | 97.7 /100 | #90 | Exceptional 10.6% |
| Immigrants | France | 97.6 /100 | #91 | Exceptional 10.6% |
| Palestinians | 97.4 /100 | #92 | Exceptional 10.7% |
| Immigrants | St. Vincent and the Grenadines | 97.1 /100 | #93 | Exceptional 10.7% |
| Immigrants | Sweden | 96.9 /100 | #94 | Exceptional 10.7% |
| Chileans | 96.9 /100 | #95 | Exceptional 10.7% |
| Nicaraguans | 96.6 /100 | #96 | Exceptional 10.7% |
| Immigrants | Armenia | 96.6 /100 | #97 | Exceptional 10.7% |
| Immigrants | Romania | 96.5 /100 | #98 | Exceptional 10.7% |
| Immigrants | Switzerland | 96.1 /100 | #99 | Exceptional 10.7% |
| Immigrants | Kazakhstan | 95.9 /100 | #100 | Exceptional 10.7% |
| Immigrants | Greece | 95.6 /100 | #101 | Exceptional 10.7% |
| Immigrants | Eastern Europe | 95.3 /100 | #102 | Exceptional 10.7% |
| Uruguayans | 95.3 /100 | #103 | Exceptional 10.7% |
| Immigrants | Nigeria | 95.1 /100 | #104 | Exceptional 10.8% |