Alaska Native vs Immigrants from Micronesia Male Disability
COMPARE
Alaska Native
Immigrants from Micronesia
Male Disability
Male Disability Comparison
Alaska Natives
Immigrants from Micronesia
13.6%
MALE DISABILITY
0.0/ 100
METRIC RATING
316th/ 347
METRIC RANK
12.9%
MALE DISABILITY
0.0/ 100
METRIC RATING
295th/ 347
METRIC RANK
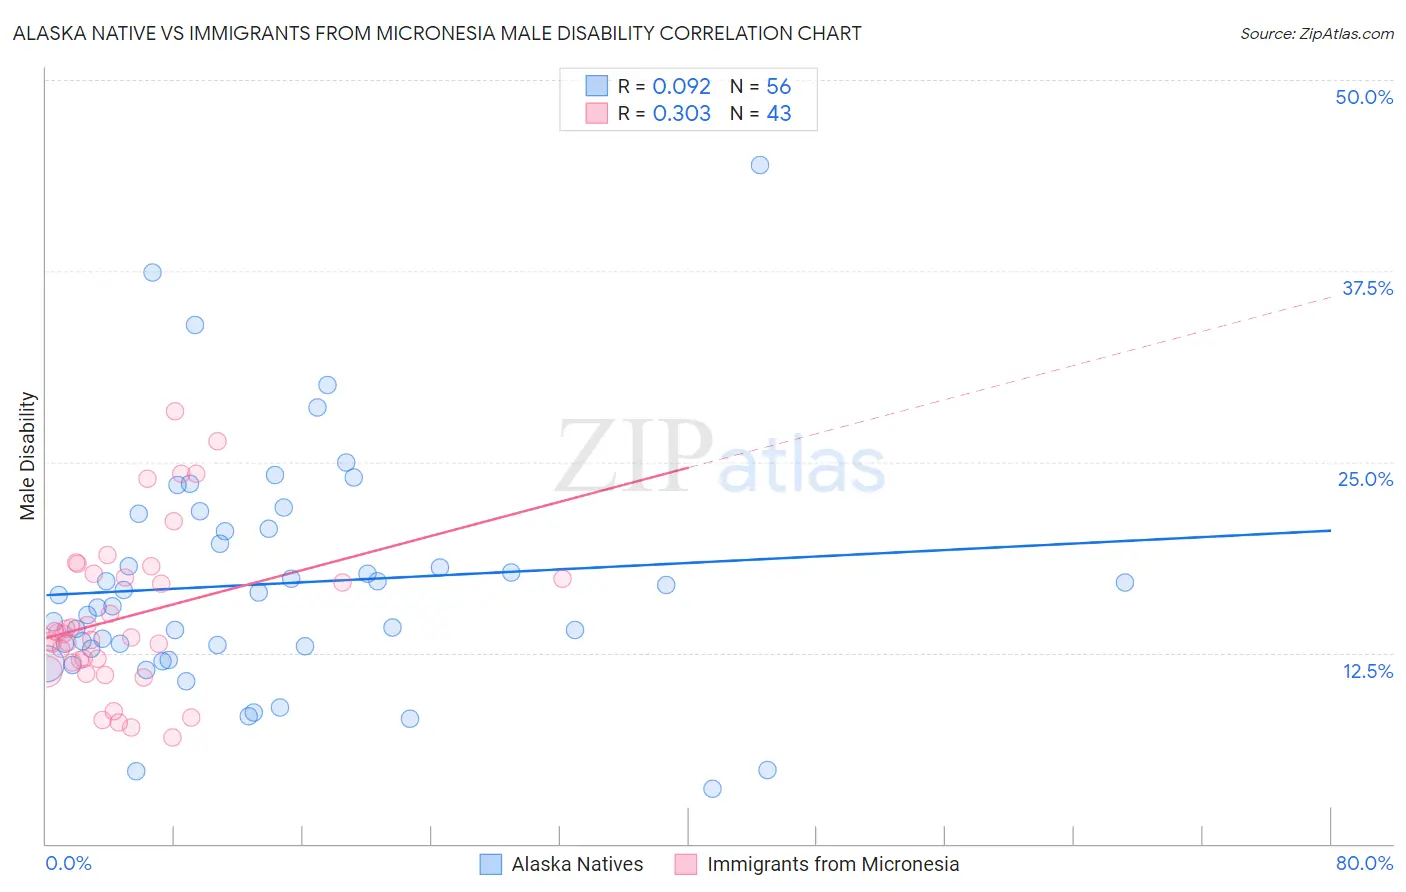
Alaska Native vs Immigrants from Micronesia Male Disability Correlation Chart
The statistical analysis conducted on geographies consisting of 76,765,214 people shows a slight positive correlation between the proportion of Alaska Natives and percentage of males with a disability in the United States with a correlation coefficient (R) of 0.092 and weighted average of 13.6%. Similarly, the statistical analysis conducted on geographies consisting of 61,603,826 people shows a mild positive correlation between the proportion of Immigrants from Micronesia and percentage of males with a disability in the United States with a correlation coefficient (R) of 0.303 and weighted average of 12.9%, a difference of 5.0%.
Male Disability Correlation Summary
| Measurement | Alaska Native | Immigrants from Micronesia |
| Minimum | 3.6% | 6.9% |
| Maximum | 44.4% | 28.3% |
| Range | 40.8% | 21.4% |
| Mean | 17.0% | 14.9% |
| Median | 15.9% | 13.8% |
| Interquartile 25% (IQ1) | 12.8% | 11.9% |
| Interquartile 75% (IQ3) | 20.5% | 17.6% |
| Interquartile Range (IQR) | 7.7% | 5.7% |
| Standard Deviation (Sample) | 7.6% | 5.1% |
| Standard Deviation (Population) | 7.6% | 5.0% |
Similar Demographics by Male Disability
Demographics Similar to Alaska Natives by Male Disability
In terms of male disability, the demographic groups most similar to Alaska Natives are Iroquois (13.6%, a difference of 0.050%), Aleut (13.5%, a difference of 0.21%), Puget Sound Salish (13.5%, a difference of 0.27%), Yakama (13.5%, a difference of 0.29%), and Paiute (13.7%, a difference of 0.80%).
| Demographics | Rating | Rank | Male Disability |
| Blackfeet | 0.0 /100 | #309 | Tragic 13.4% |
| Immigrants | Azores | 0.0 /100 | #310 | Tragic 13.4% |
| Delaware | 0.0 /100 | #311 | Tragic 13.5% |
| Yakama | 0.0 /100 | #312 | Tragic 13.5% |
| Puget Sound Salish | 0.0 /100 | #313 | Tragic 13.5% |
| Aleuts | 0.0 /100 | #314 | Tragic 13.5% |
| Iroquois | 0.0 /100 | #315 | Tragic 13.6% |
| Alaska Natives | 0.0 /100 | #316 | Tragic 13.6% |
| Paiute | 0.0 /100 | #317 | Tragic 13.7% |
| Cree | 0.0 /100 | #318 | Tragic 13.7% |
| Americans | 0.0 /100 | #319 | Tragic 13.8% |
| Tlingit-Haida | 0.0 /100 | #320 | Tragic 13.8% |
| Shoshone | 0.0 /100 | #321 | Tragic 13.8% |
| Apache | 0.0 /100 | #322 | Tragic 14.0% |
| Osage | 0.0 /100 | #323 | Tragic 14.0% |
Demographics Similar to Immigrants from Micronesia by Male Disability
In terms of male disability, the demographic groups most similar to Immigrants from Micronesia are Nonimmigrants (12.9%, a difference of 0.070%), Marshallese (12.9%, a difference of 0.10%), Inupiat (13.0%, a difference of 0.17%), Yaqui (12.9%, a difference of 0.33%), and Pennsylvania German (13.0%, a difference of 0.37%).
| Demographics | Rating | Rank | Male Disability |
| Yup'ik | 0.0 /100 | #288 | Tragic 12.8% |
| Immigrants | Cabo Verde | 0.0 /100 | #289 | Tragic 12.8% |
| Pima | 0.0 /100 | #290 | Tragic 12.8% |
| Whites/Caucasians | 0.0 /100 | #291 | Tragic 12.8% |
| English | 0.0 /100 | #292 | Tragic 12.8% |
| Yaqui | 0.0 /100 | #293 | Tragic 12.9% |
| Marshallese | 0.0 /100 | #294 | Tragic 12.9% |
| Immigrants | Micronesia | 0.0 /100 | #295 | Tragic 12.9% |
| Immigrants | Nonimmigrants | 0.0 /100 | #296 | Tragic 12.9% |
| Inupiat | 0.0 /100 | #297 | Tragic 13.0% |
| Pennsylvania Germans | 0.0 /100 | #298 | Tragic 13.0% |
| Celtics | 0.0 /100 | #299 | Tragic 13.0% |
| Cheyenne | 0.0 /100 | #300 | Tragic 13.0% |
| French | 0.0 /100 | #301 | Tragic 13.0% |
| Crow | 0.0 /100 | #302 | Tragic 13.1% |