Immigrants from South Eastern Asia vs Subsaharan African Child Poverty Among Girls Under 16
COMPARE
Immigrants from South Eastern Asia
Subsaharan African
Child Poverty Among Girls Under 16
Child Poverty Among Girls Under 16 Comparison
Immigrants from South Eastern Asia
Sub-Saharan Africans
15.4%
CHILD POVERTY AMONG GIRLS UNDER 16
90.5/ 100
METRIC RATING
129th/ 347
METRIC RANK
20.1%
CHILD POVERTY AMONG GIRLS UNDER 16
0.0/ 100
METRIC RATING
275th/ 347
METRIC RANK
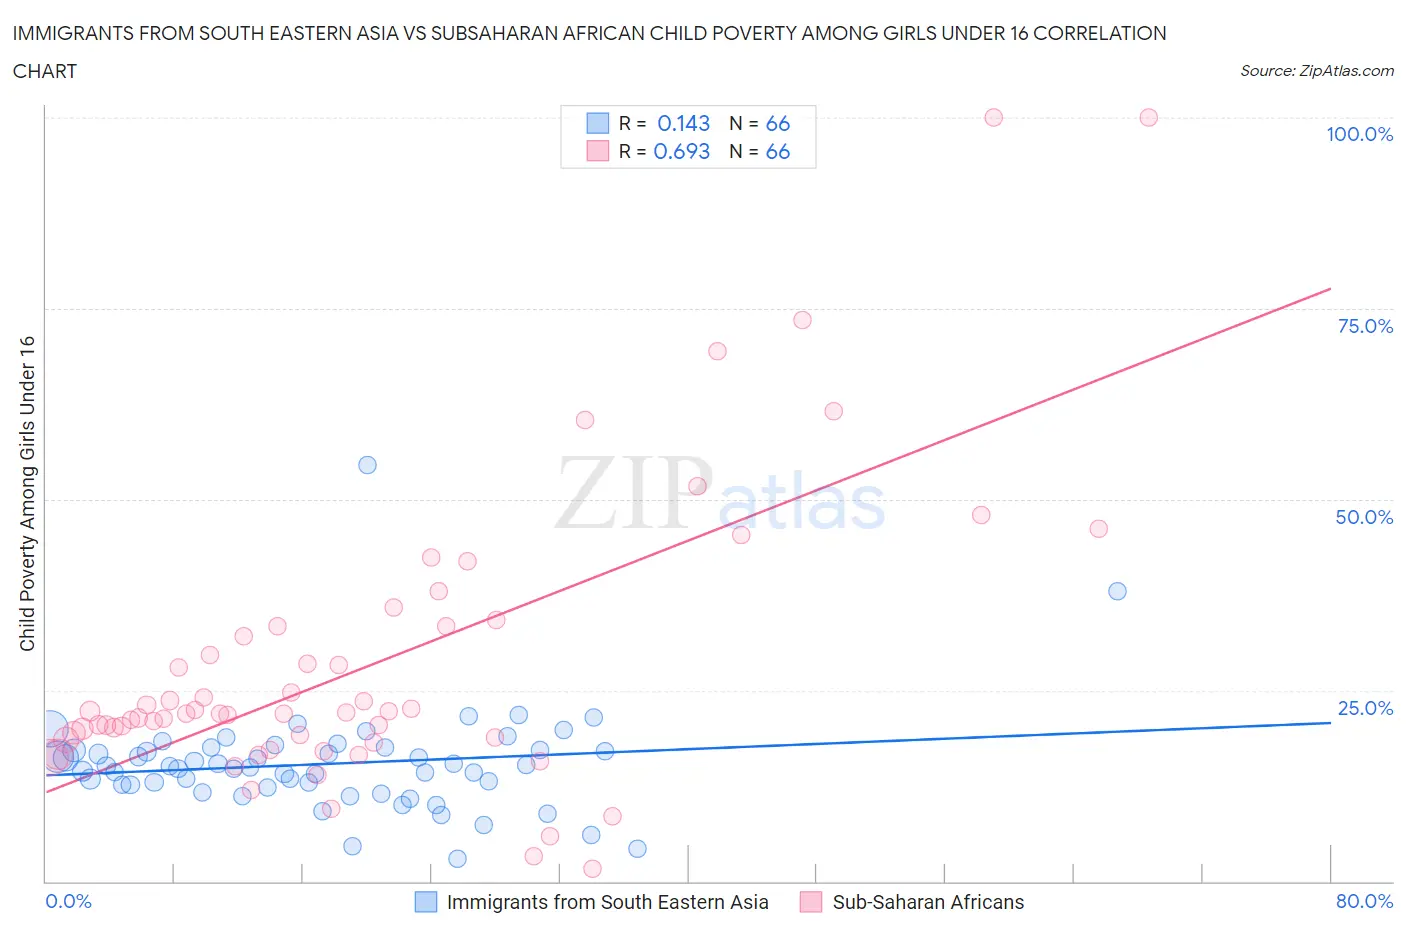
Immigrants from South Eastern Asia vs Subsaharan African Child Poverty Among Girls Under 16 Correlation Chart
The statistical analysis conducted on geographies consisting of 498,768,051 people shows a poor positive correlation between the proportion of Immigrants from South Eastern Asia and poverty level among girls under the age of 16 in the United States with a correlation coefficient (R) of 0.143 and weighted average of 15.4%. Similarly, the statistical analysis conducted on geographies consisting of 496,899,151 people shows a significant positive correlation between the proportion of Sub-Saharan Africans and poverty level among girls under the age of 16 in the United States with a correlation coefficient (R) of 0.693 and weighted average of 20.1%, a difference of 30.6%.
Child Poverty Among Girls Under 16 Correlation Summary
| Measurement | Immigrants from South Eastern Asia | Subsaharan African |
| Minimum | 3.0% | 1.7% |
| Maximum | 54.5% | 100.0% |
| Range | 51.5% | 98.3% |
| Mean | 15.4% | 28.3% |
| Median | 15.0% | 21.9% |
| Interquartile 25% (IQ1) | 12.7% | 18.5% |
| Interquartile 75% (IQ3) | 17.1% | 33.3% |
| Interquartile Range (IQR) | 4.4% | 14.8% |
| Standard Deviation (Sample) | 7.0% | 19.2% |
| Standard Deviation (Population) | 7.0% | 19.1% |
Similar Demographics by Child Poverty Among Girls Under 16
Demographics Similar to Immigrants from South Eastern Asia by Child Poverty Among Girls Under 16
In terms of child poverty among girls under 16, the demographic groups most similar to Immigrants from South Eastern Asia are Albanian (15.4%, a difference of 0.010%), Immigrants from Norway (15.4%, a difference of 0.10%), Puget Sound Salish (15.4%, a difference of 0.16%), Scottish (15.4%, a difference of 0.17%), and Immigrants from Western Europe (15.4%, a difference of 0.18%).
| Demographics | Rating | Rank | Child Poverty Among Girls Under 16 |
| Portuguese | 91.8 /100 | #122 | Exceptional 15.3% |
| Irish | 91.5 /100 | #123 | Exceptional 15.3% |
| Carpatho Rusyns | 91.4 /100 | #124 | Exceptional 15.3% |
| Peruvians | 91.2 /100 | #125 | Exceptional 15.4% |
| Scottish | 91.0 /100 | #126 | Exceptional 15.4% |
| Immigrants | Norway | 90.8 /100 | #127 | Exceptional 15.4% |
| Albanians | 90.5 /100 | #128 | Exceptional 15.4% |
| Immigrants | South Eastern Asia | 90.5 /100 | #129 | Exceptional 15.4% |
| Puget Sound Salish | 90.1 /100 | #130 | Exceptional 15.4% |
| Immigrants | Western Europe | 90.0 /100 | #131 | Exceptional 15.4% |
| Mongolians | 89.7 /100 | #132 | Excellent 15.4% |
| Brazilians | 89.6 /100 | #133 | Excellent 15.4% |
| Immigrants | Spain | 89.1 /100 | #134 | Excellent 15.5% |
| Czechoslovakians | 89.0 /100 | #135 | Excellent 15.5% |
| Native Hawaiians | 89.0 /100 | #136 | Excellent 15.5% |
Demographics Similar to Sub-Saharan Africans by Child Poverty Among Girls Under 16
In terms of child poverty among girls under 16, the demographic groups most similar to Sub-Saharan Africans are Immigrants from St. Vincent and the Grenadines (20.1%, a difference of 0.14%), Comanche (20.2%, a difference of 0.32%), Belizean (20.2%, a difference of 0.43%), Barbadian (20.2%, a difference of 0.46%), and Bangladeshi (20.0%, a difference of 0.57%).
| Demographics | Rating | Rank | Child Poverty Among Girls Under 16 |
| Spanish American Indians | 0.1 /100 | #268 | Tragic 19.9% |
| Liberians | 0.1 /100 | #269 | Tragic 19.9% |
| Cherokee | 0.1 /100 | #270 | Tragic 19.9% |
| Immigrants | Barbados | 0.1 /100 | #271 | Tragic 19.9% |
| Immigrants | El Salvador | 0.1 /100 | #272 | Tragic 20.0% |
| Bangladeshis | 0.1 /100 | #273 | Tragic 20.0% |
| Immigrants | St. Vincent and the Grenadines | 0.0 /100 | #274 | Tragic 20.1% |
| Sub-Saharan Africans | 0.0 /100 | #275 | Tragic 20.1% |
| Comanche | 0.0 /100 | #276 | Tragic 20.2% |
| Belizeans | 0.0 /100 | #277 | Tragic 20.2% |
| Barbadians | 0.0 /100 | #278 | Tragic 20.2% |
| Immigrants | Zaire | 0.0 /100 | #279 | Tragic 20.2% |
| Immigrants | Liberia | 0.0 /100 | #280 | Tragic 20.2% |
| Central Americans | 0.0 /100 | #281 | Tragic 20.2% |
| West Indians | 0.0 /100 | #282 | Tragic 20.3% |