Immigrants from South Eastern Asia vs Subsaharan African Disability Age Over 75
COMPARE
Immigrants from South Eastern Asia
Subsaharan African
Disability Age Over 75
Disability Age Over 75 Comparison
Immigrants from South Eastern Asia
Sub-Saharan Africans
48.7%
DISABILITY AGE OVER 75
0.7/ 100
METRIC RATING
252nd/ 347
METRIC RANK
48.2%
DISABILITY AGE OVER 75
3.8/ 100
METRIC RATING
234th/ 347
METRIC RANK
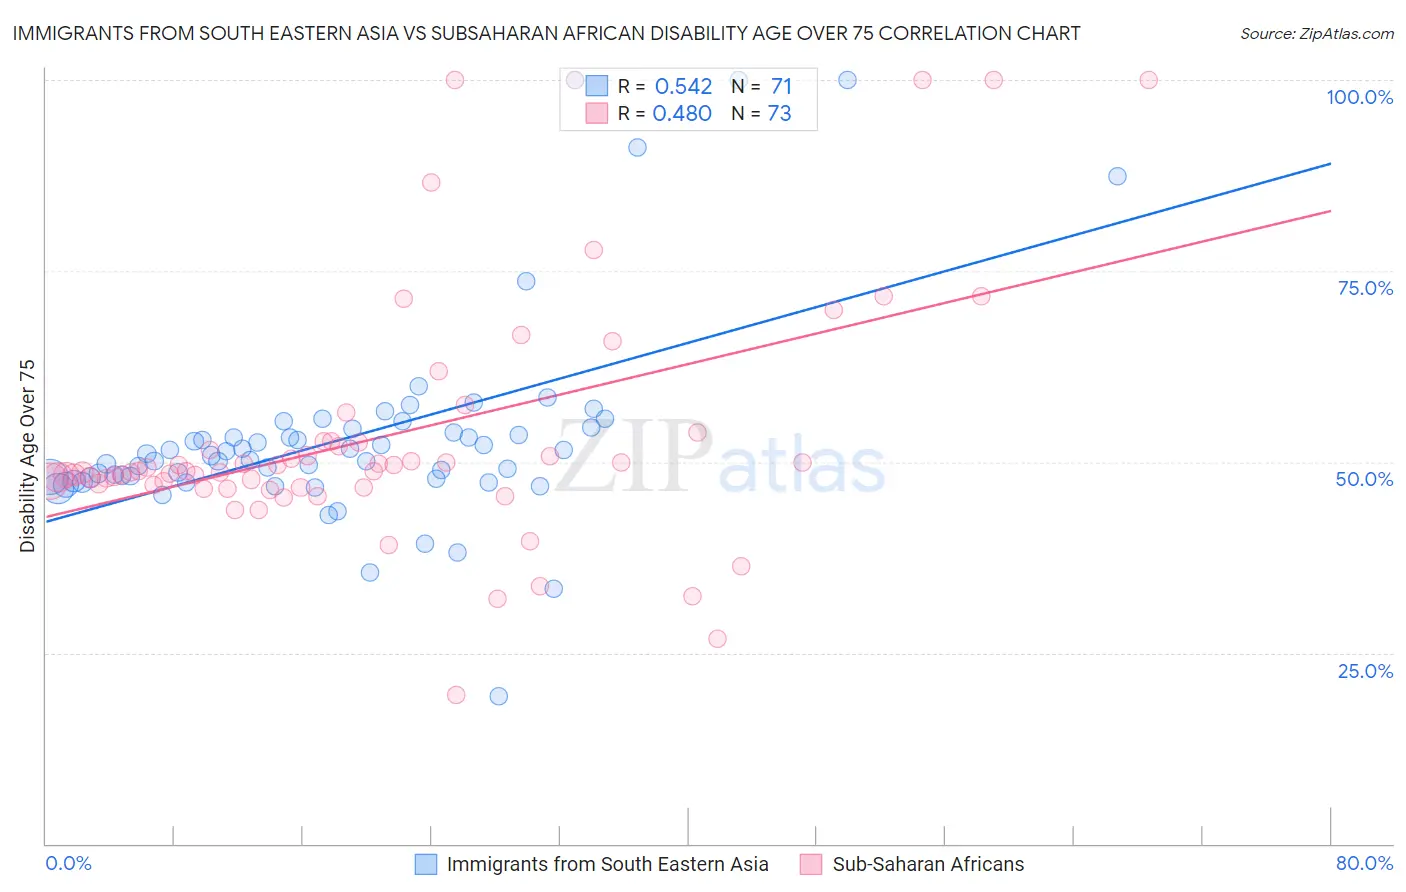
Immigrants from South Eastern Asia vs Subsaharan African Disability Age Over 75 Correlation Chart
The statistical analysis conducted on geographies consisting of 511,260,020 people shows a substantial positive correlation between the proportion of Immigrants from South Eastern Asia and percentage of population with a disability over the age of 75 in the United States with a correlation coefficient (R) of 0.542 and weighted average of 48.7%. Similarly, the statistical analysis conducted on geographies consisting of 506,598,024 people shows a moderate positive correlation between the proportion of Sub-Saharan Africans and percentage of population with a disability over the age of 75 in the United States with a correlation coefficient (R) of 0.480 and weighted average of 48.2%, a difference of 0.98%.
Disability Age Over 75 Correlation Summary
| Measurement | Immigrants from South Eastern Asia | Subsaharan African |
| Minimum | 19.3% | 19.4% |
| Maximum | 100.0% | 100.0% |
| Range | 80.7% | 80.6% |
| Mean | 53.2% | 53.4% |
| Median | 50.8% | 48.8% |
| Interquartile 25% (IQ1) | 47.7% | 46.9% |
| Interquartile 75% (IQ3) | 54.4% | 52.7% |
| Interquartile Range (IQR) | 6.7% | 5.8% |
| Standard Deviation (Sample) | 13.6% | 16.4% |
| Standard Deviation (Population) | 13.5% | 16.3% |
Demographics Similar to Immigrants from South Eastern Asia and Sub-Saharan Africans by Disability Age Over 75
In terms of disability age over 75, the demographic groups most similar to Immigrants from South Eastern Asia are British West Indian (48.7%, a difference of 0.040%), Korean (48.6%, a difference of 0.10%), West Indian (48.6%, a difference of 0.12%), Iraqi (48.6%, a difference of 0.20%), and Sri Lankan (48.5%, a difference of 0.42%). Similarly, the demographic groups most similar to Sub-Saharan Africans are Hmong (48.2%, a difference of 0.0%), Cree (48.2%, a difference of 0.060%), Immigrants from Nicaragua (48.2%, a difference of 0.10%), Immigrants from St. Vincent and the Grenadines (48.2%, a difference of 0.10%), and Nicaraguan (48.3%, a difference of 0.13%).
| Demographics | Rating | Rank | Disability Age Over 75 |
| Cree | 4.2 /100 | #233 | Tragic 48.2% |
| Sub-Saharan Africans | 3.8 /100 | #234 | Tragic 48.2% |
| Hmong | 3.8 /100 | #235 | Tragic 48.2% |
| Immigrants | Nicaragua | 3.2 /100 | #236 | Tragic 48.2% |
| Immigrants | St. Vincent and the Grenadines | 3.2 /100 | #237 | Tragic 48.2% |
| Nicaraguans | 3.0 /100 | #238 | Tragic 48.3% |
| Immigrants | Thailand | 2.8 /100 | #239 | Tragic 48.3% |
| Tongans | 2.3 /100 | #240 | Tragic 48.3% |
| Native Hawaiians | 2.2 /100 | #241 | Tragic 48.3% |
| French American Indians | 2.2 /100 | #242 | Tragic 48.3% |
| Immigrants | Caribbean | 2.1 /100 | #243 | Tragic 48.4% |
| Afghans | 1.8 /100 | #244 | Tragic 48.4% |
| Americans | 1.7 /100 | #245 | Tragic 48.4% |
| Chippewa | 1.6 /100 | #246 | Tragic 48.4% |
| Iroquois | 1.6 /100 | #247 | Tragic 48.4% |
| Sri Lankans | 1.4 /100 | #248 | Tragic 48.5% |
| Iraqis | 1.0 /100 | #249 | Tragic 48.6% |
| West Indians | 0.8 /100 | #250 | Tragic 48.6% |
| Koreans | 0.8 /100 | #251 | Tragic 48.6% |
| Immigrants | South Eastern Asia | 0.7 /100 | #252 | Tragic 48.7% |
| British West Indians | 0.6 /100 | #253 | Tragic 48.7% |