Zip Codes with the Highest Percentage of Population Employed in Farming, Fishing & Forestry in Milford, CT
RELATED REPORTS & OPTIONS
Farming, Fishing & Forestry
Milford
Compare Zip Codes
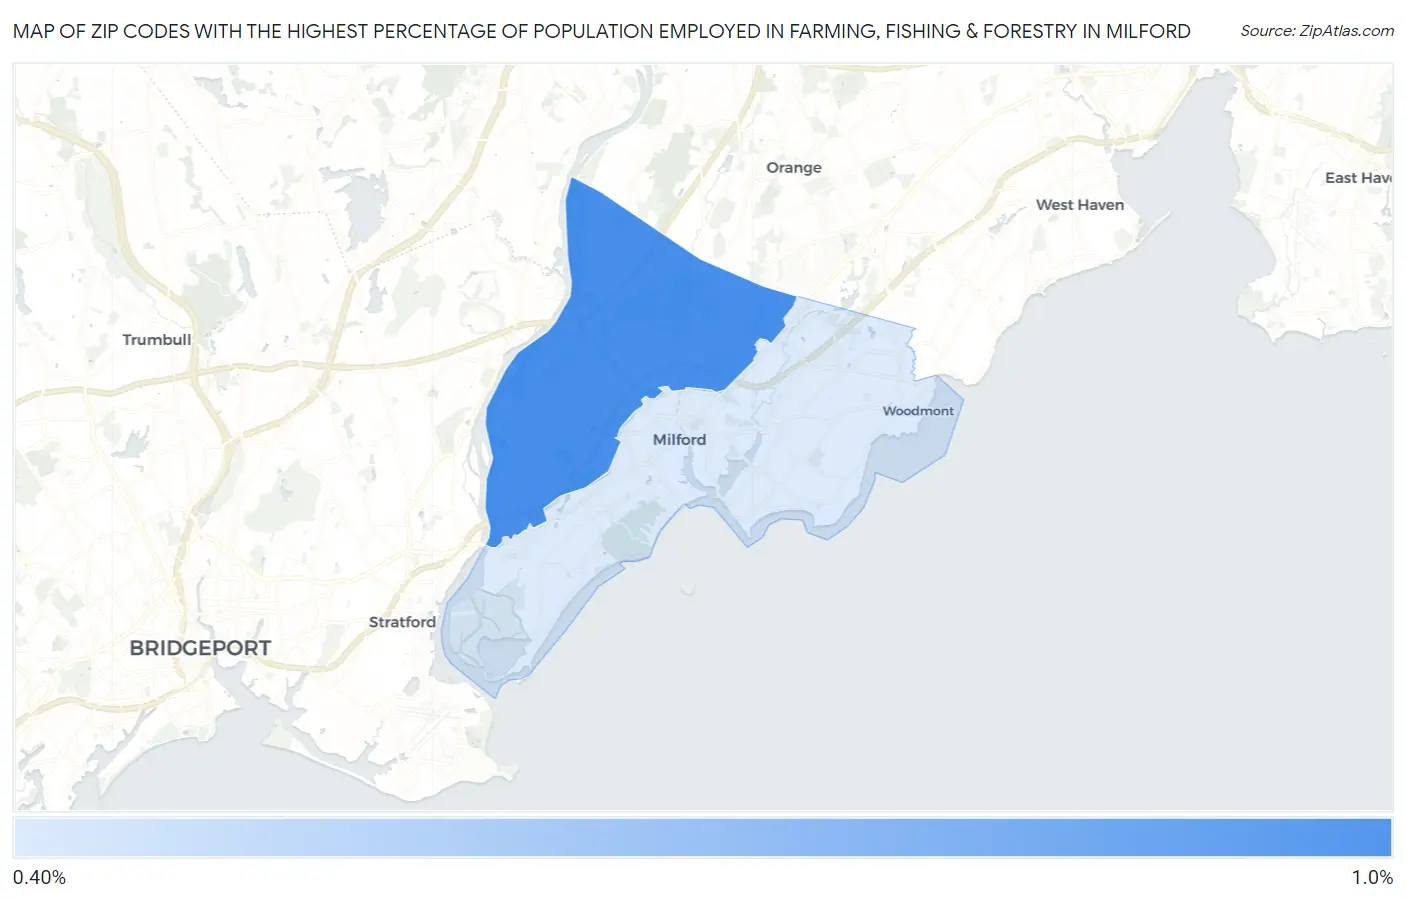
Map of Zip Codes with the Highest Percentage of Population Employed in Farming, Fishing & Forestry in Milford
0.45%
0.94%
Zip Codes with the Highest Percentage of Population Employed in Farming, Fishing & Forestry in Milford, CT
| Zip Code | % Employed | vs State | vs National | |
| 1. | 06461 | 0.94% | 0.18%(+0.761)#20 | 0.61%(+0.334)#10,044 |
| 2. | 06460 | 0.45% | 0.18%(+0.271)#38 | 0.61%(-0.156)#13,294 |
1
Common Questions
What are the Top Zip Codes with the Highest Percentage of Population Employed in Farming, Fishing & Forestry in Milford, CT?
Top Zip Codes with the Highest Percentage of Population Employed in Farming, Fishing & Forestry in Milford, CT are:
What zip code has the Highest Percentage of Population Employed in Farming, Fishing & Forestry in Milford, CT?
06461 has the Highest Percentage of Population Employed in Farming, Fishing & Forestry in Milford, CT with 0.94%.
What is the Percentage of Population Employed in Farming, Fishing & Forestry in Connecticut?
Percentage of Population Employed in Farming, Fishing & Forestry in Connecticut is 0.18%.
What is the Percentage of Population Employed in Farming, Fishing & Forestry in the United States?
Percentage of Population Employed in Farming, Fishing & Forestry in the United States is 0.61%.