Zip Codes with the Highest Percentage of Population Employed in Professional & Scientific Services in Santa Clarita, CA
RELATED REPORTS & OPTIONS
Professional & Scientific Services
Santa Clarita
Compare Zip Codes
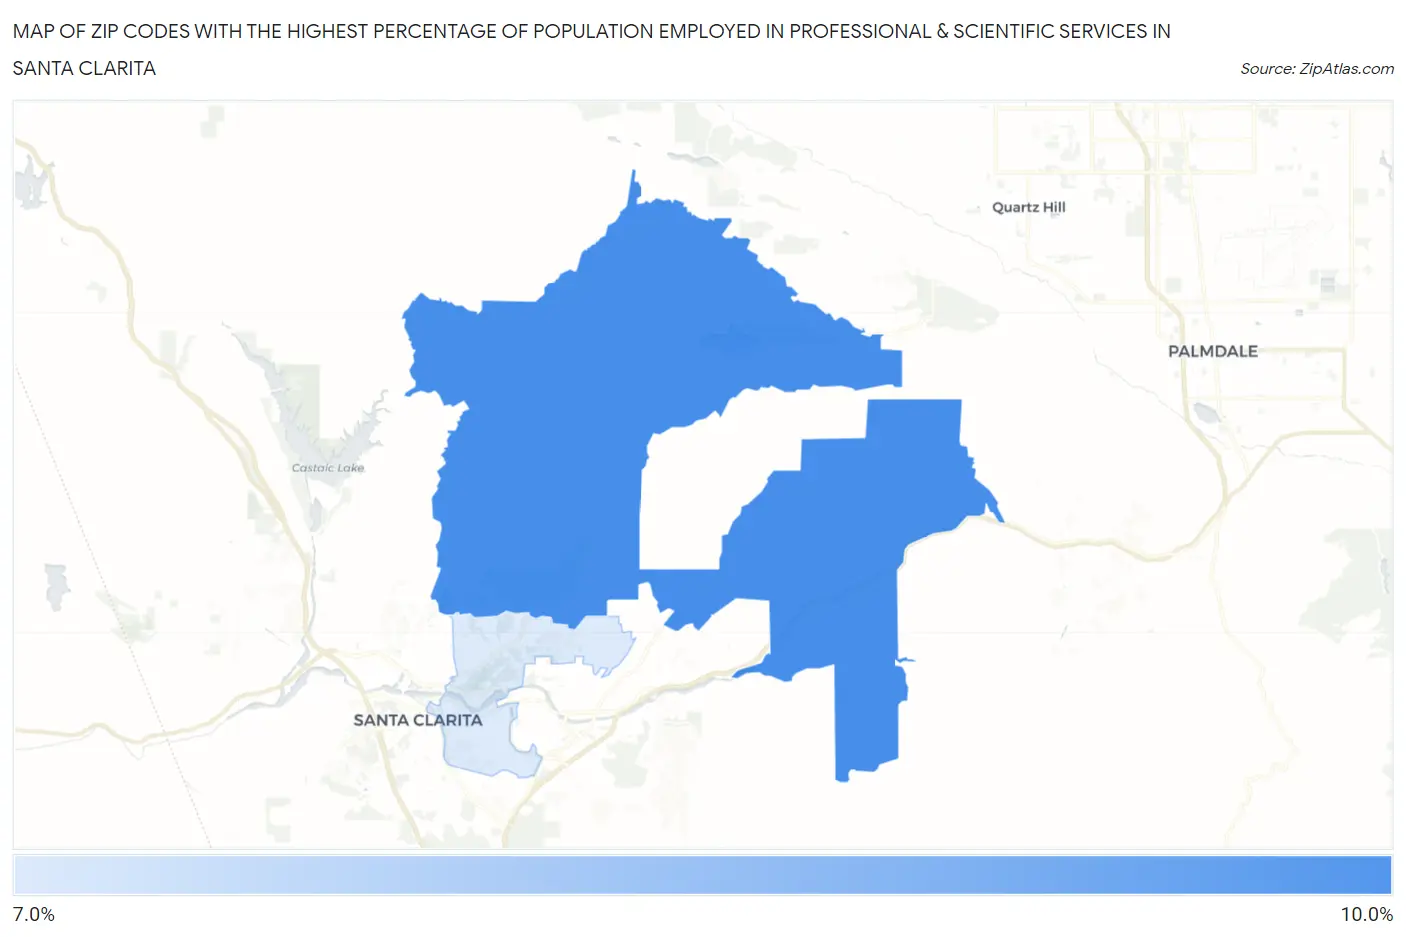
Map of Zip Codes with the Highest Percentage of Population Employed in Professional & Scientific Services in Santa Clarita
7.6%
8.0%
Zip Codes with the Highest Percentage of Population Employed in Professional & Scientific Services in Santa Clarita, CA
| Zip Code | % Employed | vs State | vs National | |
| 1. | 91390 | 8.0% | 9.4%(-1.39)#686 | 7.8%(+0.197)#6,598 |
| 2. | 91350 | 7.6% | 9.4%(-1.86)#728 | 7.8%(-0.269)#7,240 |
1
Common Questions
What are the Top Zip Codes with the Highest Percentage of Population Employed in Professional & Scientific Services in Santa Clarita, CA?
Top Zip Codes with the Highest Percentage of Population Employed in Professional & Scientific Services in Santa Clarita, CA are:
What zip code has the Highest Percentage of Population Employed in Professional & Scientific Services in Santa Clarita, CA?
91390 has the Highest Percentage of Population Employed in Professional & Scientific Services in Santa Clarita, CA with 8.0%.
What is the Percentage of Population Employed in Professional & Scientific Services in Santa Clarita, CA?
Percentage of Population Employed in Professional & Scientific Services in Santa Clarita is 7.5%.
What is the Percentage of Population Employed in Professional & Scientific Services in California?
Percentage of Population Employed in Professional & Scientific Services in California is 9.4%.
What is the Percentage of Population Employed in Professional & Scientific Services in the United States?
Percentage of Population Employed in Professional & Scientific Services in the United States is 7.8%.