Zip Codes with the Highest Percentage of Population Employed in Administrative & Support Services in Compton, CA
RELATED REPORTS & OPTIONS
Administrative & Support Services
Compton
Compare Zip Codes
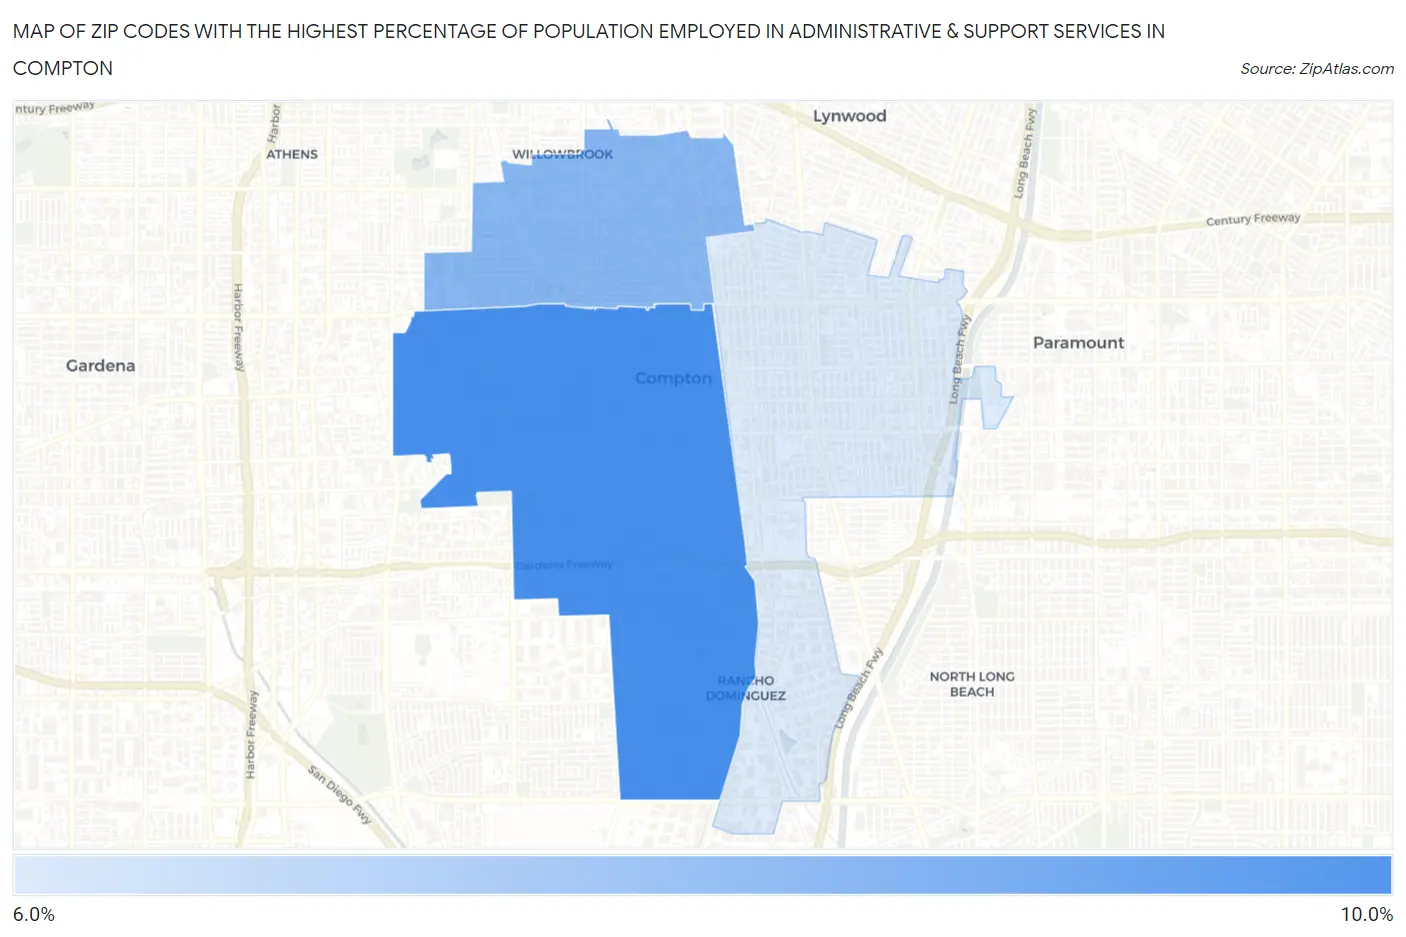
Map of Zip Codes with the Highest Percentage of Population Employed in Administrative & Support Services in Compton
6.6%
8.5%
Zip Codes with the Highest Percentage of Population Employed in Administrative & Support Services in Compton, CA
| Zip Code | % Employed | vs State | vs National | |
| 1. | 90220 | 8.5% | 4.6%(+3.89)#129 | 4.1%(+4.31)#1,989 |
| 2. | 90222 | 7.7% | 4.6%(+3.10)#168 | 4.1%(+3.52)#2,536 |
| 3. | 90221 | 6.6% | 4.6%(+2.07)#269 | 4.1%(+2.49)#3,707 |
1
Common Questions
What are the Top Zip Codes with the Highest Percentage of Population Employed in Administrative & Support Services in Compton, CA?
Top Zip Codes with the Highest Percentage of Population Employed in Administrative & Support Services in Compton, CA are:
What zip code has the Highest Percentage of Population Employed in Administrative & Support Services in Compton, CA?
90220 has the Highest Percentage of Population Employed in Administrative & Support Services in Compton, CA with 8.5%.
What is the Percentage of Population Employed in Administrative & Support Services in Compton, CA?
Percentage of Population Employed in Administrative & Support Services in Compton is 7.5%.
What is the Percentage of Population Employed in Administrative & Support Services in California?
Percentage of Population Employed in Administrative & Support Services in California is 4.6%.
What is the Percentage of Population Employed in Administrative & Support Services in the United States?
Percentage of Population Employed in Administrative & Support Services in the United States is 4.1%.