Zip Codes with the Highest Percentage of Population Employed in Accommodation & Food Services in Conway, AR
RELATED REPORTS & OPTIONS
Accommodation & Food Services
Conway
Compare Zip Codes
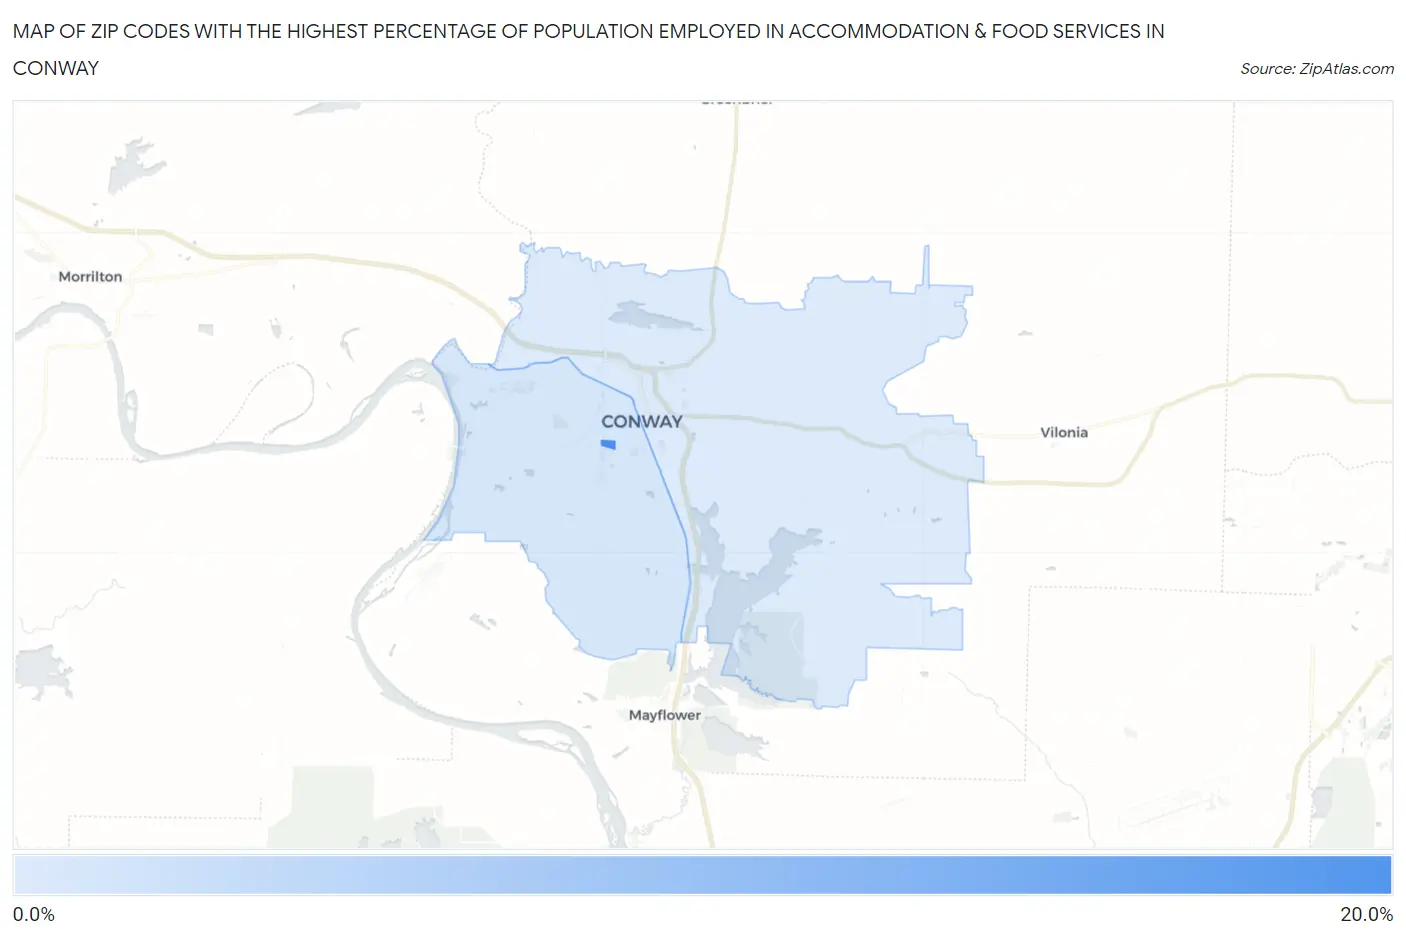
Map of Zip Codes with the Highest Percentage of Population Employed in Accommodation & Food Services in Conway
8.7%
19.1%
Zip Codes with the Highest Percentage of Population Employed in Accommodation & Food Services in Conway, AR
| Zip Code | % Employed | vs State | vs National | |
| 1. | 72035 | 19.1% | 6.6%(+12.4)#22 | 6.9%(+12.2)#942 |
| 2. | 72034 | 9.2% | 6.6%(+2.61)#88 | 6.9%(+2.36)#5,588 |
| 3. | 72032 | 8.7% | 6.6%(+2.09)#97 | 6.9%(+1.85)#6,426 |
1
Common Questions
What are the Top Zip Codes with the Highest Percentage of Population Employed in Accommodation & Food Services in Conway, AR?
Top Zip Codes with the Highest Percentage of Population Employed in Accommodation & Food Services in Conway, AR are:
What zip code has the Highest Percentage of Population Employed in Accommodation & Food Services in Conway, AR?
72035 has the Highest Percentage of Population Employed in Accommodation & Food Services in Conway, AR with 19.1%.
What is the Percentage of Population Employed in Accommodation & Food Services in Conway, AR?
Percentage of Population Employed in Accommodation & Food Services in Conway is 9.7%.
What is the Percentage of Population Employed in Accommodation & Food Services in Arkansas?
Percentage of Population Employed in Accommodation & Food Services in Arkansas is 6.6%.
What is the Percentage of Population Employed in Accommodation & Food Services in the United States?
Percentage of Population Employed in Accommodation & Food Services in the United States is 6.9%.