Zip Codes with the Highest Percentage of Population Taking Taxi / Cab to Work in Conway, AR
RELATED REPORTS & OPTIONS
Taxi / Cab
Conway
Compare Zip Codes
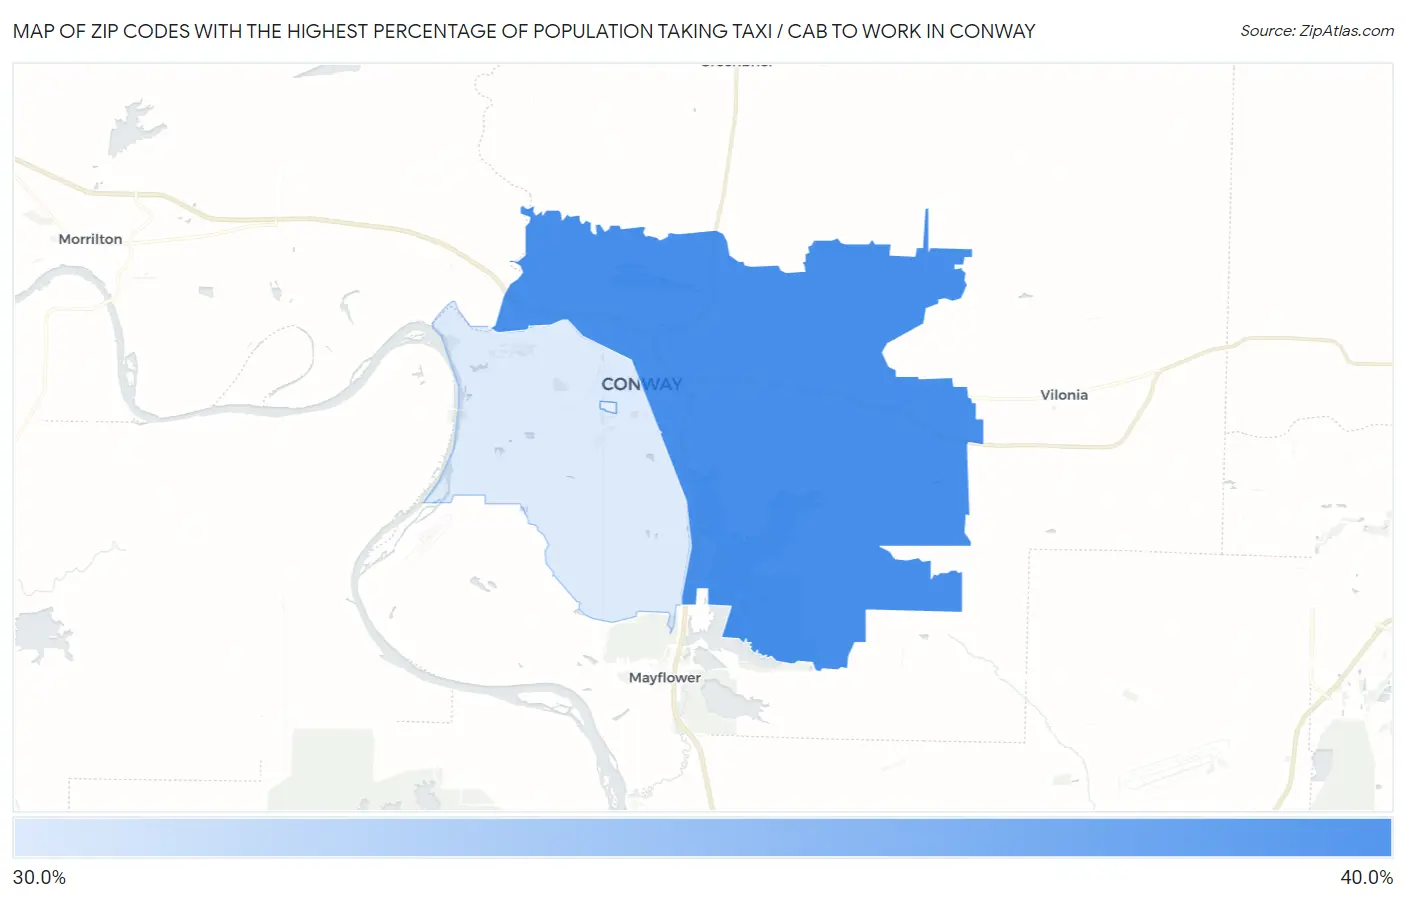
Map of Zip Codes with the Highest Percentage of Population Taking Taxi / Cab to Work in Conway
34.1%
40.0%
Zip Codes with the Highest Percentage of Population Taking Taxi / Cab to Work in Conway, AR
| Zip Code | % Take Taxi / Cab | vs State | vs National | |
| 1. | 72032 | 40.0% | 40.0%(=0.000)#54 | 38.2%(+1.80)#6,616 |
| 2. | 72034 | 34.1% | 40.0%(-5.90)#76 | 38.2%(-4.10)#9,304 |
1
Common Questions
What are the Top Zip Codes with the Highest Percentage of Population Taking Taxi / Cab to Work in Conway, AR?
Top Zip Codes with the Highest Percentage of Population Taking Taxi / Cab to Work in Conway, AR are:
What zip code has the Highest Percentage of Population Taking Taxi / Cab to Work in Conway, AR?
72032 has the Highest Percentage of Population Taking Taxi / Cab to Work in Conway, AR with 40.0%.
What is the Percentage of Population Taking Taxi / Cab to Work in Conway, AR?
Percentage of Population Taking Taxi / Cab to Work in Conway is 26.8%.
What is the Percentage of Population Taking Taxi / Cab to Work in Arkansas?
Percentage of Population Taking Taxi / Cab to Work in Arkansas is 40.0%.
What is the Percentage of Population Taking Taxi / Cab to Work in the United States?
Percentage of Population Taking Taxi / Cab to Work in the United States is 38.2%.