Zip Codes with the Highest Percentage of Population with a Degree in Liberal Arts and History in Conway, AR
RELATED REPORTS & OPTIONS
Liberal Arts and History
Conway
Compare Zip Codes
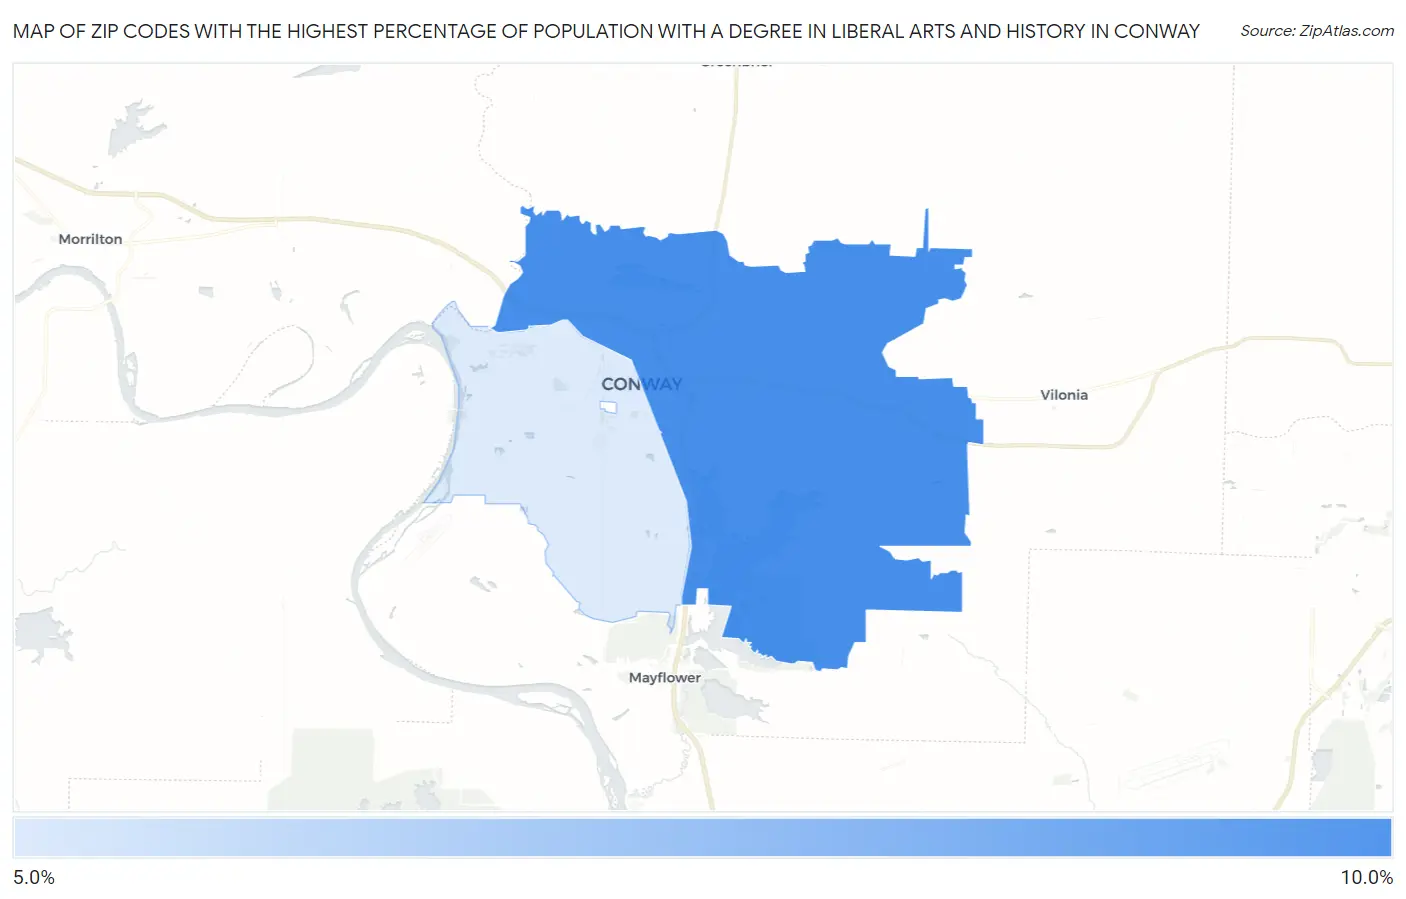
Map of Zip Codes with the Highest Percentage of Population with a Degree in Liberal Arts and History in Conway
5.1%
9.0%
Zip Codes with the Highest Percentage of Population with a Degree in Liberal Arts and History in Conway, AR
| Zip Code | % Graduates | vs State | vs National | |
| 1. | 72032 | 9.0% | 4.9%(+4.08)#74 | 4.9%(+4.11)#3,878 |
| 2. | 72034 | 5.1% | 4.9%(+0.186)#165 | 4.9%(+0.215)#11,077 |
1
Common Questions
What are the Top Zip Codes with the Highest Percentage of Population with a Degree in Liberal Arts and History in Conway, AR?
Top Zip Codes with the Highest Percentage of Population with a Degree in Liberal Arts and History in Conway, AR are:
What zip code has the Highest Percentage of Population with a Degree in Liberal Arts and History in Conway, AR?
72032 has the Highest Percentage of Population with a Degree in Liberal Arts and History in Conway, AR with 9.0%.
What is the Percentage of Population with a Degree in Liberal Arts and History in Conway, AR?
Percentage of Population with a Degree in Liberal Arts and History in Conway is 5.6%.
What is the Percentage of Population with a Degree in Liberal Arts and History in Arkansas?
Percentage of Population with a Degree in Liberal Arts and History in Arkansas is 4.9%.
What is the Percentage of Population with a Degree in Liberal Arts and History in the United States?
Percentage of Population with a Degree in Liberal Arts and History in the United States is 4.9%.