Dayton, TN Map & Demographics
Dayton Map
Dayton Overview
$22,801
PER CAPITA INCOME
$56,922
AVG FAMILY INCOME
$54,511
AVG HOUSEHOLD INCOME
24.4%
WAGE / INCOME GAP [ % ]
75.6¢/ $1
WAGE / INCOME GAP [ $ ]
0.46
INEQUALITY / GINI INDEX
7,139
TOTAL POPULATION
3,526
MALE POPULATION
3,613
FEMALE POPULATION
97.59
MALES / 100 FEMALES
102.47
FEMALES / 100 MALES
34.6
MEDIAN AGE
2.8
AVG FAMILY SIZE
2.5
AVG HOUSEHOLD SIZE
3,105
LABOR FORCE [ PEOPLE ]
52.8%
PERCENT IN LABOR FORCE
6.0%
UNEMPLOYMENT RATE
Dayton Zip Codes
Dayton Area Codes
Income in Dayton
Income Overview in Dayton
Per Capita Income in Dayton is $22,801, while median incomes of families and households are $56,922 and $54,511 respectively.
| Characteristic | Number | Measure |
| Per Capita Income | 7,139 | $22,801 |
| Median Family Income | 1,969 | $56,922 |
| Mean Family Income | 1,969 | $71,498 |
| Median Household Income | 2,594 | $54,511 |
| Mean Household Income | 2,594 | $65,328 |
| Income Deficit | 1,969 | $0 |
| Wage / Income Gap (%) | 7,139 | 24.45% |
| Wage / Income Gap ($) | 7,139 | 75.55¢ per $1 |
| Gini / Inequality Index | 7,139 | 0.46 |
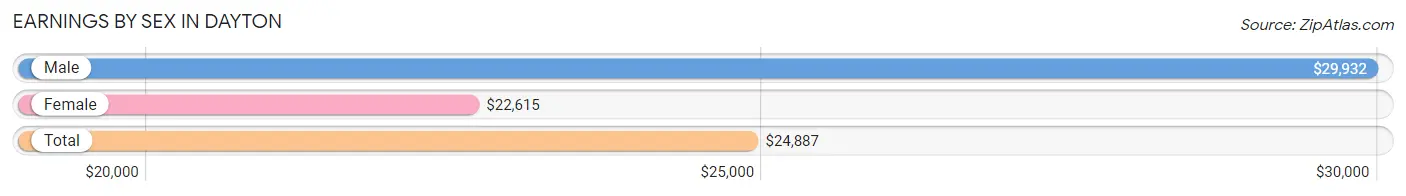
Earnings by Sex in Dayton
Average Earnings in Dayton are $24,887, $29,932 for men and $22,615 for women, a difference of 24.4%.
| Sex | Number | Average Earnings |
| Male | 1,972 (59.9%) | $29,932 |
| Female | 1,321 (40.1%) | $22,615 |
| Total | 3,293 (100.0%) | $24,887 |
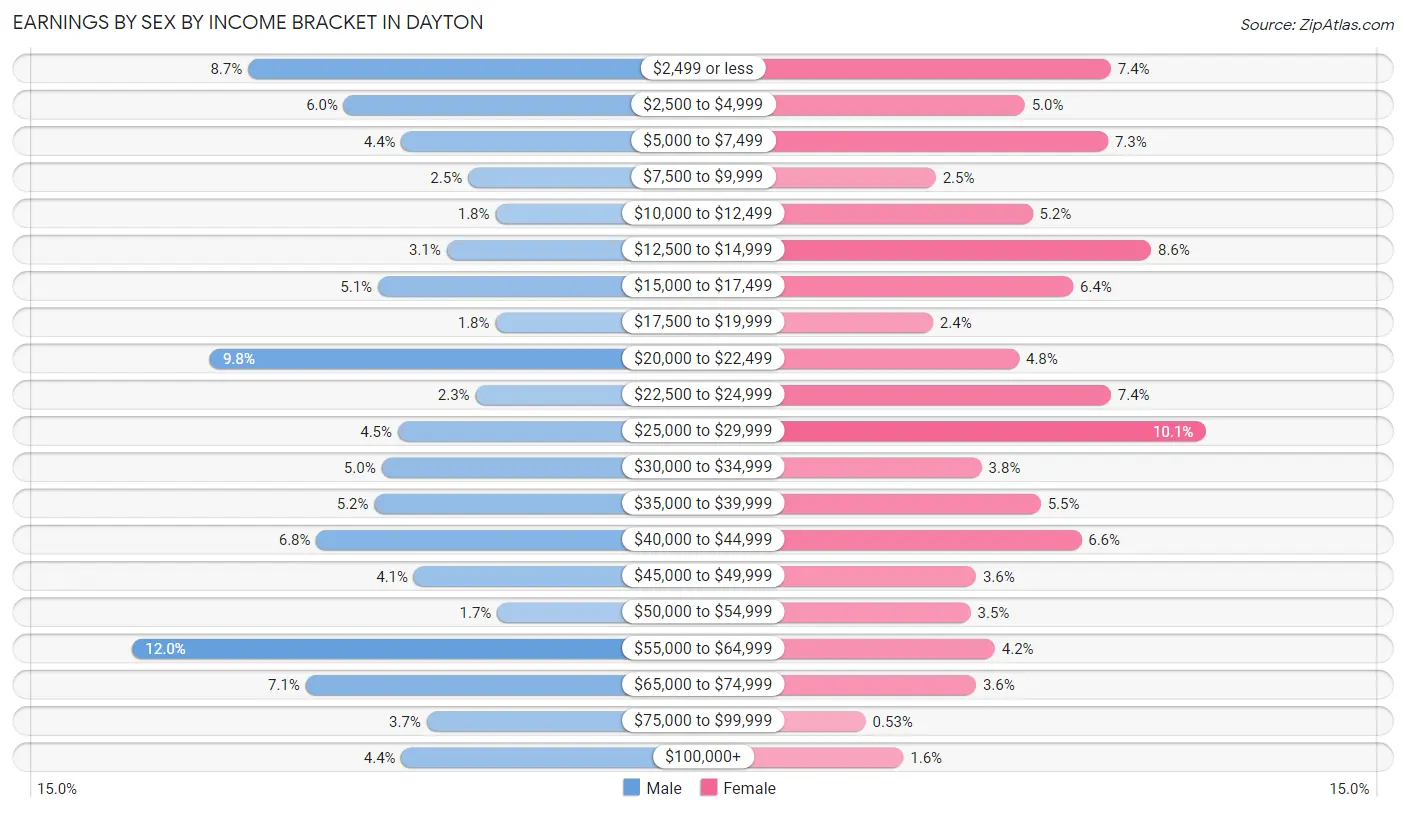
Earnings by Sex by Income Bracket in Dayton
The most common earnings brackets in Dayton are $55,000 to $64,999 for men (236 | 12.0%) and $25,000 to $29,999 for women (133 | 10.1%).
| Income | Male | Female |
| $2,499 or less | 172 (8.7%) | 98 (7.4%) |
| $2,500 to $4,999 | 119 (6.0%) | 66 (5.0%) |
| $5,000 to $7,499 | 87 (4.4%) | 97 (7.3%) |
| $7,500 to $9,999 | 50 (2.5%) | 33 (2.5%) |
| $10,000 to $12,499 | 35 (1.8%) | 69 (5.2%) |
| $12,500 to $14,999 | 62 (3.1%) | 113 (8.6%) |
| $15,000 to $17,499 | 100 (5.1%) | 84 (6.4%) |
| $17,500 to $19,999 | 35 (1.8%) | 32 (2.4%) |
| $20,000 to $22,499 | 193 (9.8%) | 64 (4.8%) |
| $22,500 to $24,999 | 46 (2.3%) | 98 (7.4%) |
| $25,000 to $29,999 | 89 (4.5%) | 133 (10.1%) |
| $30,000 to $34,999 | 98 (5.0%) | 50 (3.8%) |
| $35,000 to $39,999 | 102 (5.2%) | 72 (5.4%) |
| $40,000 to $44,999 | 134 (6.8%) | 87 (6.6%) |
| $45,000 to $49,999 | 80 (4.1%) | 48 (3.6%) |
| $50,000 to $54,999 | 34 (1.7%) | 46 (3.5%) |
| $55,000 to $64,999 | 236 (12.0%) | 55 (4.2%) |
| $65,000 to $74,999 | 140 (7.1%) | 48 (3.6%) |
| $75,000 to $99,999 | 73 (3.7%) | 7 (0.5%) |
| $100,000+ | 87 (4.4%) | 21 (1.6%) |
| Total | 1,972 (100.0%) | 1,321 (100.0%) |
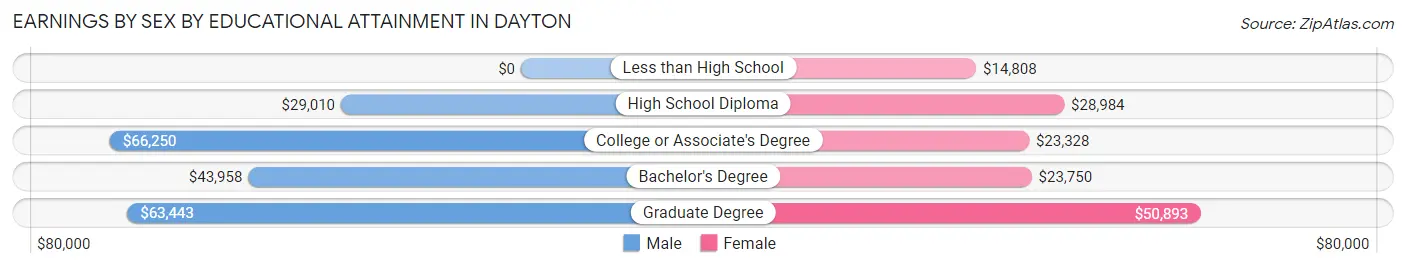
Earnings by Sex by Educational Attainment in Dayton
Average earnings in Dayton are $43,458 for men and $24,375 for women, a difference of 43.9%. Men with an educational attainment of college or associate's degree enjoy the highest average annual earnings of $66,250, while those with high school diploma education earn the least with $29,010. Women with an educational attainment of graduate degree earn the most with the average annual earnings of $50,893, while those with less than high school education have the smallest earnings of $14,808.
| Educational Attainment | Male Income | Female Income |
| Less than High School | - | - |
| High School Diploma | $29,010 | $28,984 |
| College or Associate's Degree | $66,250 | $23,328 |
| Bachelor's Degree | $43,958 | $23,750 |
| Graduate Degree | $63,443 | $50,893 |
| Total | $43,458 | $24,375 |
Family Income in Dayton
Family Income Brackets in Dayton
According to the Dayton family income data, there are 620 families falling into the $50,000 to $74,999 income range, which is the most common income bracket and makes up 31.5% of all families. Conversely, the $150,000 to $199,999 income bracket is the least frequent group with only 43 families (2.2%) belonging to this category.
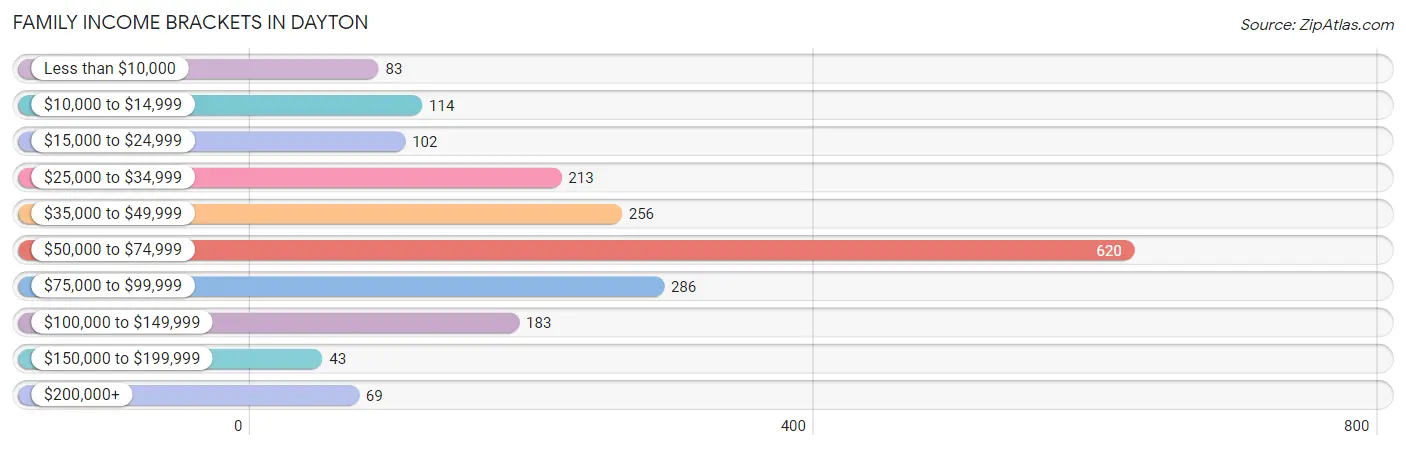
| Income Bracket | # Families | % Families |
| Less than $10,000 | 83 | 4.2% |
| $10,000 to $14,999 | 114 | 5.8% |
| $15,000 to $24,999 | 102 | 5.2% |
| $25,000 to $34,999 | 213 | 10.8% |
| $35,000 to $49,999 | 256 | 13.0% |
| $50,000 to $74,999 | 620 | 31.5% |
| $75,000 to $99,999 | 286 | 14.5% |
| $100,000 to $149,999 | 183 | 9.3% |
| $150,000 to $199,999 | 43 | 2.2% |
| $200,000+ | 69 | 3.5% |
Family Income by Famaliy Size in Dayton
5-person families (110 | 5.6%) account for the highest median family income in Dayton with $86,154 per family, while 2-person families (900 | 45.7%) have the highest median income of $31,425 per family member.
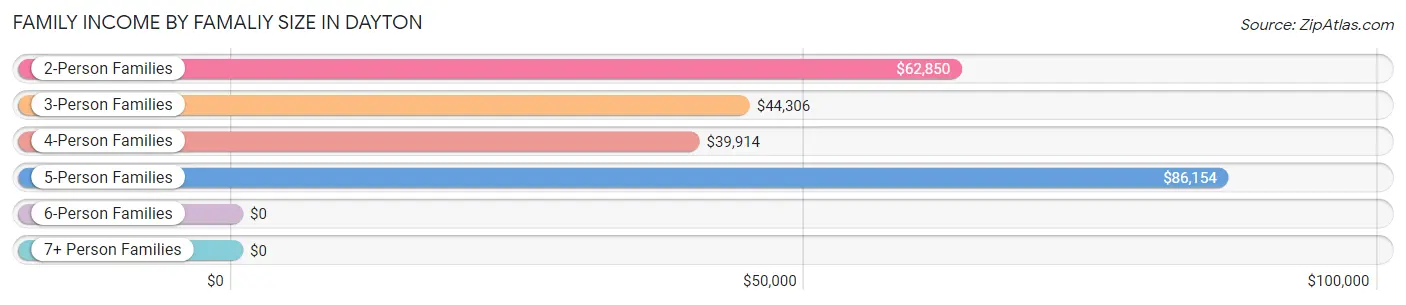
| Income Bracket | # Families | Median Income |
| 2-Person Families | 900 (45.7%) | $62,850 |
| 3-Person Families | 526 (26.7%) | $44,306 |
| 4-Person Families | 370 (18.8%) | $39,914 |
| 5-Person Families | 110 (5.6%) | $86,154 |
| 6-Person Families | 63 (3.2%) | $0 |
| 7+ Person Families | 0 (0.0%) | $0 |
| Total | 1,969 (100.0%) | $56,922 |
Family Income by Number of Earners in Dayton
The median family income in Dayton is $56,922, with families comprising 3+ earners (173) having the highest median family income of $86,699, while families with no earners (467) have the lowest median family income of $30,430, accounting for 8.8% and 23.7% of families, respectively.
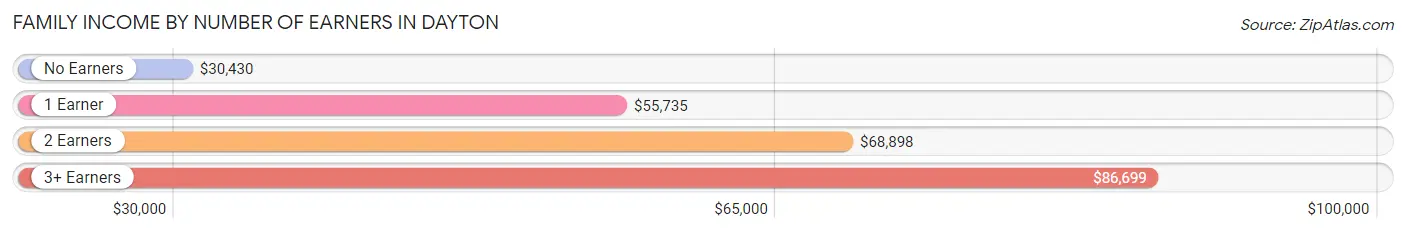
| Number of Earners | # Families | Median Income |
| No Earners | 467 (23.7%) | $30,430 |
| 1 Earner | 692 (35.1%) | $55,735 |
| 2 Earners | 637 (32.4%) | $68,898 |
| 3+ Earners | 173 (8.8%) | $86,699 |
| Total | 1,969 (100.0%) | $56,922 |
Household Income in Dayton
Household Income Brackets in Dayton
With 638 households falling in the category, the $50,000 to $74,999 income range is the most frequent in Dayton, accounting for 24.6% of all households. In contrast, only 44 households (1.7%) fall into the $150,000 to $199,999 income bracket, making it the least populous group.
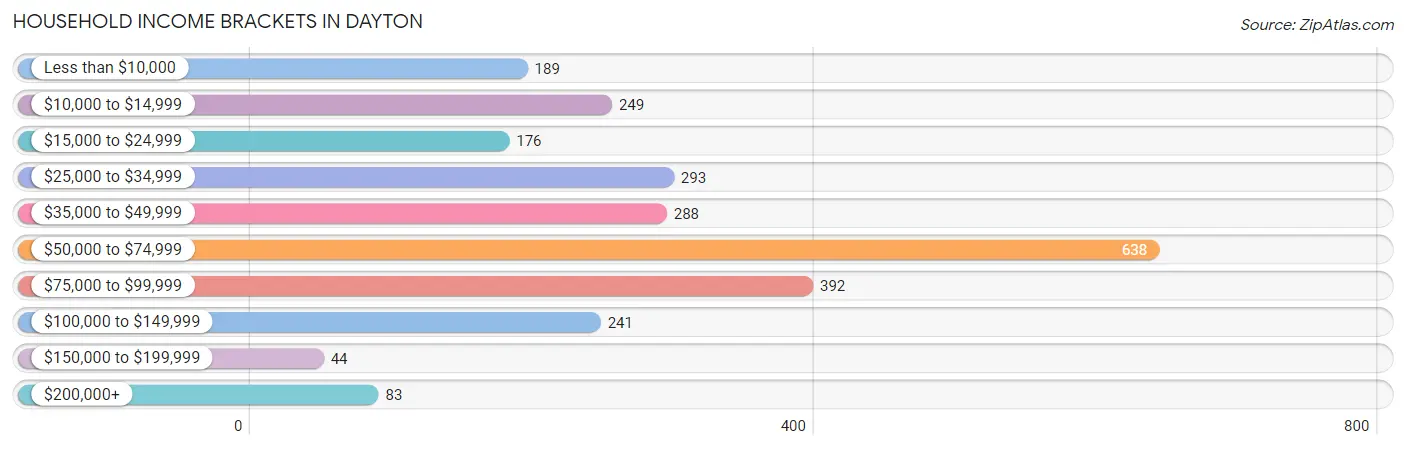
| Income Bracket | # Households | % Households |
| Less than $10,000 | 189 | 7.3% |
| $10,000 to $14,999 | 249 | 9.6% |
| $15,000 to $24,999 | 176 | 6.8% |
| $25,000 to $34,999 | 293 | 11.3% |
| $35,000 to $49,999 | 288 | 11.1% |
| $50,000 to $74,999 | 638 | 24.6% |
| $75,000 to $99,999 | 392 | 15.1% |
| $100,000 to $149,999 | 241 | 9.3% |
| $150,000 to $199,999 | 44 | 1.7% |
| $200,000+ | 83 | 3.2% |
Household Income by Householder Age in Dayton
The median household income in Dayton is $54,511, with the highest median household income of $63,852 found in the 15 to 24 years age bracket for the primary householder. A total of 296 households (11.4%) fall into this category. Meanwhile, the 65+ years age bracket for the primary householder has the lowest median household income of $43,632, with 806 households (31.1%) in this group.
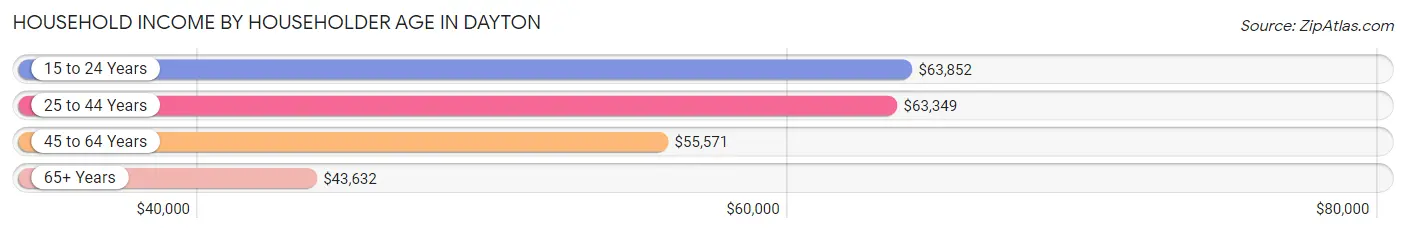
| Income Bracket | # Households | Median Income |
| 15 to 24 Years | 296 (11.4%) | $63,852 |
| 25 to 44 Years | 766 (29.5%) | $63,349 |
| 45 to 64 Years | 726 (28.0%) | $55,571 |
| 65+ Years | 806 (31.1%) | $43,632 |
| Total | 2,594 (100.0%) | $54,511 |
Poverty in Dayton
Income Below Poverty by Sex and Age in Dayton
With 17.8% poverty level for males and 23.3% for females among the residents of Dayton, 16 and 17 year old males and under 5 year old females are the most vulnerable to poverty, with 63 males (55.7%) and 131 females (62.7%) in their respective age groups living below the poverty level.
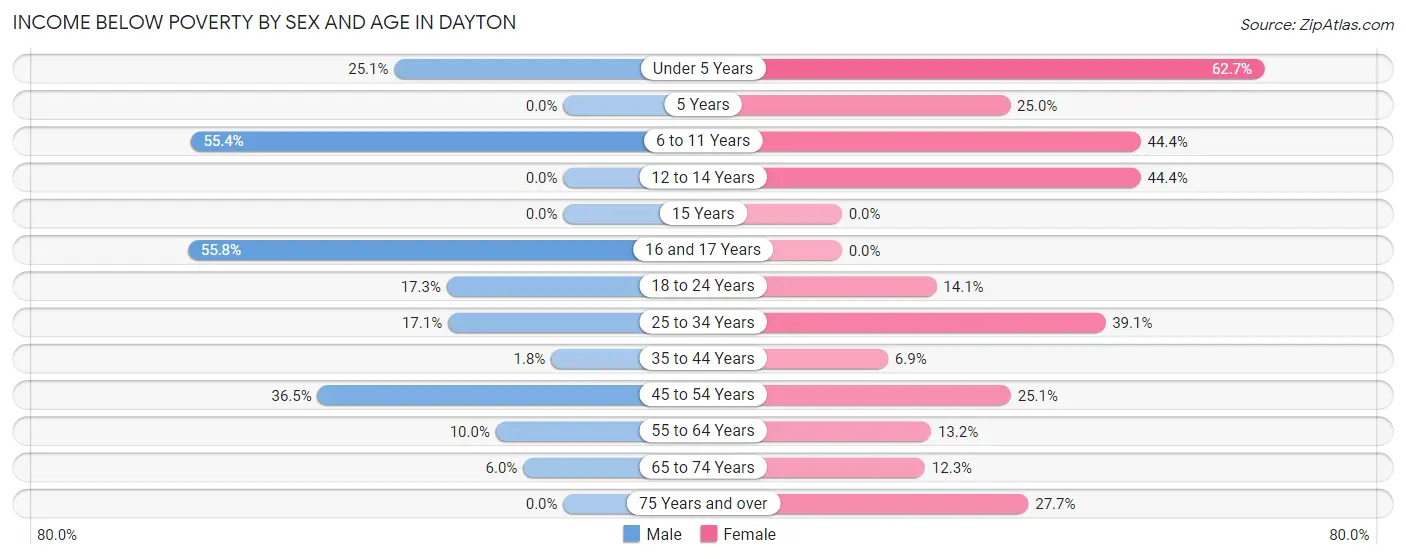
| Age Bracket | Male | Female |
| Under 5 Years | 58 (25.1%) | 131 (62.7%) |
| 5 Years | 0 (0.0%) | 8 (25.0%) |
| 6 to 11 Years | 98 (55.4%) | 79 (44.4%) |
| 12 to 14 Years | 0 (0.0%) | 67 (44.4%) |
| 15 Years | 0 (0.0%) | 0 (0.0%) |
| 16 and 17 Years | 63 (55.7%) | 0 (0.0%) |
| 18 to 24 Years | 80 (17.3%) | 51 (14.1%) |
| 25 to 34 Years | 104 (17.1%) | 151 (39.1%) |
| 35 to 44 Years | 9 (1.8%) | 33 (6.9%) |
| 45 to 54 Years | 119 (36.5%) | 73 (25.1%) |
| 55 to 64 Years | 27 (10.0%) | 58 (13.2%) |
| 65 to 74 Years | 16 (6.0%) | 67 (12.3%) |
| 75 Years and over | 0 (0.0%) | 67 (27.7%) |
| Total | 574 (17.8%) | 785 (23.3%) |
Income Above Poverty by Sex and Age in Dayton
According to the poverty statistics in Dayton, males aged 12 to 14 years and females aged 15 years are the age groups that are most secure financially, with 100.0% of males and 100.0% of females in these age groups living above the poverty line.
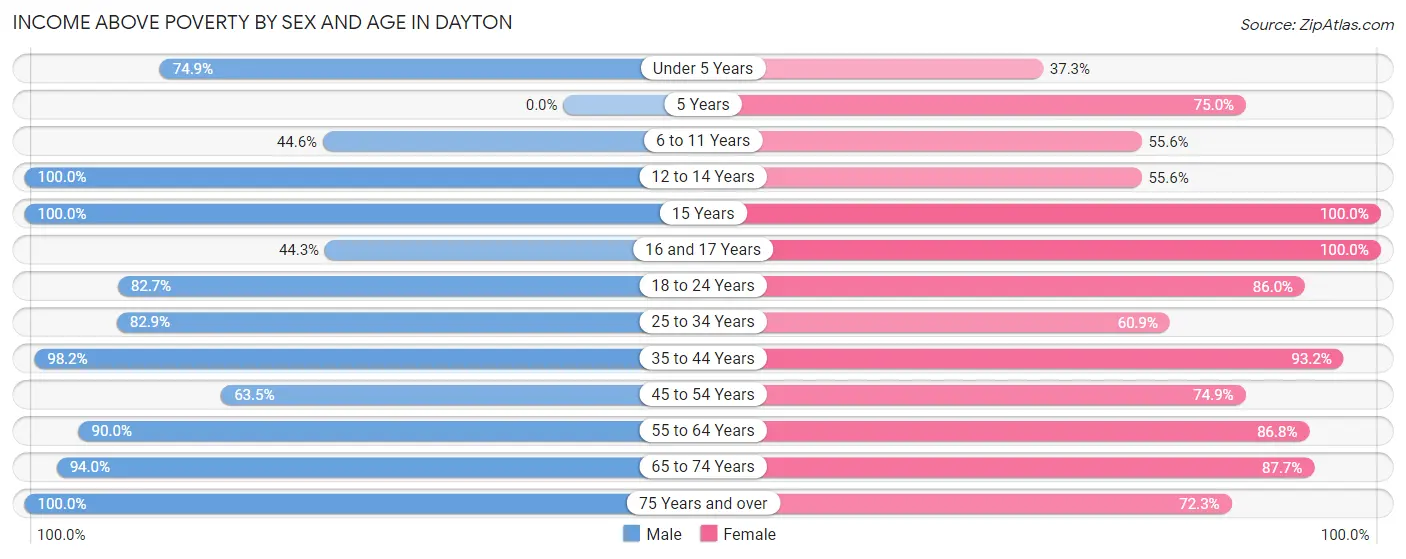
| Age Bracket | Male | Female |
| Under 5 Years | 173 (74.9%) | 78 (37.3%) |
| 5 Years | 0 (0.0%) | 24 (75.0%) |
| 6 to 11 Years | 79 (44.6%) | 99 (55.6%) |
| 12 to 14 Years | 150 (100.0%) | 84 (55.6%) |
| 15 Years | 35 (100.0%) | 39 (100.0%) |
| 16 and 17 Years | 50 (44.3%) | 11 (100.0%) |
| 18 to 24 Years | 382 (82.7%) | 312 (86.0%) |
| 25 to 34 Years | 503 (82.9%) | 235 (60.9%) |
| 35 to 44 Years | 488 (98.2%) | 449 (93.1%) |
| 45 to 54 Years | 207 (63.5%) | 218 (74.9%) |
| 55 to 64 Years | 242 (90.0%) | 380 (86.8%) |
| 65 to 74 Years | 252 (94.0%) | 476 (87.7%) |
| 75 Years and over | 94 (100.0%) | 175 (72.3%) |
| Total | 2,655 (82.2%) | 2,580 (76.7%) |
Income Below Poverty Among Married-Couple Families in Dayton
The poverty statistics for married-couple families in Dayton show that 2.8% or 33 of the total 1,181 families live below the poverty line. Families with 1 or 2 children have the highest poverty rate of 11.6%, comprising of 33 families. On the other hand, families with no children have the lowest poverty rate of 0.0%, which includes 0 families.
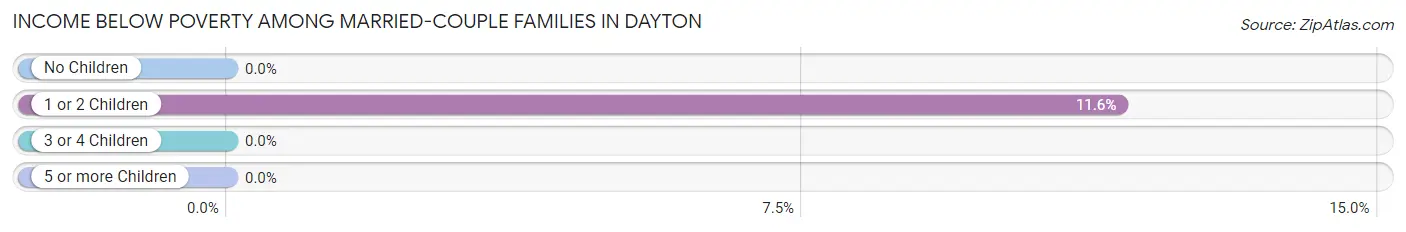
| Children | Above Poverty | Below Poverty |
| No Children | 840 (100.0%) | 0 (0.0%) |
| 1 or 2 Children | 251 (88.4%) | 33 (11.6%) |
| 3 or 4 Children | 57 (100.0%) | 0 (0.0%) |
| 5 or more Children | 0 (0.0%) | 0 (0.0%) |
| Total | 1,148 (97.2%) | 33 (2.8%) |
Income Below Poverty Among Single-Parent Households in Dayton
According to the poverty data in Dayton, 14.5% or 9 single-father households and 32.4% or 235 single-mother households are living below the poverty line. Among single-father households, those with 1 or 2 children have the highest poverty rate, with 9 households (100.0%) experiencing poverty. Likewise, among single-mother households, those with 3 or 4 children have the highest poverty rate, with 59 households (100.0%) falling below the poverty line.
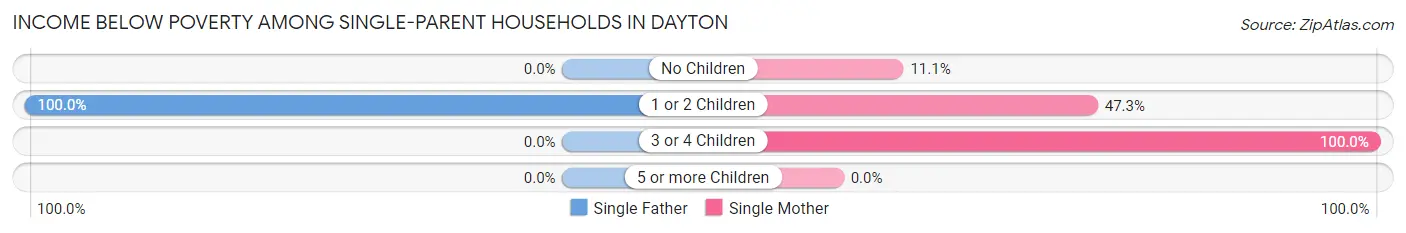
| Children | Single Father | Single Mother |
| No Children | 0 (0.0%) | 43 (11.1%) |
| 1 or 2 Children | 9 (100.0%) | 133 (47.3%) |
| 3 or 4 Children | 0 (0.0%) | 59 (100.0%) |
| 5 or more Children | 0 (0.0%) | 0 (0.0%) |
| Total | 9 (14.5%) | 235 (32.4%) |
Income Below Poverty Among Married-Couple vs Single-Parent Households in Dayton
The poverty data for Dayton shows that 33 of the married-couple family households (2.8%) and 244 of the single-parent households (31.0%) are living below the poverty level. Within the married-couple family households, those with 1 or 2 children have the highest poverty rate, with 33 households (11.6%) falling below the poverty line. Among the single-parent households, those with 3 or 4 children have the highest poverty rate, with 59 household (100.0%) living below poverty.
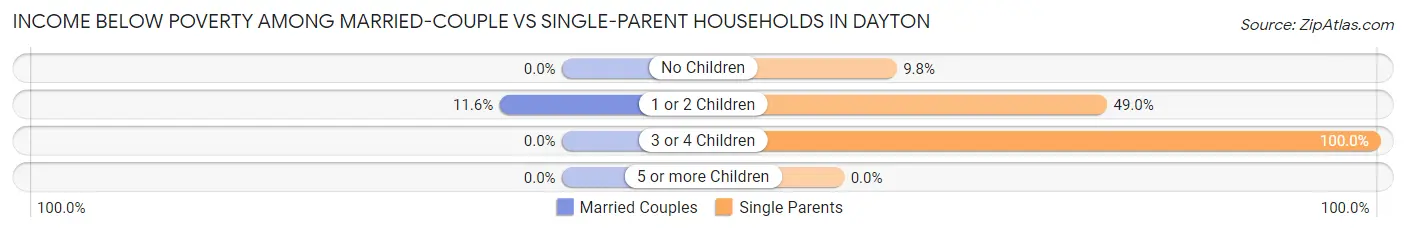
| Children | Married-Couple Families | Single-Parent Households |
| No Children | 0 (0.0%) | 43 (9.8%) |
| 1 or 2 Children | 33 (11.6%) | 142 (49.0%) |
| 3 or 4 Children | 0 (0.0%) | 59 (100.0%) |
| 5 or more Children | 0 (0.0%) | 0 (0.0%) |
| Total | 33 (2.8%) | 244 (31.0%) |
Race in Dayton
The most populous races in Dayton are White / Caucasian (6,133 | 85.9%), Hispanic or Latino (468 | 6.6%), and Two or more Races (368 | 5.1%).
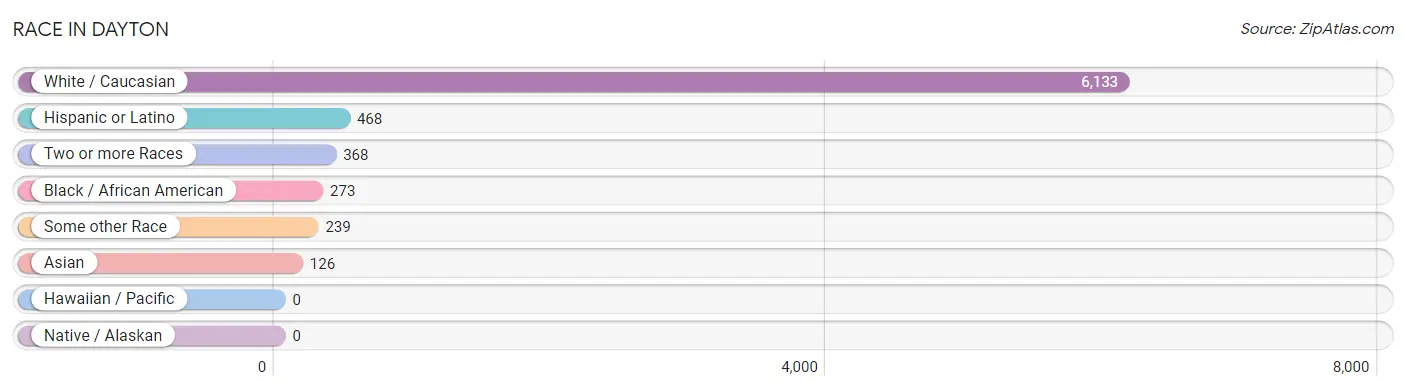
| Race | # Population | % Population |
| Asian | 126 | 1.8% |
| Black / African American | 273 | 3.8% |
| Hawaiian / Pacific | 0 | 0.0% |
| Hispanic or Latino | 468 | 6.6% |
| Native / Alaskan | 0 | 0.0% |
| White / Caucasian | 6,133 | 85.9% |
| Two or more Races | 368 | 5.1% |
| Some other Race | 239 | 3.4% |
| Total | 7,139 | 100.0% |
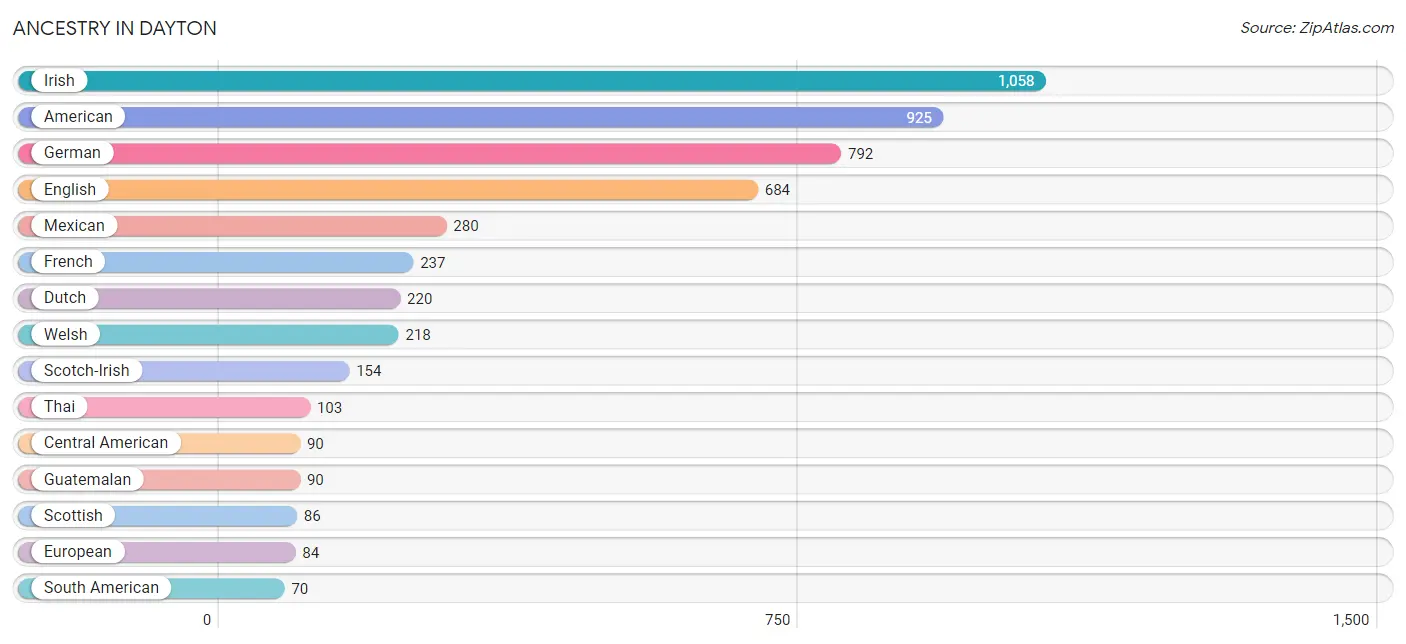
Ancestry in Dayton
The most populous ancestries reported in Dayton are Irish (1,058 | 14.8%), American (925 | 13.0%), German (792 | 11.1%), English (684 | 9.6%), and Mexican (280 | 3.9%), together accounting for 52.4% of all Dayton residents.
| Ancestry | # Population | % Population |
| American | 925 | 13.0% |
| Brazilian | 15 | 0.2% |
| British | 47 | 0.7% |
| Burmese | 23 | 0.3% |
| Canadian | 11 | 0.2% |
| Central American | 90 | 1.3% |
| Cherokee | 27 | 0.4% |
| Cuban | 3 | 0.0% |
| Danish | 25 | 0.4% |
| Dominican | 4 | 0.1% |
| Dutch | 220 | 3.1% |
| Ecuadorian | 66 | 0.9% |
| English | 684 | 9.6% |
| European | 84 | 1.2% |
| French | 237 | 3.3% |
| French Canadian | 7 | 0.1% |
| German | 792 | 11.1% |
| Guatemalan | 90 | 1.3% |
| Hungarian | 8 | 0.1% |
| Indian (Asian) | 7 | 0.1% |
| Irish | 1,058 | 14.8% |
| Israeli | 4 | 0.1% |
| Italian | 29 | 0.4% |
| Mexican | 280 | 3.9% |
| Northern European | 51 | 0.7% |
| Norwegian | 4 | 0.1% |
| Puerto Rican | 21 | 0.3% |
| Scandinavian | 40 | 0.6% |
| Scotch-Irish | 154 | 2.2% |
| Scottish | 86 | 1.2% |
| Sioux | 6 | 0.1% |
| Slovak | 8 | 0.1% |
| South American | 70 | 1.0% |
| Swedish | 7 | 0.1% |
| Swiss | 6 | 0.1% |
| Thai | 103 | 1.4% |
| Venezuelan | 4 | 0.1% |
| Welsh | 218 | 3.0% | View All 38 Rows |
Immigrants in Dayton
The most numerous immigrant groups reported in Dayton came from Latin America (408 | 5.7%), Central America (319 | 4.5%), Mexico (229 | 3.2%), Guatemala (90 | 1.3%), and South America (85 | 1.2%), together accounting for 15.8% of all Dayton residents.
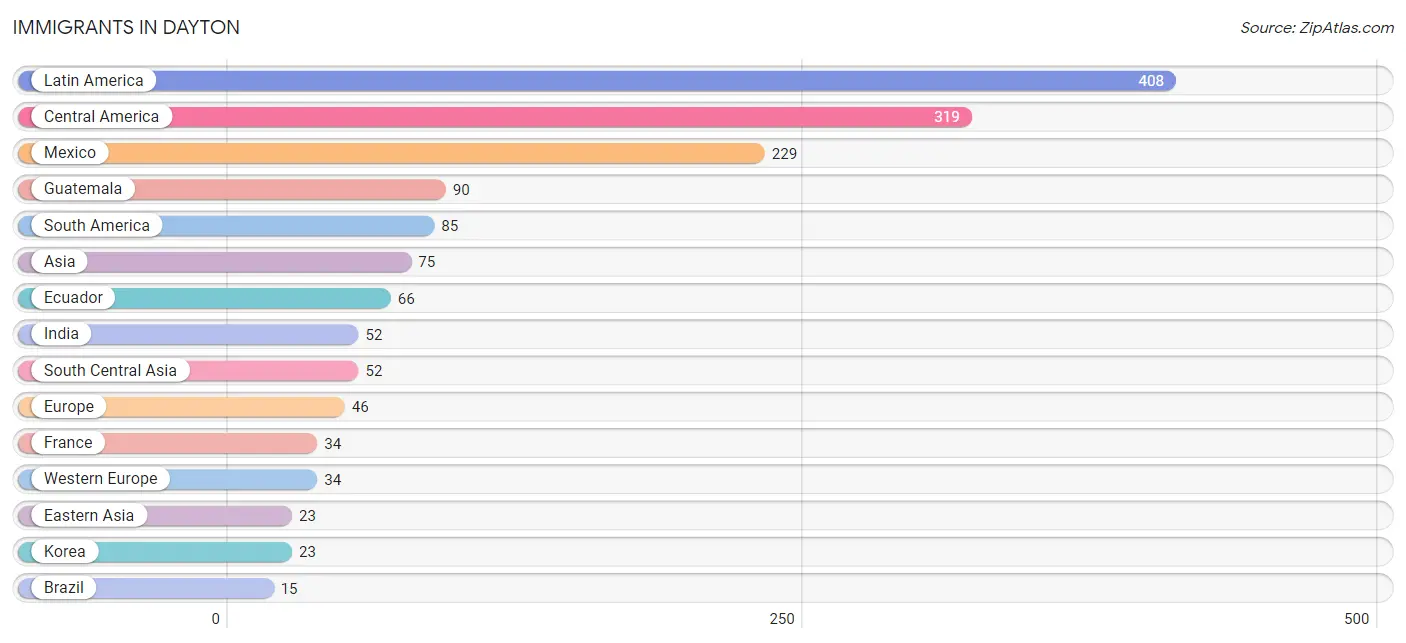
| Immigration Origin | # Population | % Population |
| Asia | 75 | 1.1% |
| Brazil | 15 | 0.2% |
| Canada | 11 | 0.2% |
| Caribbean | 4 | 0.1% |
| Central America | 319 | 4.5% |
| Denmark | 4 | 0.1% |
| Dominican Republic | 4 | 0.1% |
| Eastern Asia | 23 | 0.3% |
| Ecuador | 66 | 0.9% |
| England | 4 | 0.1% |
| Europe | 46 | 0.6% |
| France | 34 | 0.5% |
| Guatemala | 90 | 1.3% |
| India | 52 | 0.7% |
| Korea | 23 | 0.3% |
| Latin America | 408 | 5.7% |
| Mexico | 229 | 3.2% |
| Northern Europe | 12 | 0.2% |
| South America | 85 | 1.2% |
| South Central Asia | 52 | 0.7% |
| Venezuela | 4 | 0.1% |
| Western Europe | 34 | 0.5% | View All 22 Rows |
Sex and Age in Dayton
Sex and Age in Dayton
The most populous age groups in Dayton are 20 to 24 Years (464 | 13.2%) for men and 20 to 24 Years (420 | 11.6%) for women.
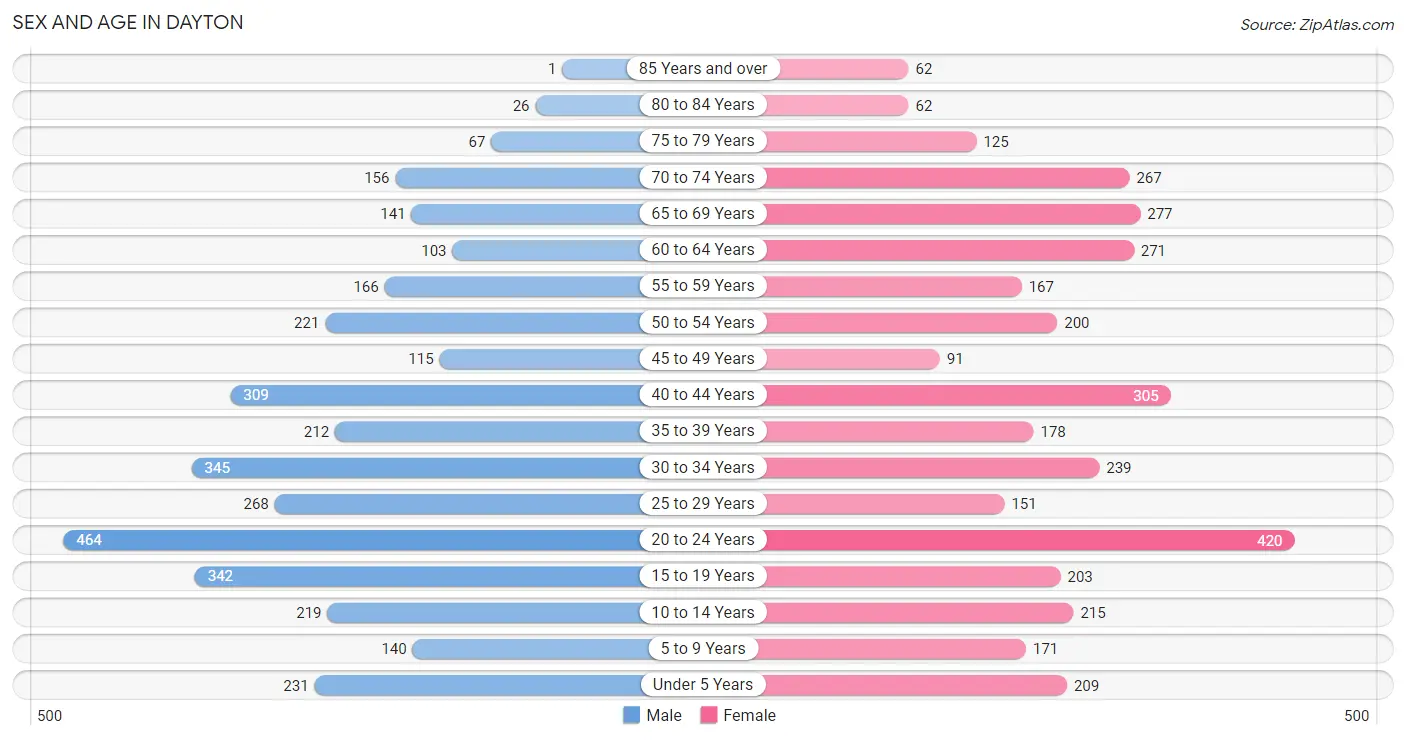
| Age Bracket | Male | Female |
| Under 5 Years | 231 (6.6%) | 209 (5.8%) |
| 5 to 9 Years | 140 (4.0%) | 171 (4.7%) |
| 10 to 14 Years | 219 (6.2%) | 215 (5.9%) |
| 15 to 19 Years | 342 (9.7%) | 203 (5.6%) |
| 20 to 24 Years | 464 (13.2%) | 420 (11.6%) |
| 25 to 29 Years | 268 (7.6%) | 151 (4.2%) |
| 30 to 34 Years | 345 (9.8%) | 239 (6.6%) |
| 35 to 39 Years | 212 (6.0%) | 178 (4.9%) |
| 40 to 44 Years | 309 (8.8%) | 305 (8.4%) |
| 45 to 49 Years | 115 (3.3%) | 91 (2.5%) |
| 50 to 54 Years | 221 (6.3%) | 200 (5.5%) |
| 55 to 59 Years | 166 (4.7%) | 167 (4.6%) |
| 60 to 64 Years | 103 (2.9%) | 271 (7.5%) |
| 65 to 69 Years | 141 (4.0%) | 277 (7.7%) |
| 70 to 74 Years | 156 (4.4%) | 267 (7.4%) |
| 75 to 79 Years | 67 (1.9%) | 125 (3.5%) |
| 80 to 84 Years | 26 (0.7%) | 62 (1.7%) |
| 85 Years and over | 1 (0.0%) | 62 (1.7%) |
| Total | 3,526 (100.0%) | 3,613 (100.0%) |
Families and Households in Dayton
Median Family Size in Dayton
The median family size in Dayton is 2.83 persons per family, with single female/mother families (726 | 36.9%) accounting for the largest median family size of 2.93 persons per family. On the other hand, single male/father families (62 | 3.2%) represent the smallest median family size with 1.97 persons per family.
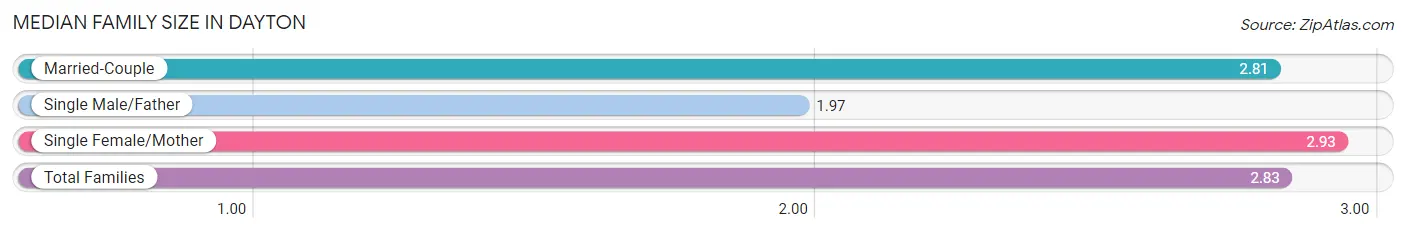
| Family Type | # Families | Family Size |
| Married-Couple | 1,181 (60.0%) | 2.81 |
| Single Male/Father | 62 (3.2%) | 1.97 |
| Single Female/Mother | 726 (36.9%) | 2.93 |
| Total Families | 1,969 (100.0%) | 2.83 |
Median Household Size in Dayton
The median household size in Dayton is 2.55 persons per household, with single female/mother households (726 | 28.0%) accounting for the largest median household size of 3.18 persons per household. non-family households (625 | 24.1%) represent the smallest median household size with 1.38 persons per household.
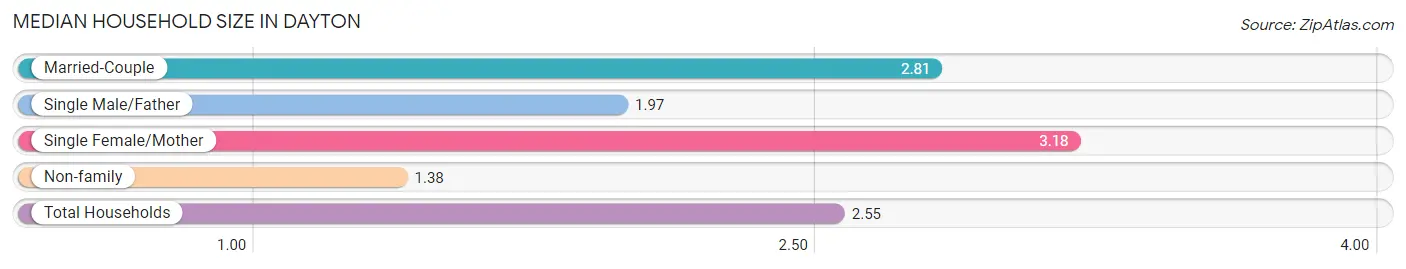
| Household Type | # Households | Household Size |
| Married-Couple | 1,181 (45.5%) | 2.81 |
| Single Male/Father | 62 (2.4%) | 1.97 |
| Single Female/Mother | 726 (28.0%) | 3.18 |
| Non-family | 625 (24.1%) | 1.38 |
| Total Households | 2,594 (100.0%) | 2.55 |
Household Size by Marriage Status in Dayton
Out of a total of 2,594 households in Dayton, 1,969 (75.9%) are family households, while 625 (24.1%) are nonfamily households. The most numerous type of family households are 2-person households, comprising 812, and the most common type of nonfamily households are 1-person households, comprising 491.
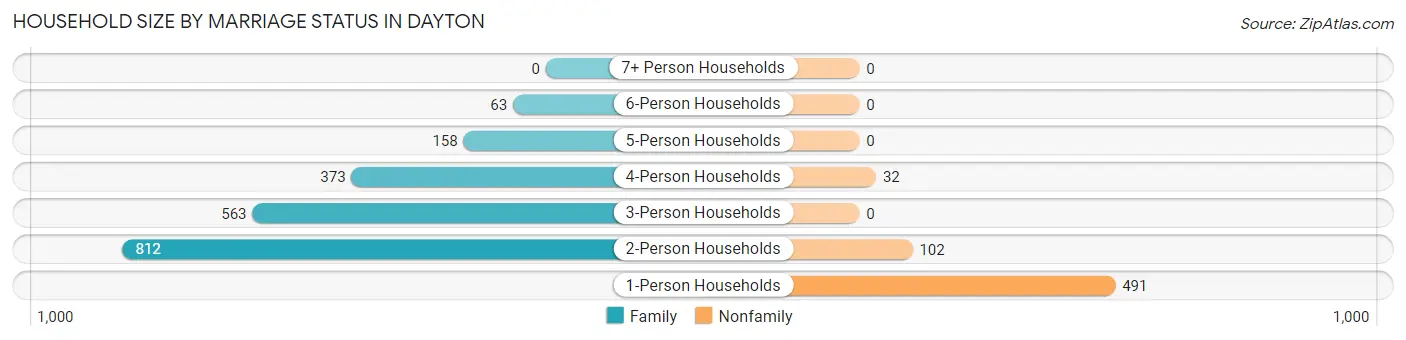
| Household Size | Family Households | Nonfamily Households |
| 1-Person Households | - | 491 (18.9%) |
| 2-Person Households | 812 (31.3%) | 102 (3.9%) |
| 3-Person Households | 563 (21.7%) | 0 (0.0%) |
| 4-Person Households | 373 (14.4%) | 32 (1.2%) |
| 5-Person Households | 158 (6.1%) | 0 (0.0%) |
| 6-Person Households | 63 (2.4%) | 0 (0.0%) |
| 7+ Person Households | 0 (0.0%) | 0 (0.0%) |
| Total | 1,969 (75.9%) | 625 (24.1%) |
Female Fertility in Dayton
Fertility by Age in Dayton
Average fertility rate in Dayton is 86.0 births per 1,000 women. Women in the age bracket of 20 to 34 years have the highest fertility rate with 173.0 births per 1,000 women. Women in the age bracket of 20 to 34 years acount for 100.0% of all women with births.
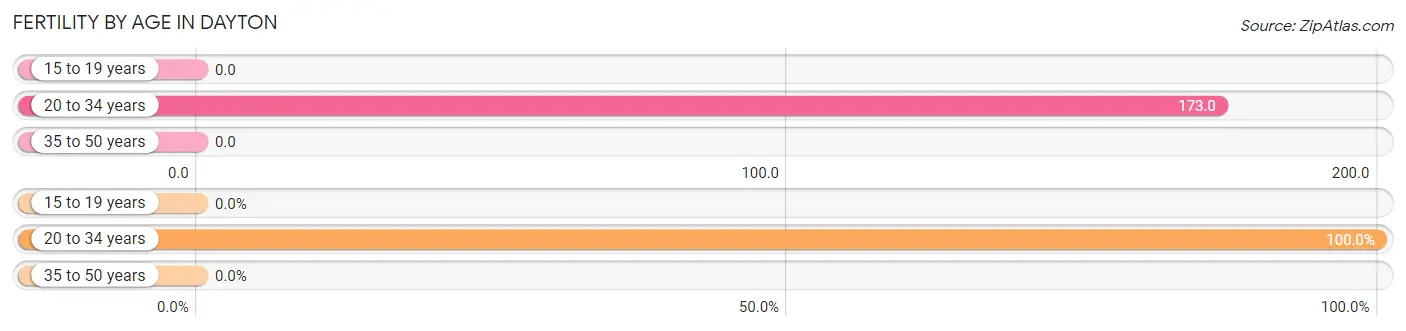
| Age Bracket | Women with Births | Births / 1,000 Women |
| 15 to 19 years | 0 (0.0%) | 0.0 |
| 20 to 34 years | 140 (100.0%) | 173.0 |
| 35 to 50 years | 0 (0.0%) | 0.0 |
| Total | 140 (100.0%) | 86.0 |
Fertility by Age by Marriage Status in Dayton
36.4% of women with births (140) in Dayton are married. The highest percentage of unmarried women with births falls into 20 to 34 years age bracket with 63.6% of them unmarried at the time of birth, while the lowest percentage of unmarried women with births belong to 20 to 34 years age bracket with 63.6% of them unmarried.
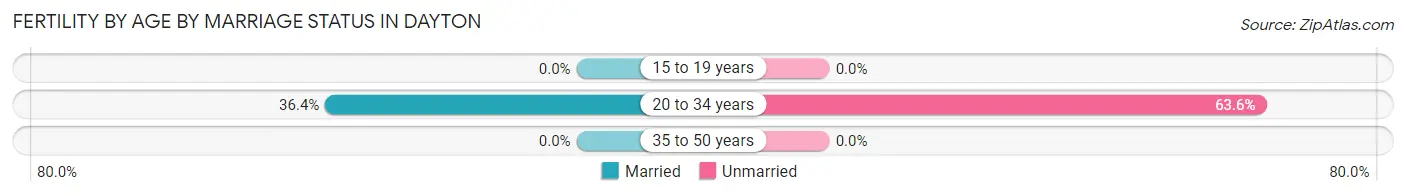
| Age Bracket | Married | Unmarried |
| 15 to 19 years | 0 (0.0%) | 0 (0.0%) |
| 20 to 34 years | 51 (36.4%) | 89 (63.6%) |
| 35 to 50 years | 0 (0.0%) | 0 (0.0%) |
| Total | 51 (36.4%) | 89 (63.6%) |
Fertility by Education in Dayton
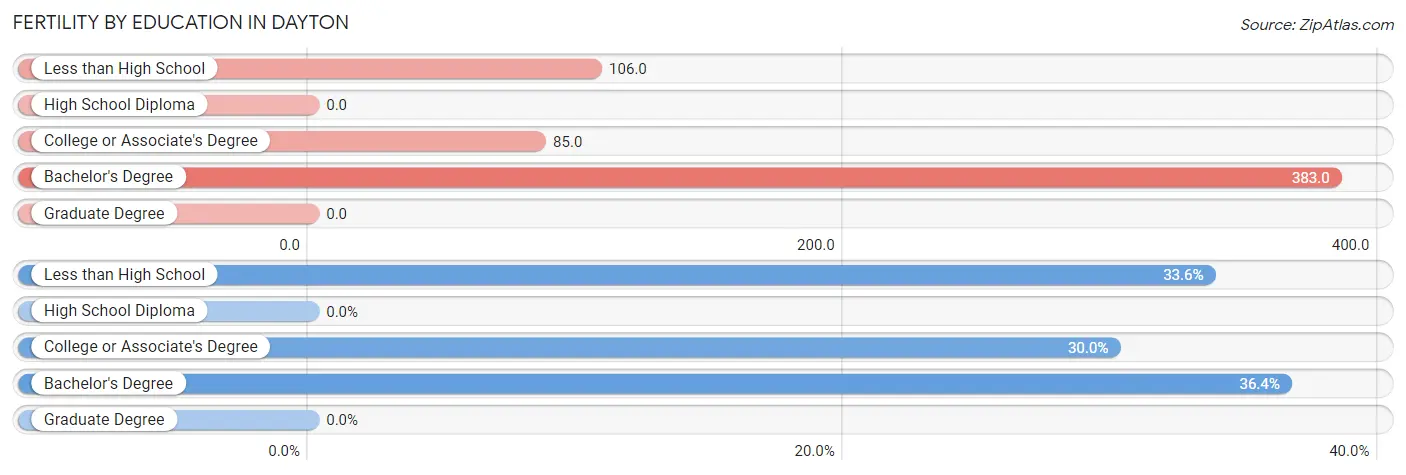
| Educational Attainment | Women with Births | Births / 1,000 Women |
| Less than High School | 47 (33.6%) | 106.0 |
| High School Diploma | 0 (0.0%) | 0.0 |
| College or Associate's Degree | 42 (30.0%) | 85.0 |
| Bachelor's Degree | 51 (36.4%) | 383.0 |
| Graduate Degree | 0 (0.0%) | 0.0 |
| Total | 140 (100.0%) | 86.0 |
Fertility by Education by Marriage Status in Dayton
63.6% of women with births in Dayton are unmarried. Women with the educational attainment of bachelor's degree are most likely to be married with 100.0% of them married at childbirth, while women with the educational attainment of less than high school are least likely to be married with 100.0% of them unmarried at childbirth.
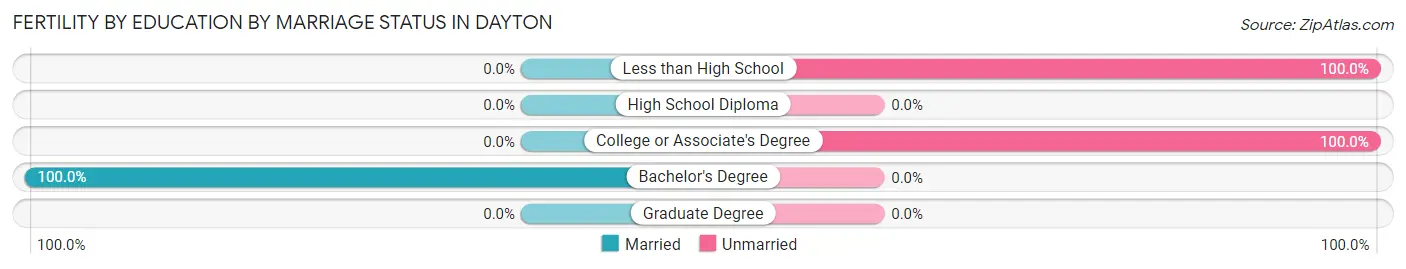
| Educational Attainment | Married | Unmarried |
| Less than High School | 0 (0.0%) | 47 (100.0%) |
| High School Diploma | 0 (0.0%) | 0 (0.0%) |
| College or Associate's Degree | 0 (0.0%) | 42 (100.0%) |
| Bachelor's Degree | 51 (100.0%) | 0 (0.0%) |
| Graduate Degree | 0 (0.0%) | 0 (0.0%) |
| Total | 51 (36.4%) | 89 (63.6%) |
Employment Characteristics in Dayton
Employment by Class of Employer in Dayton
Among the 2,864 employed individuals in Dayton, private company employees (2,209 | 77.1%), local government employees (209 | 7.3%), and state government employees (129 | 4.5%) make up the most common classes of employment.
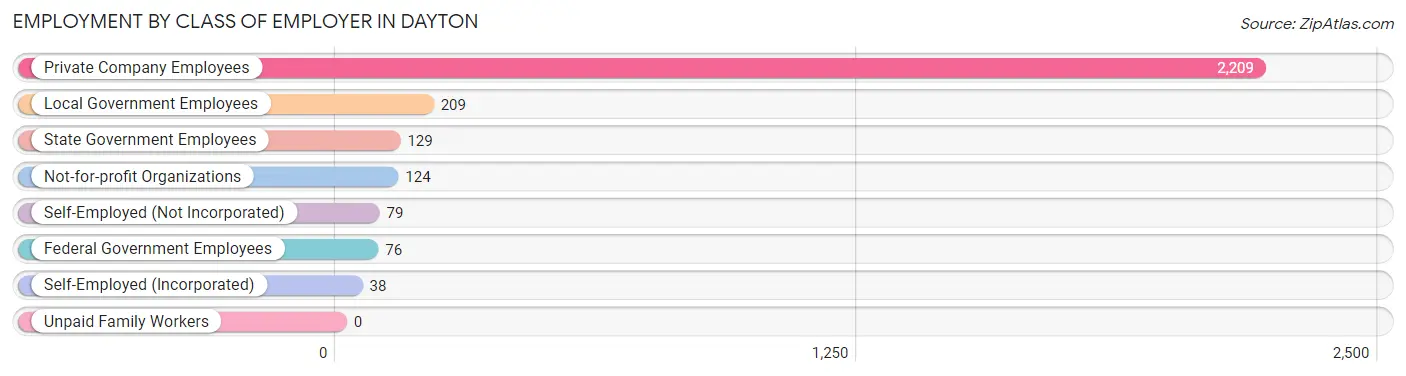
| Employer Class | # Employees | % Employees |
| Private Company Employees | 2,209 | 77.1% |
| Self-Employed (Incorporated) | 38 | 1.3% |
| Self-Employed (Not Incorporated) | 79 | 2.8% |
| Not-for-profit Organizations | 124 | 4.3% |
| Local Government Employees | 209 | 7.3% |
| State Government Employees | 129 | 4.5% |
| Federal Government Employees | 76 | 2.6% |
| Unpaid Family Workers | 0 | 0.0% |
| Total | 2,864 | 100.0% |
Employment Status by Age in Dayton
According to the labor force statistics for Dayton, out of the total population over 16 years of age (5,880), 52.8% or 3,105 individuals are in the labor force, with 6.0% or 186 of them unemployed. The age group with the highest labor force participation rate is 35 to 44 years, with 78.3% or 786 individuals in the labor force. Within the labor force, the 25 to 29 years age range has the highest percentage of unemployed individuals, with 12.9% or 41 of them being unemployed.
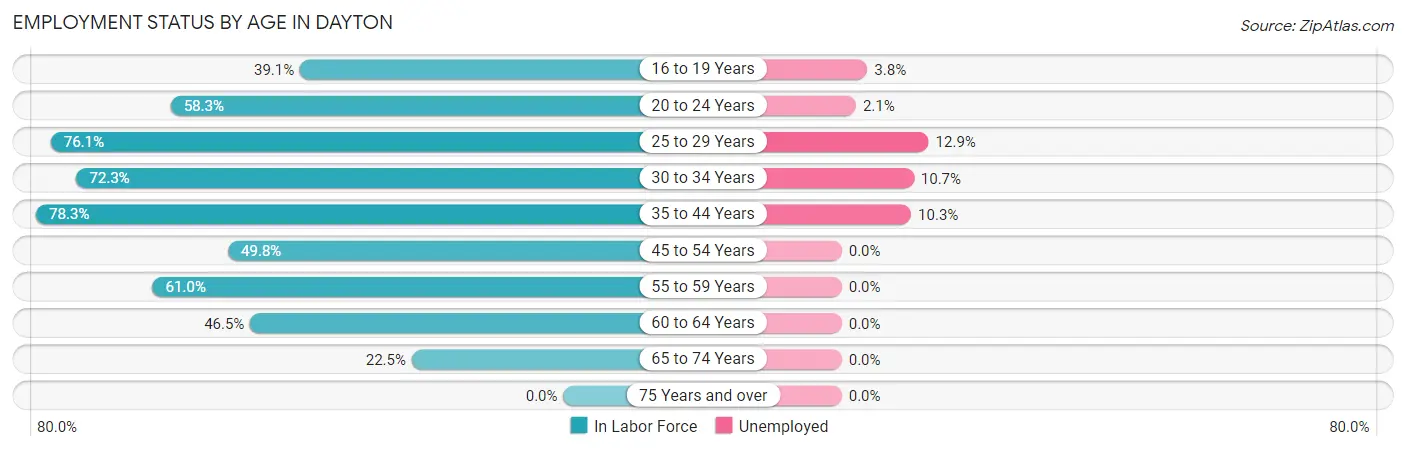
| Age Bracket | In Labor Force | Unemployed |
| 16 to 19 Years | 184 (39.1%) | 7 (3.8%) |
| 20 to 24 Years | 515 (58.3%) | 11 (2.1%) |
| 25 to 29 Years | 319 (76.1%) | 41 (12.9%) |
| 30 to 34 Years | 422 (72.3%) | 45 (10.7%) |
| 35 to 44 Years | 786 (78.3%) | 81 (10.3%) |
| 45 to 54 Years | 312 (49.8%) | 0 (0.0%) |
| 55 to 59 Years | 203 (61.0%) | 0 (0.0%) |
| 60 to 64 Years | 174 (46.5%) | 0 (0.0%) |
| 65 to 74 Years | 189 (22.5%) | 0 (0.0%) |
| 75 Years and over | 0 (0.0%) | 0 (0.0%) |
| Total | 3,105 (52.8%) | 186 (6.0%) |
Employment Status by Educational Attainment in Dayton
According to labor force statistics for Dayton, 66.3% of individuals (2,215) out of the total population between 25 and 64 years of age (3,341) are in the labor force, with 7.5% or 166 of them being unemployed. The group with the highest labor force participation rate are those with the educational attainment of college / associate degree, with 92.7% or 507 individuals in the labor force. Within the labor force, individuals with less than high school education have the highest percentage of unemployment, with 29.6% or 99 of them being unemployed.
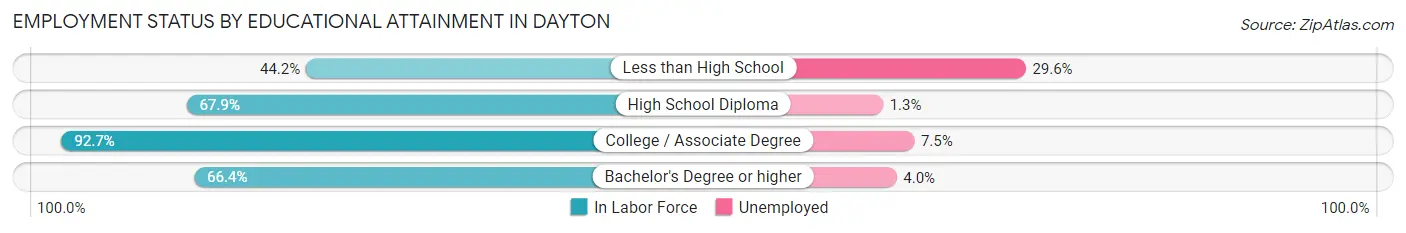
| Educational Attainment | In Labor Force | Unemployed |
| Less than High School | 334 (44.2%) | 223 (29.6%) |
| High School Diploma | 923 (67.9%) | 18 (1.3%) |
| College / Associate Degree | 507 (92.7%) | 41 (7.5%) |
| Bachelor's Degree or higher | 451 (66.4%) | 27 (4.0%) |
| Total | 2,215 (66.3%) | 251 (7.5%) |
Employment Occupations by Sex in Dayton
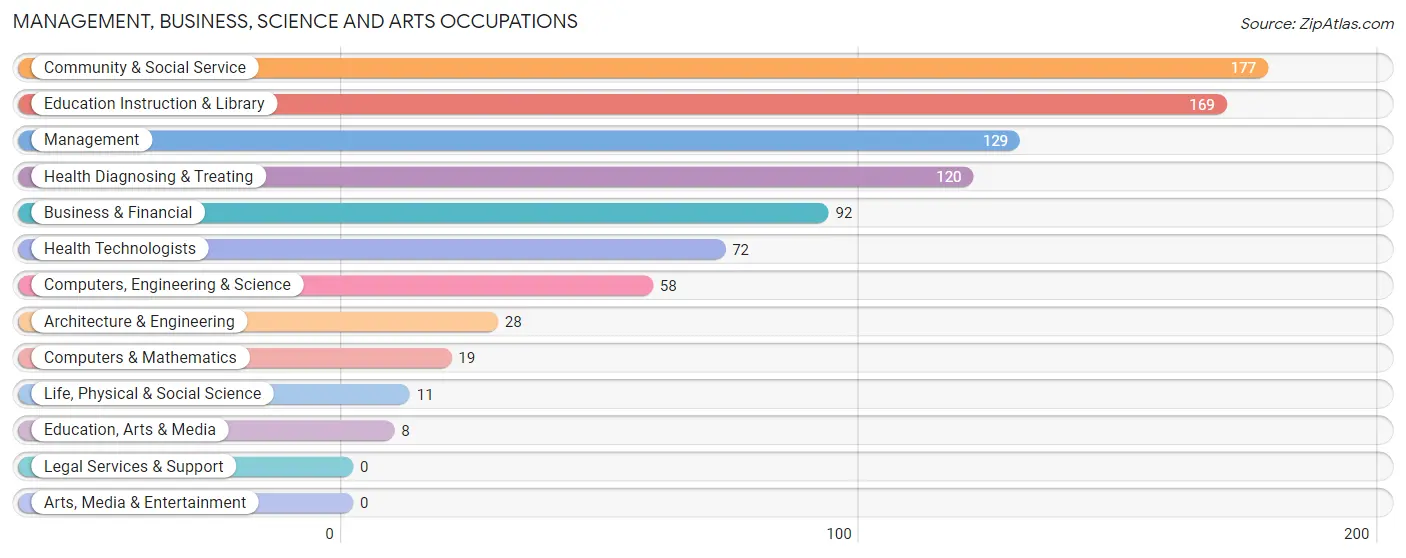
Management, Business, Science and Arts Occupations
The most common Management, Business, Science and Arts occupations in Dayton are Community & Social Service (177 | 6.1%), Education Instruction & Library (169 | 5.8%), Management (129 | 4.4%), Health Diagnosing & Treating (120 | 4.1%), and Business & Financial (92 | 3.2%).
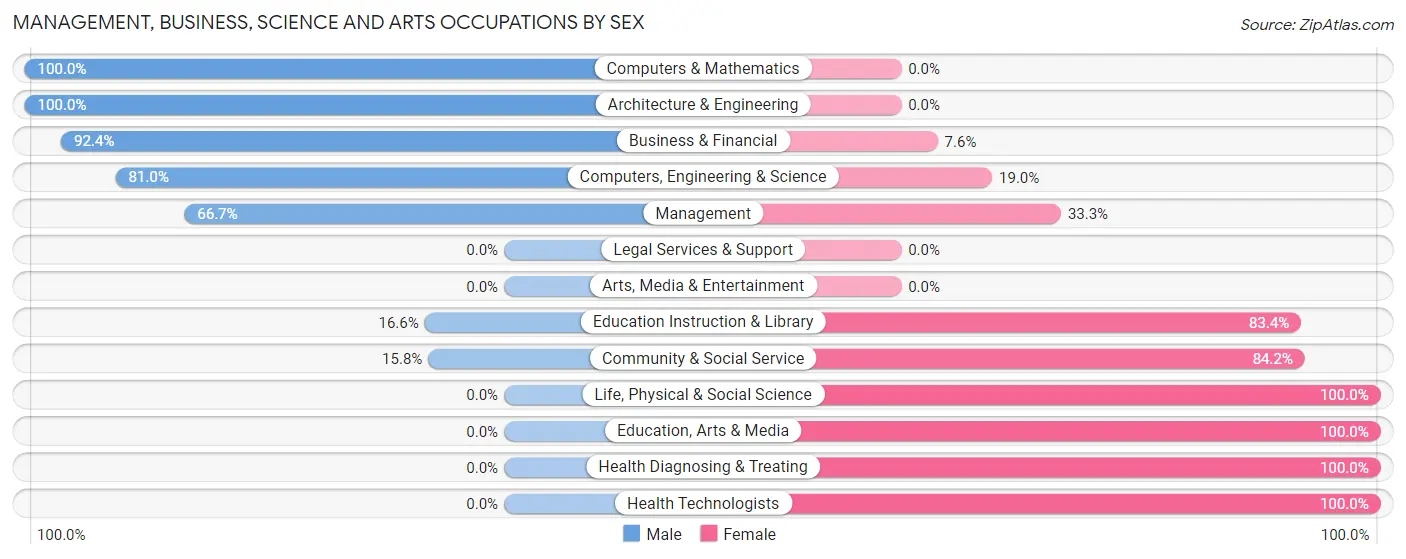
Management, Business, Science and Arts Occupations by Sex
Within the Management, Business, Science and Arts occupations in Dayton, the most male-oriented occupations are Computers & Mathematics (100.0%), Architecture & Engineering (100.0%), and Business & Financial (92.4%), while the most female-oriented occupations are Life, Physical & Social Science (100.0%), Education, Arts & Media (100.0%), and Health Diagnosing & Treating (100.0%).
| Occupation | Male | Female |
| Management | 86 (66.7%) | 43 (33.3%) |
| Business & Financial | 85 (92.4%) | 7 (7.6%) |
| Computers, Engineering & Science | 47 (81.0%) | 11 (19.0%) |
| Computers & Mathematics | 19 (100.0%) | 0 (0.0%) |
| Architecture & Engineering | 28 (100.0%) | 0 (0.0%) |
| Life, Physical & Social Science | 0 (0.0%) | 11 (100.0%) |
| Community & Social Service | 28 (15.8%) | 149 (84.2%) |
| Education, Arts & Media | 0 (0.0%) | 8 (100.0%) |
| Legal Services & Support | 0 (0.0%) | 0 (0.0%) |
| Education Instruction & Library | 28 (16.6%) | 141 (83.4%) |
| Arts, Media & Entertainment | 0 (0.0%) | 0 (0.0%) |
| Health Diagnosing & Treating | 0 (0.0%) | 120 (100.0%) |
| Health Technologists | 0 (0.0%) | 72 (100.0%) |
| Total (Category) | 246 (42.7%) | 330 (57.3%) |
| Total (Overall) | 1,743 (59.7%) | 1,176 (40.3%) |
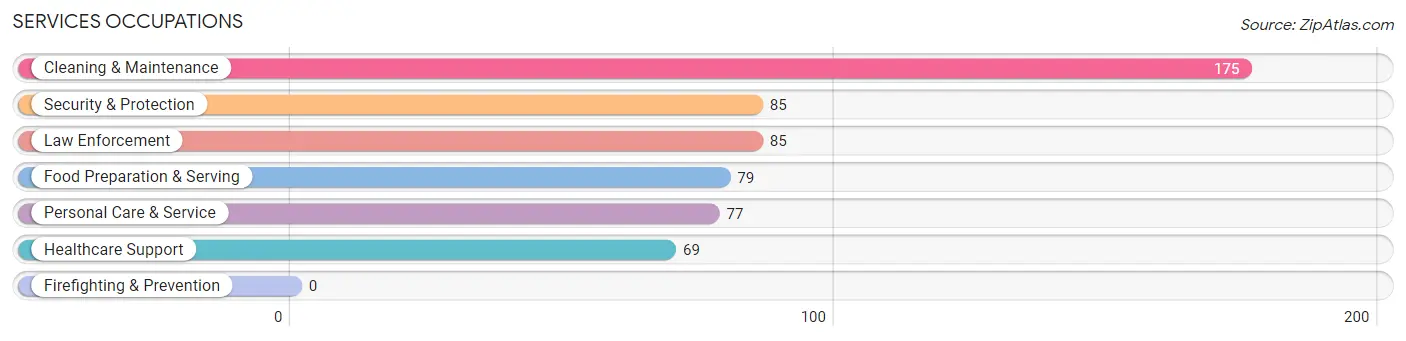
Services Occupations
The most common Services occupations in Dayton are Cleaning & Maintenance (175 | 6.0%), Security & Protection (85 | 2.9%), Law Enforcement (85 | 2.9%), Food Preparation & Serving (79 | 2.7%), and Personal Care & Service (77 | 2.6%).
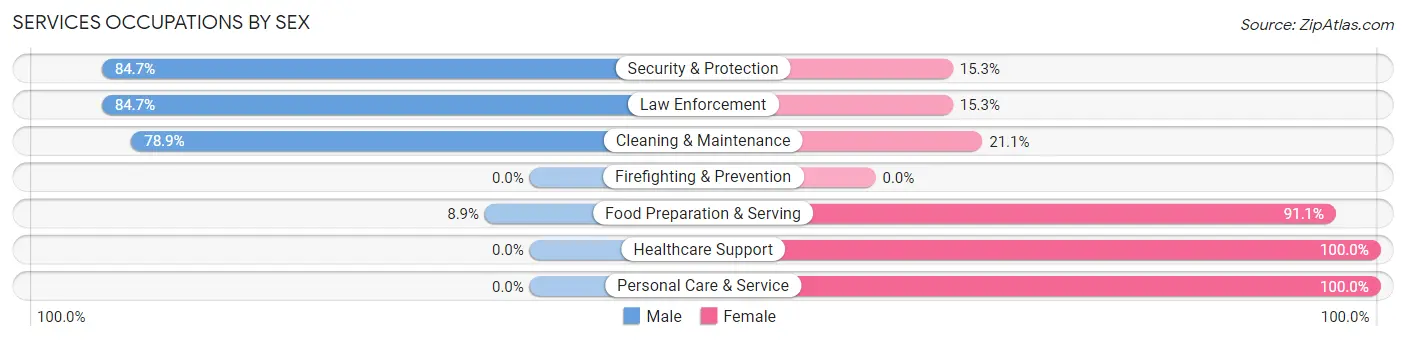
Services Occupations by Sex
Within the Services occupations in Dayton, the most male-oriented occupations are Security & Protection (84.7%), Law Enforcement (84.7%), and Cleaning & Maintenance (78.9%), while the most female-oriented occupations are Healthcare Support (100.0%), Personal Care & Service (100.0%), and Food Preparation & Serving (91.1%).
| Occupation | Male | Female |
| Healthcare Support | 0 (0.0%) | 69 (100.0%) |
| Security & Protection | 72 (84.7%) | 13 (15.3%) |
| Firefighting & Prevention | 0 (0.0%) | 0 (0.0%) |
| Law Enforcement | 72 (84.7%) | 13 (15.3%) |
| Food Preparation & Serving | 7 (8.9%) | 72 (91.1%) |
| Cleaning & Maintenance | 138 (78.9%) | 37 (21.1%) |
| Personal Care & Service | 0 (0.0%) | 77 (100.0%) |
| Total (Category) | 217 (44.7%) | 268 (55.3%) |
| Total (Overall) | 1,743 (59.7%) | 1,176 (40.3%) |
Sales and Office Occupations
The most common Sales and Office occupations in Dayton are Office & Administration (343 | 11.7%), and Sales & Related (223 | 7.6%).
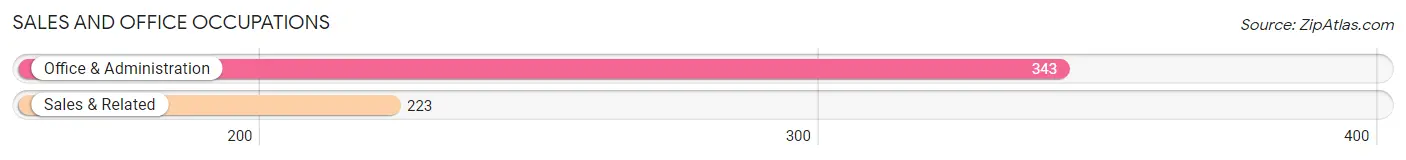
Sales and Office Occupations by Sex
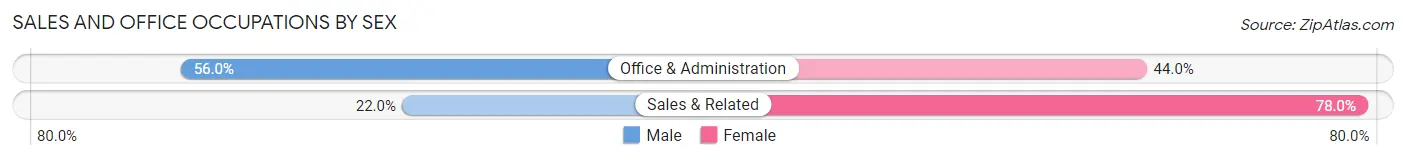
| Occupation | Male | Female |
| Sales & Related | 49 (22.0%) | 174 (78.0%) |
| Office & Administration | 192 (56.0%) | 151 (44.0%) |
| Total (Category) | 241 (42.6%) | 325 (57.4%) |
| Total (Overall) | 1,743 (59.7%) | 1,176 (40.3%) |
Natural Resources, Construction and Maintenance Occupations
The most common Natural Resources, Construction and Maintenance occupations in Dayton are Construction & Extraction (215 | 7.4%), and Installation, Maintenance & Repair (46 | 1.6%).
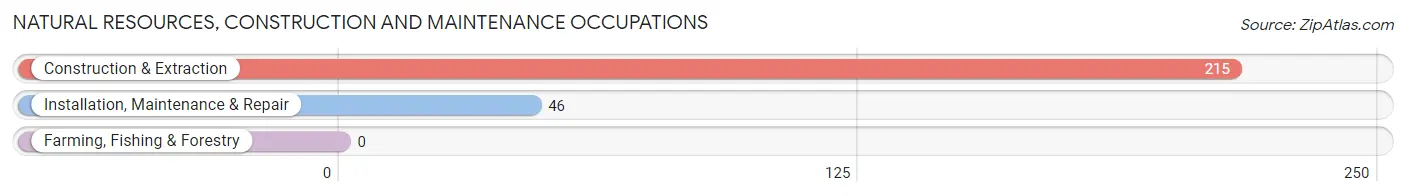
Natural Resources, Construction and Maintenance Occupations by Sex
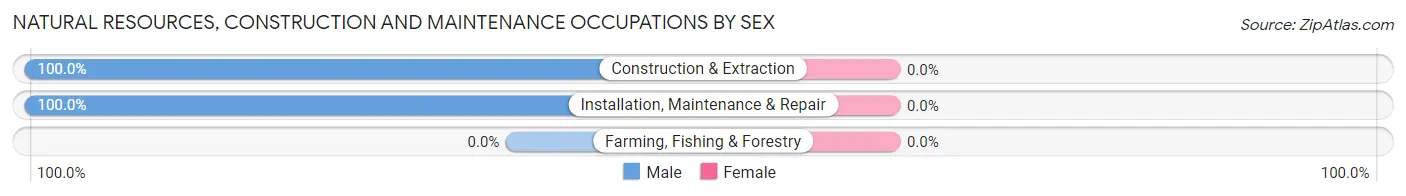
| Occupation | Male | Female |
| Farming, Fishing & Forestry | 0 (0.0%) | 0 (0.0%) |
| Construction & Extraction | 215 (100.0%) | 0 (0.0%) |
| Installation, Maintenance & Repair | 46 (100.0%) | 0 (0.0%) |
| Total (Category) | 261 (100.0%) | 0 (0.0%) |
| Total (Overall) | 1,743 (59.7%) | 1,176 (40.3%) |
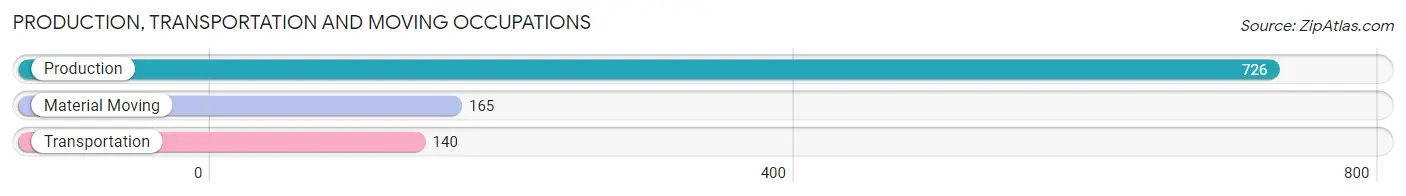
Production, Transportation and Moving Occupations
The most common Production, Transportation and Moving occupations in Dayton are Production (726 | 24.9%), Material Moving (165 | 5.7%), and Transportation (140 | 4.8%).
Production, Transportation and Moving Occupations by Sex
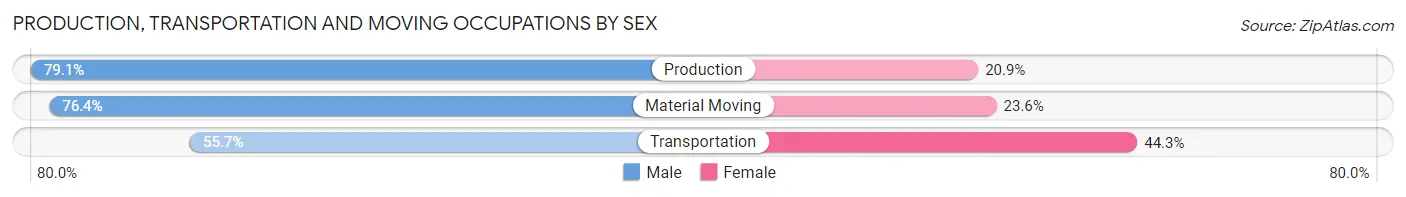
| Occupation | Male | Female |
| Production | 574 (79.1%) | 152 (20.9%) |
| Transportation | 78 (55.7%) | 62 (44.3%) |
| Material Moving | 126 (76.4%) | 39 (23.6%) |
| Total (Category) | 778 (75.5%) | 253 (24.5%) |
| Total (Overall) | 1,743 (59.7%) | 1,176 (40.3%) |
Employment Industries by Sex in Dayton
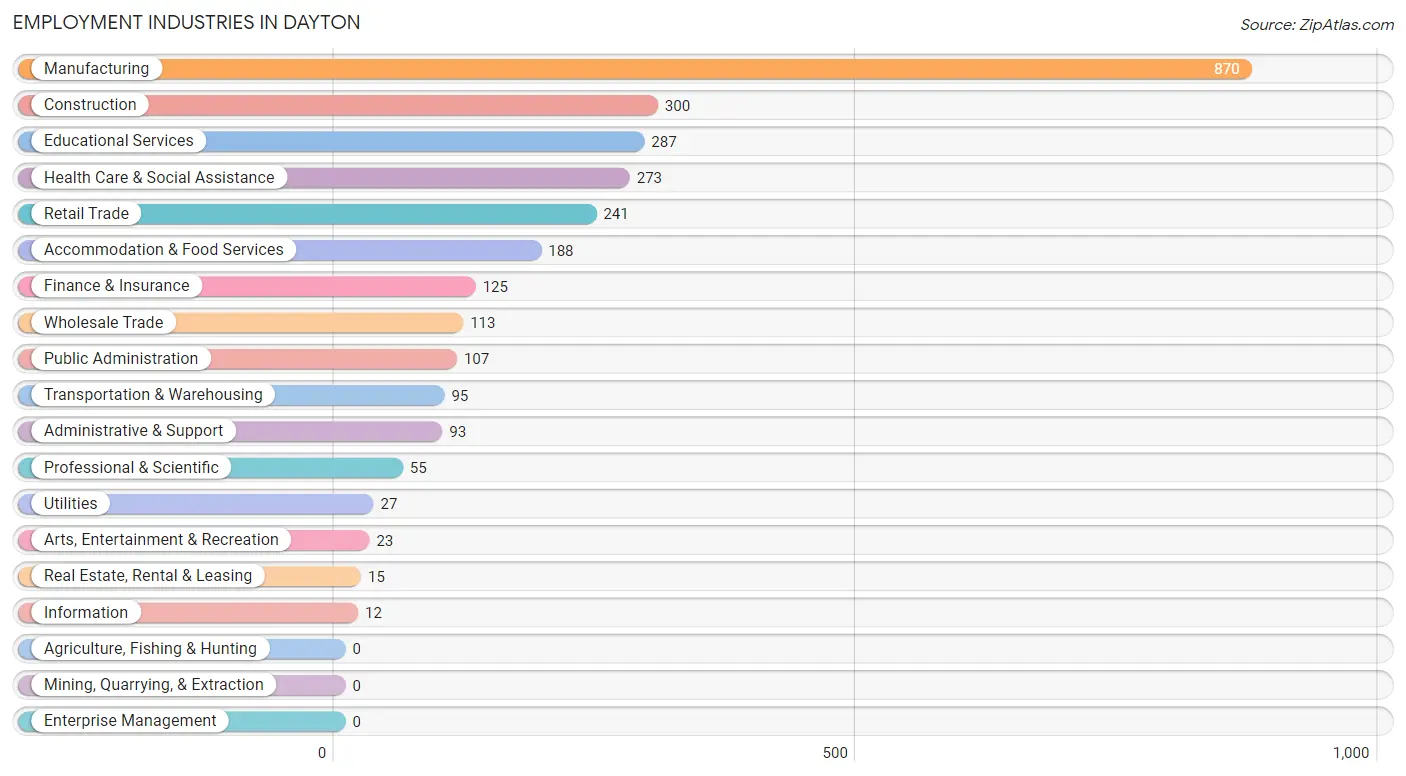
Employment Industries in Dayton
The major employment industries in Dayton include Manufacturing (870 | 29.8%), Construction (300 | 10.3%), Educational Services (287 | 9.8%), Health Care & Social Assistance (273 | 9.3%), and Retail Trade (241 | 8.3%).
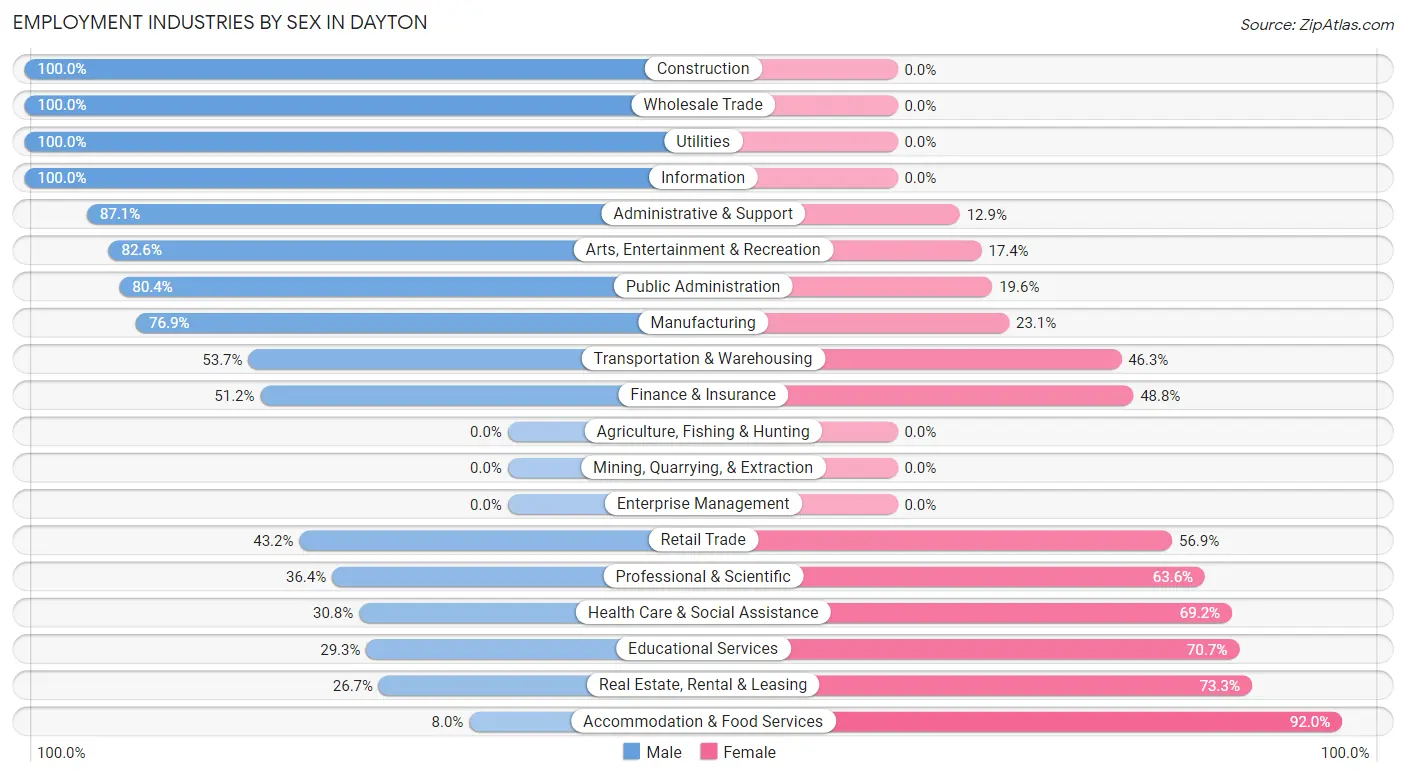
Employment Industries by Sex in Dayton
The Dayton industries that see more men than women are Construction (100.0%), Wholesale Trade (100.0%), and Utilities (100.0%), whereas the industries that tend to have a higher number of women are Accommodation & Food Services (92.0%), Real Estate, Rental & Leasing (73.3%), and Educational Services (70.7%).
| Industry | Male | Female |
| Agriculture, Fishing & Hunting | 0 (0.0%) | 0 (0.0%) |
| Mining, Quarrying, & Extraction | 0 (0.0%) | 0 (0.0%) |
| Construction | 300 (100.0%) | 0 (0.0%) |
| Manufacturing | 669 (76.9%) | 201 (23.1%) |
| Wholesale Trade | 113 (100.0%) | 0 (0.0%) |
| Retail Trade | 104 (43.1%) | 137 (56.9%) |
| Transportation & Warehousing | 51 (53.7%) | 44 (46.3%) |
| Utilities | 27 (100.0%) | 0 (0.0%) |
| Information | 12 (100.0%) | 0 (0.0%) |
| Finance & Insurance | 64 (51.2%) | 61 (48.8%) |
| Real Estate, Rental & Leasing | 4 (26.7%) | 11 (73.3%) |
| Professional & Scientific | 20 (36.4%) | 35 (63.6%) |
| Enterprise Management | 0 (0.0%) | 0 (0.0%) |
| Administrative & Support | 81 (87.1%) | 12 (12.9%) |
| Educational Services | 84 (29.3%) | 203 (70.7%) |
| Health Care & Social Assistance | 84 (30.8%) | 189 (69.2%) |
| Arts, Entertainment & Recreation | 19 (82.6%) | 4 (17.4%) |
| Accommodation & Food Services | 15 (8.0%) | 173 (92.0%) |
| Public Administration | 86 (80.4%) | 21 (19.6%) |
| Total | 1,743 (59.7%) | 1,176 (40.3%) |
Education in Dayton
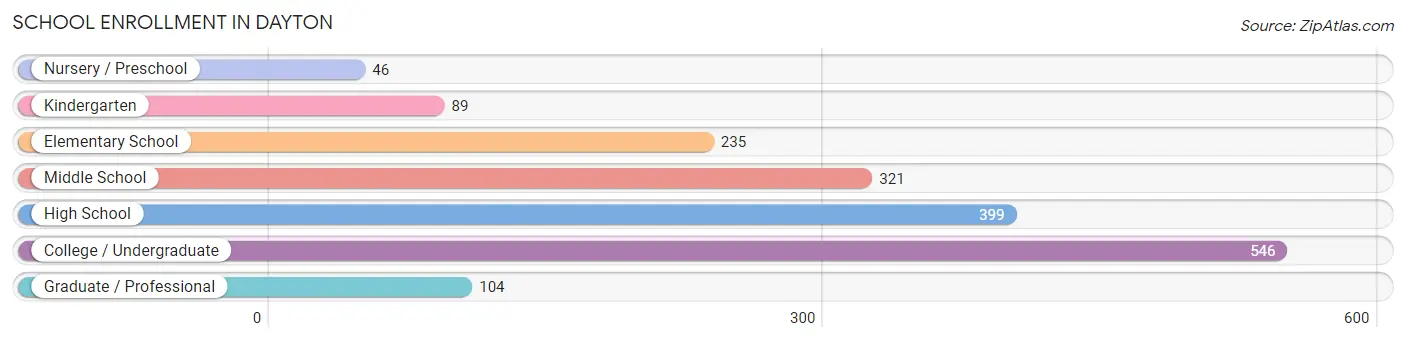
School Enrollment in Dayton
The most common levels of schooling among the 1,740 students in Dayton are college / undergraduate (546 | 31.4%), high school (399 | 22.9%), and middle school (321 | 18.4%).
| School Level | # Students | % Students |
| Nursery / Preschool | 46 | 2.6% |
| Kindergarten | 89 | 5.1% |
| Elementary School | 235 | 13.5% |
| Middle School | 321 | 18.4% |
| High School | 399 | 22.9% |
| College / Undergraduate | 546 | 31.4% |
| Graduate / Professional | 104 | 6.0% |
| Total | 1,740 | 100.0% |
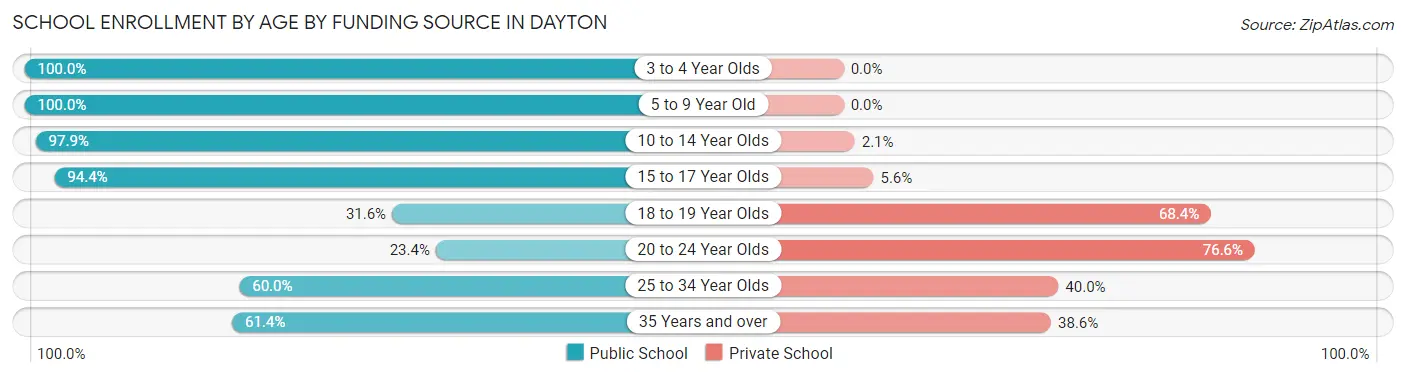
School Enrollment by Age by Funding Source in Dayton
Out of a total of 1,740 students who are enrolled in schools in Dayton, 527 (30.3%) attend a private institution, while the remaining 1,213 (69.7%) are enrolled in public schools. The age group of 20 to 24 year olds has the highest likelihood of being enrolled in private schools, with 242 (76.6% in the age bracket) enrolled. Conversely, the age group of 3 to 4 year olds has the lowest likelihood of being enrolled in a private school, with 14 (100.0% in the age bracket) attending a public institution.
| Age Bracket | Public School | Private School |
| 3 to 4 Year Olds | 14 (100.0%) | 0 (0.0%) |
| 5 to 9 Year Old | 311 (100.0%) | 0 (0.0%) |
| 10 to 14 Year Olds | 425 (97.9%) | 9 (2.1%) |
| 15 to 17 Year Olds | 187 (94.4%) | 11 (5.6%) |
| 18 to 19 Year Olds | 90 (31.6%) | 195 (68.4%) |
| 20 to 24 Year Olds | 74 (23.4%) | 242 (76.6%) |
| 25 to 34 Year Olds | 30 (60.0%) | 20 (40.0%) |
| 35 Years and over | 81 (61.4%) | 51 (38.6%) |
| Total | 1,213 (69.7%) | 527 (30.3%) |
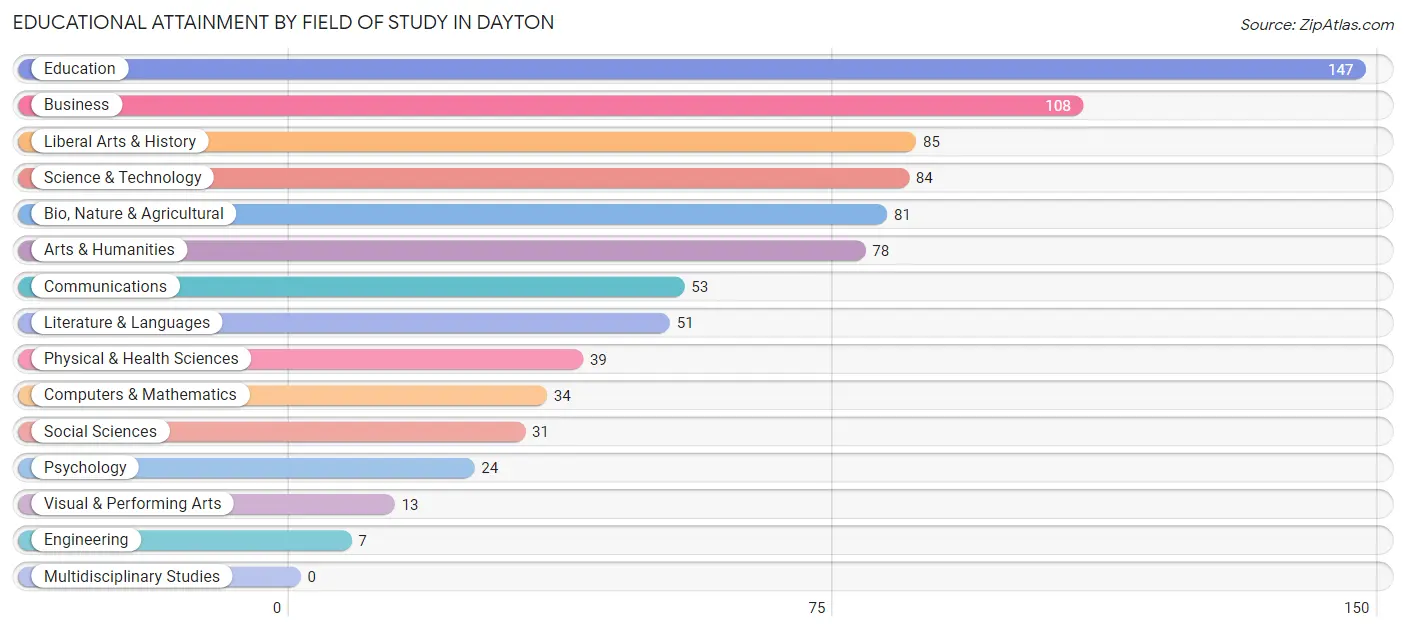
Educational Attainment by Field of Study in Dayton
Education (147 | 17.6%), business (108 | 12.9%), liberal arts & history (85 | 10.2%), science & technology (84 | 10.1%), and bio, nature & agricultural (81 | 9.7%) are the most common fields of study among 835 individuals in Dayton who have obtained a bachelor's degree or higher.
| Field of Study | # Graduates | % Graduates |
| Computers & Mathematics | 34 | 4.1% |
| Bio, Nature & Agricultural | 81 | 9.7% |
| Physical & Health Sciences | 39 | 4.7% |
| Psychology | 24 | 2.9% |
| Social Sciences | 31 | 3.7% |
| Engineering | 7 | 0.8% |
| Multidisciplinary Studies | 0 | 0.0% |
| Science & Technology | 84 | 10.1% |
| Business | 108 | 12.9% |
| Education | 147 | 17.6% |
| Literature & Languages | 51 | 6.1% |
| Liberal Arts & History | 85 | 10.2% |
| Visual & Performing Arts | 13 | 1.6% |
| Communications | 53 | 6.4% |
| Arts & Humanities | 78 | 9.3% |
| Total | 835 | 100.0% |
Transportation & Commute in Dayton
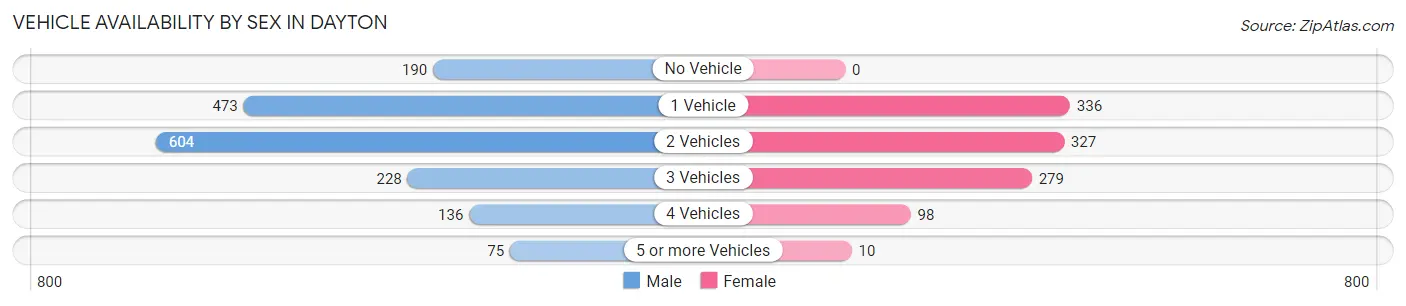
Vehicle Availability by Sex in Dayton
The most prevalent vehicle ownership categories in Dayton are males with 2 vehicles (604, accounting for 35.4%) and females with 2 vehicles (327, making up 57.5%).
| Vehicles Available | Male | Female |
| No Vehicle | 190 (11.1%) | 0 (0.0%) |
| 1 Vehicle | 473 (27.7%) | 336 (32.0%) |
| 2 Vehicles | 604 (35.4%) | 327 (31.1%) |
| 3 Vehicles | 228 (13.4%) | 279 (26.6%) |
| 4 Vehicles | 136 (8.0%) | 98 (9.3%) |
| 5 or more Vehicles | 75 (4.4%) | 10 (0.9%) |
| Total | 1,706 (100.0%) | 1,050 (100.0%) |
Commute Time in Dayton
The most frequently occuring commute durations in Dayton are 5 to 9 minutes (855 commuters, 30.6%), 10 to 14 minutes (608 commuters, 21.8%), and 20 to 24 minutes (323 commuters, 11.6%).
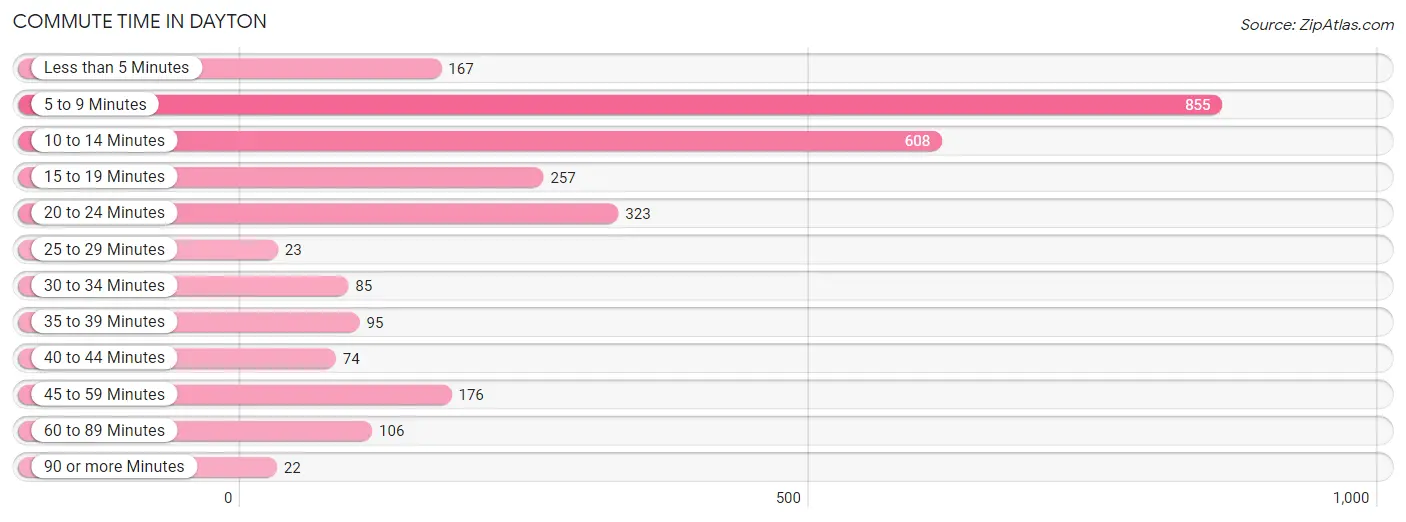
| Commute Time | # Commuters | % Commuters |
| Less than 5 Minutes | 167 | 6.0% |
| 5 to 9 Minutes | 855 | 30.6% |
| 10 to 14 Minutes | 608 | 21.8% |
| 15 to 19 Minutes | 257 | 9.2% |
| 20 to 24 Minutes | 323 | 11.6% |
| 25 to 29 Minutes | 23 | 0.8% |
| 30 to 34 Minutes | 85 | 3.0% |
| 35 to 39 Minutes | 95 | 3.4% |
| 40 to 44 Minutes | 74 | 2.6% |
| 45 to 59 Minutes | 176 | 6.3% |
| 60 to 89 Minutes | 106 | 3.8% |
| 90 or more Minutes | 22 | 0.8% |
Commute Time by Sex in Dayton
The most common commute times in Dayton are 5 to 9 minutes (403 commuters, 23.9%) for males and 5 to 9 minutes (452 commuters, 41.0%) for females.
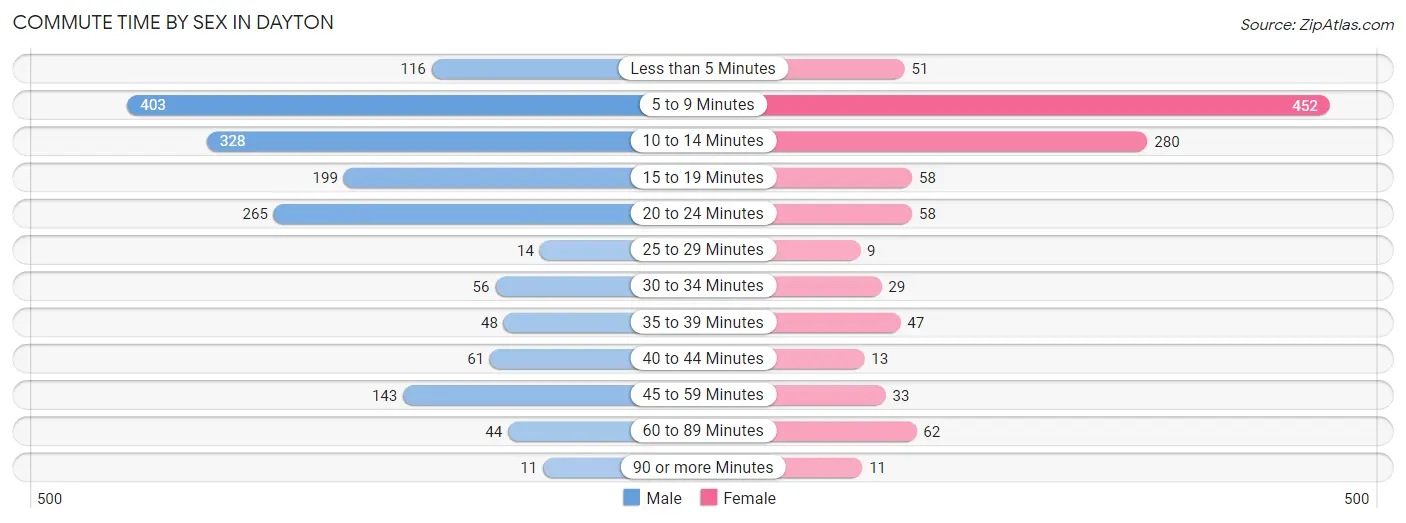
| Commute Time | Male | Female |
| Less than 5 Minutes | 116 (6.9%) | 51 (4.6%) |
| 5 to 9 Minutes | 403 (23.9%) | 452 (41.0%) |
| 10 to 14 Minutes | 328 (19.4%) | 280 (25.4%) |
| 15 to 19 Minutes | 199 (11.8%) | 58 (5.3%) |
| 20 to 24 Minutes | 265 (15.7%) | 58 (5.3%) |
| 25 to 29 Minutes | 14 (0.8%) | 9 (0.8%) |
| 30 to 34 Minutes | 56 (3.3%) | 29 (2.6%) |
| 35 to 39 Minutes | 48 (2.8%) | 47 (4.3%) |
| 40 to 44 Minutes | 61 (3.6%) | 13 (1.2%) |
| 45 to 59 Minutes | 143 (8.5%) | 33 (3.0%) |
| 60 to 89 Minutes | 44 (2.6%) | 62 (5.6%) |
| 90 or more Minutes | 11 (0.6%) | 11 (1.0%) |
Time of Departure to Work by Sex in Dayton
The most frequent times of departure to work in Dayton are 12:00 AM to 4:59 AM (356, 21.1%) for males and 6:30 AM to 6:59 AM (215, 19.5%) for females.
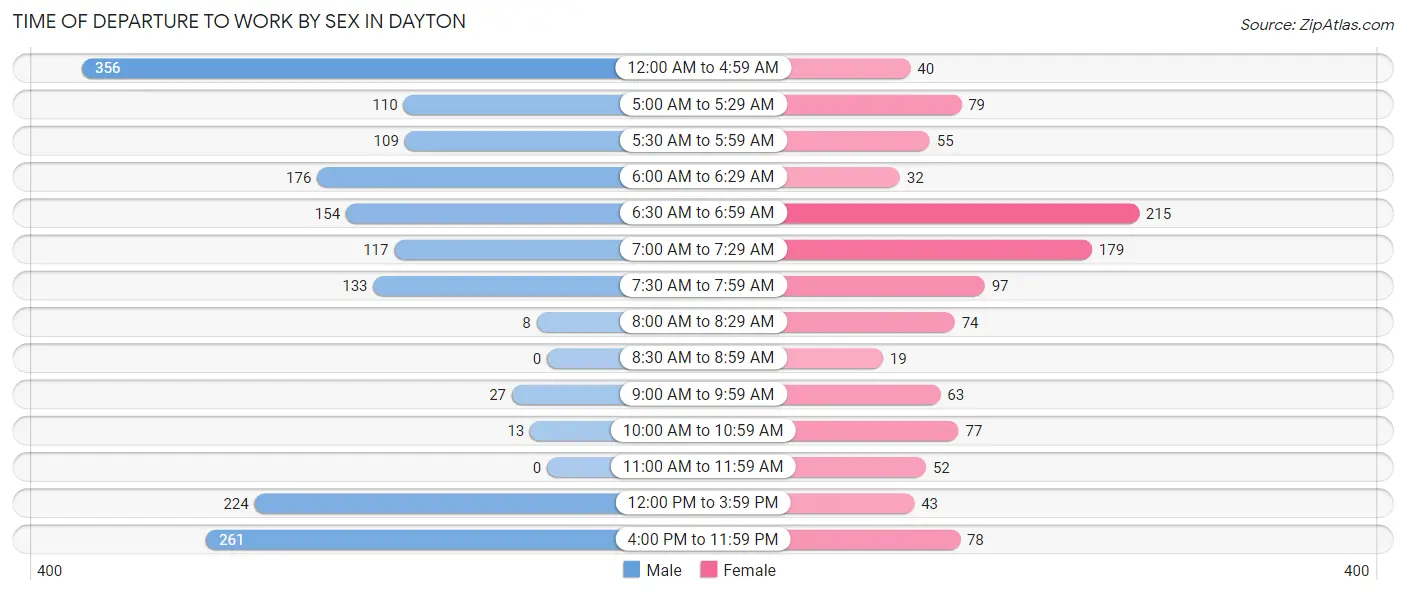
| Time of Departure | Male | Female |
| 12:00 AM to 4:59 AM | 356 (21.1%) | 40 (3.6%) |
| 5:00 AM to 5:29 AM | 110 (6.5%) | 79 (7.2%) |
| 5:30 AM to 5:59 AM | 109 (6.5%) | 55 (5.0%) |
| 6:00 AM to 6:29 AM | 176 (10.4%) | 32 (2.9%) |
| 6:30 AM to 6:59 AM | 154 (9.1%) | 215 (19.5%) |
| 7:00 AM to 7:29 AM | 117 (6.9%) | 179 (16.2%) |
| 7:30 AM to 7:59 AM | 133 (7.9%) | 97 (8.8%) |
| 8:00 AM to 8:29 AM | 8 (0.5%) | 74 (6.7%) |
| 8:30 AM to 8:59 AM | 0 (0.0%) | 19 (1.7%) |
| 9:00 AM to 9:59 AM | 27 (1.6%) | 63 (5.7%) |
| 10:00 AM to 10:59 AM | 13 (0.8%) | 77 (7.0%) |
| 11:00 AM to 11:59 AM | 0 (0.0%) | 52 (4.7%) |
| 12:00 PM to 3:59 PM | 224 (13.3%) | 43 (3.9%) |
| 4:00 PM to 11:59 PM | 261 (15.5%) | 78 (7.1%) |
| Total | 1,688 (100.0%) | 1,103 (100.0%) |
Housing Occupancy in Dayton
Occupancy by Ownership in Dayton
Of the total 2,594 dwellings in Dayton, owner-occupied units account for 1,363 (52.5%), while renter-occupied units make up 1,231 (47.5%).
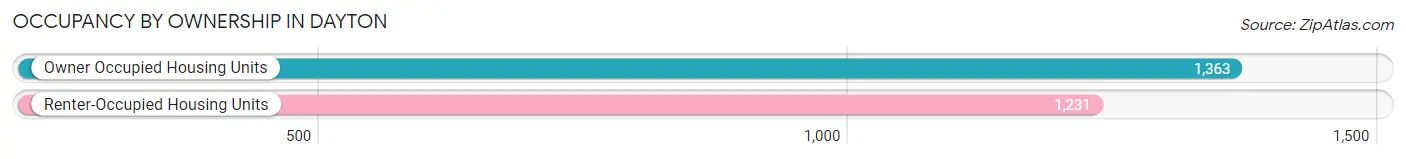
| Occupancy | # Housing Units | % Housing Units |
| Owner Occupied Housing Units | 1,363 | 52.5% |
| Renter-Occupied Housing Units | 1,231 | 47.5% |
| Total Occupied Housing Units | 2,594 | 100.0% |
Occupancy by Household Size in Dayton
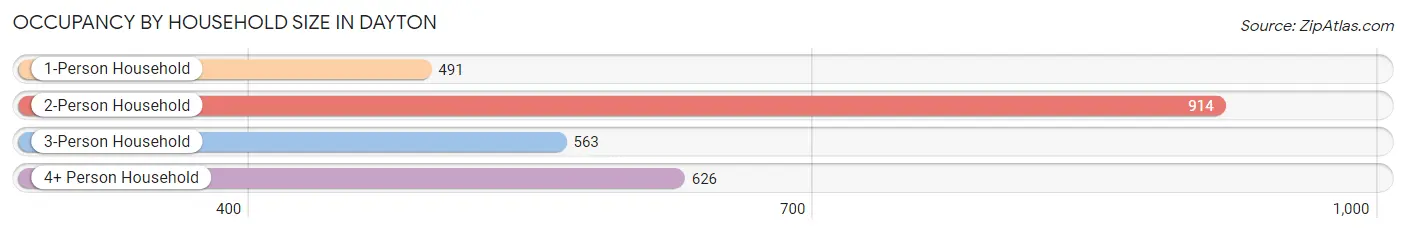
| Household Size | # Housing Units | % Housing Units |
| 1-Person Household | 491 | 18.9% |
| 2-Person Household | 914 | 35.2% |
| 3-Person Household | 563 | 21.7% |
| 4+ Person Household | 626 | 24.1% |
| Total Housing Units | 2,594 | 100.0% |
Occupancy by Ownership by Household Size in Dayton
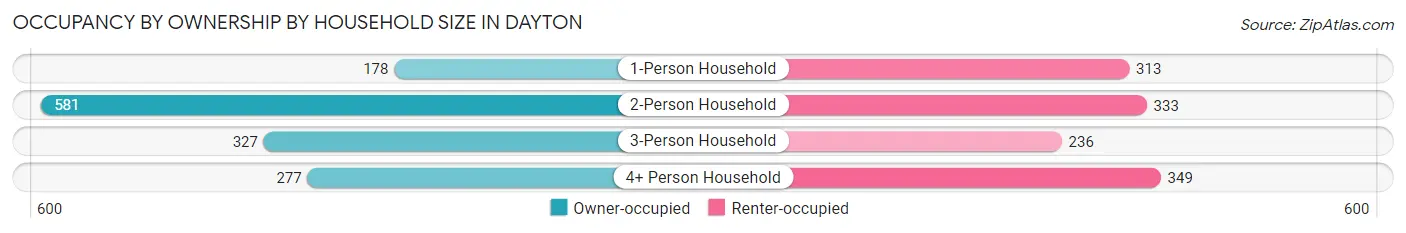
| Household Size | Owner-occupied | Renter-occupied |
| 1-Person Household | 178 (36.2%) | 313 (63.7%) |
| 2-Person Household | 581 (63.6%) | 333 (36.4%) |
| 3-Person Household | 327 (58.1%) | 236 (41.9%) |
| 4+ Person Household | 277 (44.3%) | 349 (55.7%) |
| Total Housing Units | 1,363 (52.5%) | 1,231 (47.5%) |
Occupancy by Educational Attainment in Dayton
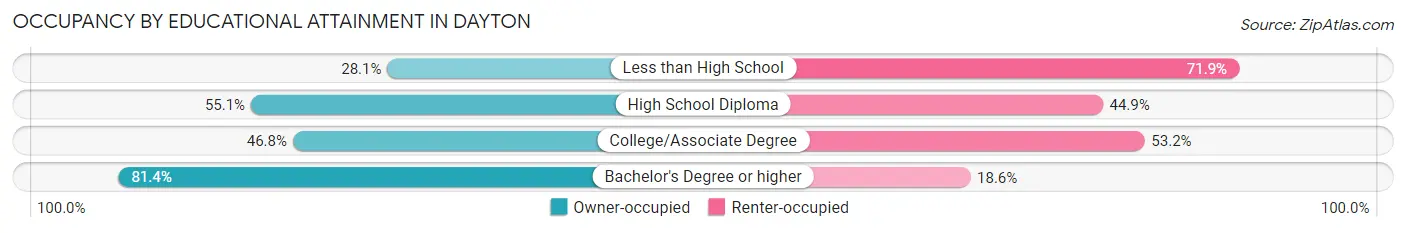
| Household Size | Owner-occupied | Renter-occupied |
| Less than High School | 134 (28.1%) | 343 (71.9%) |
| High School Diploma | 581 (55.1%) | 473 (44.9%) |
| College/Associate Degree | 294 (46.8%) | 334 (53.2%) |
| Bachelor's Degree or higher | 354 (81.4%) | 81 (18.6%) |
Occupancy by Age of Householder in Dayton
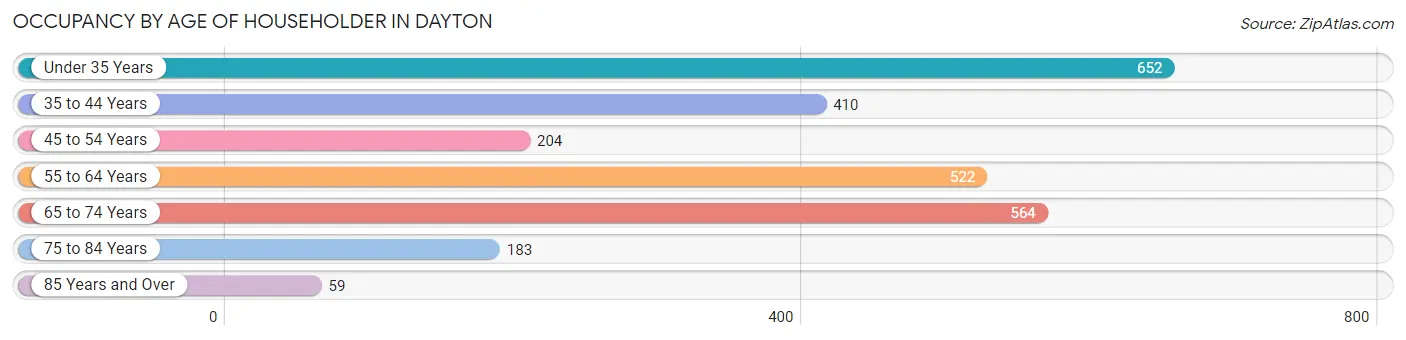
| Age Bracket | # Households | % Households |
| Under 35 Years | 652 | 25.1% |
| 35 to 44 Years | 410 | 15.8% |
| 45 to 54 Years | 204 | 7.9% |
| 55 to 64 Years | 522 | 20.1% |
| 65 to 74 Years | 564 | 21.7% |
| 75 to 84 Years | 183 | 7.0% |
| 85 Years and Over | 59 | 2.3% |
| Total | 2,594 | 100.0% |
Housing Finances in Dayton
Median Income by Occupancy in Dayton
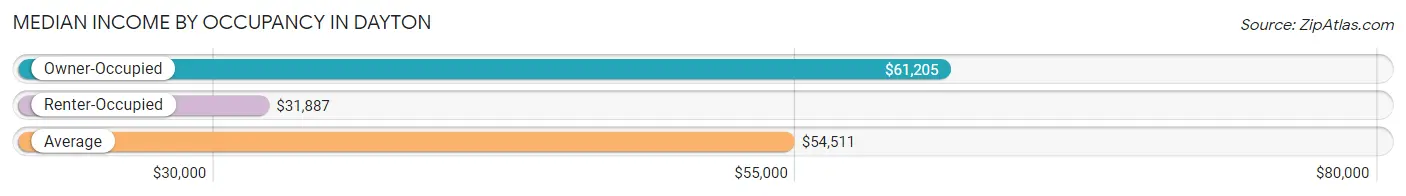
| Occupancy Type | # Households | Median Income |
| Owner-Occupied | 1,363 (52.5%) | $61,205 |
| Renter-Occupied | 1,231 (47.5%) | $31,887 |
| Average | 2,594 (100.0%) | $54,511 |
Occupancy by Householder Income Bracket in Dayton
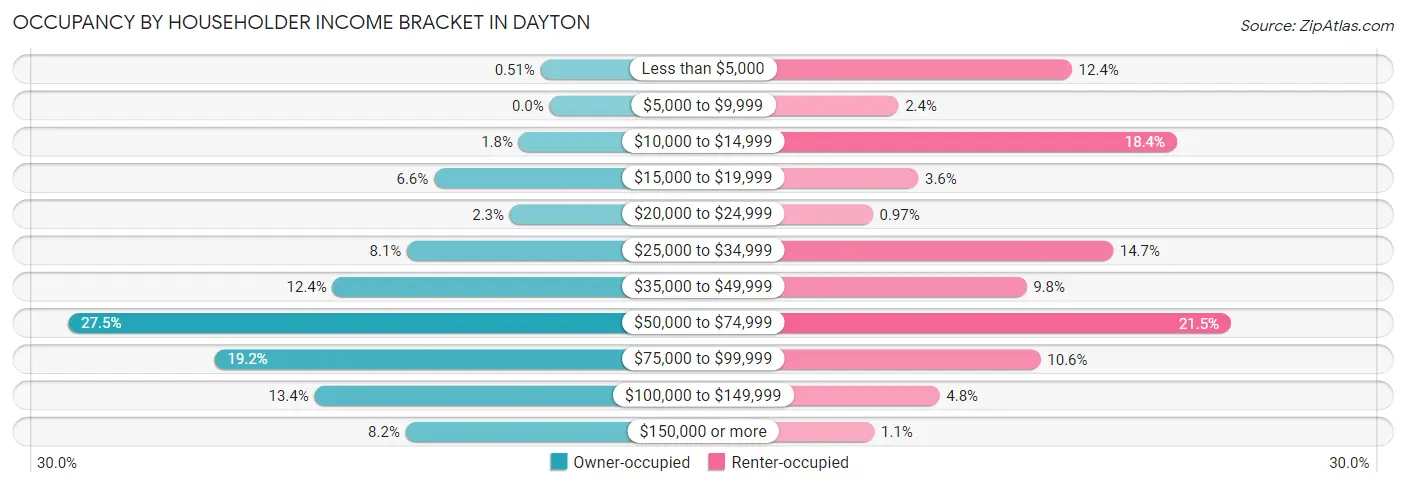
| Income Bracket | Owner-occupied | Renter-occupied |
| Less than $5,000 | 7 (0.5%) | 152 (12.3%) |
| $5,000 to $9,999 | 0 (0.0%) | 30 (2.4%) |
| $10,000 to $14,999 | 24 (1.8%) | 226 (18.4%) |
| $15,000 to $19,999 | 90 (6.6%) | 44 (3.6%) |
| $20,000 to $24,999 | 31 (2.3%) | 12 (1.0%) |
| $25,000 to $34,999 | 111 (8.1%) | 181 (14.7%) |
| $35,000 to $49,999 | 169 (12.4%) | 120 (9.8%) |
| $50,000 to $74,999 | 375 (27.5%) | 264 (21.4%) |
| $75,000 to $99,999 | 261 (19.2%) | 130 (10.6%) |
| $100,000 to $149,999 | 183 (13.4%) | 59 (4.8%) |
| $150,000 or more | 112 (8.2%) | 13 (1.1%) |
| Total | 1,363 (100.0%) | 1,231 (100.0%) |
Monthly Housing Cost Tiers in Dayton
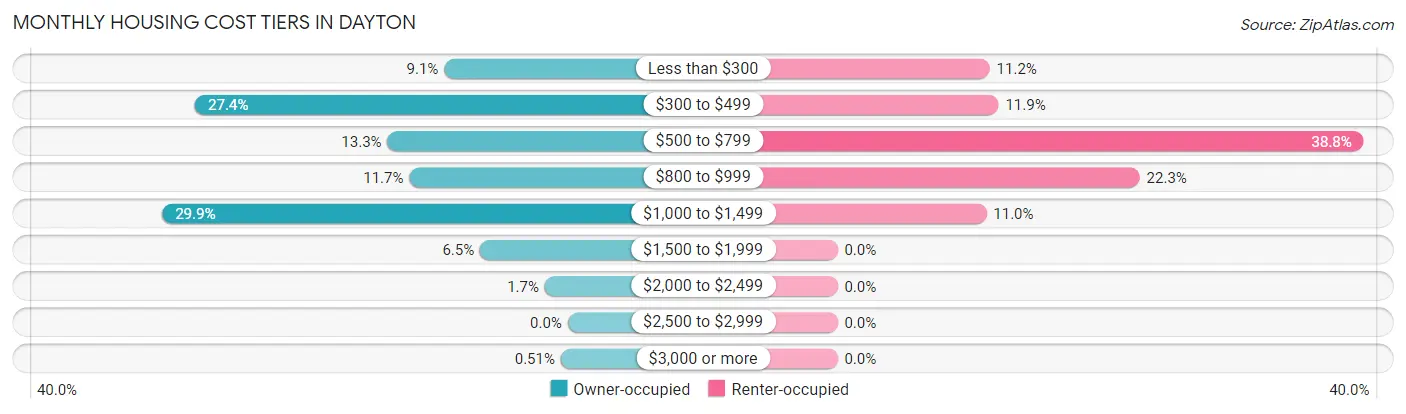
| Monthly Cost | Owner-occupied | Renter-occupied |
| Less than $300 | 124 (9.1%) | 138 (11.2%) |
| $300 to $499 | 374 (27.4%) | 146 (11.9%) |
| $500 to $799 | 181 (13.3%) | 477 (38.8%) |
| $800 to $999 | 159 (11.7%) | 274 (22.3%) |
| $1,000 to $1,499 | 407 (29.9%) | 135 (11.0%) |
| $1,500 to $1,999 | 88 (6.5%) | 0 (0.0%) |
| $2,000 to $2,499 | 23 (1.7%) | 0 (0.0%) |
| $2,500 to $2,999 | 0 (0.0%) | 0 (0.0%) |
| $3,000 or more | 7 (0.5%) | 0 (0.0%) |
| Total | 1,363 (100.0%) | 1,231 (100.0%) |
Physical Housing Characteristics in Dayton
Housing Structures in Dayton
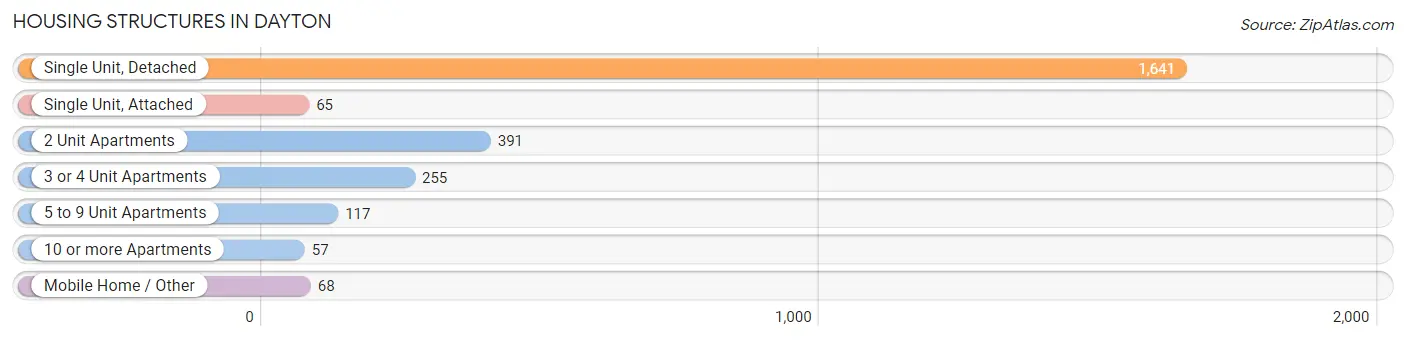
| Structure Type | # Housing Units | % Housing Units |
| Single Unit, Detached | 1,641 | 63.3% |
| Single Unit, Attached | 65 | 2.5% |
| 2 Unit Apartments | 391 | 15.1% |
| 3 or 4 Unit Apartments | 255 | 9.8% |
| 5 to 9 Unit Apartments | 117 | 4.5% |
| 10 or more Apartments | 57 | 2.2% |
| Mobile Home / Other | 68 | 2.6% |
| Total | 2,594 | 100.0% |
Housing Structures by Occupancy in Dayton
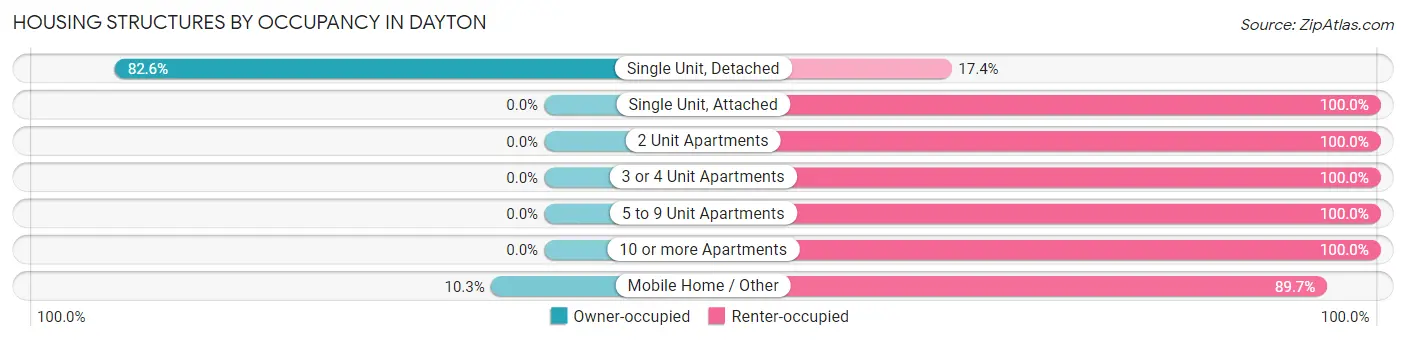
| Structure Type | Owner-occupied | Renter-occupied |
| Single Unit, Detached | 1,356 (82.6%) | 285 (17.4%) |
| Single Unit, Attached | 0 (0.0%) | 65 (100.0%) |
| 2 Unit Apartments | 0 (0.0%) | 391 (100.0%) |
| 3 or 4 Unit Apartments | 0 (0.0%) | 255 (100.0%) |
| 5 to 9 Unit Apartments | 0 (0.0%) | 117 (100.0%) |
| 10 or more Apartments | 0 (0.0%) | 57 (100.0%) |
| Mobile Home / Other | 7 (10.3%) | 61 (89.7%) |
| Total | 1,363 (52.5%) | 1,231 (47.5%) |
Housing Structures by Number of Rooms in Dayton
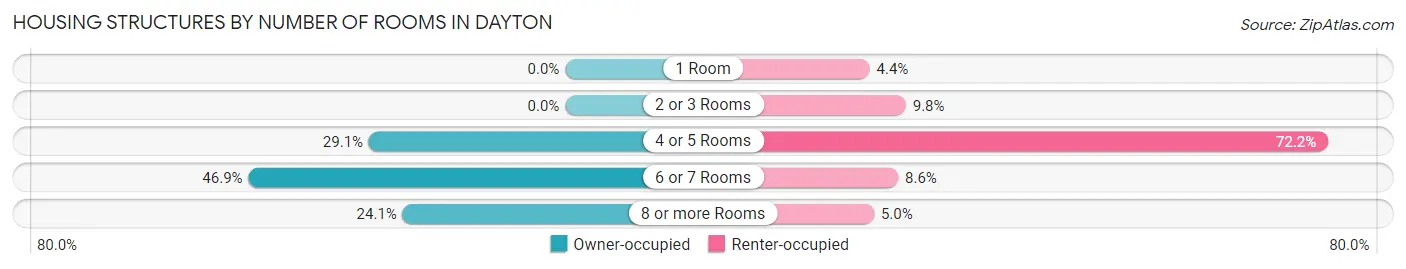
| Number of Rooms | Owner-occupied | Renter-occupied |
| 1 Room | 0 (0.0%) | 54 (4.4%) |
| 2 or 3 Rooms | 0 (0.0%) | 120 (9.8%) |
| 4 or 5 Rooms | 396 (29.0%) | 889 (72.2%) |
| 6 or 7 Rooms | 639 (46.9%) | 106 (8.6%) |
| 8 or more Rooms | 328 (24.1%) | 62 (5.0%) |
| Total | 1,363 (100.0%) | 1,231 (100.0%) |
Housing Structure by Heating Type in Dayton
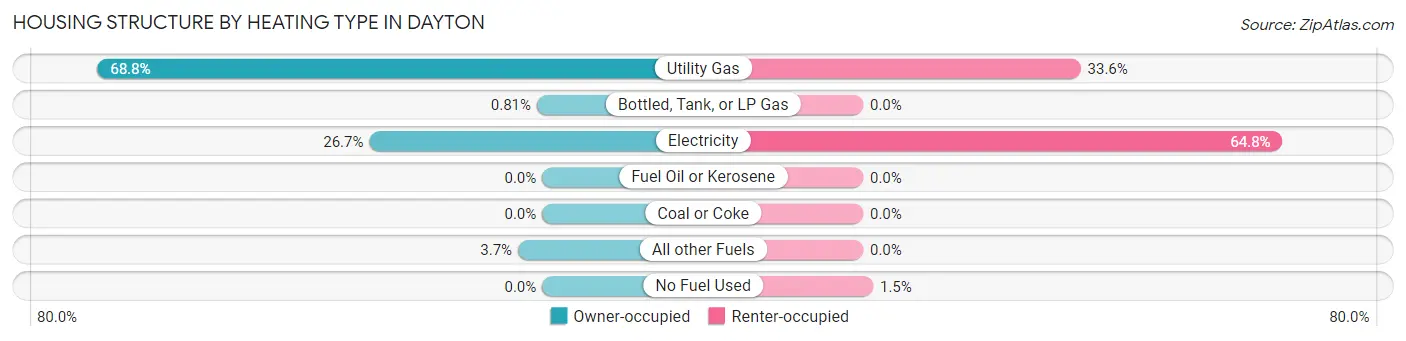
| Heating Type | Owner-occupied | Renter-occupied |
| Utility Gas | 937 (68.8%) | 414 (33.6%) |
| Bottled, Tank, or LP Gas | 11 (0.8%) | 0 (0.0%) |
| Electricity | 364 (26.7%) | 798 (64.8%) |
| Fuel Oil or Kerosene | 0 (0.0%) | 0 (0.0%) |
| Coal or Coke | 0 (0.0%) | 0 (0.0%) |
| All other Fuels | 51 (3.7%) | 0 (0.0%) |
| No Fuel Used | 0 (0.0%) | 19 (1.5%) |
| Total | 1,363 (100.0%) | 1,231 (100.0%) |
Household Vehicle Usage in Dayton
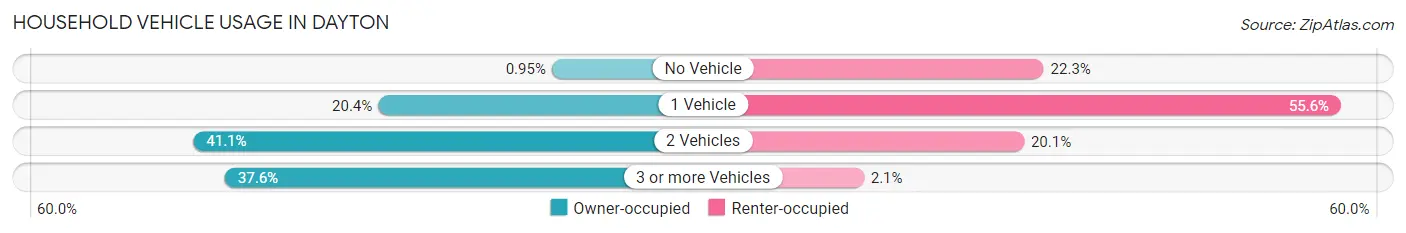
| Vehicles per Household | Owner-occupied | Renter-occupied |
| No Vehicle | 13 (0.9%) | 274 (22.3%) |
| 1 Vehicle | 278 (20.4%) | 684 (55.6%) |
| 2 Vehicles | 560 (41.1%) | 247 (20.1%) |
| 3 or more Vehicles | 512 (37.6%) | 26 (2.1%) |
| Total | 1,363 (100.0%) | 1,231 (100.0%) |
Real Estate & Mortgages in Dayton
Real Estate and Mortgage Overview in Dayton
| Characteristic | Without Mortgage | With Mortgage |
| Housing Units | 652 | 711 |
| Median Property Value | $113,600 | $144,600 |
| Median Household Income | $52,596 | $90 |
| Monthly Housing Costs | $422 | $7 |
| Real Estate Taxes | $682 | $0 |
Property Value by Mortgage Status in Dayton
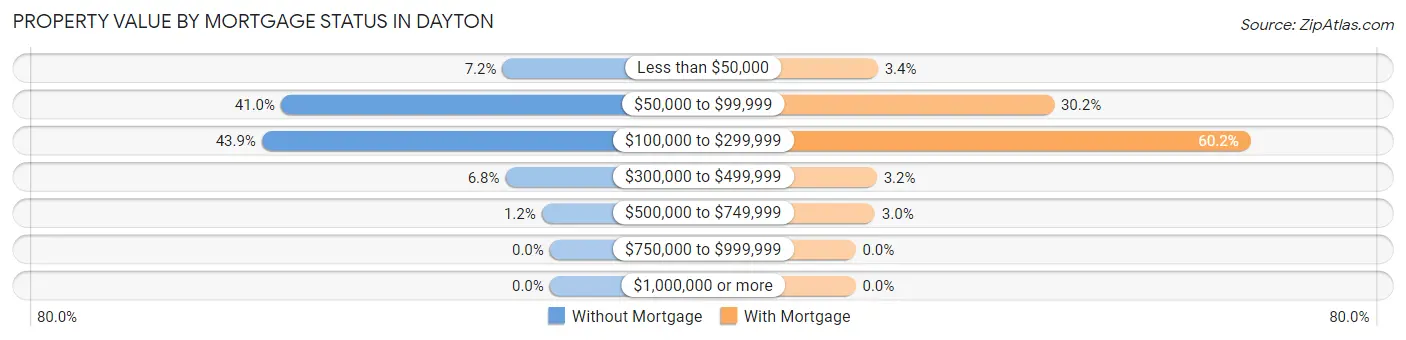
| Property Value | Without Mortgage | With Mortgage |
| Less than $50,000 | 47 (7.2%) | 24 (3.4%) |
| $50,000 to $99,999 | 267 (40.9%) | 215 (30.2%) |
| $100,000 to $299,999 | 286 (43.9%) | 428 (60.2%) |
| $300,000 to $499,999 | 44 (6.8%) | 23 (3.2%) |
| $500,000 to $749,999 | 8 (1.2%) | 21 (2.9%) |
| $750,000 to $999,999 | 0 (0.0%) | 0 (0.0%) |
| $1,000,000 or more | 0 (0.0%) | 0 (0.0%) |
| Total | 652 (100.0%) | 711 (100.0%) |
Household Income by Mortgage Status in Dayton
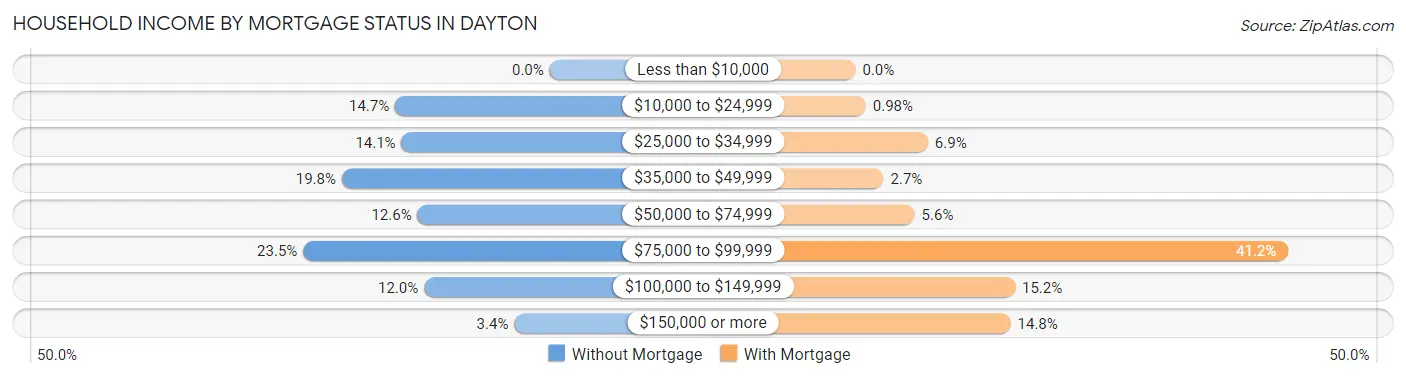
| Household Income | Without Mortgage | With Mortgage |
| Less than $10,000 | 0 (0.0%) | 0 (0.0%) |
| $10,000 to $24,999 | 96 (14.7%) | 7 (1.0%) |
| $25,000 to $34,999 | 92 (14.1%) | 49 (6.9%) |
| $35,000 to $49,999 | 129 (19.8%) | 19 (2.7%) |
| $50,000 to $74,999 | 82 (12.6%) | 40 (5.6%) |
| $75,000 to $99,999 | 153 (23.5%) | 293 (41.2%) |
| $100,000 to $149,999 | 78 (12.0%) | 108 (15.2%) |
| $150,000 or more | 22 (3.4%) | 105 (14.8%) |
| Total | 652 (100.0%) | 711 (100.0%) |
Property Value to Household Income Ratio in Dayton
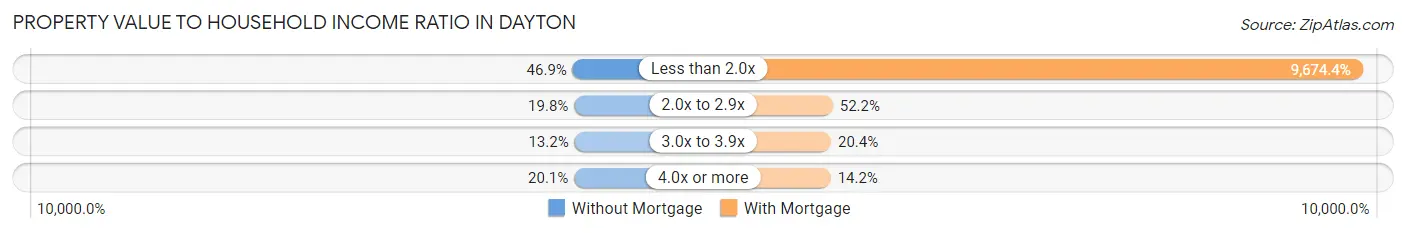
| Value-to-Income Ratio | Without Mortgage | With Mortgage |
| Less than 2.0x | 306 (46.9%) | 68,785 (9,674.4%) |
| 2.0x to 2.9x | 129 (19.8%) | 371 (52.2%) |
| 3.0x to 3.9x | 86 (13.2%) | 145 (20.4%) |
| 4.0x or more | 131 (20.1%) | 101 (14.2%) |
| Total | 652 (100.0%) | 711 (100.0%) |
Real Estate Taxes by Mortgage Status in Dayton
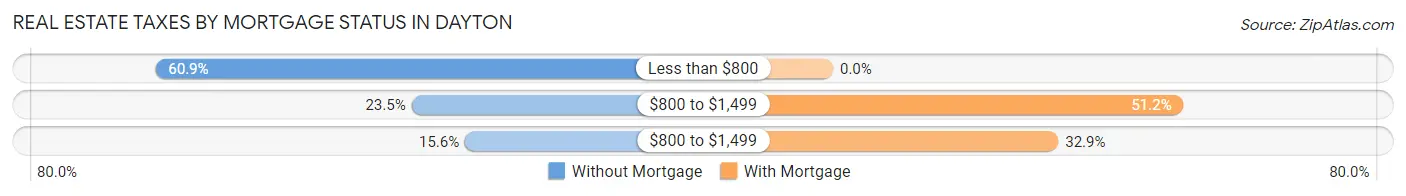
| Property Taxes | Without Mortgage | With Mortgage |
| Less than $800 | 397 (60.9%) | 0 (0.0%) |
| $800 to $1,499 | 153 (23.5%) | 364 (51.2%) |
| $800 to $1,499 | 102 (15.6%) | 234 (32.9%) |
| Total | 652 (100.0%) | 711 (100.0%) |
Health & Disability in Dayton
Health Insurance Coverage by Age in Dayton
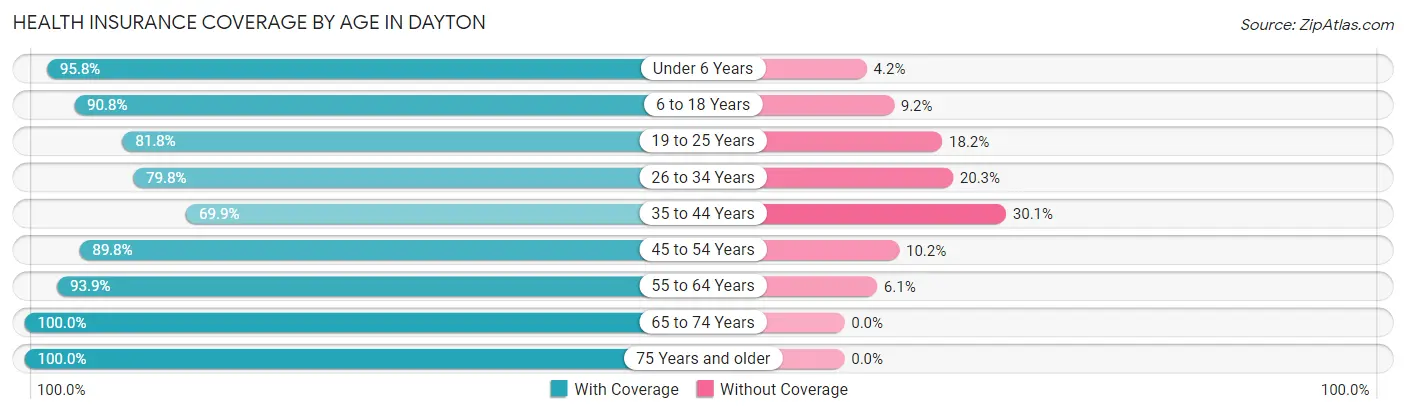
| Age Bracket | With Coverage | Without Coverage |
| Under 6 Years | 483 (95.8%) | 21 (4.2%) |
| 6 to 18 Years | 954 (90.8%) | 97 (9.2%) |
| 19 to 25 Years | 892 (81.8%) | 199 (18.2%) |
| 26 to 34 Years | 756 (79.7%) | 192 (20.3%) |
| 35 to 44 Years | 684 (69.9%) | 295 (30.1%) |
| 45 to 54 Years | 554 (89.8%) | 63 (10.2%) |
| 55 to 64 Years | 664 (93.9%) | 43 (6.1%) |
| 65 to 74 Years | 811 (100.0%) | 0 (0.0%) |
| 75 Years and older | 336 (100.0%) | 0 (0.0%) |
| Total | 6,134 (87.1%) | 910 (12.9%) |
Health Insurance Coverage by Citizenship Status in Dayton
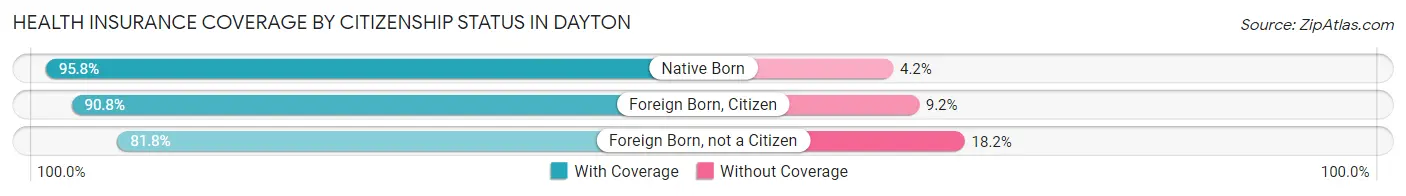
| Citizenship Status | With Coverage | Without Coverage |
| Native Born | 483 (95.8%) | 21 (4.2%) |
| Foreign Born, Citizen | 954 (90.8%) | 97 (9.2%) |
| Foreign Born, not a Citizen | 892 (81.8%) | 199 (18.2%) |
Health Insurance Coverage by Household Income in Dayton
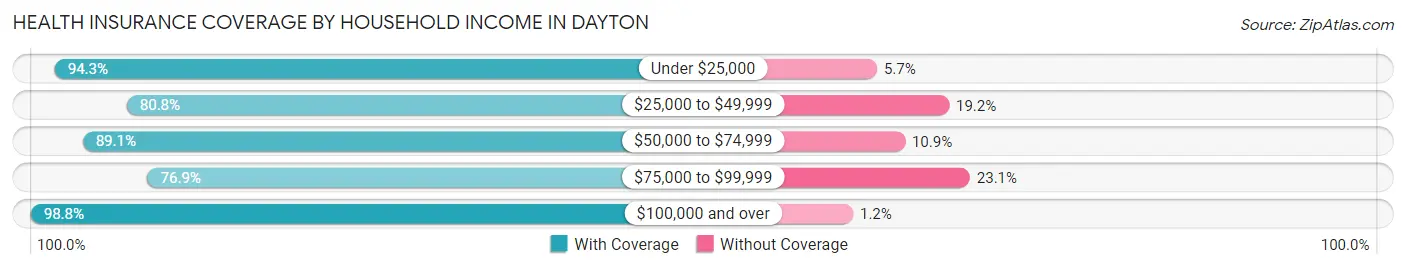
| Household Income | With Coverage | Without Coverage |
| Under $25,000 | 1,167 (94.3%) | 70 (5.7%) |
| $25,000 to $49,999 | 1,249 (80.8%) | 296 (19.2%) |
| $50,000 to $74,999 | 1,627 (89.1%) | 199 (10.9%) |
| $75,000 to $99,999 | 881 (76.9%) | 264 (23.1%) |
| $100,000 and over | 848 (98.8%) | 10 (1.2%) |
Public vs Private Health Insurance Coverage by Age in Dayton
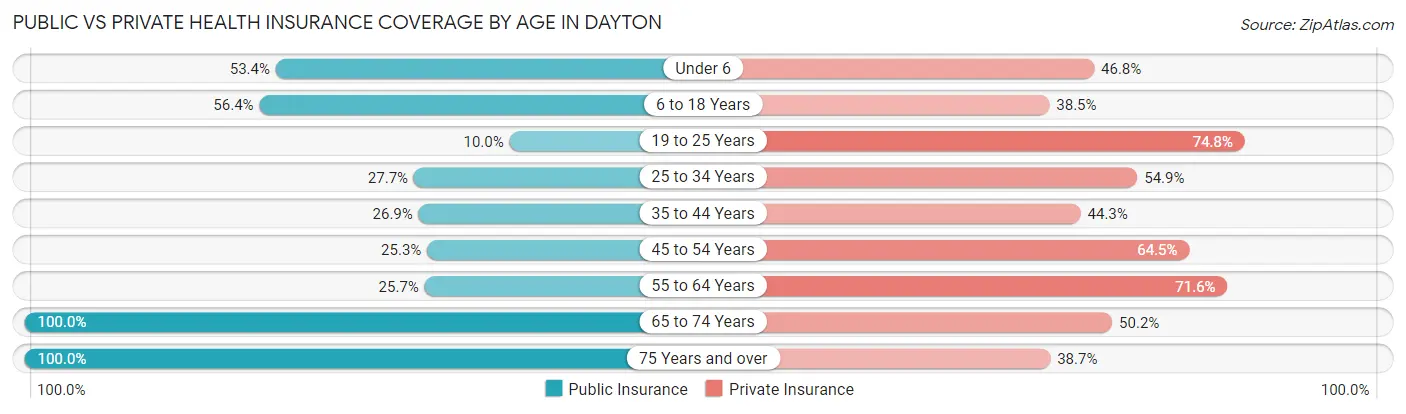
| Age Bracket | Public Insurance | Private Insurance |
| Under 6 | 269 (53.4%) | 236 (46.8%) |
| 6 to 18 Years | 593 (56.4%) | 405 (38.5%) |
| 19 to 25 Years | 109 (10.0%) | 816 (74.8%) |
| 25 to 34 Years | 263 (27.7%) | 520 (54.8%) |
| 35 to 44 Years | 263 (26.9%) | 434 (44.3%) |
| 45 to 54 Years | 156 (25.3%) | 398 (64.5%) |
| 55 to 64 Years | 182 (25.7%) | 506 (71.6%) |
| 65 to 74 Years | 811 (100.0%) | 407 (50.2%) |
| 75 Years and over | 336 (100.0%) | 130 (38.7%) |
| Total | 2,982 (42.3%) | 3,852 (54.7%) |
Disability Status by Sex by Age in Dayton
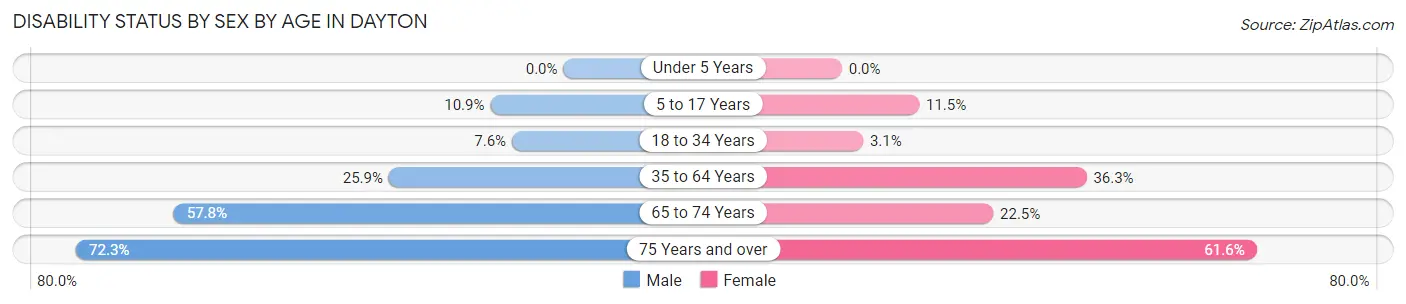
| Age Bracket | Male | Female |
| Under 5 Years | 0 (0.0%) | 0 (0.0%) |
| 5 to 17 Years | 55 (10.8%) | 50 (11.5%) |
| 18 to 34 Years | 96 (7.6%) | 30 (3.1%) |
| 35 to 64 Years | 283 (25.9%) | 440 (36.3%) |
| 65 to 74 Years | 155 (57.8%) | 122 (22.5%) |
| 75 Years and over | 68 (72.3%) | 149 (61.6%) |
Disability Class by Sex by Age in Dayton
Disability Class: Hearing Difficulty
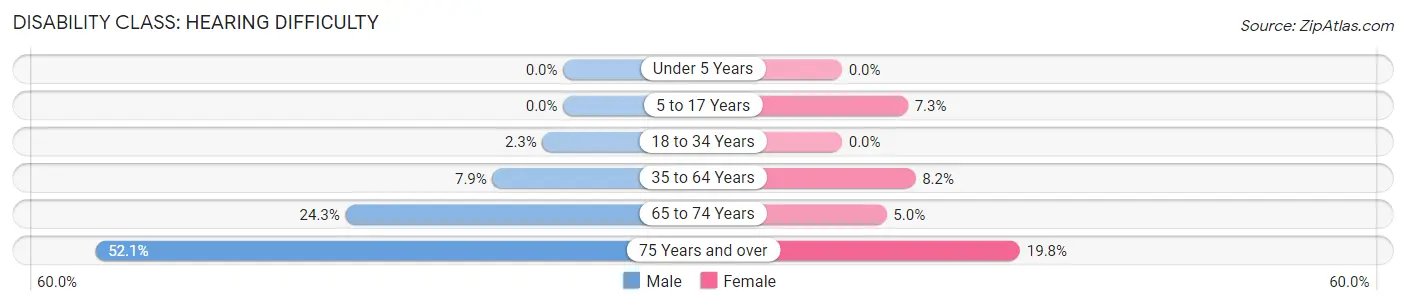
| Age Bracket | Male | Female |
| Under 5 Years | 0 (0.0%) | 0 (0.0%) |
| 5 to 17 Years | 0 (0.0%) | 32 (7.3%) |
| 18 to 34 Years | 29 (2.3%) | 0 (0.0%) |
| 35 to 64 Years | 86 (7.9%) | 99 (8.2%) |
| 65 to 74 Years | 65 (24.2%) | 27 (5.0%) |
| 75 Years and over | 49 (52.1%) | 48 (19.8%) |
Disability Class: Vision Difficulty
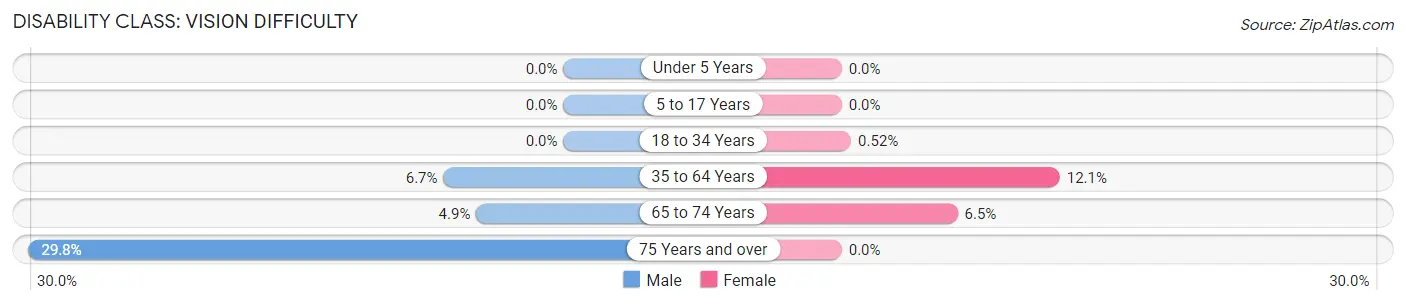
| Age Bracket | Male | Female |
| Under 5 Years | 0 (0.0%) | 0 (0.0%) |
| 5 to 17 Years | 0 (0.0%) | 0 (0.0%) |
| 18 to 34 Years | 0 (0.0%) | 5 (0.5%) |
| 35 to 64 Years | 73 (6.7%) | 147 (12.1%) |
| 65 to 74 Years | 13 (4.9%) | 35 (6.5%) |
| 75 Years and over | 28 (29.8%) | 0 (0.0%) |
Disability Class: Cognitive Difficulty
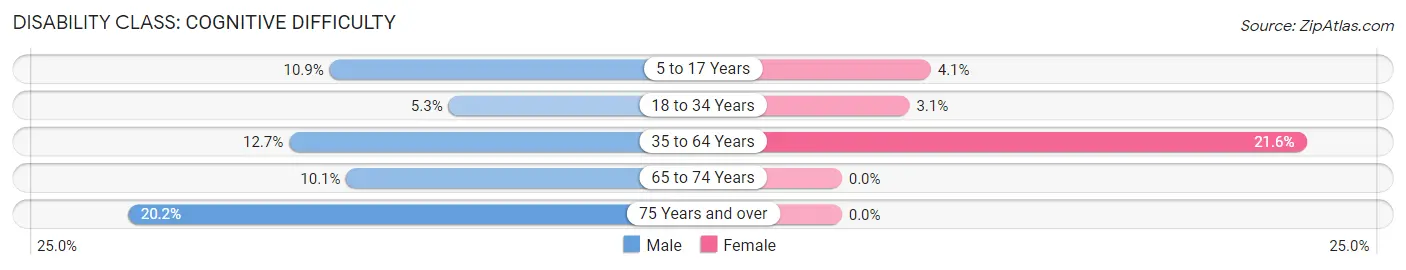
| Age Bracket | Male | Female |
| 5 to 17 Years | 55 (10.8%) | 18 (4.1%) |
| 18 to 34 Years | 67 (5.3%) | 30 (3.1%) |
| 35 to 64 Years | 139 (12.7%) | 261 (21.5%) |
| 65 to 74 Years | 27 (10.1%) | 0 (0.0%) |
| 75 Years and over | 19 (20.2%) | 0 (0.0%) |
Disability Class: Ambulatory Difficulty
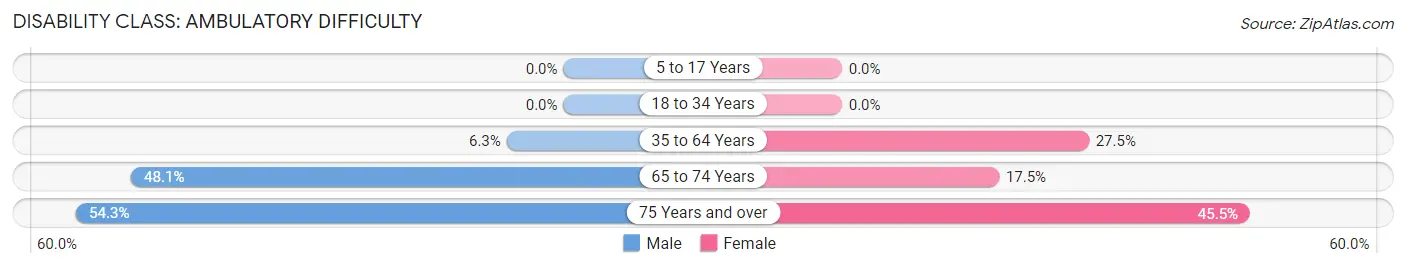
| Age Bracket | Male | Female |
| 5 to 17 Years | 0 (0.0%) | 0 (0.0%) |
| 18 to 34 Years | 0 (0.0%) | 0 (0.0%) |
| 35 to 64 Years | 69 (6.3%) | 333 (27.5%) |
| 65 to 74 Years | 129 (48.1%) | 95 (17.5%) |
| 75 Years and over | 51 (54.3%) | 110 (45.5%) |
Disability Class: Self-Care Difficulty
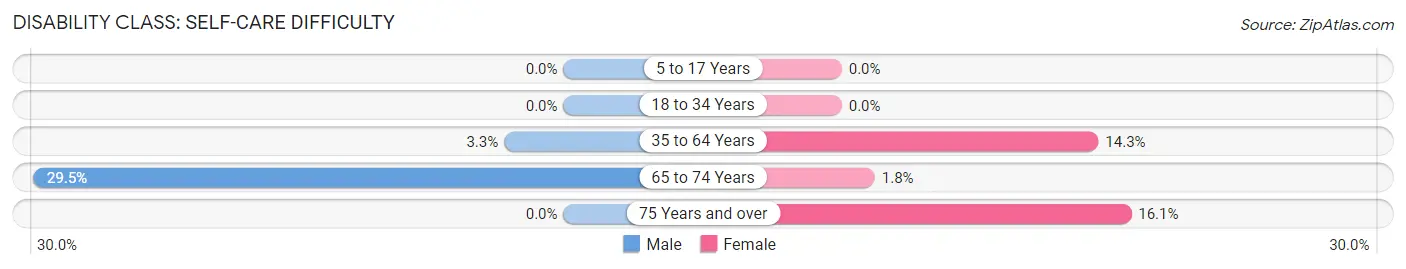
| Age Bracket | Male | Female |
| 5 to 17 Years | 0 (0.0%) | 0 (0.0%) |
| 18 to 34 Years | 0 (0.0%) | 0 (0.0%) |
| 35 to 64 Years | 36 (3.3%) | 173 (14.3%) |
| 65 to 74 Years | 79 (29.5%) | 10 (1.8%) |
| 75 Years and over | 0 (0.0%) | 39 (16.1%) |
Technology Access in Dayton
Computing Device Access in Dayton
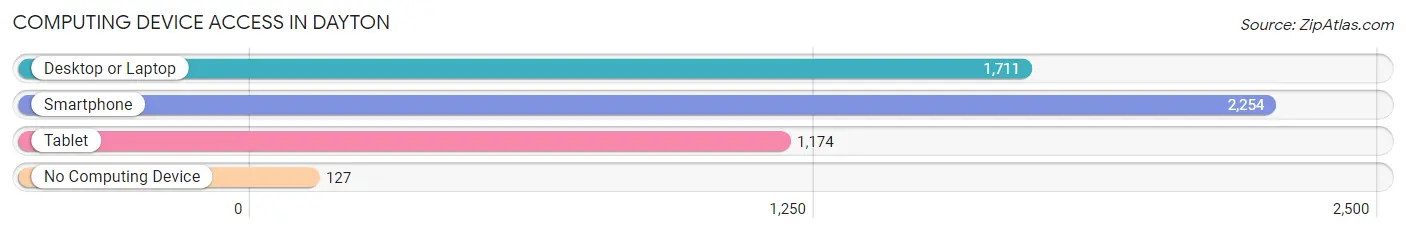
| Device Type | # Households | % Households |
| Desktop or Laptop | 1,711 | 66.0% |
| Smartphone | 2,254 | 86.9% |
| Tablet | 1,174 | 45.3% |
| No Computing Device | 127 | 4.9% |
| Total | 2,594 | 100.0% |
Internet Access in Dayton
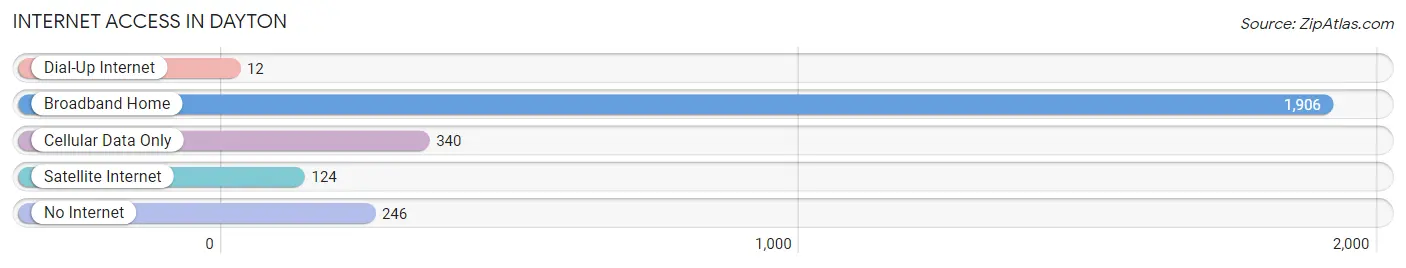
| Internet Type | # Households | % Households |
| Dial-Up Internet | 12 | 0.5% |
| Broadband Home | 1,906 | 73.5% |
| Cellular Data Only | 340 | 13.1% |
| Satellite Internet | 124 | 4.8% |
| No Internet | 246 | 9.5% |
| Total | 2,594 | 100.0% |
Dayton Summary
Dayton, Tennessee is a small city located in Rhea County, in the southeastern part of the state. It is situated along the banks of the Tennessee River, and is part of the Chattanooga metropolitan area. The city has a population of approximately 7,000 people, and is the county seat of Rhea County.
History
Dayton was founded in 1820 by William and John Dayton, two brothers from North Carolina. The brothers had purchased the land from the Cherokee Indians, and the city was named after them. The city was incorporated in 1877, and the first mayor was elected in 1878.
In the late 19th century, Dayton was a thriving industrial center, with several factories and mills. The city was also home to several large tobacco warehouses, and was a major center for the production of tobacco products.
In the early 20th century, Dayton was a major center for the production of textiles. The city was home to several large textile mills, and was a major supplier of cotton and wool products.
Geography
Dayton is located in the southeastern part of Tennessee, in Rhea County. The city is situated along the banks of the Tennessee River, and is part of the Chattanooga metropolitan area. The city has a total area of 8.3 square miles, and is located at an elevation of 845 feet.
The climate in Dayton is humid subtropical, with hot, humid summers and mild winters. The average annual temperature is around 63 degrees Fahrenheit, and the average annual precipitation is around 45 inches.
Economy
Dayton’s economy is largely based on manufacturing and agriculture. The city is home to several large factories and mills, and is a major supplier of textiles, tobacco products, and agricultural products.
The city is also home to several large retail stores, including Walmart, Kmart, and Target. The city is also home to several restaurants, bars, and other businesses.
Demographics
As of the 2010 census, Dayton had a population of 7,000 people. The racial makeup of the city was 87.3% White, 8.2% African American, 0.7% Native American, 0.4% Asian, 0.1% Pacific Islander, and 2.3% from other races.
The median household income in Dayton was $31,250, and the median family income was $37,500. The per capita income in the city was $17,845. About 17.2% of the population was below the poverty line.
Dayton is served by the Rhea County School District, which includes several elementary, middle, and high schools. The city is also home to several private schools, including Dayton Christian School and Rhea County Academy.
Common Questions
What is Per Capita Income in Dayton?
Per Capita income in Dayton is $22,801.
What is the Median Family Income in Dayton?
Median Family Income in Dayton is $56,922.
What is the Median Household income in Dayton?
Median Household Income in Dayton is $54,511.
What is Income or Wage Gap in Dayton?
Income or Wage Gap in Dayton is 24.4%.
Women in Dayton earn 75.6 cents for every dollar earned by a man.
What is Inequality or Gini Index in Dayton?
Inequality or Gini Index in Dayton is 0.46.
What is the Total Population of Dayton?
Total Population of Dayton is 7,139.
What is the Total Male Population of Dayton?
Total Male Population of Dayton is 3,526.
What is the Total Female Population of Dayton?
Total Female Population of Dayton is 3,613.
What is the Ratio of Males per 100 Females in Dayton?
There are 97.59 Males per 100 Females in Dayton.
What is the Ratio of Females per 100 Males in Dayton?
There are 102.47 Females per 100 Males in Dayton.
What is the Median Population Age in Dayton?
Median Population Age in Dayton is 34.6 Years.
What is the Average Family Size in Dayton
Average Family Size in Dayton is 2.8 People.
What is the Average Household Size in Dayton
Average Household Size in Dayton is 2.5 People.
How Large is the Labor Force in Dayton?
There are 3,105 People in the Labor Forcein in Dayton.
What is the Percentage of People in the Labor Force in Dayton?
52.8% of People are in the Labor Force in Dayton.
What is the Unemployment Rate in Dayton?
Unemployment Rate in Dayton is 6.0%.