Shelbyville, TN Map & Demographics
Shelbyville Map
Shelbyville Overview
$22,905
PER CAPITA INCOME
$55,142
AVG FAMILY INCOME
$50,694
AVG HOUSEHOLD INCOME
20.6%
WAGE / INCOME GAP [ % ]
79.4¢/ $1
WAGE / INCOME GAP [ $ ]
$10,768
FAMILY INCOME DEFICIT
0.40
INEQUALITY / GINI INDEX
23,676
TOTAL POPULATION
11,867
MALE POPULATION
11,809
FEMALE POPULATION
100.49
MALES / 100 FEMALES
99.51
FEMALES / 100 MALES
31.3
MEDIAN AGE
3.4
AVG FAMILY SIZE
2.8
AVG HOUSEHOLD SIZE
11,720
LABOR FORCE [ PEOPLE ]
68.0%
PERCENT IN LABOR FORCE
4.0%
UNEMPLOYMENT RATE
Shelbyville Zip Codes
Shelbyville Area Codes
Income in Shelbyville
Income Overview in Shelbyville
Per Capita Income in Shelbyville is $22,905, while median incomes of families and households are $55,142 and $50,694 respectively.
| Characteristic | Number | Measure |
| Per Capita Income | 23,676 | $22,905 |
| Median Family Income | 5,342 | $55,142 |
| Mean Family Income | 5,342 | $64,513 |
| Median Household Income | 8,311 | $50,694 |
| Mean Household Income | 8,311 | $61,352 |
| Income Deficit | 5,342 | $10,768 |
| Wage / Income Gap (%) | 23,676 | 20.56% |
| Wage / Income Gap ($) | 23,676 | 79.44¢ per $1 |
| Gini / Inequality Index | 23,676 | 0.40 |
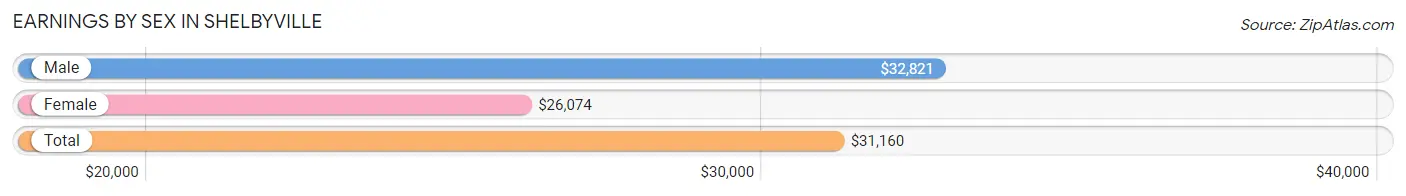
Earnings by Sex in Shelbyville
Average Earnings in Shelbyville are $31,160, $32,821 for men and $26,074 for women, a difference of 20.6%.
| Sex | Number | Average Earnings |
| Male | 6,619 (53.2%) | $32,821 |
| Female | 5,831 (46.8%) | $26,074 |
| Total | 12,450 (100.0%) | $31,160 |
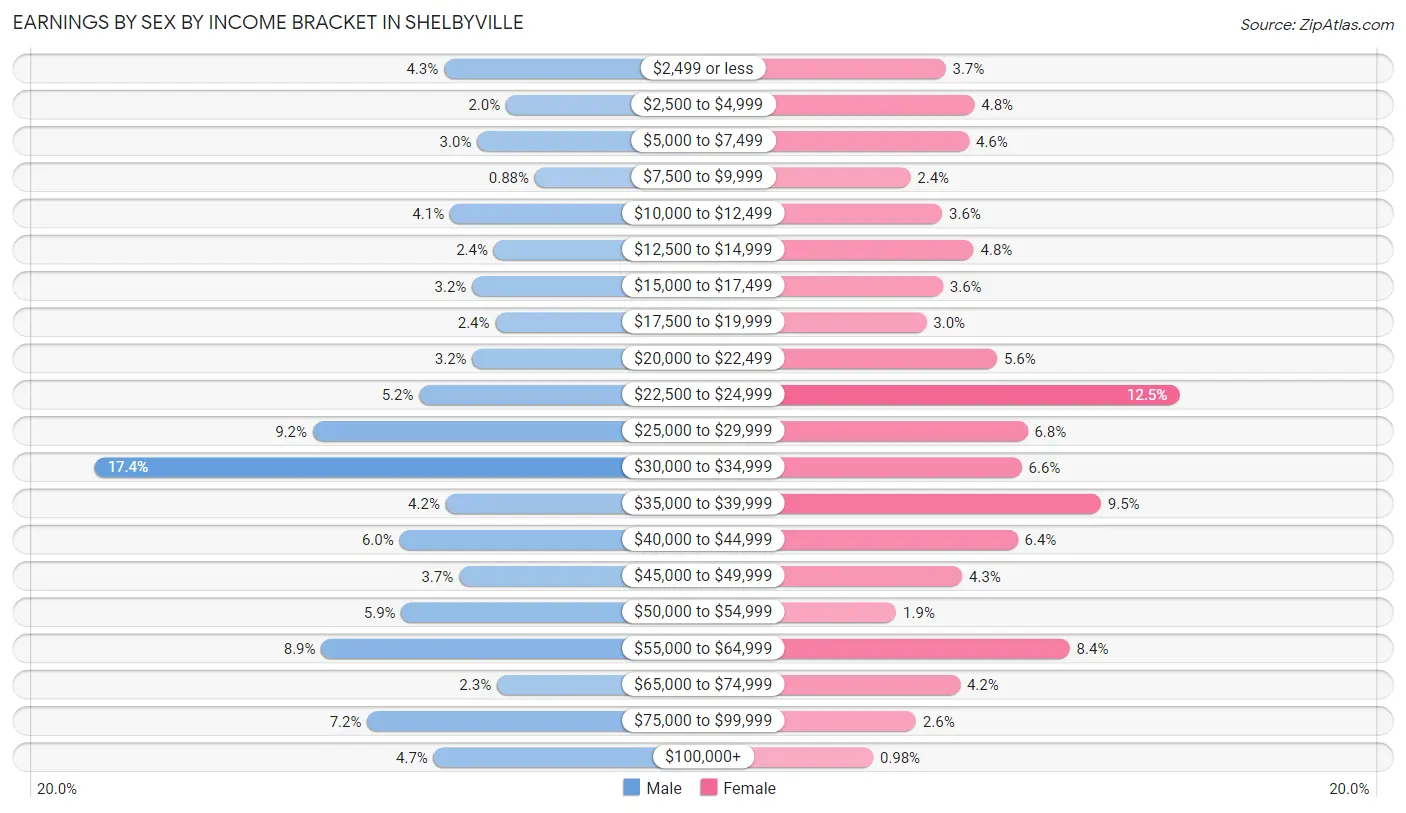
Earnings by Sex by Income Bracket in Shelbyville
The most common earnings brackets in Shelbyville are $30,000 to $34,999 for men (1,150 | 17.4%) and $22,500 to $24,999 for women (726 | 12.4%).
| Income | Male | Female |
| $2,499 or less | 283 (4.3%) | 216 (3.7%) |
| $2,500 to $4,999 | 130 (2.0%) | 279 (4.8%) |
| $5,000 to $7,499 | 201 (3.0%) | 267 (4.6%) |
| $7,500 to $9,999 | 58 (0.9%) | 139 (2.4%) |
| $10,000 to $12,499 | 269 (4.1%) | 208 (3.6%) |
| $12,500 to $14,999 | 160 (2.4%) | 277 (4.8%) |
| $15,000 to $17,499 | 214 (3.2%) | 210 (3.6%) |
| $17,500 to $19,999 | 156 (2.4%) | 174 (3.0%) |
| $20,000 to $22,499 | 213 (3.2%) | 328 (5.6%) |
| $22,500 to $24,999 | 345 (5.2%) | 726 (12.4%) |
| $25,000 to $29,999 | 609 (9.2%) | 395 (6.8%) |
| $30,000 to $34,999 | 1,150 (17.4%) | 382 (6.6%) |
| $35,000 to $39,999 | 279 (4.2%) | 555 (9.5%) |
| $40,000 to $44,999 | 394 (5.9%) | 373 (6.4%) |
| $45,000 to $49,999 | 246 (3.7%) | 252 (4.3%) |
| $50,000 to $54,999 | 389 (5.9%) | 108 (1.8%) |
| $55,000 to $64,999 | 588 (8.9%) | 487 (8.4%) |
| $65,000 to $74,999 | 152 (2.3%) | 247 (4.2%) |
| $75,000 to $99,999 | 474 (7.2%) | 151 (2.6%) |
| $100,000+ | 309 (4.7%) | 57 (1.0%) |
| Total | 6,619 (100.0%) | 5,831 (100.0%) |
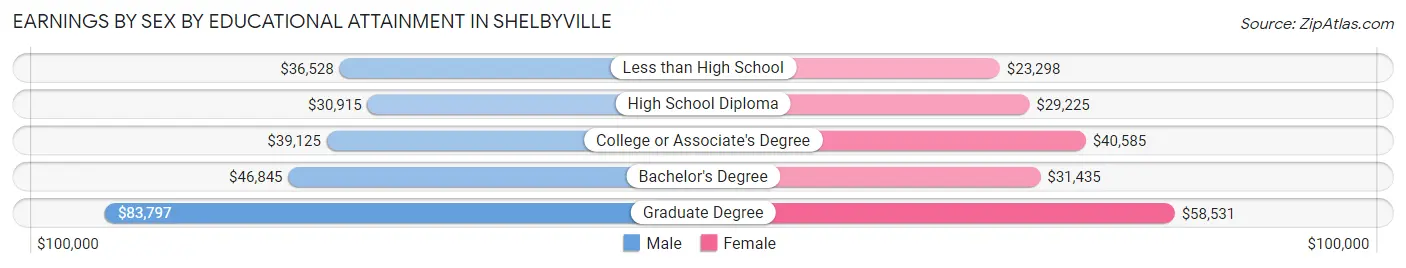
Earnings by Sex by Educational Attainment in Shelbyville
Average earnings in Shelbyville are $33,682 for men and $30,789 for women, a difference of 8.6%. Men with an educational attainment of graduate degree enjoy the highest average annual earnings of $83,797, while those with high school diploma education earn the least with $30,915. Women with an educational attainment of graduate degree earn the most with the average annual earnings of $58,531, while those with less than high school education have the smallest earnings of $23,298.
| Educational Attainment | Male Income | Female Income |
| Less than High School | $36,528 | $23,298 |
| High School Diploma | $30,915 | $29,225 |
| College or Associate's Degree | $39,125 | $40,585 |
| Bachelor's Degree | $46,845 | $31,435 |
| Graduate Degree | $83,797 | $58,531 |
| Total | $33,682 | $30,789 |
Family Income in Shelbyville
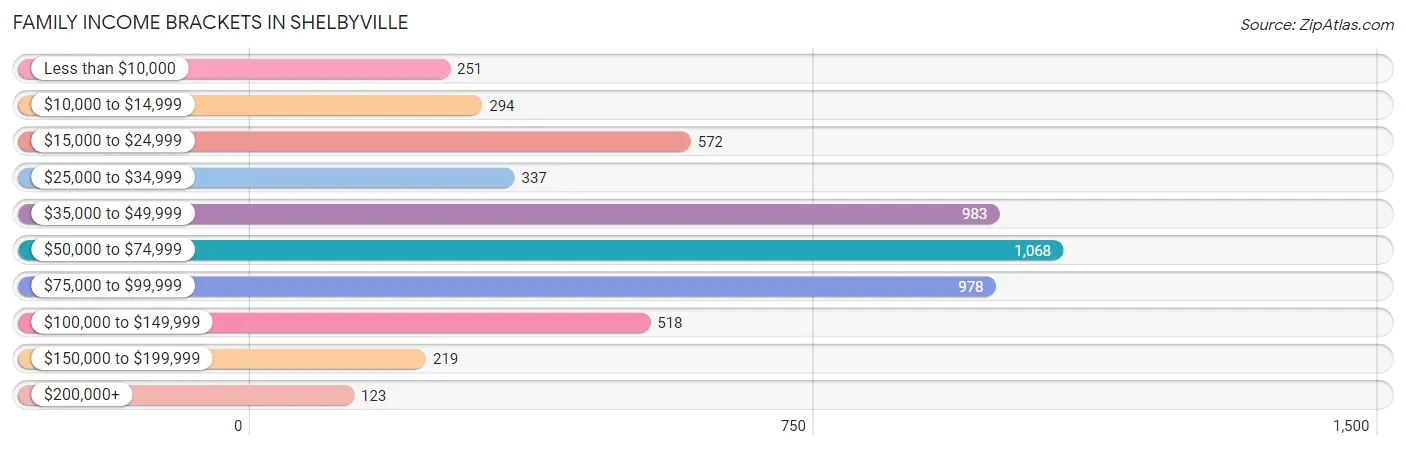
Family Income Brackets in Shelbyville
According to the Shelbyville family income data, there are 1,068 families falling into the $50,000 to $74,999 income range, which is the most common income bracket and makes up 20.0% of all families. Conversely, the $200,000+ income bracket is the least frequent group with only 123 families (2.3%) belonging to this category.
| Income Bracket | # Families | % Families |
| Less than $10,000 | 251 | 4.7% |
| $10,000 to $14,999 | 294 | 5.5% |
| $15,000 to $24,999 | 572 | 10.7% |
| $25,000 to $34,999 | 337 | 6.3% |
| $35,000 to $49,999 | 983 | 18.4% |
| $50,000 to $74,999 | 1,068 | 20.0% |
| $75,000 to $99,999 | 978 | 18.3% |
| $100,000 to $149,999 | 518 | 9.7% |
| $150,000 to $199,999 | 219 | 4.1% |
| $200,000+ | 123 | 2.3% |
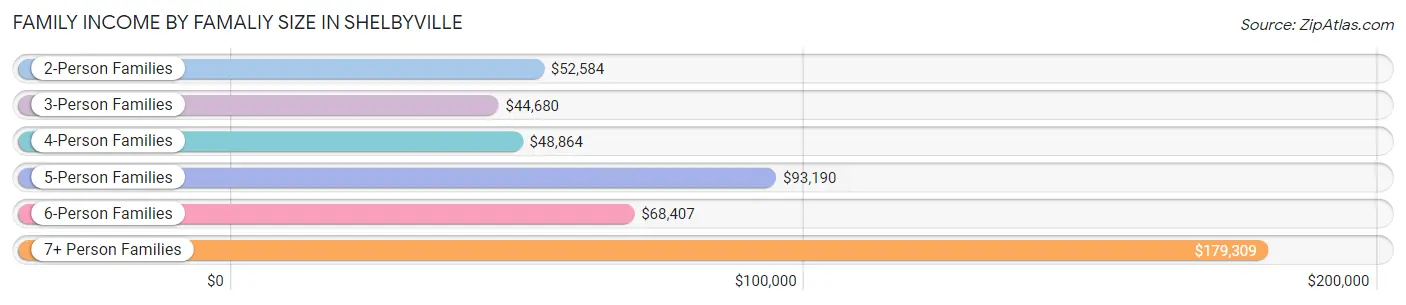
Family Income by Famaliy Size in Shelbyville
7+ person families (126 | 2.4%) account for the highest median family income in Shelbyville with $179,309 per family, while 2-person families (2,426 | 45.4%) have the highest median income of $26,292 per family member.
| Income Bracket | # Families | Median Income |
| 2-Person Families | 2,426 (45.4%) | $52,584 |
| 3-Person Families | 856 (16.0%) | $44,680 |
| 4-Person Families | 1,290 (24.1%) | $48,864 |
| 5-Person Families | 440 (8.2%) | $93,190 |
| 6-Person Families | 204 (3.8%) | $68,407 |
| 7+ Person Families | 126 (2.4%) | $179,309 |
| Total | 5,342 (100.0%) | $55,142 |
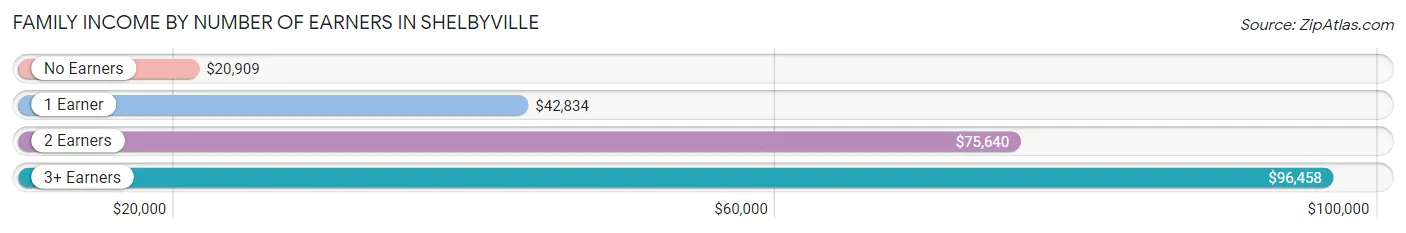
Family Income by Number of Earners in Shelbyville
The median family income in Shelbyville is $55,142, with families comprising 3+ earners (710) having the highest median family income of $96,458, while families with no earners (674) have the lowest median family income of $20,909, accounting for 13.3% and 12.6% of families, respectively.
| Number of Earners | # Families | Median Income |
| No Earners | 674 (12.6%) | $20,909 |
| 1 Earner | 1,863 (34.9%) | $42,834 |
| 2 Earners | 2,095 (39.2%) | $75,640 |
| 3+ Earners | 710 (13.3%) | $96,458 |
| Total | 5,342 (100.0%) | $55,142 |
Household Income in Shelbyville
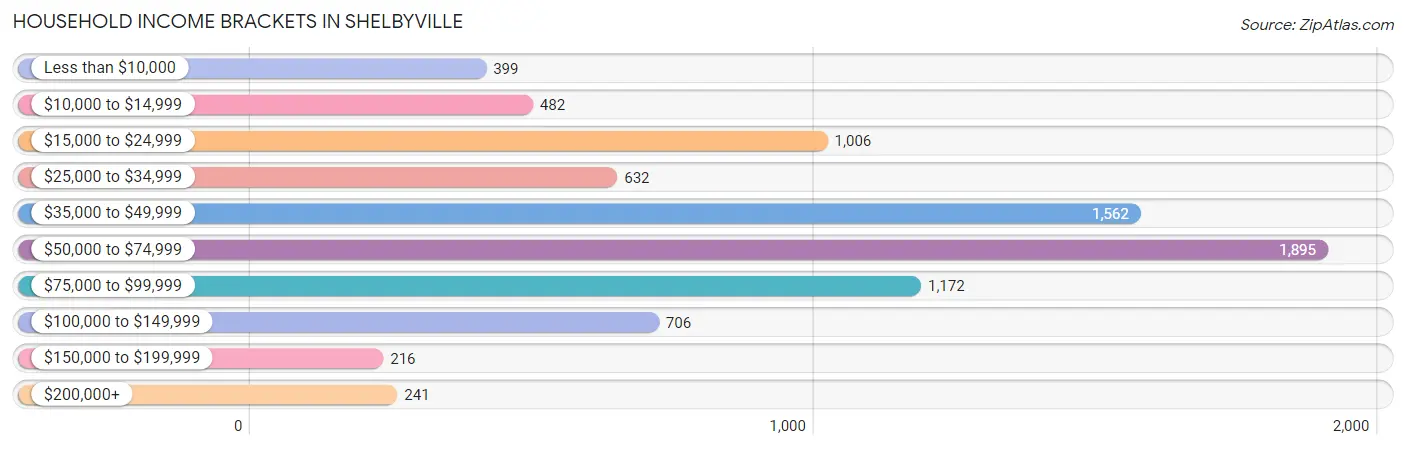
Household Income Brackets in Shelbyville
With 1,895 households falling in the category, the $50,000 to $74,999 income range is the most frequent in Shelbyville, accounting for 22.8% of all households. In contrast, only 216 households (2.6%) fall into the $150,000 to $199,999 income bracket, making it the least populous group.
| Income Bracket | # Households | % Households |
| Less than $10,000 | 399 | 4.8% |
| $10,000 to $14,999 | 482 | 5.8% |
| $15,000 to $24,999 | 1,006 | 12.1% |
| $25,000 to $34,999 | 632 | 7.6% |
| $35,000 to $49,999 | 1,562 | 18.8% |
| $50,000 to $74,999 | 1,895 | 22.8% |
| $75,000 to $99,999 | 1,172 | 14.1% |
| $100,000 to $149,999 | 706 | 8.5% |
| $150,000 to $199,999 | 216 | 2.6% |
| $200,000+ | 241 | 2.9% |
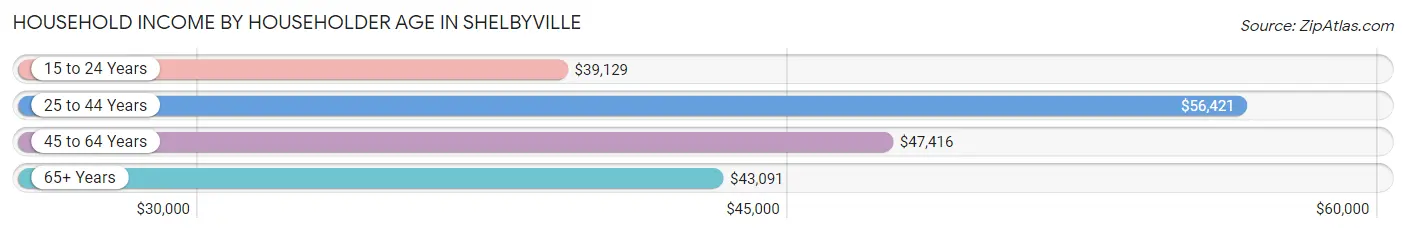
Household Income by Householder Age in Shelbyville
The median household income in Shelbyville is $50,694, with the highest median household income of $56,421 found in the 25 to 44 years age bracket for the primary householder. A total of 3,163 households (38.1%) fall into this category. Meanwhile, the 15 to 24 years age bracket for the primary householder has the lowest median household income of $39,129, with 337 households (4.1%) in this group.
| Income Bracket | # Households | Median Income |
| 15 to 24 Years | 337 (4.1%) | $39,129 |
| 25 to 44 Years | 3,163 (38.1%) | $56,421 |
| 45 to 64 Years | 3,028 (36.4%) | $47,416 |
| 65+ Years | 1,783 (21.4%) | $43,091 |
| Total | 8,311 (100.0%) | $50,694 |
Poverty in Shelbyville
Income Below Poverty by Sex and Age in Shelbyville
With 14.6% poverty level for males and 21.6% for females among the residents of Shelbyville, 5 year old males and 5 year old females are the most vulnerable to poverty, with 78 males (48.7%) and 146 females (44.8%) in their respective age groups living below the poverty level.
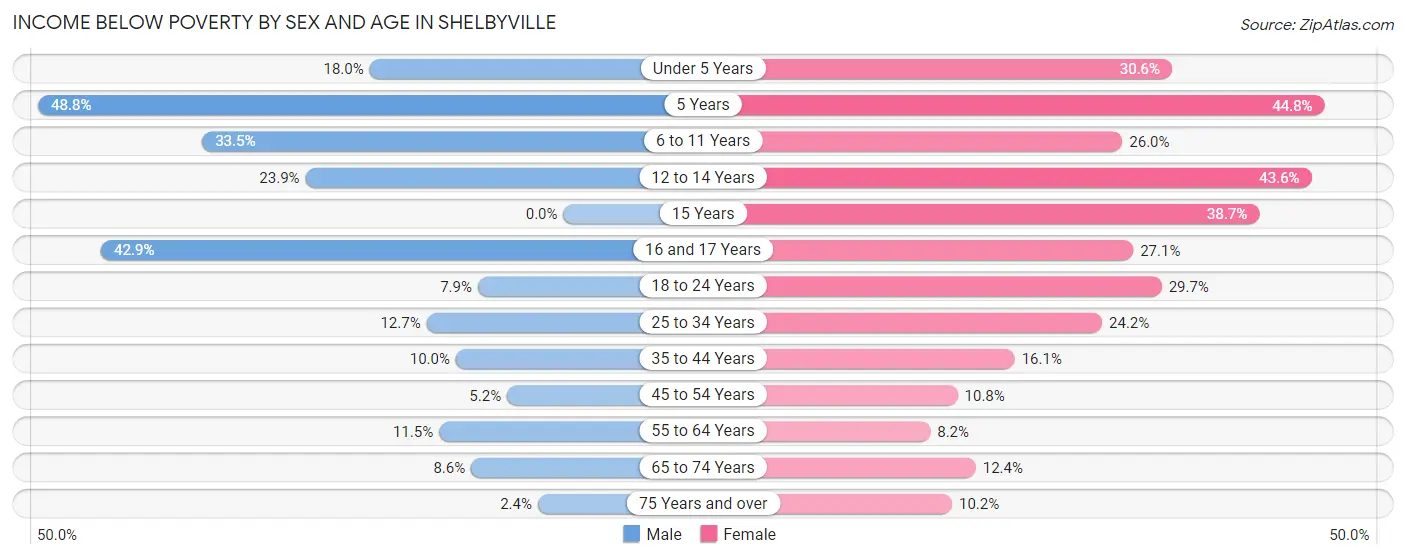
| Age Bracket | Male | Female |
| Under 5 Years | 197 (18.0%) | 242 (30.6%) |
| 5 Years | 78 (48.7%) | 146 (44.8%) |
| 6 to 11 Years | 454 (33.5%) | 269 (26.0%) |
| 12 to 14 Years | 96 (23.9%) | 329 (43.6%) |
| 15 Years | 0 (0.0%) | 67 (38.7%) |
| 16 and 17 Years | 142 (42.9%) | 89 (27.1%) |
| 18 to 24 Years | 74 (7.9%) | 280 (29.7%) |
| 25 to 34 Years | 237 (12.7%) | 439 (24.2%) |
| 35 to 44 Years | 146 (10.0%) | 234 (16.1%) |
| 45 to 54 Years | 81 (5.2%) | 157 (10.7%) |
| 55 to 64 Years | 135 (11.5%) | 94 (8.2%) |
| 65 to 74 Years | 30 (8.6%) | 101 (12.4%) |
| 75 Years and over | 14 (2.4%) | 58 (10.2%) |
| Total | 1,684 (14.6%) | 2,505 (21.6%) |
Income Above Poverty by Sex and Age in Shelbyville
According to the poverty statistics in Shelbyville, males aged 15 years and females aged 55 to 64 years are the age groups that are most secure financially, with 100.0% of males and 91.8% of females in these age groups living above the poverty line.
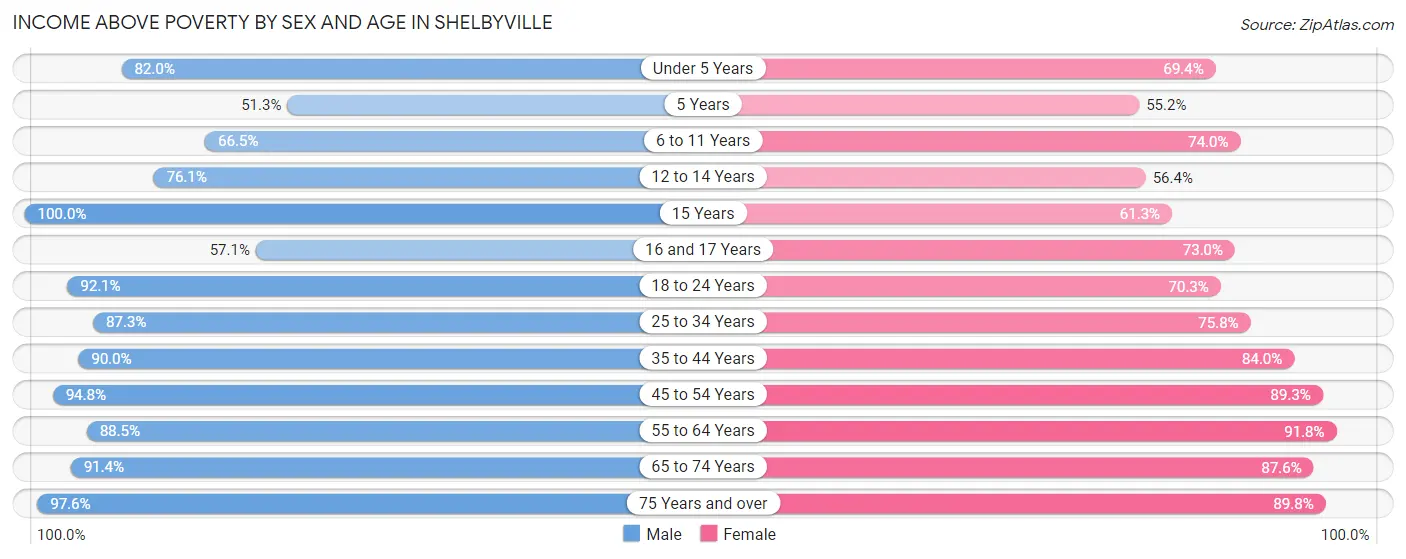
| Age Bracket | Male | Female |
| Under 5 Years | 898 (82.0%) | 548 (69.4%) |
| 5 Years | 82 (51.2%) | 180 (55.2%) |
| 6 to 11 Years | 901 (66.5%) | 764 (74.0%) |
| 12 to 14 Years | 305 (76.1%) | 426 (56.4%) |
| 15 Years | 272 (100.0%) | 106 (61.3%) |
| 16 and 17 Years | 189 (57.1%) | 240 (73.0%) |
| 18 to 24 Years | 858 (92.1%) | 663 (70.3%) |
| 25 to 34 Years | 1,629 (87.3%) | 1,378 (75.8%) |
| 35 to 44 Years | 1,317 (90.0%) | 1,224 (84.0%) |
| 45 to 54 Years | 1,467 (94.8%) | 1,303 (89.2%) |
| 55 to 64 Years | 1,035 (88.5%) | 1,051 (91.8%) |
| 65 to 74 Years | 320 (91.4%) | 711 (87.6%) |
| 75 Years and over | 577 (97.6%) | 509 (89.8%) |
| Total | 9,850 (85.4%) | 9,103 (78.4%) |
Income Below Poverty Among Married-Couple Families in Shelbyville
The poverty statistics for married-couple families in Shelbyville show that 1.5% or 42 of the total 2,753 families live below the poverty line. Families with no children have the highest poverty rate of 2.2%, comprising of 35 families. On the other hand, families with 3 or 4 children have the lowest poverty rate of 0.0%, which includes 0 families.
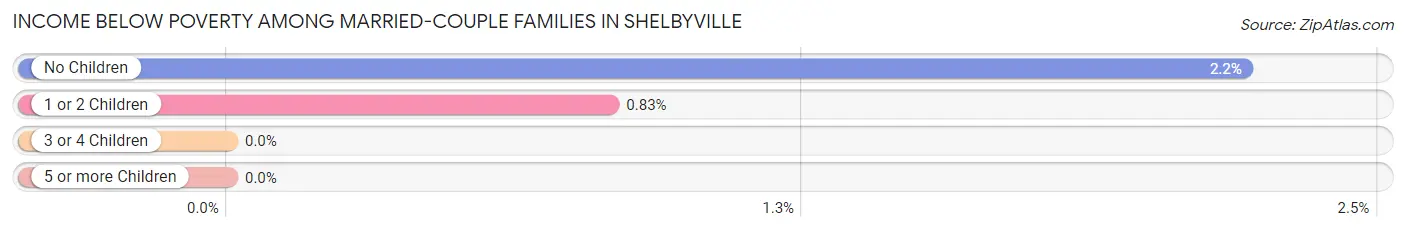
| Children | Above Poverty | Below Poverty |
| No Children | 1,550 (97.8%) | 35 (2.2%) |
| 1 or 2 Children | 838 (99.2%) | 7 (0.8%) |
| 3 or 4 Children | 305 (100.0%) | 0 (0.0%) |
| 5 or more Children | 18 (100.0%) | 0 (0.0%) |
| Total | 2,711 (98.5%) | 42 (1.5%) |
Income Below Poverty Among Single-Parent Households in Shelbyville
According to the poverty data in Shelbyville, 39.9% or 289 single-father households and 34.8% or 649 single-mother households are living below the poverty line. Among single-father households, those with 1 or 2 children have the highest poverty rate, with 218 households (53.6%) experiencing poverty. Likewise, among single-mother households, those with 3 or 4 children have the highest poverty rate, with 449 households (69.3%) falling below the poverty line.
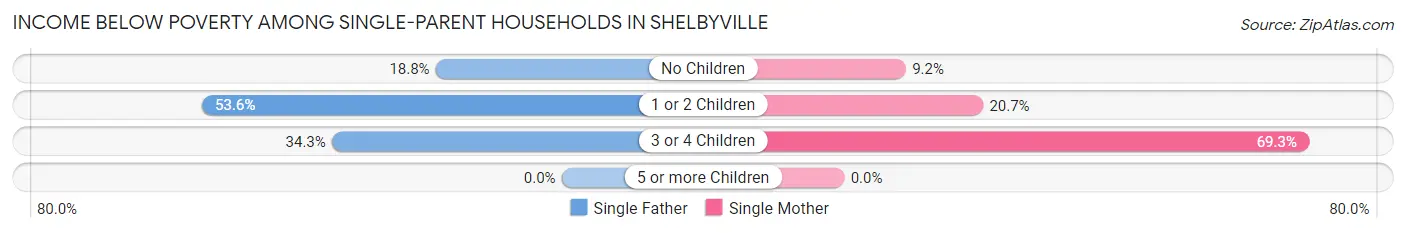
| Children | Single Father | Single Mother |
| No Children | 46 (18.8%) | 41 (9.2%) |
| 1 or 2 Children | 218 (53.6%) | 159 (20.7%) |
| 3 or 4 Children | 25 (34.3%) | 449 (69.3%) |
| 5 or more Children | 0 (0.0%) | 0 (0.0%) |
| Total | 289 (39.9%) | 649 (34.8%) |
Income Below Poverty Among Married-Couple vs Single-Parent Households in Shelbyville
The poverty data for Shelbyville shows that 42 of the married-couple family households (1.5%) and 938 of the single-parent households (36.2%) are living below the poverty level. Within the married-couple family households, those with no children have the highest poverty rate, with 35 households (2.2%) falling below the poverty line. Among the single-parent households, those with 3 or 4 children have the highest poverty rate, with 474 household (65.7%) living below poverty.
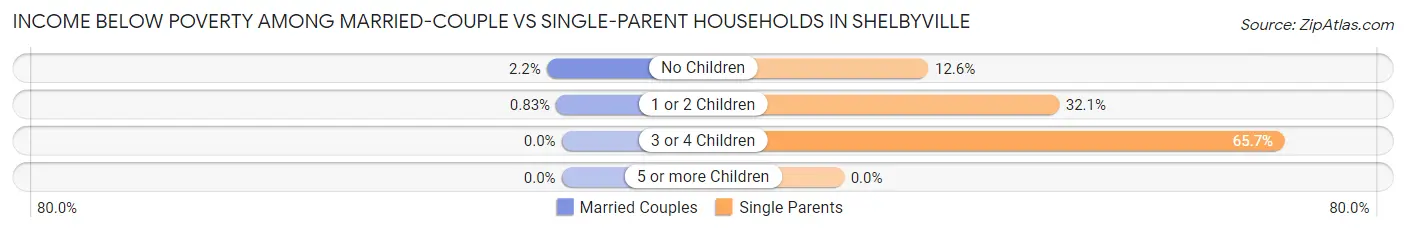
| Children | Married-Couple Families | Single-Parent Households |
| No Children | 35 (2.2%) | 87 (12.6%) |
| 1 or 2 Children | 7 (0.8%) | 377 (32.1%) |
| 3 or 4 Children | 0 (0.0%) | 474 (65.7%) |
| 5 or more Children | 0 (0.0%) | 0 (0.0%) |
| Total | 42 (1.5%) | 938 (36.2%) |
Race in Shelbyville
The most populous races in Shelbyville are White / Caucasian (16,206 | 68.4%), Hispanic or Latino (5,776 | 24.4%), and Two or more Races (2,839 | 12.0%).
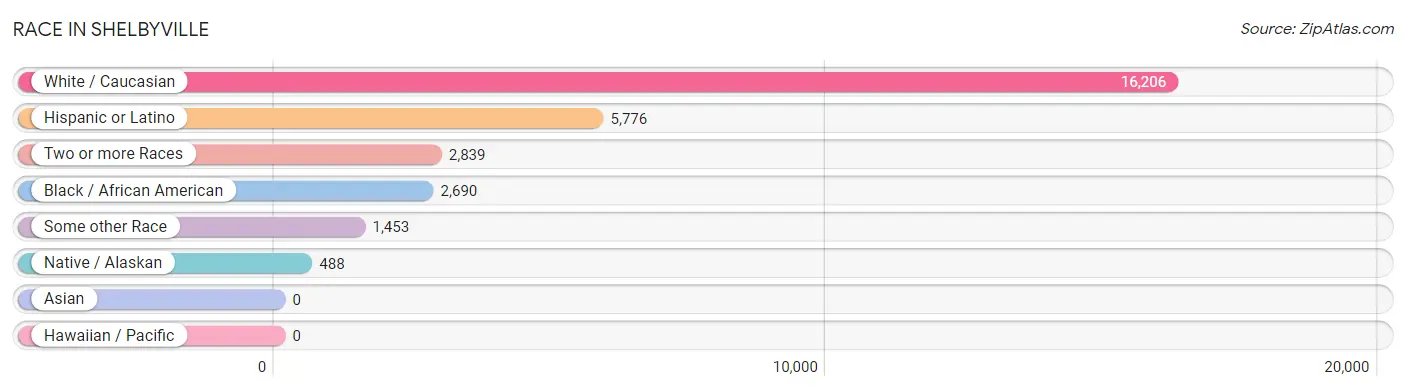
| Race | # Population | % Population |
| Asian | 0 | 0.0% |
| Black / African American | 2,690 | 11.4% |
| Hawaiian / Pacific | 0 | 0.0% |
| Hispanic or Latino | 5,776 | 24.4% |
| Native / Alaskan | 488 | 2.1% |
| White / Caucasian | 16,206 | 68.4% |
| Two or more Races | 2,839 | 12.0% |
| Some other Race | 1,453 | 6.1% |
| Total | 23,676 | 100.0% |
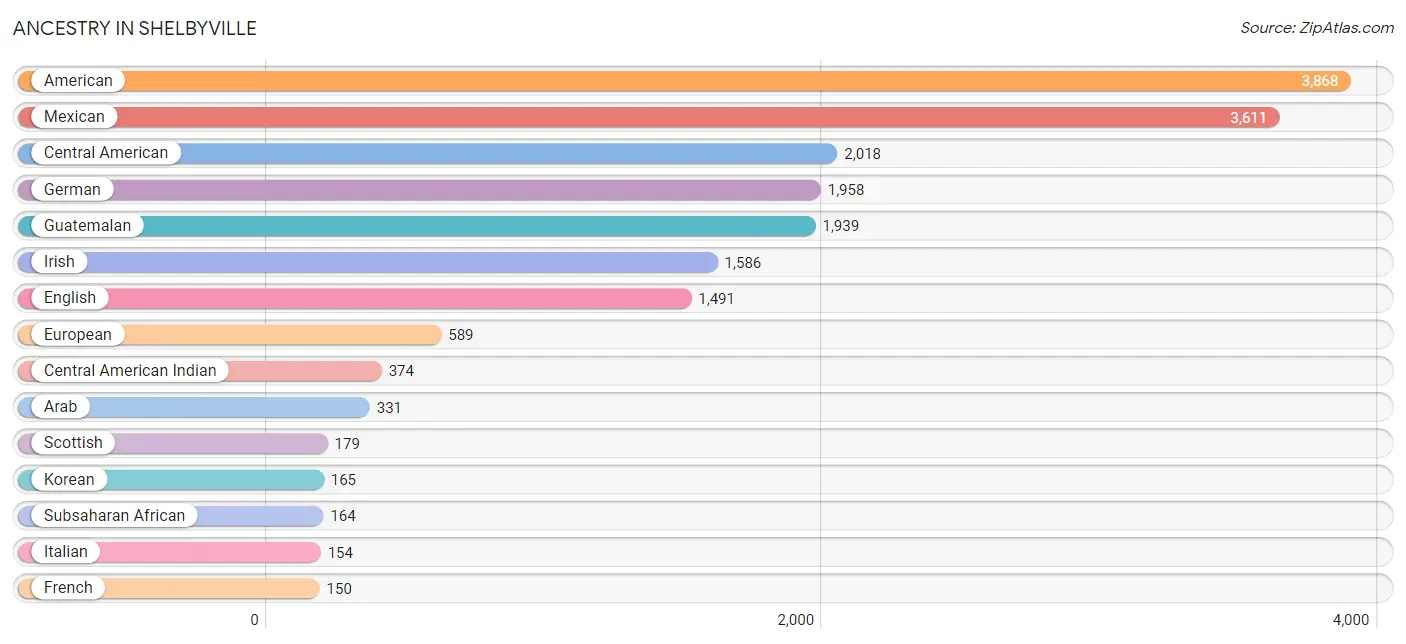
Ancestry in Shelbyville
The most populous ancestries reported in Shelbyville are American (3,868 | 16.3%), Mexican (3,611 | 15.2%), Central American (2,018 | 8.5%), German (1,958 | 8.3%), and Guatemalan (1,939 | 8.2%), together accounting for 56.6% of all Shelbyville residents.
| Ancestry | # Population | % Population |
| African | 72 | 0.3% |
| American | 3,868 | 16.3% |
| Arab | 331 | 1.4% |
| Blackfeet | 15 | 0.1% |
| British | 20 | 0.1% |
| Burmese | 47 | 0.2% |
| Central American | 2,018 | 8.5% |
| Central American Indian | 374 | 1.6% |
| Cherokee | 55 | 0.2% |
| Choctaw | 1 | 0.0% |
| Dominican | 28 | 0.1% |
| Dutch | 71 | 0.3% |
| Eastern European | 83 | 0.4% |
| English | 1,491 | 6.3% |
| European | 589 | 2.5% |
| Finnish | 10 | 0.0% |
| French | 150 | 0.6% |
| German | 1,958 | 8.3% |
| Guatemalan | 1,939 | 8.2% |
| Irish | 1,586 | 6.7% |
| Italian | 154 | 0.6% |
| Korean | 165 | 0.7% |
| Mexican | 3,611 | 15.2% |
| Mexican American Indian | 2 | 0.0% |
| Native Hawaiian | 36 | 0.2% |
| Nigerian | 13 | 0.1% |
| Norwegian | 12 | 0.1% |
| Polish | 13 | 0.1% |
| Portuguese | 36 | 0.2% |
| Puerto Rican | 35 | 0.2% |
| Romanian | 18 | 0.1% |
| Salvadoran | 79 | 0.3% |
| Scandinavian | 16 | 0.1% |
| Scotch-Irish | 126 | 0.5% |
| Scottish | 179 | 0.8% |
| Sioux | 91 | 0.4% |
| Somali | 63 | 0.3% |
| Subsaharan African | 164 | 0.7% |
| Swedish | 21 | 0.1% |
| Swiss | 4 | 0.0% |
| Welsh | 25 | 0.1% | View All 41 Rows |
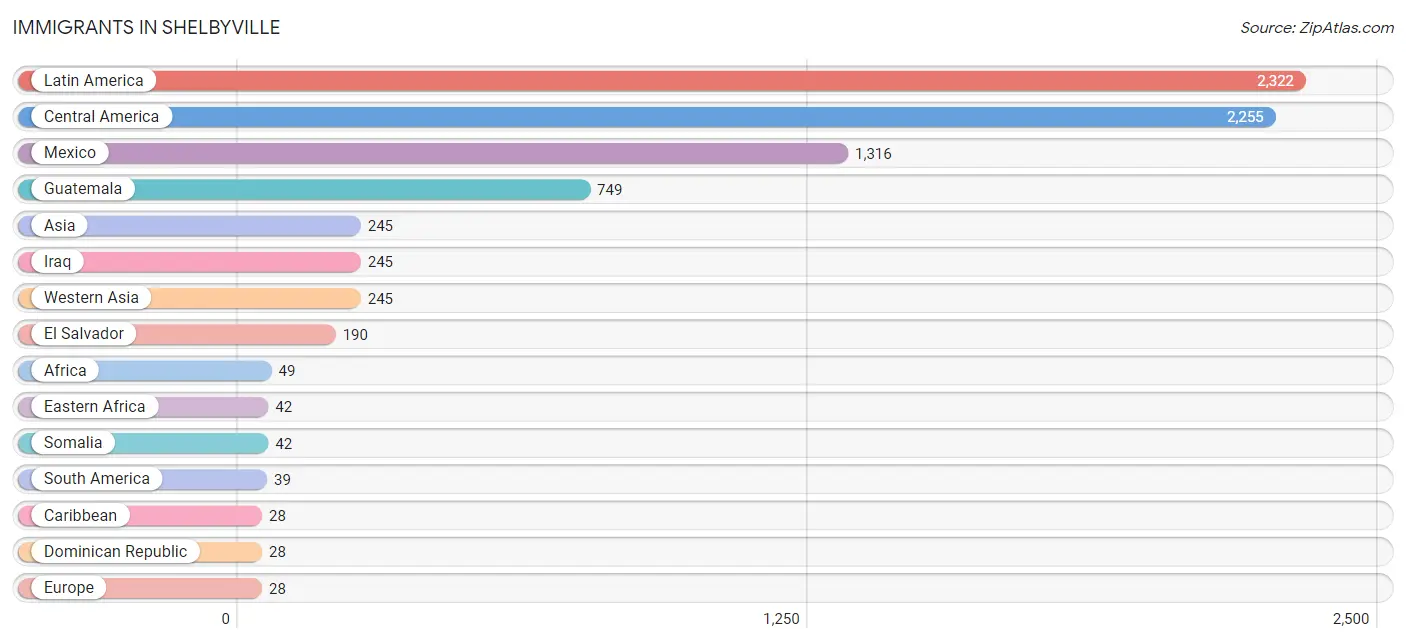
Immigrants in Shelbyville
The most numerous immigrant groups reported in Shelbyville came from Latin America (2,322 | 9.8%), Central America (2,255 | 9.5%), Mexico (1,316 | 5.6%), Guatemala (749 | 3.2%), and Asia (245 | 1.0%), together accounting for 29.1% of all Shelbyville residents.
| Immigration Origin | # Population | % Population |
| Africa | 49 | 0.2% |
| Asia | 245 | 1.0% |
| Bolivia | 19 | 0.1% |
| Brazil | 20 | 0.1% |
| Cameroon | 7 | 0.0% |
| Caribbean | 28 | 0.1% |
| Central America | 2,255 | 9.5% |
| Dominican Republic | 28 | 0.1% |
| Eastern Africa | 42 | 0.2% |
| El Salvador | 190 | 0.8% |
| England | 10 | 0.0% |
| Europe | 28 | 0.1% |
| Germany | 18 | 0.1% |
| Guatemala | 749 | 3.2% |
| Iraq | 245 | 1.0% |
| Latin America | 2,322 | 9.8% |
| Mexico | 1,316 | 5.6% |
| Middle Africa | 7 | 0.0% |
| Northern Europe | 10 | 0.0% |
| Somalia | 42 | 0.2% |
| South America | 39 | 0.2% |
| Western Asia | 245 | 1.0% |
| Western Europe | 18 | 0.1% | View All 23 Rows |
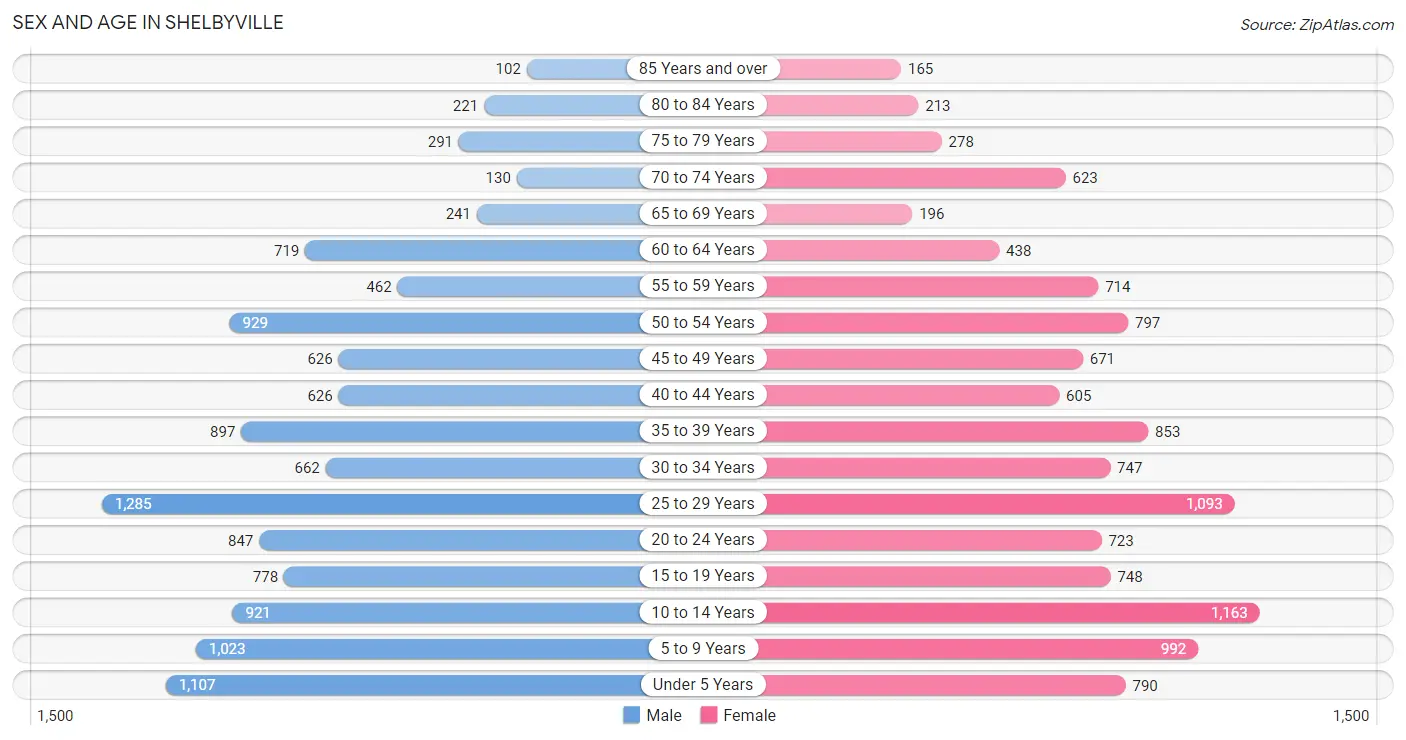
Sex and Age in Shelbyville
Sex and Age in Shelbyville
The most populous age groups in Shelbyville are 25 to 29 Years (1,285 | 10.8%) for men and 10 to 14 Years (1,163 | 9.9%) for women.
| Age Bracket | Male | Female |
| Under 5 Years | 1,107 (9.3%) | 790 (6.7%) |
| 5 to 9 Years | 1,023 (8.6%) | 992 (8.4%) |
| 10 to 14 Years | 921 (7.8%) | 1,163 (9.9%) |
| 15 to 19 Years | 778 (6.6%) | 748 (6.3%) |
| 20 to 24 Years | 847 (7.1%) | 723 (6.1%) |
| 25 to 29 Years | 1,285 (10.8%) | 1,093 (9.3%) |
| 30 to 34 Years | 662 (5.6%) | 747 (6.3%) |
| 35 to 39 Years | 897 (7.6%) | 853 (7.2%) |
| 40 to 44 Years | 626 (5.3%) | 605 (5.1%) |
| 45 to 49 Years | 626 (5.3%) | 671 (5.7%) |
| 50 to 54 Years | 929 (7.8%) | 797 (6.8%) |
| 55 to 59 Years | 462 (3.9%) | 714 (6.0%) |
| 60 to 64 Years | 719 (6.1%) | 438 (3.7%) |
| 65 to 69 Years | 241 (2.0%) | 196 (1.7%) |
| 70 to 74 Years | 130 (1.1%) | 623 (5.3%) |
| 75 to 79 Years | 291 (2.5%) | 278 (2.4%) |
| 80 to 84 Years | 221 (1.9%) | 213 (1.8%) |
| 85 Years and over | 102 (0.9%) | 165 (1.4%) |
| Total | 11,867 (100.0%) | 11,809 (100.0%) |
Families and Households in Shelbyville
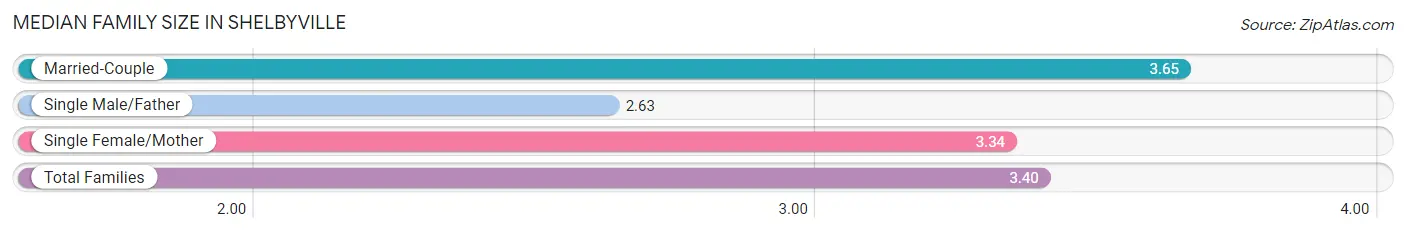
Median Family Size in Shelbyville
The median family size in Shelbyville is 3.40 persons per family, with married-couple families (2,753 | 51.5%) accounting for the largest median family size of 3.65 persons per family. On the other hand, single male/father families (725 | 13.6%) represent the smallest median family size with 2.63 persons per family.
| Family Type | # Families | Family Size |
| Married-Couple | 2,753 (51.5%) | 3.65 |
| Single Male/Father | 725 (13.6%) | 2.63 |
| Single Female/Mother | 1,864 (34.9%) | 3.34 |
| Total Families | 5,342 (100.0%) | 3.40 |
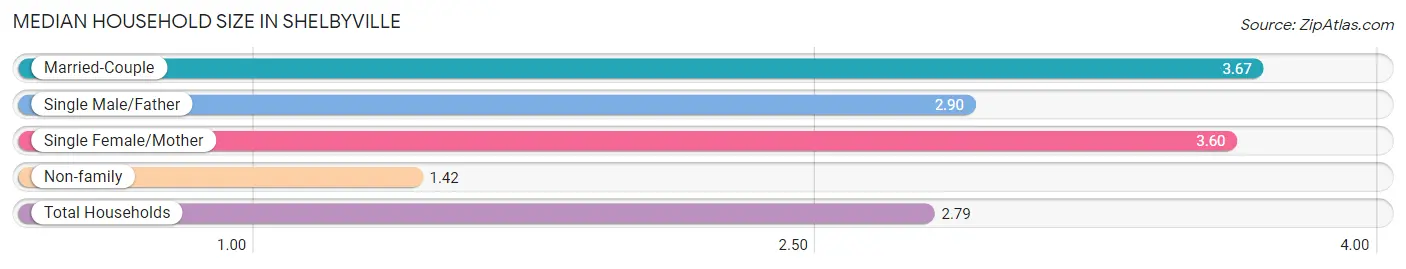
Median Household Size in Shelbyville
The median household size in Shelbyville is 2.79 persons per household, with married-couple households (2,753 | 33.1%) accounting for the largest median household size of 3.67 persons per household. non-family households (2,969 | 35.7%) represent the smallest median household size with 1.42 persons per household.
| Household Type | # Households | Household Size |
| Married-Couple | 2,753 (33.1%) | 3.67 |
| Single Male/Father | 725 (8.7%) | 2.90 |
| Single Female/Mother | 1,864 (22.4%) | 3.60 |
| Non-family | 2,969 (35.7%) | 1.42 |
| Total Households | 8,311 (100.0%) | 2.79 |
Household Size by Marriage Status in Shelbyville
Out of a total of 8,311 households in Shelbyville, 5,342 (64.3%) are family households, while 2,969 (35.7%) are nonfamily households. The most numerous type of family households are 2-person households, comprising 2,137, and the most common type of nonfamily households are 1-person households, comprising 2,293.
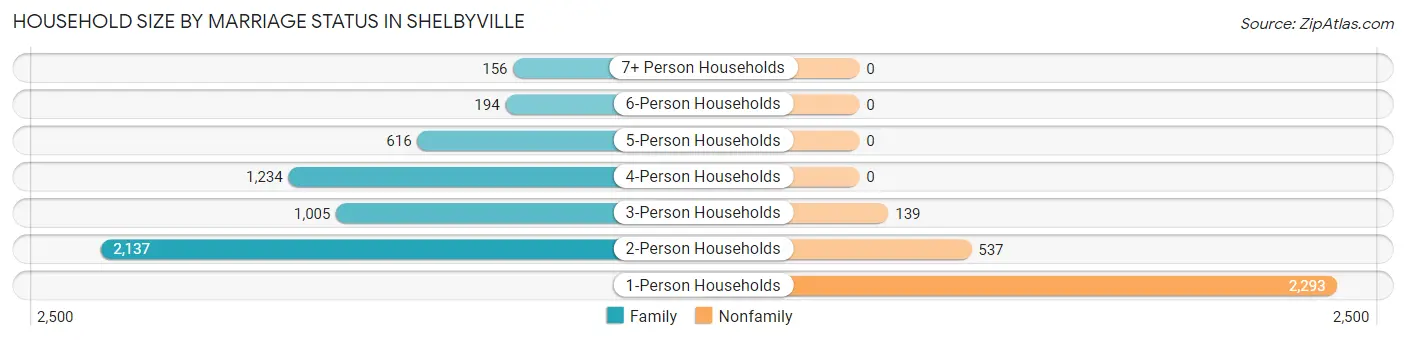
| Household Size | Family Households | Nonfamily Households |
| 1-Person Households | - | 2,293 (27.6%) |
| 2-Person Households | 2,137 (25.7%) | 537 (6.5%) |
| 3-Person Households | 1,005 (12.1%) | 139 (1.7%) |
| 4-Person Households | 1,234 (14.8%) | 0 (0.0%) |
| 5-Person Households | 616 (7.4%) | 0 (0.0%) |
| 6-Person Households | 194 (2.3%) | 0 (0.0%) |
| 7+ Person Households | 156 (1.9%) | 0 (0.0%) |
| Total | 5,342 (64.3%) | 2,969 (35.7%) |
Female Fertility in Shelbyville
Fertility by Age in Shelbyville
Average fertility rate in Shelbyville is 80.0 births per 1,000 women. Women in the age bracket of 20 to 34 years have the highest fertility rate with 122.0 births per 1,000 women. Women in the age bracket of 20 to 34 years acount for 70.3% of all women with births.
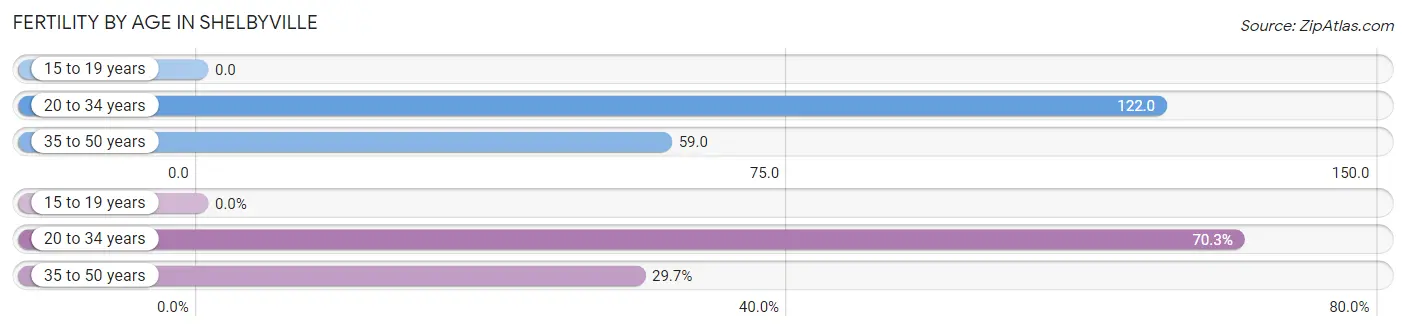
| Age Bracket | Women with Births | Births / 1,000 Women |
| 15 to 19 years | 0 (0.0%) | 0.0 |
| 20 to 34 years | 313 (70.3%) | 122.0 |
| 35 to 50 years | 132 (29.7%) | 59.0 |
| Total | 445 (100.0%) | 80.0 |
Fertility by Age by Marriage Status in Shelbyville
58.2% of women with births (445) in Shelbyville are married. The highest percentage of unmarried women with births falls into 35 to 50 years age bracket with 75.8% of them unmarried at the time of birth, while the lowest percentage of unmarried women with births belong to 20 to 34 years age bracket with 27.5% of them unmarried.
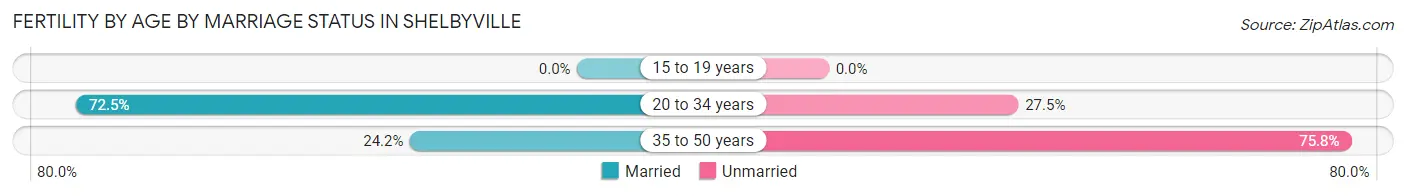
| Age Bracket | Married | Unmarried |
| 15 to 19 years | 0 (0.0%) | 0 (0.0%) |
| 20 to 34 years | 227 (72.5%) | 86 (27.5%) |
| 35 to 50 years | 32 (24.2%) | 100 (75.8%) |
| Total | 259 (58.2%) | 186 (41.8%) |
Fertility by Education in Shelbyville
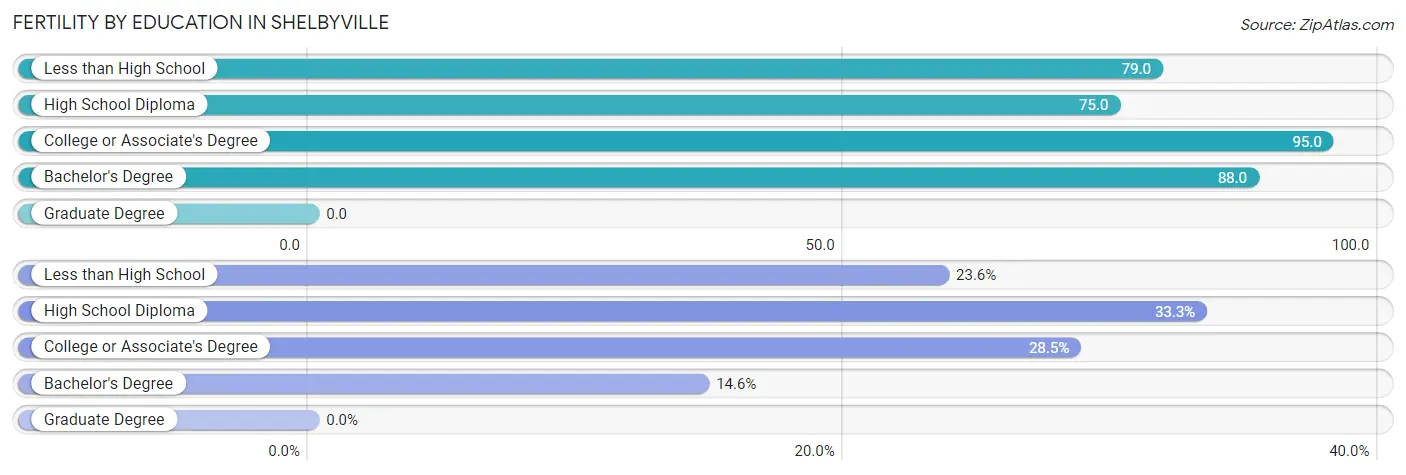
| Educational Attainment | Women with Births | Births / 1,000 Women |
| Less than High School | 105 (23.6%) | 79.0 |
| High School Diploma | 148 (33.3%) | 75.0 |
| College or Associate's Degree | 127 (28.5%) | 95.0 |
| Bachelor's Degree | 65 (14.6%) | 88.0 |
| Graduate Degree | 0 (0.0%) | 0.0 |
| Total | 445 (100.0%) | 80.0 |
Fertility by Education by Marriage Status in Shelbyville
41.8% of women with births in Shelbyville are unmarried. Women with the educational attainment of bachelor's degree are most likely to be married with 100.0% of them married at childbirth, while women with the educational attainment of college or associate's degree are least likely to be married with 65.3% of them unmarried at childbirth.
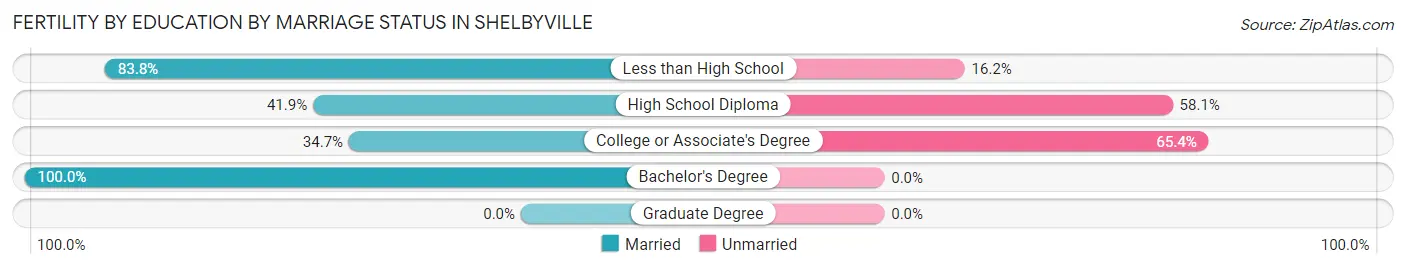
| Educational Attainment | Married | Unmarried |
| Less than High School | 88 (83.8%) | 17 (16.2%) |
| High School Diploma | 62 (41.9%) | 86 (58.1%) |
| College or Associate's Degree | 44 (34.6%) | 83 (65.3%) |
| Bachelor's Degree | 65 (100.0%) | 0 (0.0%) |
| Graduate Degree | 0 (0.0%) | 0 (0.0%) |
| Total | 259 (58.2%) | 186 (41.8%) |
Employment Characteristics in Shelbyville
Employment by Class of Employer in Shelbyville
Among the 11,131 employed individuals in Shelbyville, private company employees (8,728 | 78.4%), local government employees (1,004 | 9.0%), and self-employed (not incorporated) (519 | 4.7%) make up the most common classes of employment.
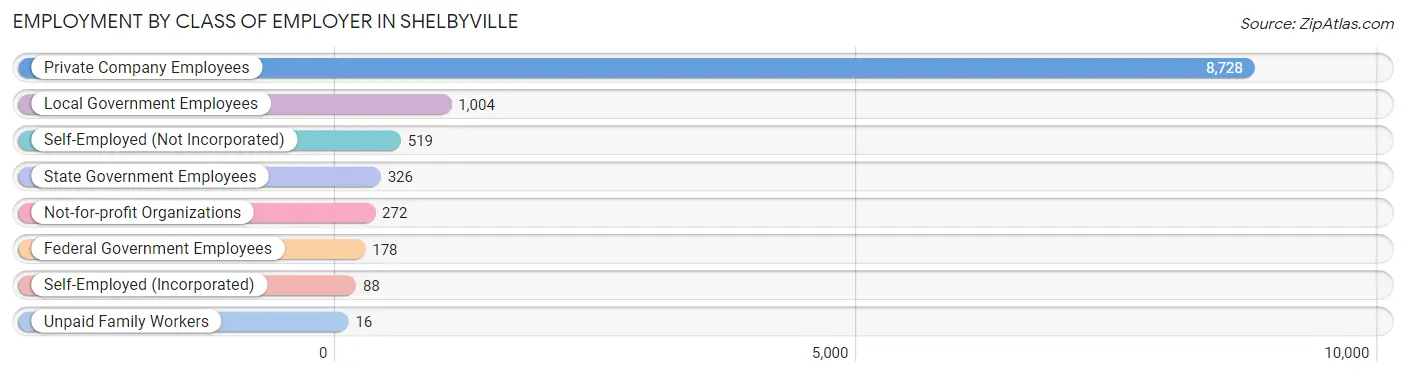
| Employer Class | # Employees | % Employees |
| Private Company Employees | 8,728 | 78.4% |
| Self-Employed (Incorporated) | 88 | 0.8% |
| Self-Employed (Not Incorporated) | 519 | 4.7% |
| Not-for-profit Organizations | 272 | 2.4% |
| Local Government Employees | 1,004 | 9.0% |
| State Government Employees | 326 | 2.9% |
| Federal Government Employees | 178 | 1.6% |
| Unpaid Family Workers | 16 | 0.1% |
| Total | 11,131 | 100.0% |
Employment Status by Age in Shelbyville
According to the labor force statistics for Shelbyville, out of the total population over 16 years of age (17,235), 68.0% or 11,720 individuals are in the labor force, with 4.0% or 469 of them unemployed. The age group with the highest labor force participation rate is 30 to 34 years, with 89.2% or 1,257 individuals in the labor force. Within the labor force, the 16 to 19 years age range has the highest percentage of unemployed individuals, with 19.4% or 86 of them being unemployed.
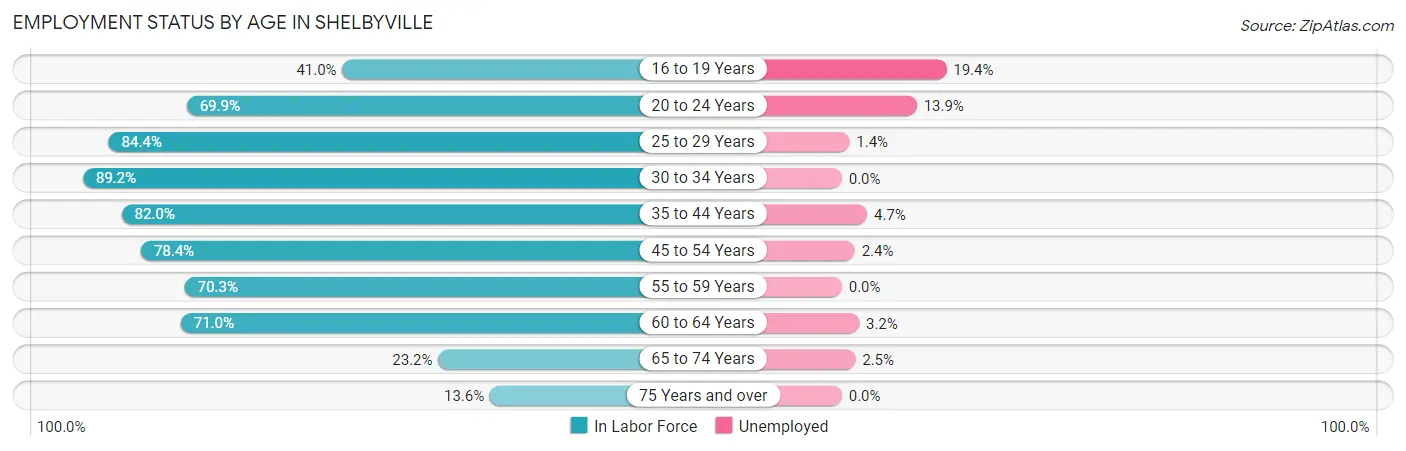
| Age Bracket | In Labor Force | Unemployed |
| 16 to 19 Years | 443 (41.0%) | 86 (19.4%) |
| 20 to 24 Years | 1,097 (69.9%) | 152 (13.9%) |
| 25 to 29 Years | 2,007 (84.4%) | 28 (1.4%) |
| 30 to 34 Years | 1,257 (89.2%) | 0 (0.0%) |
| 35 to 44 Years | 2,444 (82.0%) | 115 (4.7%) |
| 45 to 54 Years | 2,370 (78.4%) | 57 (2.4%) |
| 55 to 59 Years | 827 (70.3%) | 0 (0.0%) |
| 60 to 64 Years | 821 (71.0%) | 26 (3.2%) |
| 65 to 74 Years | 276 (23.2%) | 7 (2.5%) |
| 75 Years and over | 173 (13.6%) | 0 (0.0%) |
| Total | 11,720 (68.0%) | 469 (4.0%) |
Employment Status by Educational Attainment in Shelbyville
According to labor force statistics for Shelbyville, 80.2% of individuals (9,723) out of the total population between 25 and 64 years of age (12,124) are in the labor force, with 2.3% or 224 of them being unemployed. The group with the highest labor force participation rate are those with the educational attainment of bachelor's degree or higher, with 91.4% or 1,271 individuals in the labor force. Within the labor force, individuals with college / associate degree education have the highest percentage of unemployment, with 4.7% or 123 of them being unemployed.
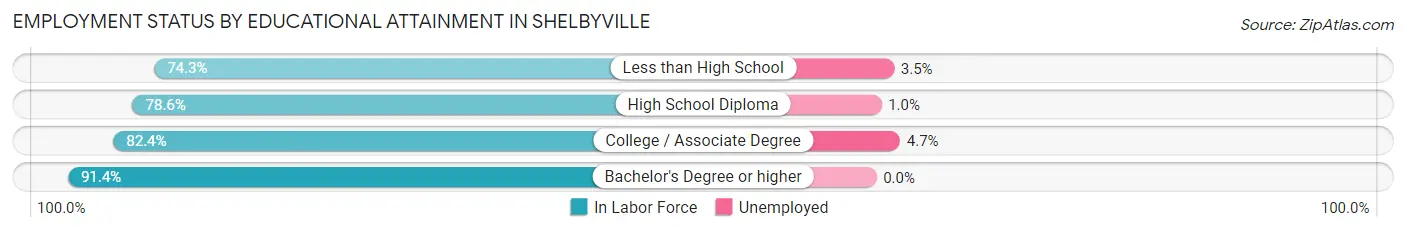
| Educational Attainment | In Labor Force | Unemployed |
| Less than High School | 1,711 (74.3%) | 81 (3.5%) |
| High School Diploma | 4,123 (78.6%) | 52 (1.0%) |
| College / Associate Degree | 2,624 (82.4%) | 150 (4.7%) |
| Bachelor's Degree or higher | 1,271 (91.4%) | 0 (0.0%) |
| Total | 9,723 (80.2%) | 279 (2.3%) |
Employment Occupations by Sex in Shelbyville
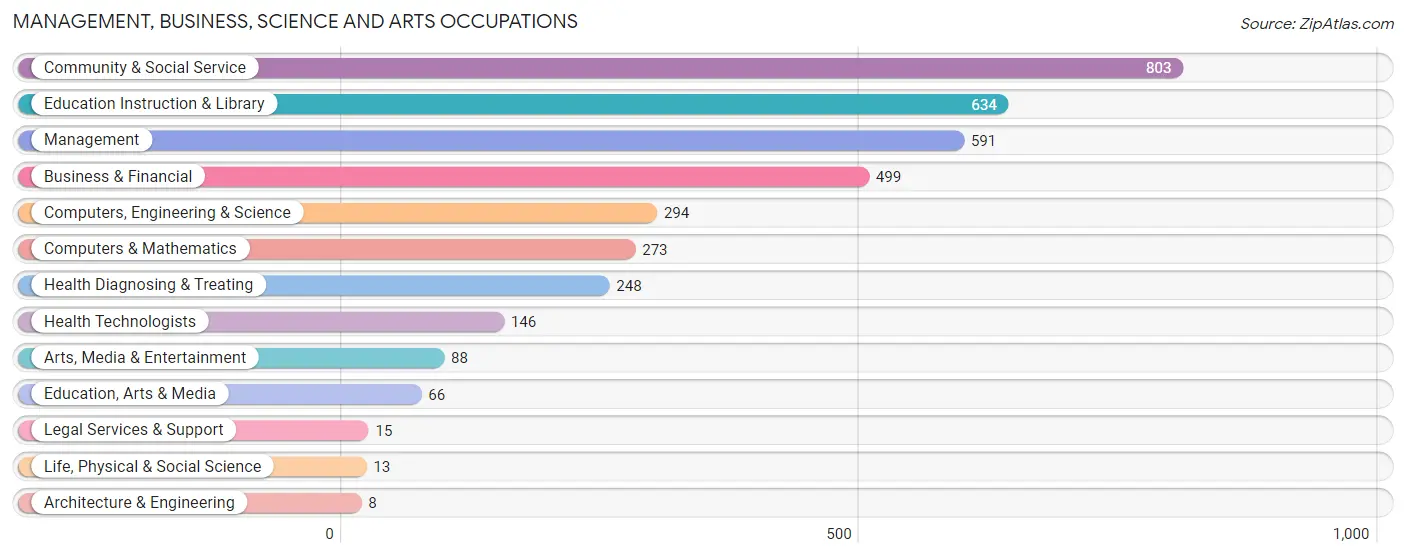
Management, Business, Science and Arts Occupations
The most common Management, Business, Science and Arts occupations in Shelbyville are Community & Social Service (803 | 7.1%), Education Instruction & Library (634 | 5.6%), Management (591 | 5.3%), Business & Financial (499 | 4.4%), and Computers, Engineering & Science (294 | 2.6%).
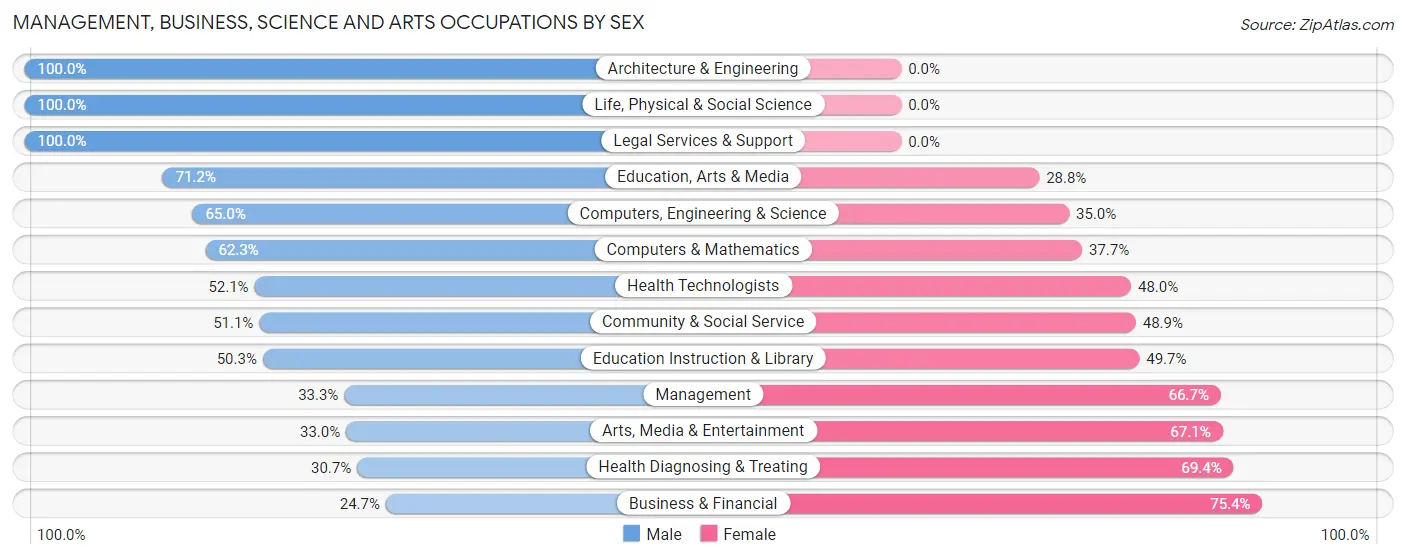
Management, Business, Science and Arts Occupations by Sex
Within the Management, Business, Science and Arts occupations in Shelbyville, the most male-oriented occupations are Architecture & Engineering (100.0%), Life, Physical & Social Science (100.0%), and Legal Services & Support (100.0%), while the most female-oriented occupations are Business & Financial (75.3%), Health Diagnosing & Treating (69.4%), and Arts, Media & Entertainment (67.0%).
| Occupation | Male | Female |
| Management | 197 (33.3%) | 394 (66.7%) |
| Business & Financial | 123 (24.6%) | 376 (75.3%) |
| Computers, Engineering & Science | 191 (65.0%) | 103 (35.0%) |
| Computers & Mathematics | 170 (62.3%) | 103 (37.7%) |
| Architecture & Engineering | 8 (100.0%) | 0 (0.0%) |
| Life, Physical & Social Science | 13 (100.0%) | 0 (0.0%) |
| Community & Social Service | 410 (51.1%) | 393 (48.9%) |
| Education, Arts & Media | 47 (71.2%) | 19 (28.8%) |
| Legal Services & Support | 15 (100.0%) | 0 (0.0%) |
| Education Instruction & Library | 319 (50.3%) | 315 (49.7%) |
| Arts, Media & Entertainment | 29 (33.0%) | 59 (67.0%) |
| Health Diagnosing & Treating | 76 (30.6%) | 172 (69.4%) |
| Health Technologists | 76 (52.0%) | 70 (47.9%) |
| Total (Category) | 997 (40.9%) | 1,438 (59.1%) |
| Total (Overall) | 5,987 (53.2%) | 5,258 (46.8%) |
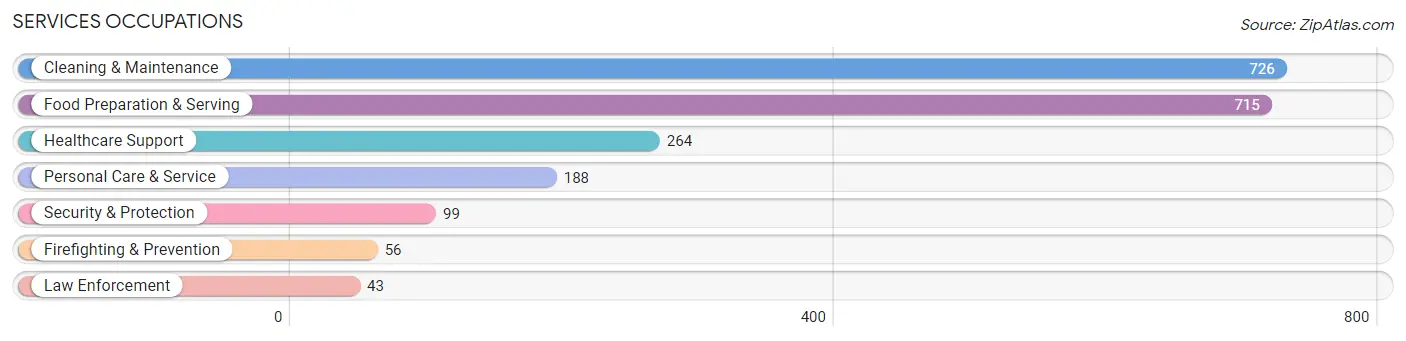
Services Occupations
The most common Services occupations in Shelbyville are Cleaning & Maintenance (726 | 6.5%), Food Preparation & Serving (715 | 6.4%), Healthcare Support (264 | 2.4%), Personal Care & Service (188 | 1.7%), and Security & Protection (99 | 0.9%).
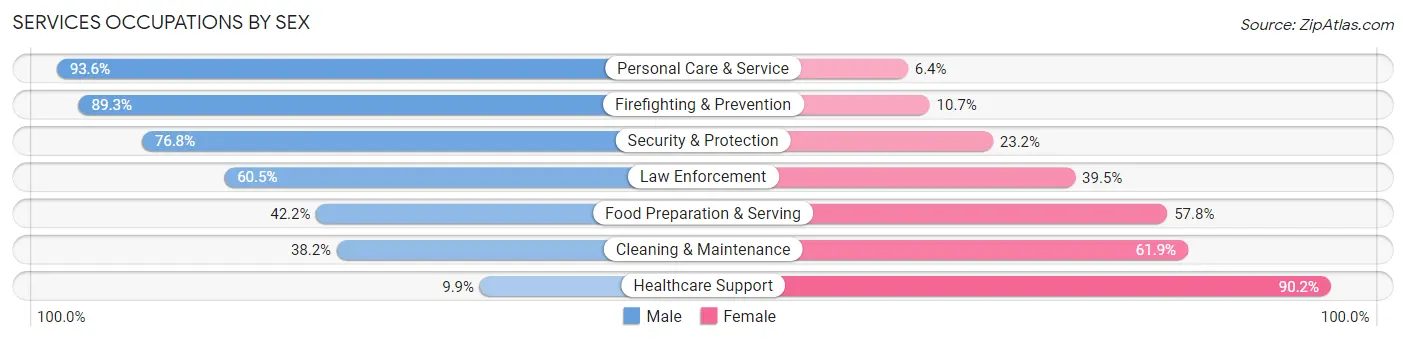
Services Occupations by Sex
Within the Services occupations in Shelbyville, the most male-oriented occupations are Personal Care & Service (93.6%), Firefighting & Prevention (89.3%), and Security & Protection (76.8%), while the most female-oriented occupations are Healthcare Support (90.1%), Cleaning & Maintenance (61.9%), and Food Preparation & Serving (57.8%).
| Occupation | Male | Female |
| Healthcare Support | 26 (9.9%) | 238 (90.1%) |
| Security & Protection | 76 (76.8%) | 23 (23.2%) |
| Firefighting & Prevention | 50 (89.3%) | 6 (10.7%) |
| Law Enforcement | 26 (60.5%) | 17 (39.5%) |
| Food Preparation & Serving | 302 (42.2%) | 413 (57.8%) |
| Cleaning & Maintenance | 277 (38.2%) | 449 (61.9%) |
| Personal Care & Service | 176 (93.6%) | 12 (6.4%) |
| Total (Category) | 857 (43.0%) | 1,135 (57.0%) |
| Total (Overall) | 5,987 (53.2%) | 5,258 (46.8%) |
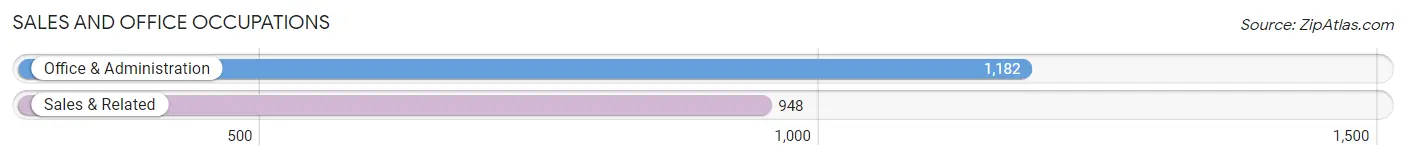
Sales and Office Occupations
The most common Sales and Office occupations in Shelbyville are Office & Administration (1,182 | 10.5%), and Sales & Related (948 | 8.4%).
Sales and Office Occupations by Sex
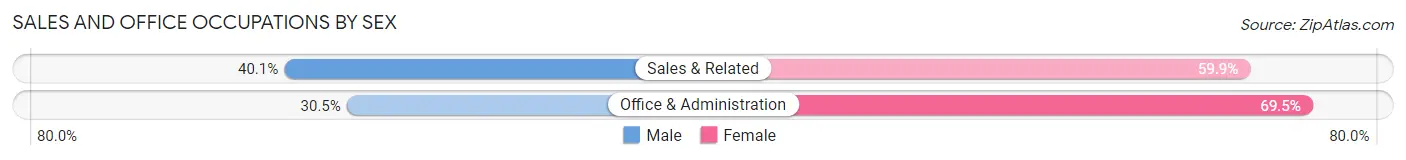
| Occupation | Male | Female |
| Sales & Related | 380 (40.1%) | 568 (59.9%) |
| Office & Administration | 360 (30.5%) | 822 (69.5%) |
| Total (Category) | 740 (34.7%) | 1,390 (65.3%) |
| Total (Overall) | 5,987 (53.2%) | 5,258 (46.8%) |
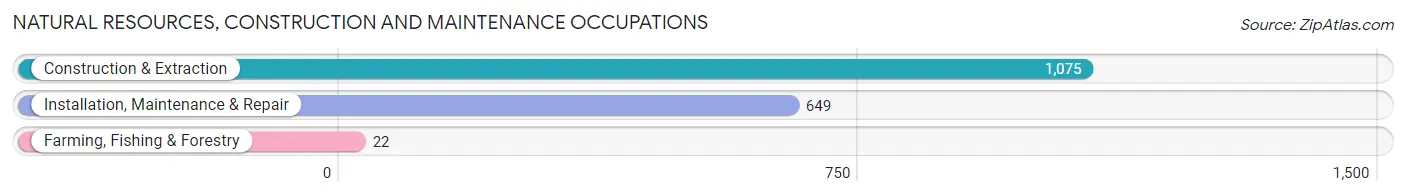
Natural Resources, Construction and Maintenance Occupations
The most common Natural Resources, Construction and Maintenance occupations in Shelbyville are Construction & Extraction (1,075 | 9.6%), Installation, Maintenance & Repair (649 | 5.8%), and Farming, Fishing & Forestry (22 | 0.2%).
Natural Resources, Construction and Maintenance Occupations by Sex
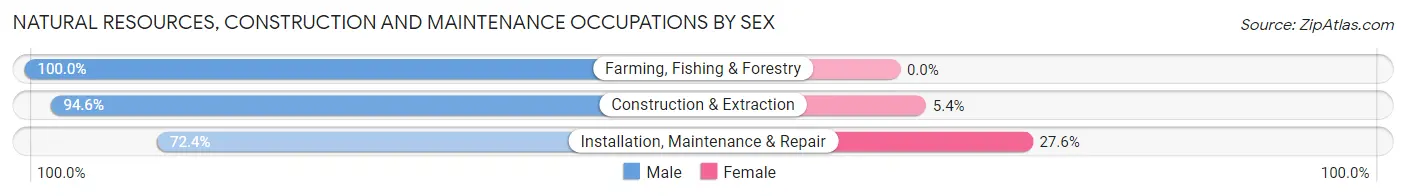
| Occupation | Male | Female |
| Farming, Fishing & Forestry | 22 (100.0%) | 0 (0.0%) |
| Construction & Extraction | 1,017 (94.6%) | 58 (5.4%) |
| Installation, Maintenance & Repair | 470 (72.4%) | 179 (27.6%) |
| Total (Category) | 1,509 (86.4%) | 237 (13.6%) |
| Total (Overall) | 5,987 (53.2%) | 5,258 (46.8%) |
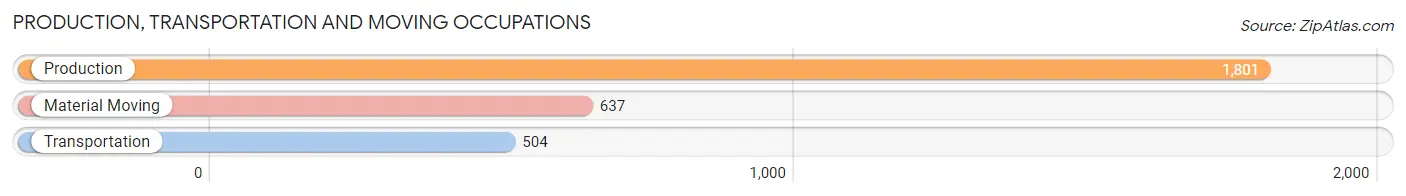
Production, Transportation and Moving Occupations
The most common Production, Transportation and Moving occupations in Shelbyville are Production (1,801 | 16.0%), Material Moving (637 | 5.7%), and Transportation (504 | 4.5%).
Production, Transportation and Moving Occupations by Sex
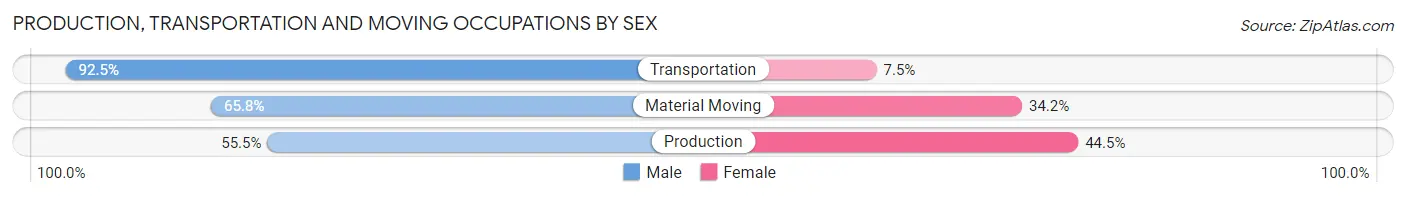
| Occupation | Male | Female |
| Production | 999 (55.5%) | 802 (44.5%) |
| Transportation | 466 (92.5%) | 38 (7.5%) |
| Material Moving | 419 (65.8%) | 218 (34.2%) |
| Total (Category) | 1,884 (64.0%) | 1,058 (36.0%) |
| Total (Overall) | 5,987 (53.2%) | 5,258 (46.8%) |
Employment Industries by Sex in Shelbyville
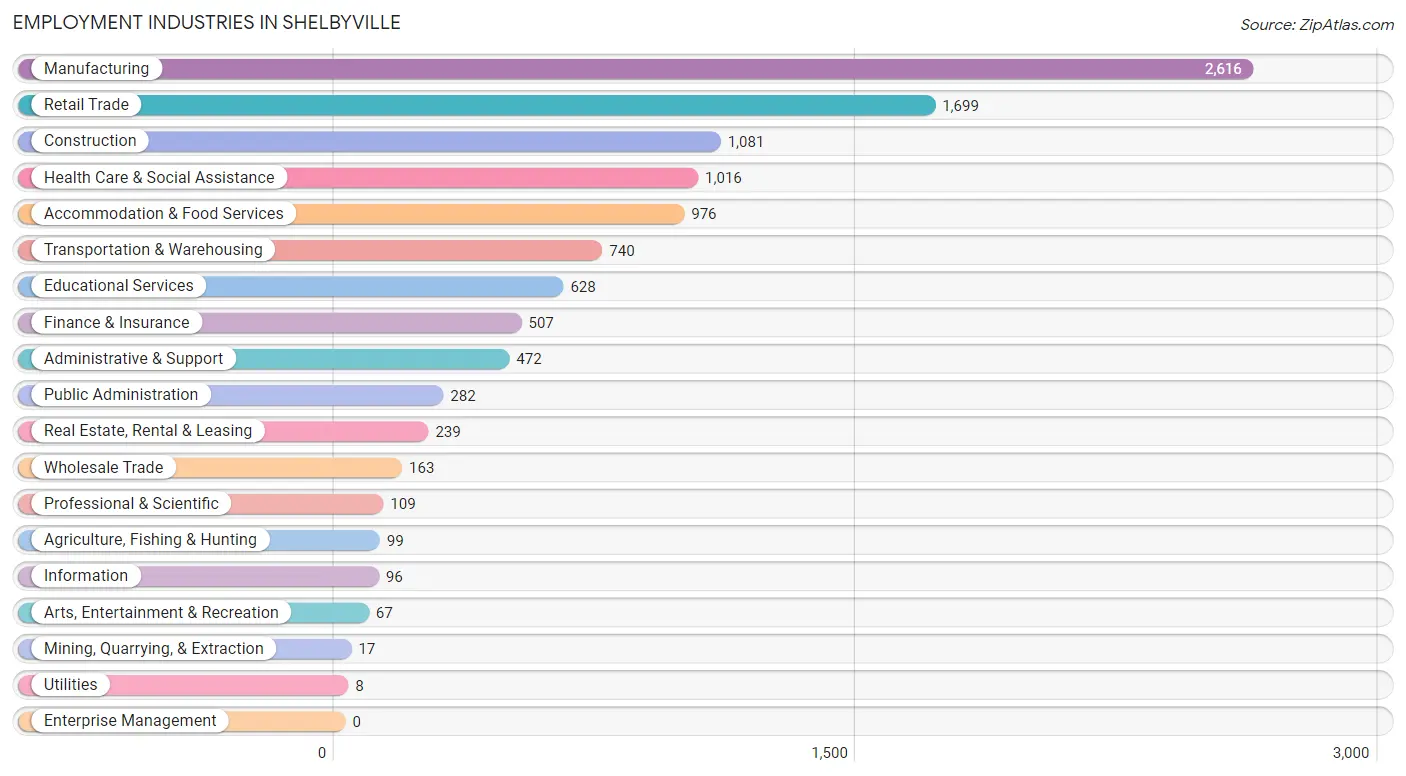
Employment Industries in Shelbyville
The major employment industries in Shelbyville include Manufacturing (2,616 | 23.3%), Retail Trade (1,699 | 15.1%), Construction (1,081 | 9.6%), Health Care & Social Assistance (1,016 | 9.0%), and Accommodation & Food Services (976 | 8.7%).
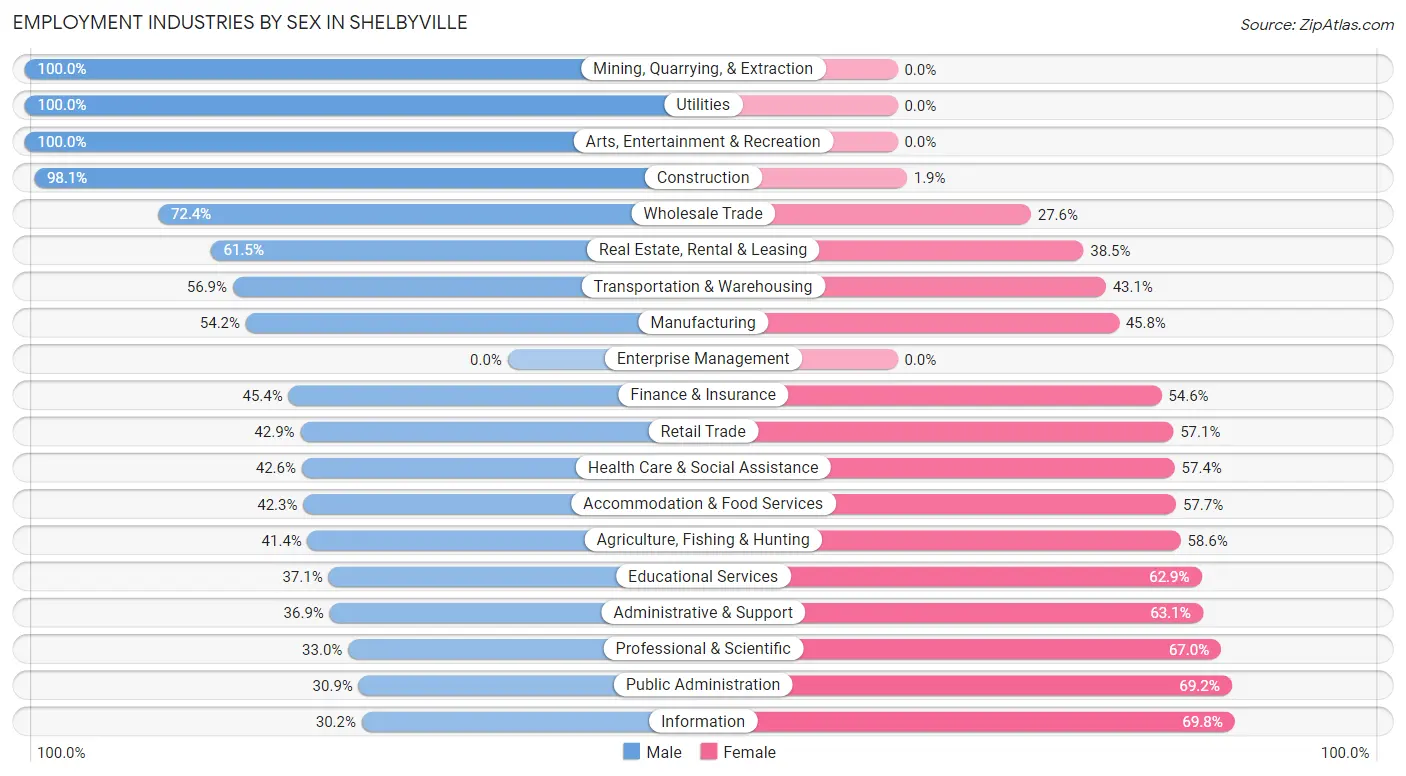
Employment Industries by Sex in Shelbyville
The Shelbyville industries that see more men than women are Mining, Quarrying, & Extraction (100.0%), Utilities (100.0%), and Arts, Entertainment & Recreation (100.0%), whereas the industries that tend to have a higher number of women are Information (69.8%), Public Administration (69.2%), and Professional & Scientific (67.0%).
| Industry | Male | Female |
| Agriculture, Fishing & Hunting | 41 (41.4%) | 58 (58.6%) |
| Mining, Quarrying, & Extraction | 17 (100.0%) | 0 (0.0%) |
| Construction | 1,060 (98.1%) | 21 (1.9%) |
| Manufacturing | 1,418 (54.2%) | 1,198 (45.8%) |
| Wholesale Trade | 118 (72.4%) | 45 (27.6%) |
| Retail Trade | 729 (42.9%) | 970 (57.1%) |
| Transportation & Warehousing | 421 (56.9%) | 319 (43.1%) |
| Utilities | 8 (100.0%) | 0 (0.0%) |
| Information | 29 (30.2%) | 67 (69.8%) |
| Finance & Insurance | 230 (45.4%) | 277 (54.6%) |
| Real Estate, Rental & Leasing | 147 (61.5%) | 92 (38.5%) |
| Professional & Scientific | 36 (33.0%) | 73 (67.0%) |
| Enterprise Management | 0 (0.0%) | 0 (0.0%) |
| Administrative & Support | 174 (36.9%) | 298 (63.1%) |
| Educational Services | 233 (37.1%) | 395 (62.9%) |
| Health Care & Social Assistance | 433 (42.6%) | 583 (57.4%) |
| Arts, Entertainment & Recreation | 67 (100.0%) | 0 (0.0%) |
| Accommodation & Food Services | 413 (42.3%) | 563 (57.7%) |
| Public Administration | 87 (30.8%) | 195 (69.2%) |
| Total | 5,987 (53.2%) | 5,258 (46.8%) |
Education in Shelbyville
School Enrollment in Shelbyville
The most common levels of schooling among the 5,908 students in Shelbyville are middle school (1,840 | 31.1%), elementary school (1,482 | 25.1%), and high school (1,401 | 23.7%).
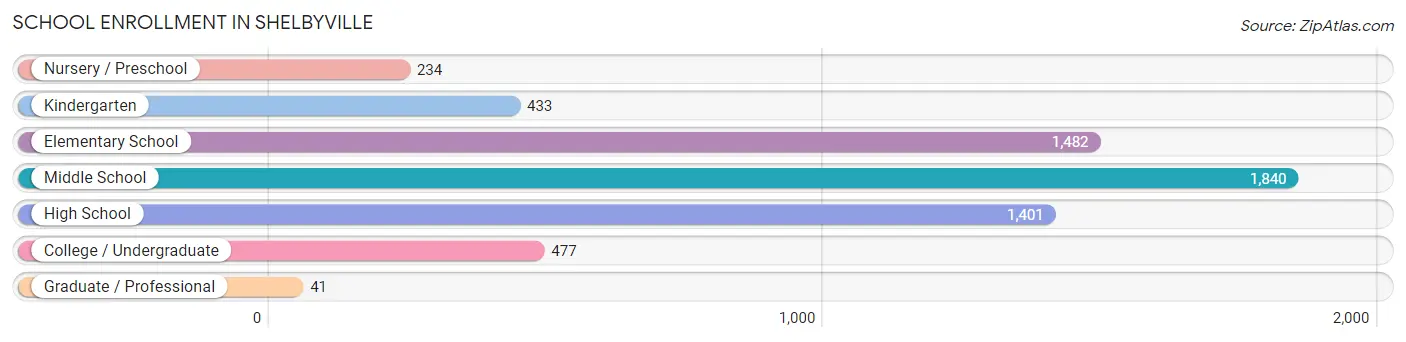
| School Level | # Students | % Students |
| Nursery / Preschool | 234 | 4.0% |
| Kindergarten | 433 | 7.3% |
| Elementary School | 1,482 | 25.1% |
| Middle School | 1,840 | 31.1% |
| High School | 1,401 | 23.7% |
| College / Undergraduate | 477 | 8.1% |
| Graduate / Professional | 41 | 0.7% |
| Total | 5,908 | 100.0% |
School Enrollment by Age by Funding Source in Shelbyville
Out of a total of 5,908 students who are enrolled in schools in Shelbyville, 555 (9.4%) attend a private institution, while the remaining 5,353 (90.6%) are enrolled in public schools. The age group of 3 to 4 year olds has the highest likelihood of being enrolled in private schools, with 16 (17.8% in the age bracket) enrolled. Conversely, the age group of 25 to 34 year olds has the lowest likelihood of being enrolled in a private school, with 100 (100.0% in the age bracket) attending a public institution.
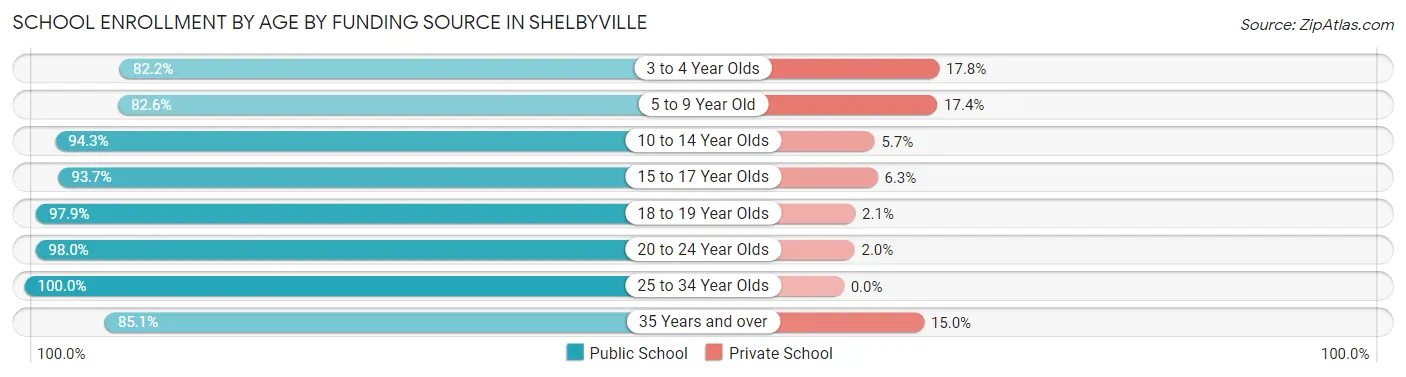
| Age Bracket | Public School | Private School |
| 3 to 4 Year Olds | 74 (82.2%) | 16 (17.8%) |
| 5 to 9 Year Old | 1,542 (82.6%) | 325 (17.4%) |
| 10 to 14 Year Olds | 1,890 (94.3%) | 115 (5.7%) |
| 15 to 17 Year Olds | 998 (93.7%) | 67 (6.3%) |
| 18 to 19 Year Olds | 320 (97.9%) | 7 (2.1%) |
| 20 to 24 Year Olds | 340 (98.0%) | 7 (2.0%) |
| 25 to 34 Year Olds | 100 (100.0%) | 0 (0.0%) |
| 35 Years and over | 91 (85.1%) | 16 (14.9%) |
| Total | 5,353 (90.6%) | 555 (9.4%) |
Educational Attainment by Field of Study in Shelbyville
Education (607 | 28.9%), business (460 | 21.9%), liberal arts & history (201 | 9.6%), science & technology (135 | 6.4%), and literature & languages (133 | 6.3%) are the most common fields of study among 2,102 individuals in Shelbyville who have obtained a bachelor's degree or higher.
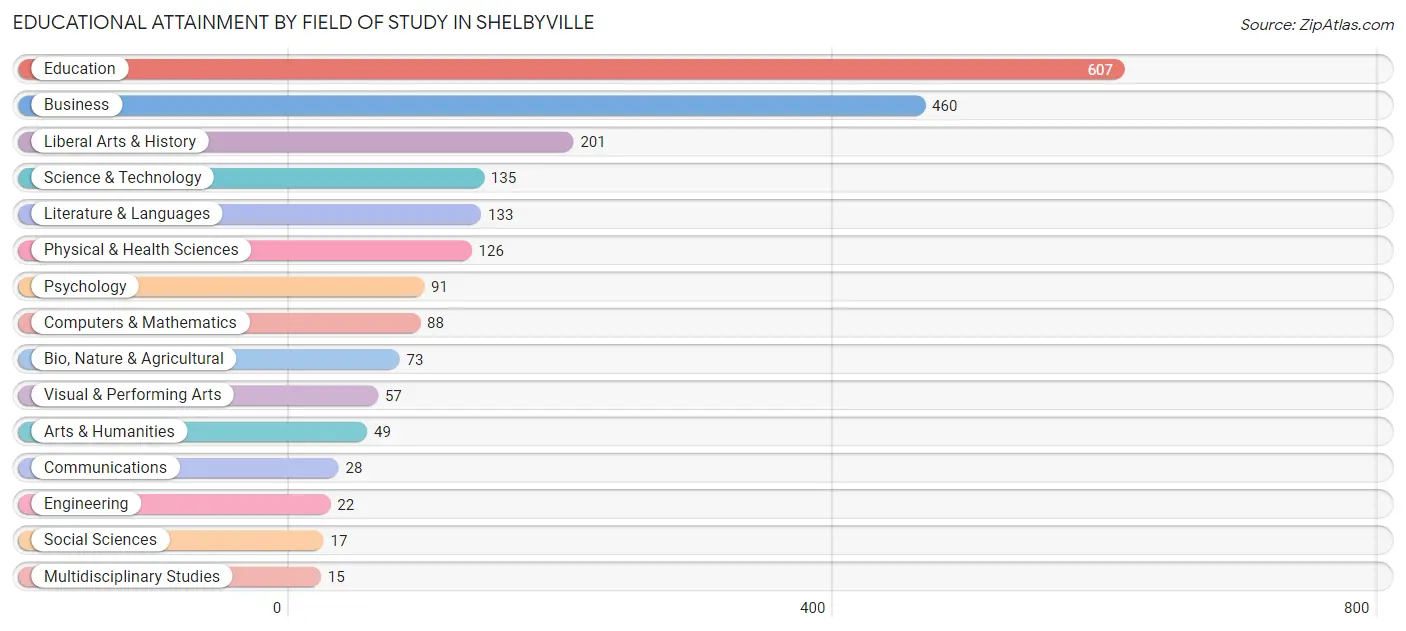
| Field of Study | # Graduates | % Graduates |
| Computers & Mathematics | 88 | 4.2% |
| Bio, Nature & Agricultural | 73 | 3.5% |
| Physical & Health Sciences | 126 | 6.0% |
| Psychology | 91 | 4.3% |
| Social Sciences | 17 | 0.8% |
| Engineering | 22 | 1.1% |
| Multidisciplinary Studies | 15 | 0.7% |
| Science & Technology | 135 | 6.4% |
| Business | 460 | 21.9% |
| Education | 607 | 28.9% |
| Literature & Languages | 133 | 6.3% |
| Liberal Arts & History | 201 | 9.6% |
| Visual & Performing Arts | 57 | 2.7% |
| Communications | 28 | 1.3% |
| Arts & Humanities | 49 | 2.3% |
| Total | 2,102 | 100.0% |
Transportation & Commute in Shelbyville
Vehicle Availability by Sex in Shelbyville
The most prevalent vehicle ownership categories in Shelbyville are males with 2 vehicles (2,109, accounting for 35.6%) and females with 2 vehicles (1,946, making up 40.7%).
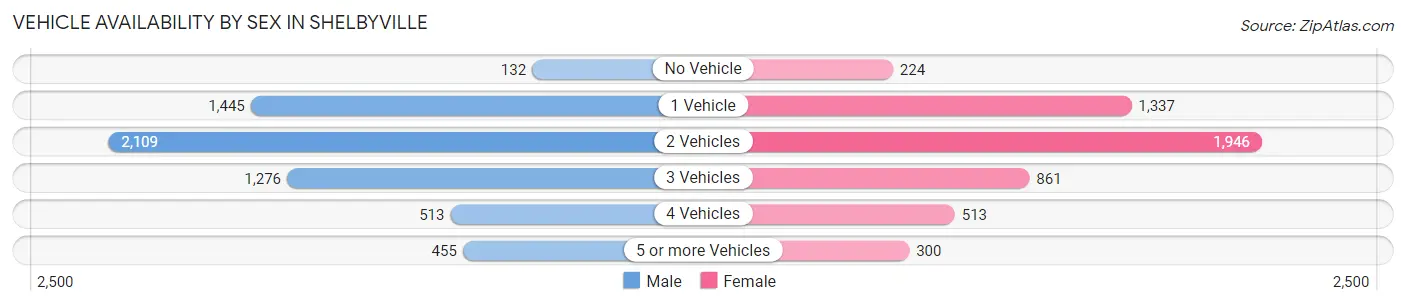
| Vehicles Available | Male | Female |
| No Vehicle | 132 (2.2%) | 224 (4.3%) |
| 1 Vehicle | 1,445 (24.4%) | 1,337 (25.8%) |
| 2 Vehicles | 2,109 (35.6%) | 1,946 (37.6%) |
| 3 Vehicles | 1,276 (21.5%) | 861 (16.6%) |
| 4 Vehicles | 513 (8.6%) | 513 (9.9%) |
| 5 or more Vehicles | 455 (7.7%) | 300 (5.8%) |
| Total | 5,930 (100.0%) | 5,181 (100.0%) |
Commute Time in Shelbyville
The most frequently occuring commute durations in Shelbyville are 10 to 14 minutes (2,107 commuters, 19.8%), 5 to 9 minutes (1,823 commuters, 17.1%), and 15 to 19 minutes (1,560 commuters, 14.6%).
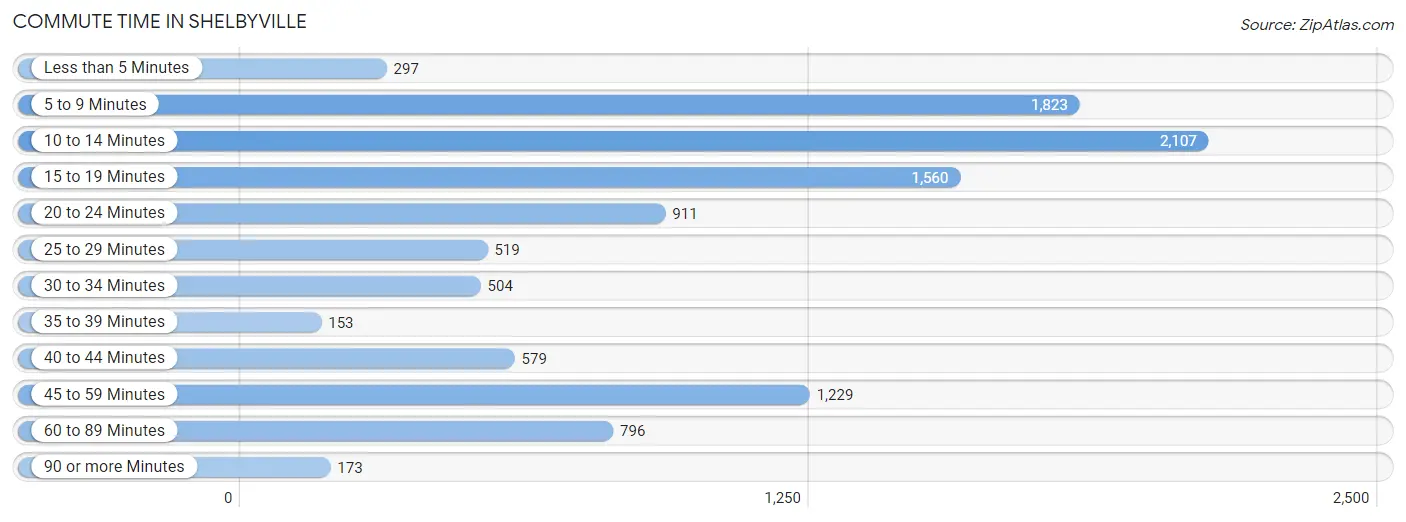
| Commute Time | # Commuters | % Commuters |
| Less than 5 Minutes | 297 | 2.8% |
| 5 to 9 Minutes | 1,823 | 17.1% |
| 10 to 14 Minutes | 2,107 | 19.8% |
| 15 to 19 Minutes | 1,560 | 14.6% |
| 20 to 24 Minutes | 911 | 8.6% |
| 25 to 29 Minutes | 519 | 4.9% |
| 30 to 34 Minutes | 504 | 4.7% |
| 35 to 39 Minutes | 153 | 1.4% |
| 40 to 44 Minutes | 579 | 5.4% |
| 45 to 59 Minutes | 1,229 | 11.5% |
| 60 to 89 Minutes | 796 | 7.5% |
| 90 or more Minutes | 173 | 1.6% |
Commute Time by Sex in Shelbyville
The most common commute times in Shelbyville are 10 to 14 minutes (1,072 commuters, 19.0%) for males and 10 to 14 minutes (1,035 commuters, 20.6%) for females.
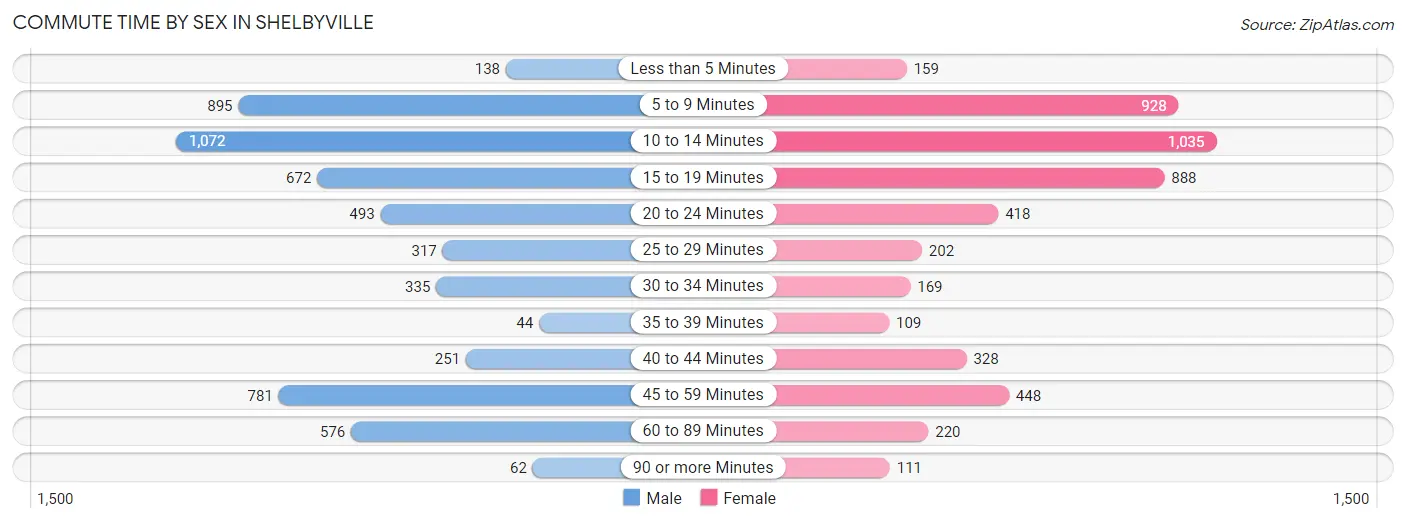
| Commute Time | Male | Female |
| Less than 5 Minutes | 138 (2.5%) | 159 (3.2%) |
| 5 to 9 Minutes | 895 (15.9%) | 928 (18.5%) |
| 10 to 14 Minutes | 1,072 (19.0%) | 1,035 (20.6%) |
| 15 to 19 Minutes | 672 (11.9%) | 888 (17.7%) |
| 20 to 24 Minutes | 493 (8.7%) | 418 (8.3%) |
| 25 to 29 Minutes | 317 (5.6%) | 202 (4.0%) |
| 30 to 34 Minutes | 335 (5.9%) | 169 (3.4%) |
| 35 to 39 Minutes | 44 (0.8%) | 109 (2.2%) |
| 40 to 44 Minutes | 251 (4.4%) | 328 (6.5%) |
| 45 to 59 Minutes | 781 (13.9%) | 448 (8.9%) |
| 60 to 89 Minutes | 576 (10.2%) | 220 (4.4%) |
| 90 or more Minutes | 62 (1.1%) | 111 (2.2%) |
Time of Departure to Work by Sex in Shelbyville
The most frequent times of departure to work in Shelbyville are 6:30 AM to 6:59 AM (1,393, 24.7%) for males and 6:30 AM to 6:59 AM (847, 16.9%) for females.
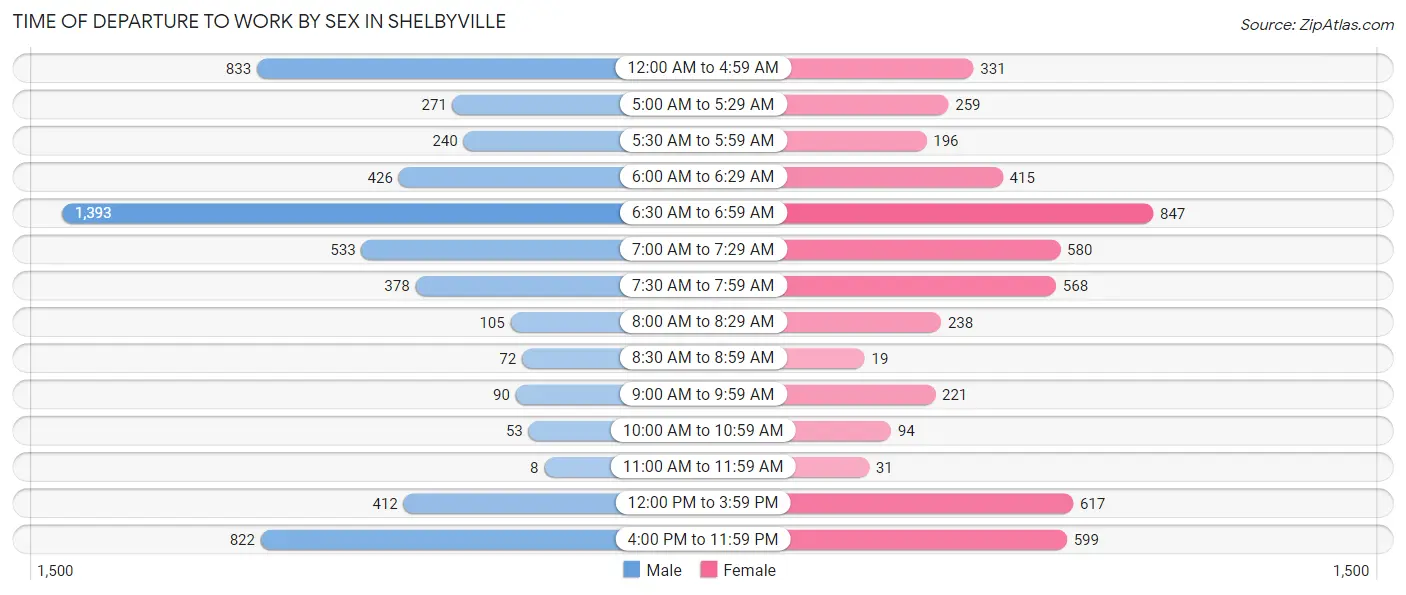
| Time of Departure | Male | Female |
| 12:00 AM to 4:59 AM | 833 (14.8%) | 331 (6.6%) |
| 5:00 AM to 5:29 AM | 271 (4.8%) | 259 (5.2%) |
| 5:30 AM to 5:59 AM | 240 (4.3%) | 196 (3.9%) |
| 6:00 AM to 6:29 AM | 426 (7.6%) | 415 (8.3%) |
| 6:30 AM to 6:59 AM | 1,393 (24.7%) | 847 (16.9%) |
| 7:00 AM to 7:29 AM | 533 (9.5%) | 580 (11.6%) |
| 7:30 AM to 7:59 AM | 378 (6.7%) | 568 (11.3%) |
| 8:00 AM to 8:29 AM | 105 (1.9%) | 238 (4.8%) |
| 8:30 AM to 8:59 AM | 72 (1.3%) | 19 (0.4%) |
| 9:00 AM to 9:59 AM | 90 (1.6%) | 221 (4.4%) |
| 10:00 AM to 10:59 AM | 53 (0.9%) | 94 (1.9%) |
| 11:00 AM to 11:59 AM | 8 (0.1%) | 31 (0.6%) |
| 12:00 PM to 3:59 PM | 412 (7.3%) | 617 (12.3%) |
| 4:00 PM to 11:59 PM | 822 (14.6%) | 599 (11.9%) |
| Total | 5,636 (100.0%) | 5,015 (100.0%) |
Housing Occupancy in Shelbyville
Occupancy by Ownership in Shelbyville
Of the total 8,311 dwellings in Shelbyville, owner-occupied units account for 4,112 (49.5%), while renter-occupied units make up 4,199 (50.5%).
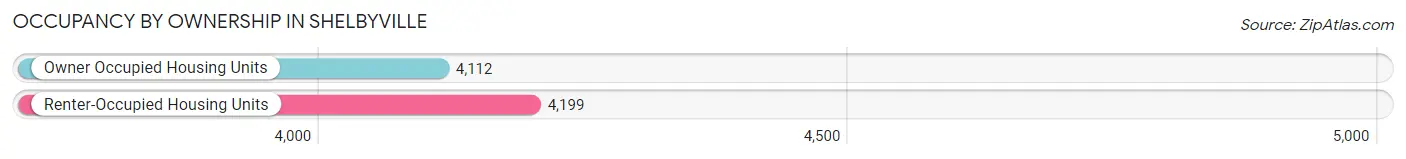
| Occupancy | # Housing Units | % Housing Units |
| Owner Occupied Housing Units | 4,112 | 49.5% |
| Renter-Occupied Housing Units | 4,199 | 50.5% |
| Total Occupied Housing Units | 8,311 | 100.0% |
Occupancy by Household Size in Shelbyville
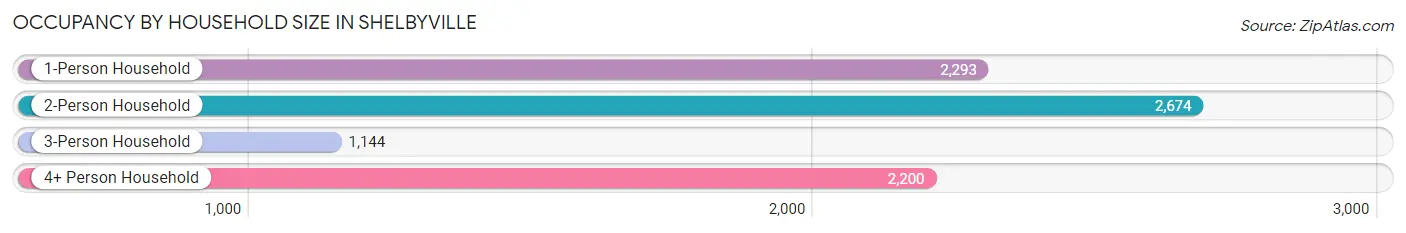
| Household Size | # Housing Units | % Housing Units |
| 1-Person Household | 2,293 | 27.6% |
| 2-Person Household | 2,674 | 32.2% |
| 3-Person Household | 1,144 | 13.8% |
| 4+ Person Household | 2,200 | 26.5% |
| Total Housing Units | 8,311 | 100.0% |
Occupancy by Ownership by Household Size in Shelbyville
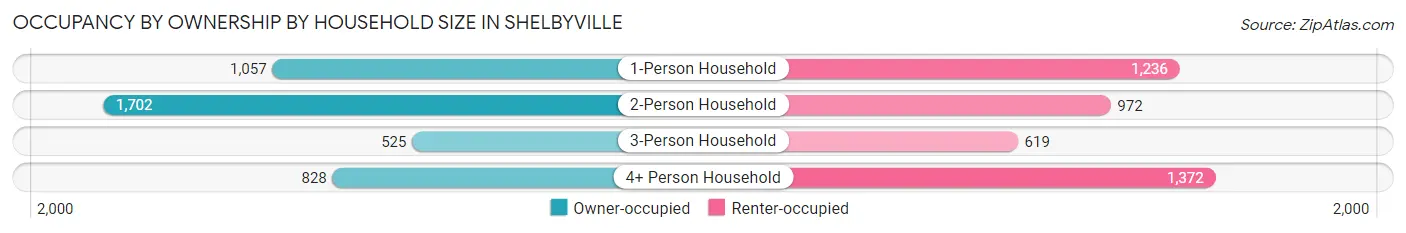
| Household Size | Owner-occupied | Renter-occupied |
| 1-Person Household | 1,057 (46.1%) | 1,236 (53.9%) |
| 2-Person Household | 1,702 (63.6%) | 972 (36.3%) |
| 3-Person Household | 525 (45.9%) | 619 (54.1%) |
| 4+ Person Household | 828 (37.6%) | 1,372 (62.4%) |
| Total Housing Units | 4,112 (49.5%) | 4,199 (50.5%) |
Occupancy by Educational Attainment in Shelbyville
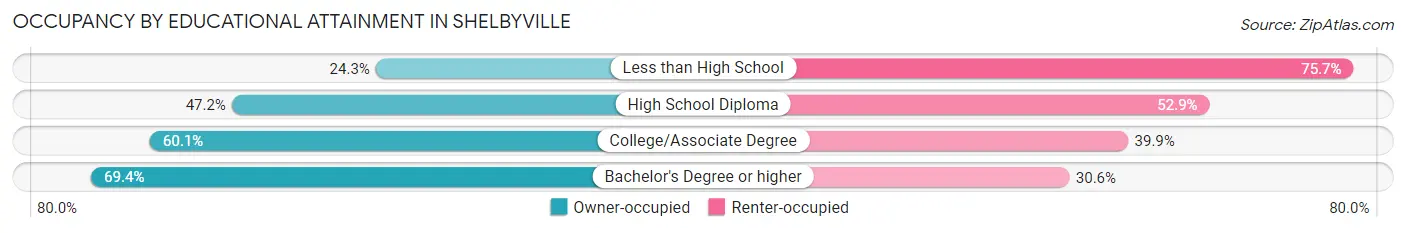
| Household Size | Owner-occupied | Renter-occupied |
| Less than High School | 369 (24.3%) | 1,148 (75.7%) |
| High School Diploma | 1,620 (47.1%) | 1,816 (52.8%) |
| College/Associate Degree | 1,346 (60.1%) | 893 (39.9%) |
| Bachelor's Degree or higher | 777 (69.4%) | 342 (30.6%) |
Occupancy by Age of Householder in Shelbyville
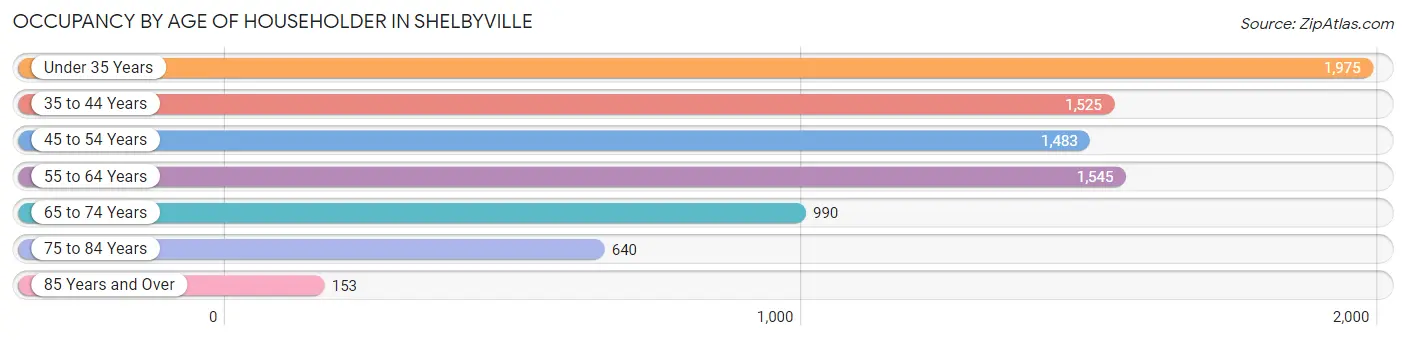
| Age Bracket | # Households | % Households |
| Under 35 Years | 1,975 | 23.8% |
| 35 to 44 Years | 1,525 | 18.3% |
| 45 to 54 Years | 1,483 | 17.8% |
| 55 to 64 Years | 1,545 | 18.6% |
| 65 to 74 Years | 990 | 11.9% |
| 75 to 84 Years | 640 | 7.7% |
| 85 Years and Over | 153 | 1.8% |
| Total | 8,311 | 100.0% |
Housing Finances in Shelbyville
Median Income by Occupancy in Shelbyville
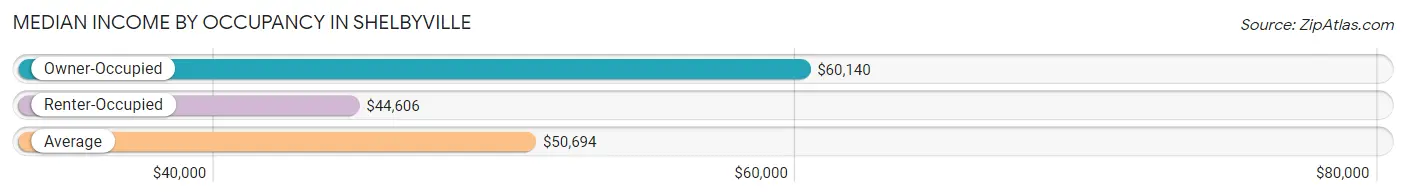
| Occupancy Type | # Households | Median Income |
| Owner-Occupied | 4,112 (49.5%) | $60,140 |
| Renter-Occupied | 4,199 (50.5%) | $44,606 |
| Average | 8,311 (100.0%) | $50,694 |
Occupancy by Householder Income Bracket in Shelbyville
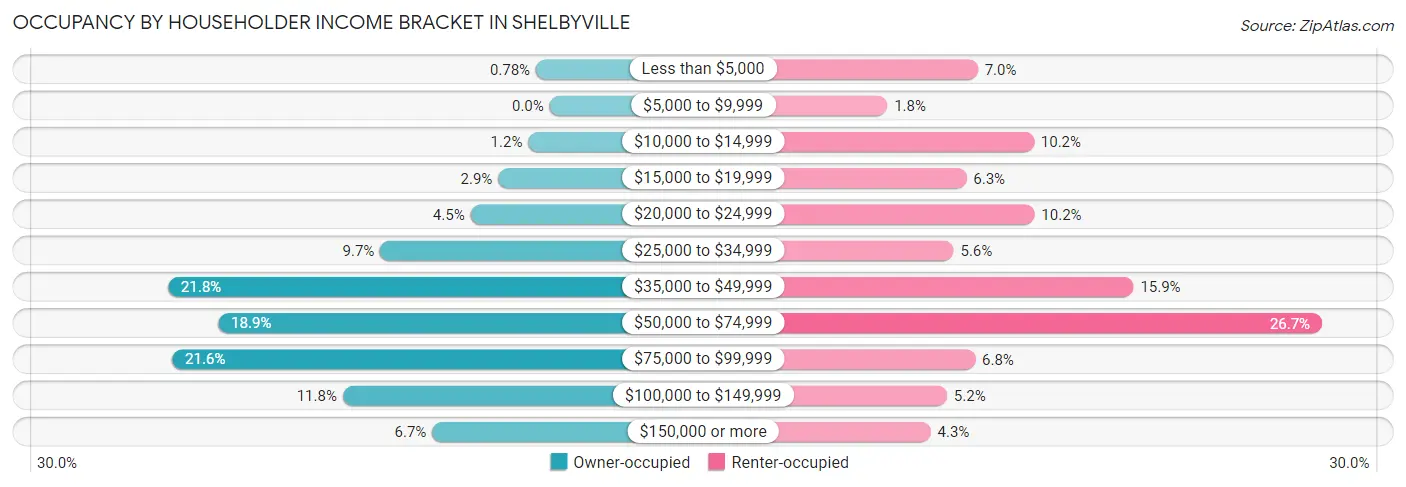
| Income Bracket | Owner-occupied | Renter-occupied |
| Less than $5,000 | 32 (0.8%) | 293 (7.0%) |
| $5,000 to $9,999 | 0 (0.0%) | 76 (1.8%) |
| $10,000 to $14,999 | 50 (1.2%) | 428 (10.2%) |
| $15,000 to $19,999 | 121 (2.9%) | 266 (6.3%) |
| $20,000 to $24,999 | 186 (4.5%) | 429 (10.2%) |
| $25,000 to $34,999 | 398 (9.7%) | 235 (5.6%) |
| $35,000 to $49,999 | 897 (21.8%) | 667 (15.9%) |
| $50,000 to $74,999 | 779 (18.9%) | 1,119 (26.7%) |
| $75,000 to $99,999 | 887 (21.6%) | 287 (6.8%) |
| $100,000 to $149,999 | 486 (11.8%) | 219 (5.2%) |
| $150,000 or more | 276 (6.7%) | 180 (4.3%) |
| Total | 4,112 (100.0%) | 4,199 (100.0%) |
Monthly Housing Cost Tiers in Shelbyville
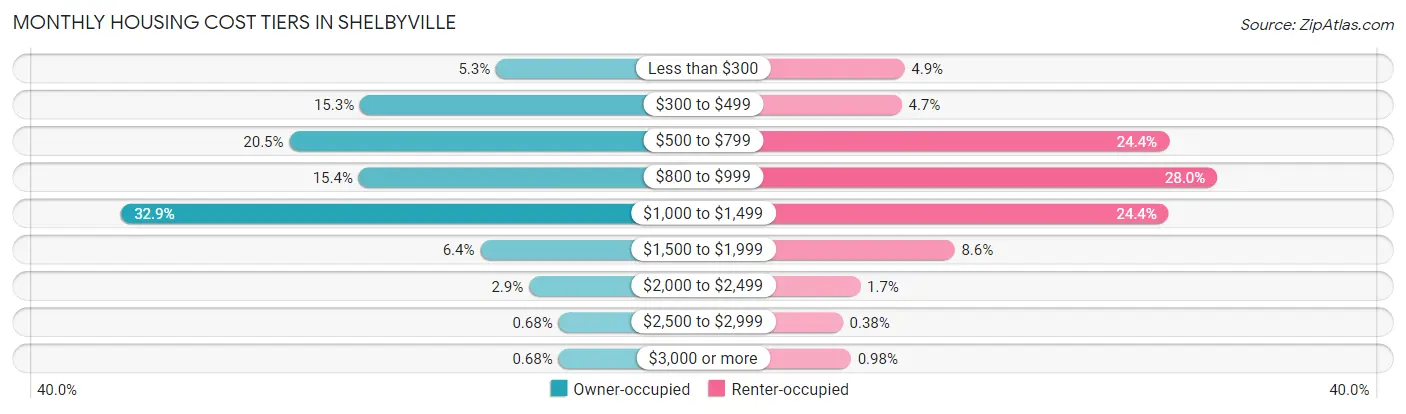
| Monthly Cost | Owner-occupied | Renter-occupied |
| Less than $300 | 217 (5.3%) | 207 (4.9%) |
| $300 to $499 | 629 (15.3%) | 198 (4.7%) |
| $500 to $799 | 843 (20.5%) | 1,025 (24.4%) |
| $800 to $999 | 633 (15.4%) | 1,174 (28.0%) |
| $1,000 to $1,499 | 1,352 (32.9%) | 1,024 (24.4%) |
| $1,500 to $1,999 | 265 (6.4%) | 362 (8.6%) |
| $2,000 to $2,499 | 117 (2.9%) | 70 (1.7%) |
| $2,500 to $2,999 | 28 (0.7%) | 16 (0.4%) |
| $3,000 or more | 28 (0.7%) | 41 (1.0%) |
| Total | 4,112 (100.0%) | 4,199 (100.0%) |
Physical Housing Characteristics in Shelbyville
Housing Structures in Shelbyville
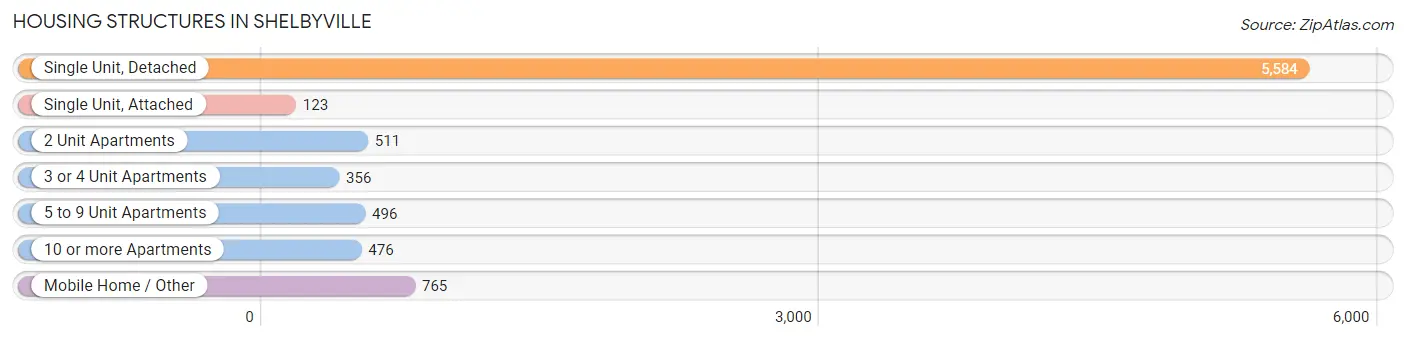
| Structure Type | # Housing Units | % Housing Units |
| Single Unit, Detached | 5,584 | 67.2% |
| Single Unit, Attached | 123 | 1.5% |
| 2 Unit Apartments | 511 | 6.1% |
| 3 or 4 Unit Apartments | 356 | 4.3% |
| 5 to 9 Unit Apartments | 496 | 6.0% |
| 10 or more Apartments | 476 | 5.7% |
| Mobile Home / Other | 765 | 9.2% |
| Total | 8,311 | 100.0% |
Housing Structures by Occupancy in Shelbyville
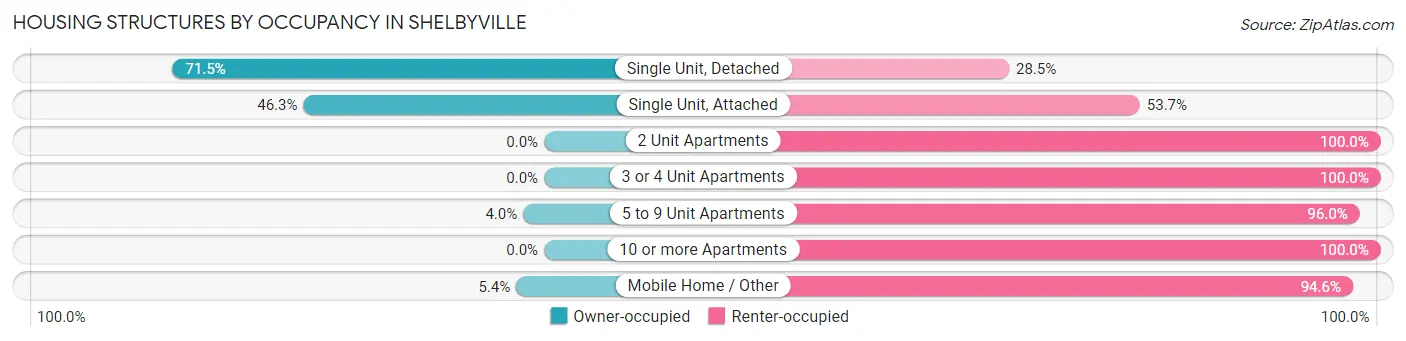
| Structure Type | Owner-occupied | Renter-occupied |
| Single Unit, Detached | 3,994 (71.5%) | 1,590 (28.5%) |
| Single Unit, Attached | 57 (46.3%) | 66 (53.7%) |
| 2 Unit Apartments | 0 (0.0%) | 511 (100.0%) |
| 3 or 4 Unit Apartments | 0 (0.0%) | 356 (100.0%) |
| 5 to 9 Unit Apartments | 20 (4.0%) | 476 (96.0%) |
| 10 or more Apartments | 0 (0.0%) | 476 (100.0%) |
| Mobile Home / Other | 41 (5.4%) | 724 (94.6%) |
| Total | 4,112 (49.5%) | 4,199 (50.5%) |
Housing Structures by Number of Rooms in Shelbyville
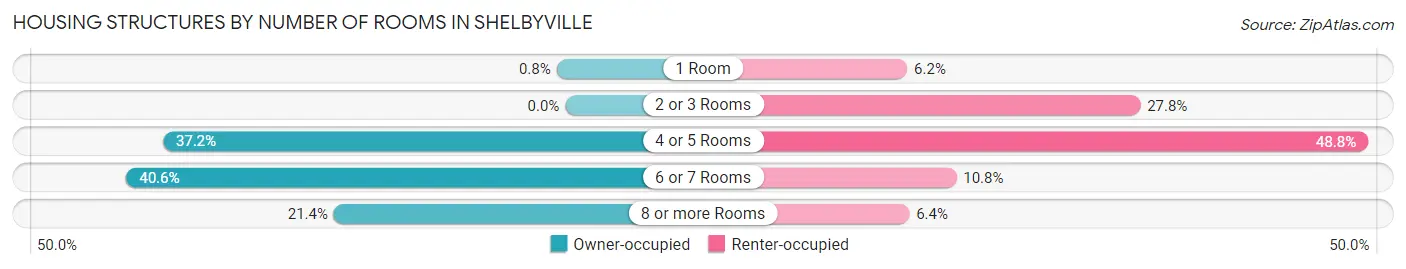
| Number of Rooms | Owner-occupied | Renter-occupied |
| 1 Room | 33 (0.8%) | 261 (6.2%) |
| 2 or 3 Rooms | 0 (0.0%) | 1,166 (27.8%) |
| 4 or 5 Rooms | 1,530 (37.2%) | 2,051 (48.8%) |
| 6 or 7 Rooms | 1,669 (40.6%) | 452 (10.8%) |
| 8 or more Rooms | 880 (21.4%) | 269 (6.4%) |
| Total | 4,112 (100.0%) | 4,199 (100.0%) |
Housing Structure by Heating Type in Shelbyville
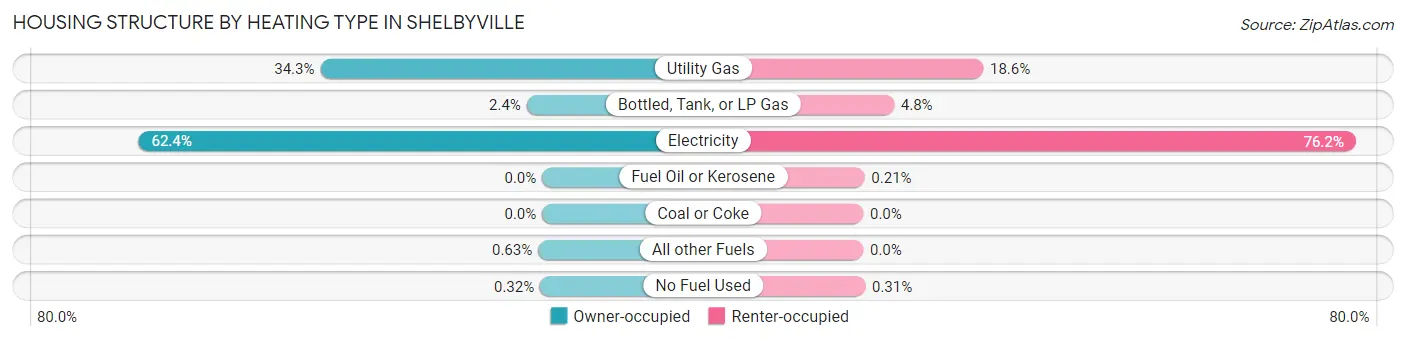
| Heating Type | Owner-occupied | Renter-occupied |
| Utility Gas | 1,410 (34.3%) | 779 (18.5%) |
| Bottled, Tank, or LP Gas | 98 (2.4%) | 200 (4.8%) |
| Electricity | 2,565 (62.4%) | 3,198 (76.2%) |
| Fuel Oil or Kerosene | 0 (0.0%) | 9 (0.2%) |
| Coal or Coke | 0 (0.0%) | 0 (0.0%) |
| All other Fuels | 26 (0.6%) | 0 (0.0%) |
| No Fuel Used | 13 (0.3%) | 13 (0.3%) |
| Total | 4,112 (100.0%) | 4,199 (100.0%) |
Household Vehicle Usage in Shelbyville
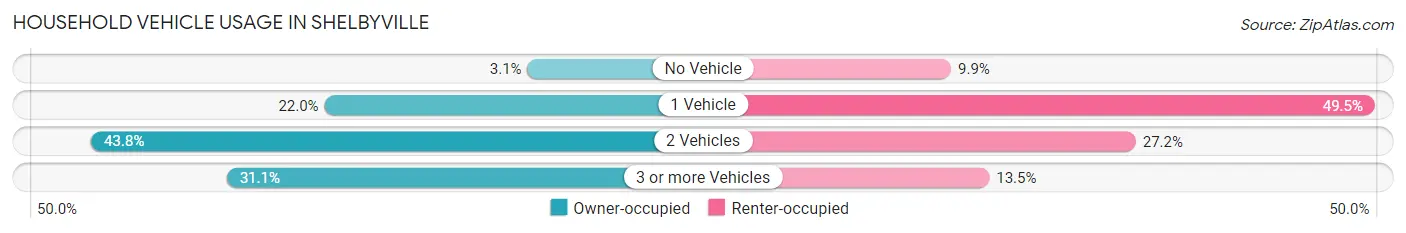
| Vehicles per Household | Owner-occupied | Renter-occupied |
| No Vehicle | 126 (3.1%) | 416 (9.9%) |
| 1 Vehicle | 905 (22.0%) | 2,077 (49.5%) |
| 2 Vehicles | 1,801 (43.8%) | 1,140 (27.2%) |
| 3 or more Vehicles | 1,280 (31.1%) | 566 (13.5%) |
| Total | 4,112 (100.0%) | 4,199 (100.0%) |
Real Estate & Mortgages in Shelbyville
Real Estate and Mortgage Overview in Shelbyville
| Characteristic | Without Mortgage | With Mortgage |
| Housing Units | 1,242 | 2,870 |
| Median Property Value | $167,800 | $176,000 |
| Median Household Income | $52,273 | $259 |
| Monthly Housing Costs | $458 | $28 |
| Real Estate Taxes | $1,324 | $23 |
Property Value by Mortgage Status in Shelbyville
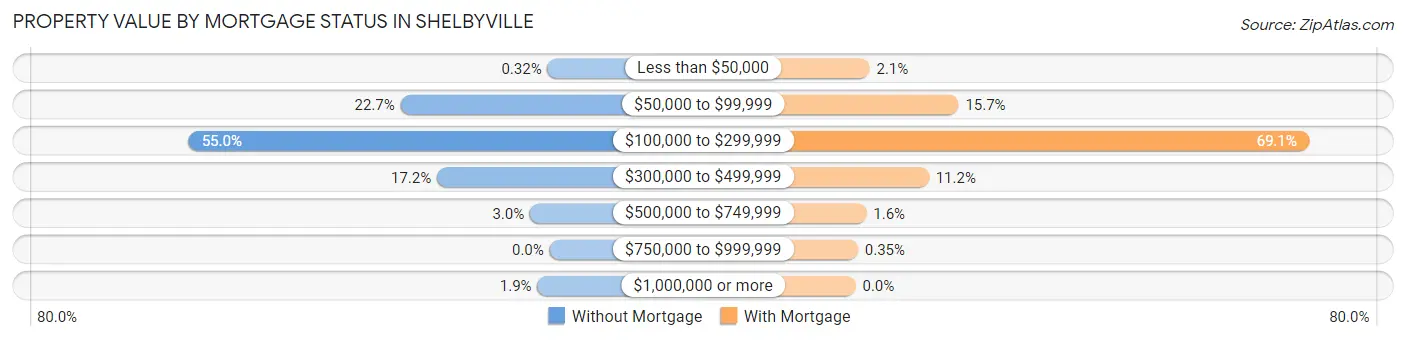
| Property Value | Without Mortgage | With Mortgage |
| Less than $50,000 | 4 (0.3%) | 61 (2.1%) |
| $50,000 to $99,999 | 282 (22.7%) | 450 (15.7%) |
| $100,000 to $299,999 | 683 (55.0%) | 1,982 (69.1%) |
| $300,000 to $499,999 | 213 (17.2%) | 320 (11.2%) |
| $500,000 to $749,999 | 37 (3.0%) | 47 (1.6%) |
| $750,000 to $999,999 | 0 (0.0%) | 10 (0.4%) |
| $1,000,000 or more | 23 (1.8%) | 0 (0.0%) |
| Total | 1,242 (100.0%) | 2,870 (100.0%) |
Household Income by Mortgage Status in Shelbyville
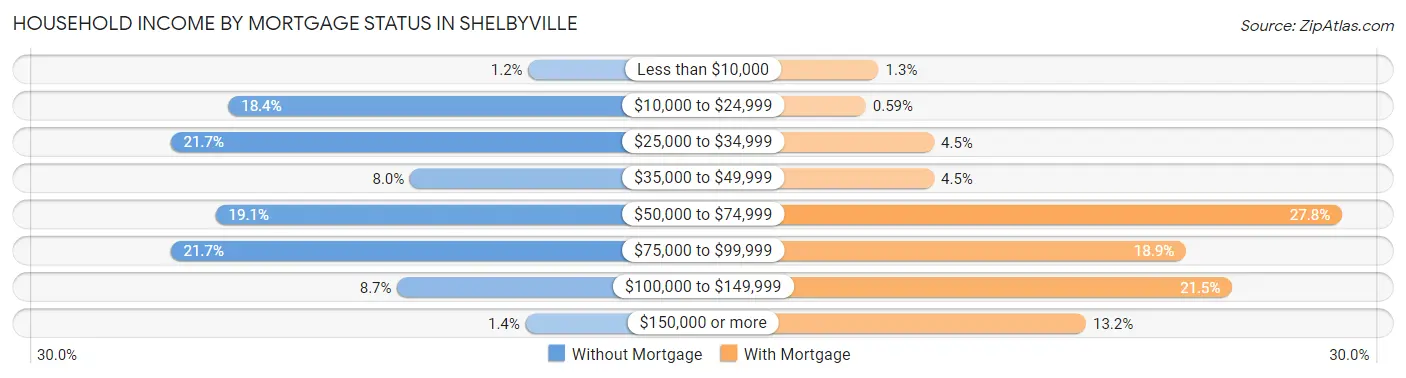
| Household Income | Without Mortgage | With Mortgage |
| Less than $10,000 | 15 (1.2%) | 38 (1.3%) |
| $10,000 to $24,999 | 228 (18.4%) | 17 (0.6%) |
| $25,000 to $34,999 | 269 (21.7%) | 129 (4.5%) |
| $35,000 to $49,999 | 99 (8.0%) | 129 (4.5%) |
| $50,000 to $74,999 | 237 (19.1%) | 798 (27.8%) |
| $75,000 to $99,999 | 269 (21.7%) | 542 (18.9%) |
| $100,000 to $149,999 | 108 (8.7%) | 618 (21.5%) |
| $150,000 or more | 17 (1.4%) | 378 (13.2%) |
| Total | 1,242 (100.0%) | 2,870 (100.0%) |
Property Value to Household Income Ratio in Shelbyville
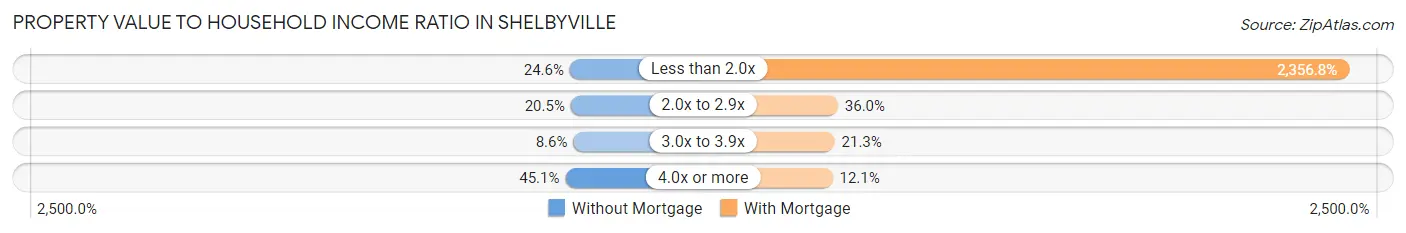
| Value-to-Income Ratio | Without Mortgage | With Mortgage |
| Less than 2.0x | 306 (24.6%) | 67,639 (2,356.8%) |
| 2.0x to 2.9x | 254 (20.4%) | 1,032 (36.0%) |
| 3.0x to 3.9x | 107 (8.6%) | 612 (21.3%) |
| 4.0x or more | 560 (45.1%) | 346 (12.1%) |
| Total | 1,242 (100.0%) | 2,870 (100.0%) |
Real Estate Taxes by Mortgage Status in Shelbyville
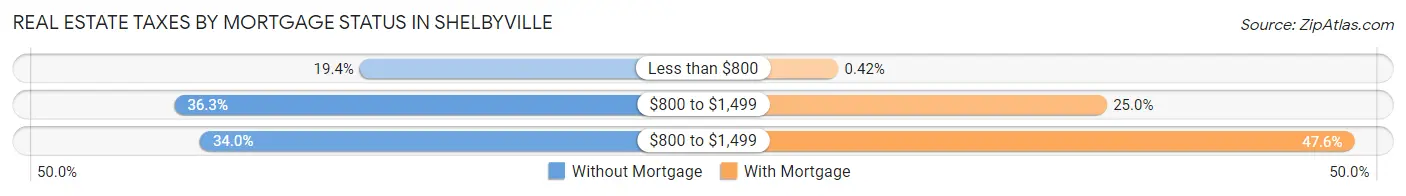
| Property Taxes | Without Mortgage | With Mortgage |
| Less than $800 | 241 (19.4%) | 12 (0.4%) |
| $800 to $1,499 | 451 (36.3%) | 716 (24.9%) |
| $800 to $1,499 | 422 (34.0%) | 1,366 (47.6%) |
| Total | 1,242 (100.0%) | 2,870 (100.0%) |
Health & Disability in Shelbyville
Health Insurance Coverage by Age in Shelbyville
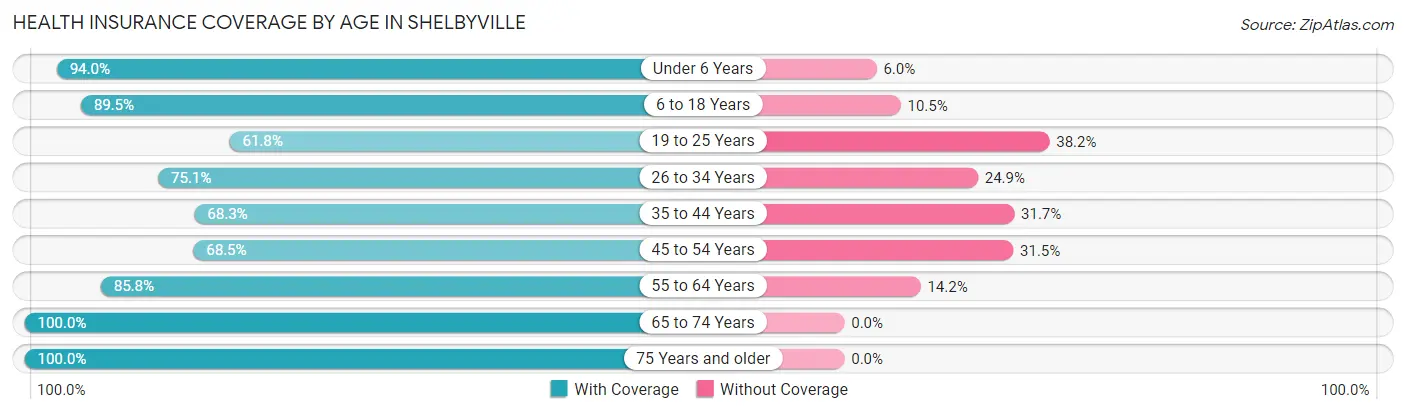
| Age Bracket | With Coverage | Without Coverage |
| Under 6 Years | 2,240 (94.0%) | 143 (6.0%) |
| 6 to 18 Years | 4,436 (89.5%) | 520 (10.5%) |
| 19 to 25 Years | 1,249 (61.8%) | 773 (38.2%) |
| 26 to 34 Years | 2,477 (75.1%) | 821 (24.9%) |
| 35 to 44 Years | 1,996 (68.3%) | 925 (31.7%) |
| 45 to 54 Years | 2,061 (68.5%) | 947 (31.5%) |
| 55 to 64 Years | 1,986 (85.8%) | 329 (14.2%) |
| 65 to 74 Years | 1,162 (100.0%) | 0 (0.0%) |
| 75 Years and older | 1,158 (100.0%) | 0 (0.0%) |
| Total | 18,765 (80.8%) | 4,458 (19.2%) |
Health Insurance Coverage by Citizenship Status in Shelbyville
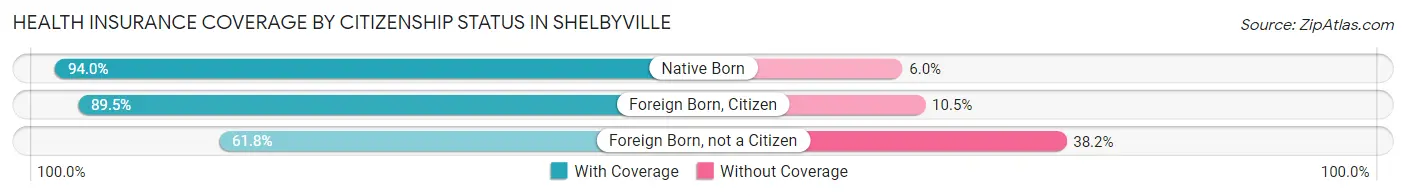
| Citizenship Status | With Coverage | Without Coverage |
| Native Born | 2,240 (94.0%) | 143 (6.0%) |
| Foreign Born, Citizen | 4,436 (89.5%) | 520 (10.5%) |
| Foreign Born, not a Citizen | 1,249 (61.8%) | 773 (38.2%) |
Health Insurance Coverage by Household Income in Shelbyville
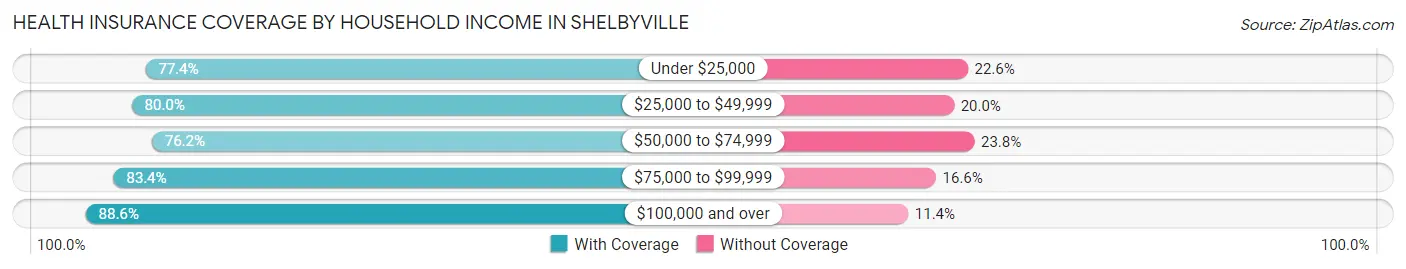
| Household Income | With Coverage | Without Coverage |
| Under $25,000 | 3,048 (77.4%) | 891 (22.6%) |
| $25,000 to $49,999 | 3,969 (80.0%) | 994 (20.0%) |
| $50,000 to $74,999 | 4,431 (76.2%) | 1,387 (23.8%) |
| $75,000 to $99,999 | 3,256 (83.4%) | 650 (16.6%) |
| $100,000 and over | 4,016 (88.6%) | 519 (11.4%) |
Public vs Private Health Insurance Coverage by Age in Shelbyville
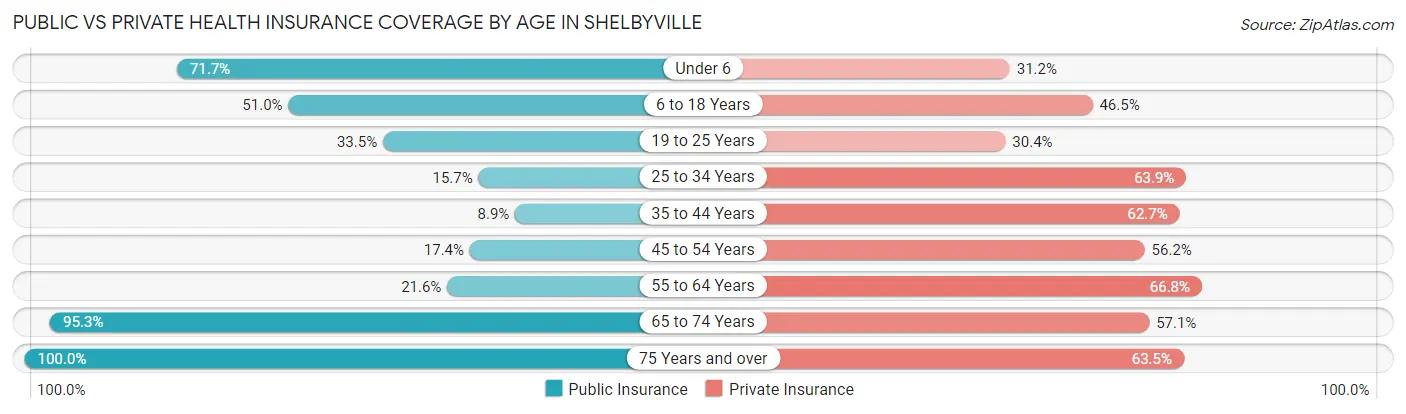
| Age Bracket | Public Insurance | Private Insurance |
| Under 6 | 1,709 (71.7%) | 743 (31.2%) |
| 6 to 18 Years | 2,529 (51.0%) | 2,306 (46.5%) |
| 19 to 25 Years | 677 (33.5%) | 614 (30.4%) |
| 25 to 34 Years | 519 (15.7%) | 2,108 (63.9%) |
| 35 to 44 Years | 261 (8.9%) | 1,831 (62.7%) |
| 45 to 54 Years | 522 (17.3%) | 1,691 (56.2%) |
| 55 to 64 Years | 499 (21.6%) | 1,547 (66.8%) |
| 65 to 74 Years | 1,107 (95.3%) | 663 (57.1%) |
| 75 Years and over | 1,158 (100.0%) | 735 (63.5%) |
| Total | 8,981 (38.7%) | 12,238 (52.7%) |
Disability Status by Sex by Age in Shelbyville
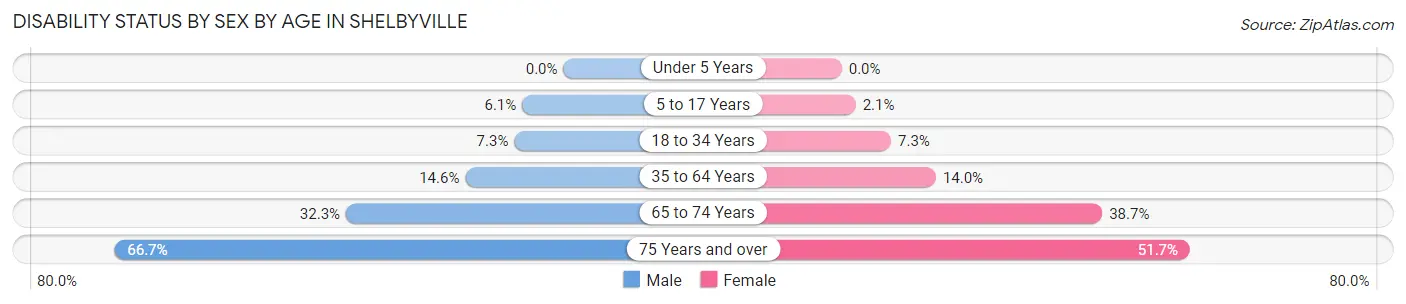
| Age Bracket | Male | Female |
| Under 5 Years | 0 (0.0%) | 0 (0.0%) |
| 5 to 17 Years | 156 (6.1%) | 55 (2.1%) |
| 18 to 34 Years | 204 (7.3%) | 202 (7.3%) |
| 35 to 64 Years | 609 (14.6%) | 568 (14.0%) |
| 65 to 74 Years | 113 (32.3%) | 314 (38.7%) |
| 75 Years and over | 394 (66.7%) | 293 (51.7%) |
Disability Class by Sex by Age in Shelbyville
Disability Class: Hearing Difficulty
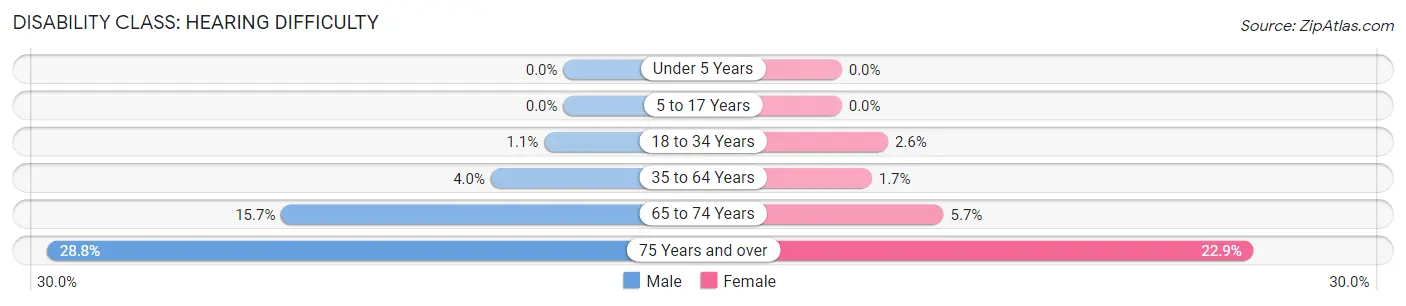
| Age Bracket | Male | Female |
| Under 5 Years | 0 (0.0%) | 0 (0.0%) |
| 5 to 17 Years | 0 (0.0%) | 0 (0.0%) |
| 18 to 34 Years | 30 (1.1%) | 71 (2.6%) |
| 35 to 64 Years | 169 (4.0%) | 68 (1.7%) |
| 65 to 74 Years | 55 (15.7%) | 46 (5.7%) |
| 75 Years and over | 170 (28.8%) | 130 (22.9%) |
Disability Class: Vision Difficulty
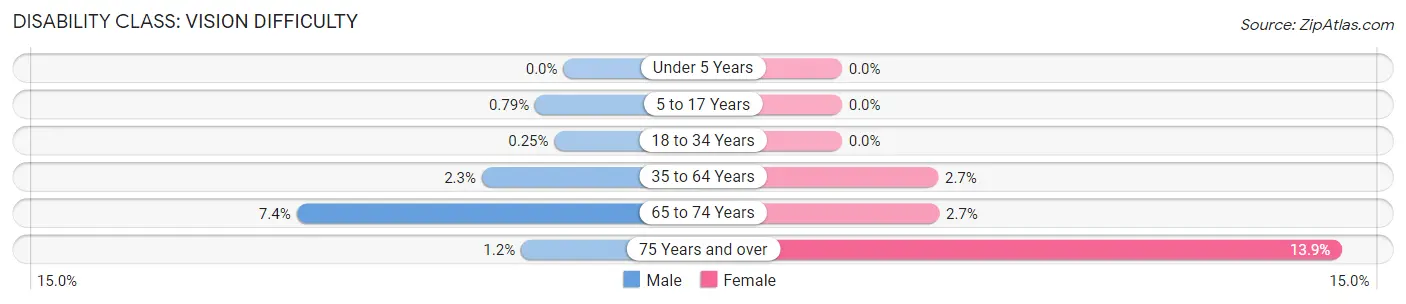
| Age Bracket | Male | Female |
| Under 5 Years | 0 (0.0%) | 0 (0.0%) |
| 5 to 17 Years | 20 (0.8%) | 0 (0.0%) |
| 18 to 34 Years | 7 (0.3%) | 0 (0.0%) |
| 35 to 64 Years | 95 (2.3%) | 109 (2.7%) |
| 65 to 74 Years | 26 (7.4%) | 22 (2.7%) |
| 75 Years and over | 7 (1.2%) | 79 (13.9%) |
Disability Class: Cognitive Difficulty
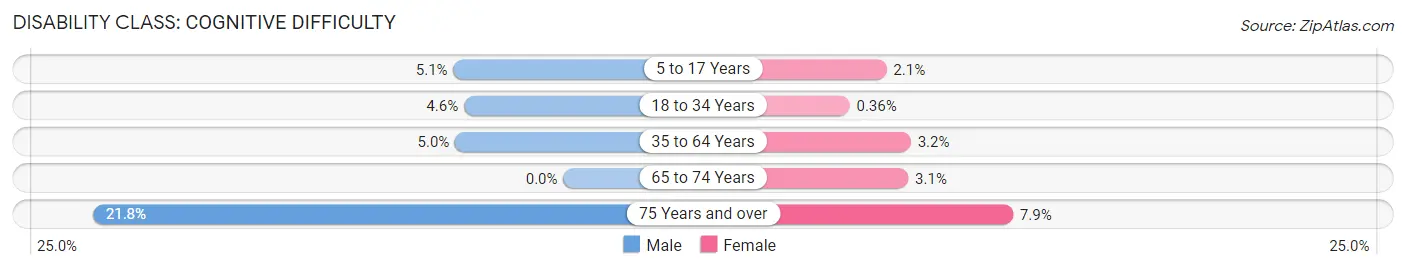
| Age Bracket | Male | Female |
| 5 to 17 Years | 130 (5.1%) | 55 (2.1%) |
| 18 to 34 Years | 129 (4.6%) | 10 (0.4%) |
| 35 to 64 Years | 210 (5.0%) | 130 (3.2%) |
| 65 to 74 Years | 0 (0.0%) | 25 (3.1%) |
| 75 Years and over | 129 (21.8%) | 45 (7.9%) |
Disability Class: Ambulatory Difficulty
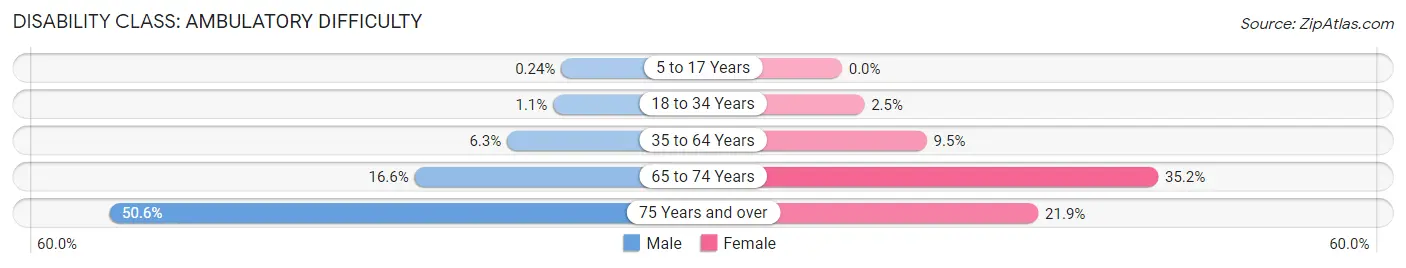
| Age Bracket | Male | Female |
| 5 to 17 Years | 6 (0.2%) | 0 (0.0%) |
| 18 to 34 Years | 32 (1.1%) | 69 (2.5%) |
| 35 to 64 Years | 262 (6.3%) | 384 (9.5%) |
| 65 to 74 Years | 58 (16.6%) | 286 (35.2%) |
| 75 Years and over | 299 (50.6%) | 124 (21.9%) |
Disability Class: Self-Care Difficulty
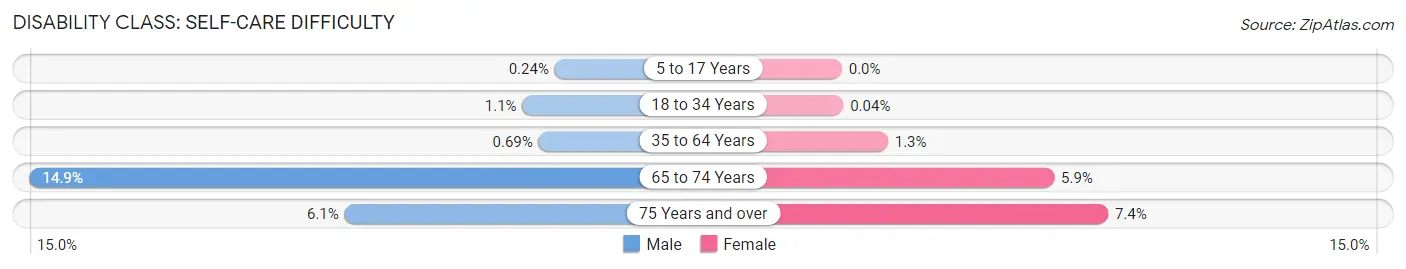
| Age Bracket | Male | Female |
| 5 to 17 Years | 6 (0.2%) | 0 (0.0%) |
| 18 to 34 Years | 32 (1.1%) | 1 (0.0%) |
| 35 to 64 Years | 29 (0.7%) | 52 (1.3%) |
| 65 to 74 Years | 52 (14.9%) | 48 (5.9%) |
| 75 Years and over | 36 (6.1%) | 42 (7.4%) |
Technology Access in Shelbyville
Computing Device Access in Shelbyville
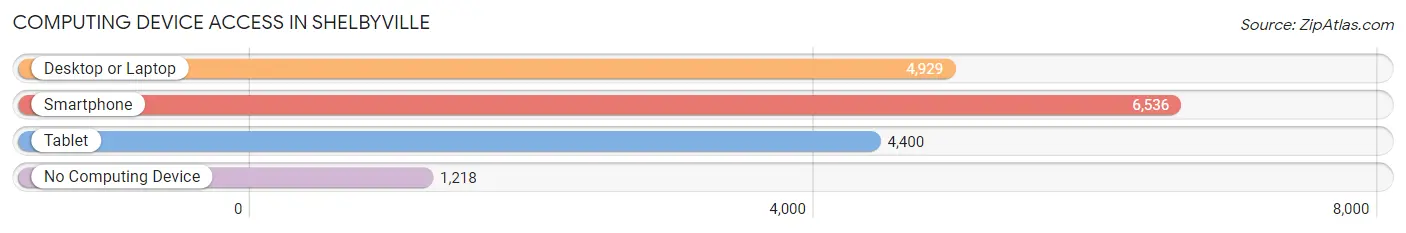
| Device Type | # Households | % Households |
| Desktop or Laptop | 4,929 | 59.3% |
| Smartphone | 6,536 | 78.6% |
| Tablet | 4,400 | 52.9% |
| No Computing Device | 1,218 | 14.7% |
| Total | 8,311 | 100.0% |
Internet Access in Shelbyville
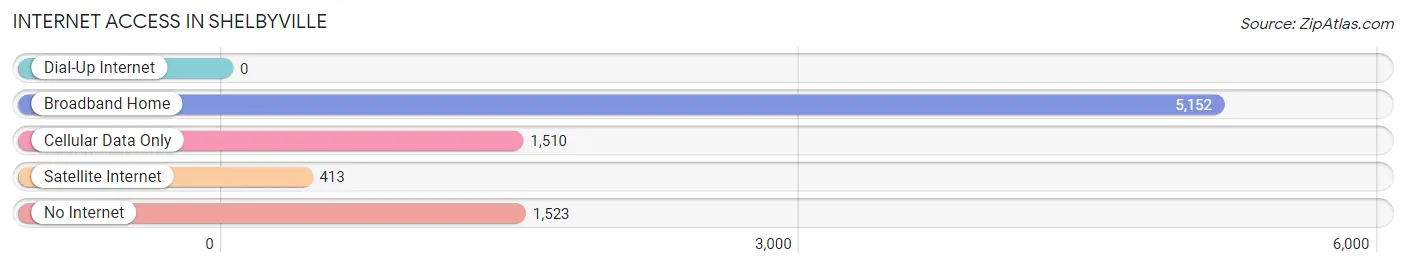
| Internet Type | # Households | % Households |
| Dial-Up Internet | 0 | 0.0% |
| Broadband Home | 5,152 | 62.0% |
| Cellular Data Only | 1,510 | 18.2% |
| Satellite Internet | 413 | 5.0% |
| No Internet | 1,523 | 18.3% |
| Total | 8,311 | 100.0% |
Shelbyville Summary
Shelbyville, Tennessee is a city located in Bedford County, Tennessee, United States. It is the county seat of Bedford County and is located about 50 miles southeast of Nashville. The population of Shelbyville was 16,105 at the 2010 census.
History
Shelbyville was founded in 1810 by William Bedford, a Revolutionary War veteran. The town was named after Isaac Shelby, the first governor of Kentucky. The town was incorporated in 1819 and was the county seat of Bedford County.
In the early 19th century, Shelbyville was a major center for the production of cotton and tobacco. The town was also a major stop on the stagecoach route between Nashville and Chattanooga.
During the Civil War, Shelbyville was the site of several battles, including the Battle of Shelbyville in 1863. The town was occupied by Union forces in 1863 and 1864.
Geography
Shelbyville is located at 35°29'N 86°27'W (35.4833, -86.4500). The city is situated in the Central Basin of Tennessee, which is part of the larger Interior Low Plateaus region of the United States.
The city is located in the Duck River watershed, which is part of the Cumberland River watershed. The Duck River is the longest river in Tennessee and is a major tributary of the Cumberland River.
The city is located in a hilly area, with elevations ranging from 600 to 900 feet above sea level. The city is located in a humid subtropical climate zone, with hot, humid summers and mild winters.
Economy
Shelbyville is a major center for the production of furniture, automotive parts, and textiles. The city is also home to several manufacturing plants, including a General Motors plant and a Tyson Foods plant.
The city is also home to several retail stores, including Walmart, Target, and Lowe's. The city is also home to several restaurants, including Applebee's, Cracker Barrel, and Olive Garden.
Demographics
As of the 2010 census, the population of Shelbyville was 16,105. The racial makeup of the city was 79.2% White, 16.2% African American, 0.4% Native American, 0.7% Asian, 0.1% Pacific Islander, 1.3% from other races, and 2.1% from two or more races. Hispanic or Latino of any race were 3.2% of the population.
The median income for a household in the city was $35,945, and the median income for a family was $45,945. The per capita income for the city was $20,845. About 15.2% of families and 18.2% of the population were below the poverty line, including 25.2% of those under age 18 and 11.2% of those age 65 or over.
Conclusion
Shelbyville, Tennessee is a city located in Bedford County, Tennessee, United States. It is the county seat of Bedford County and is located about 50 miles southeast of Nashville. The population of Shelbyville was 16,105 at the 2010 census. The city is a major center for the production of furniture, automotive parts, and textiles. The city is also home to several retail stores, restaurants, and manufacturing plants. The racial makeup of the city was 79.2% White, 16.2% African American, 0.4% Native American, 0.7% Asian, 0.1% Pacific Islander, 1.3% from other races, and 2.1% from two or more races. The median income for a household in the city was $35,945, and the median income for a family was $45,945. About 15.2% of families and 18.2% of the population were below the poverty line.
Common Questions
What is Per Capita Income in Shelbyville?
Per Capita income in Shelbyville is $22,905.
What is the Median Family Income in Shelbyville?
Median Family Income in Shelbyville is $55,142.
What is the Median Household income in Shelbyville?
Median Household Income in Shelbyville is $50,694.
What is Income or Wage Gap in Shelbyville?
Income or Wage Gap in Shelbyville is 20.6%.
Women in Shelbyville earn 79.4 cents for every dollar earned by a man.
What is Family Income Deficit in Shelbyville?
Family Income Deficit in Shelbyville is $10,768.
Families that are below poverty line in Shelbyville earn $10,768 less on average than the poverty threshold level.
What is Inequality or Gini Index in Shelbyville?
Inequality or Gini Index in Shelbyville is 0.40.
What is the Total Population of Shelbyville?
Total Population of Shelbyville is 23,676.
What is the Total Male Population of Shelbyville?
Total Male Population of Shelbyville is 11,867.
What is the Total Female Population of Shelbyville?
Total Female Population of Shelbyville is 11,809.
What is the Ratio of Males per 100 Females in Shelbyville?
There are 100.49 Males per 100 Females in Shelbyville.
What is the Ratio of Females per 100 Males in Shelbyville?
There are 99.51 Females per 100 Males in Shelbyville.
What is the Median Population Age in Shelbyville?
Median Population Age in Shelbyville is 31.3 Years.
What is the Average Family Size in Shelbyville
Average Family Size in Shelbyville is 3.4 People.
What is the Average Household Size in Shelbyville
Average Household Size in Shelbyville is 2.8 People.
How Large is the Labor Force in Shelbyville?
There are 11,720 People in the Labor Forcein in Shelbyville.
What is the Percentage of People in the Labor Force in Shelbyville?
68.0% of People are in the Labor Force in Shelbyville.
What is the Unemployment Rate in Shelbyville?
Unemployment Rate in Shelbyville is 4.0%.