Dandridge, TN Map & Demographics
Dandridge Map
Dandridge Overview
$33,114
PER CAPITA INCOME
$67,652
AVG FAMILY INCOME
$53,422
AVG HOUSEHOLD INCOME
29.8%
WAGE / INCOME GAP [ % ]
70.2¢/ $1
WAGE / INCOME GAP [ $ ]
$7,776
FAMILY INCOME DEFICIT
0.45
INEQUALITY / GINI INDEX
3,351
TOTAL POPULATION
1,782
MALE POPULATION
1,569
FEMALE POPULATION
113.58
MALES / 100 FEMALES
88.05
FEMALES / 100 MALES
50.6
MEDIAN AGE
2.7
AVG FAMILY SIZE
2.1
AVG HOUSEHOLD SIZE
1,368
LABOR FORCE [ PEOPLE ]
45.8%
PERCENT IN LABOR FORCE
7.0%
UNEMPLOYMENT RATE
Dandridge Zip Codes
Dandridge Area Codes
Income in Dandridge
Income Overview in Dandridge
Per Capita Income in Dandridge is $33,114, while median incomes of families and households are $67,652 and $53,422 respectively.
| Characteristic | Number | Measure |
| Per Capita Income | 3,351 | $33,114 |
| Median Family Income | 821 | $67,652 |
| Mean Family Income | 821 | $94,184 |
| Median Household Income | 1,323 | $53,422 |
| Mean Household Income | 1,323 | $76,250 |
| Income Deficit | 821 | $7,776 |
| Wage / Income Gap (%) | 3,351 | 29.80% |
| Wage / Income Gap ($) | 3,351 | 70.20¢ per $1 |
| Gini / Inequality Index | 3,351 | 0.45 |
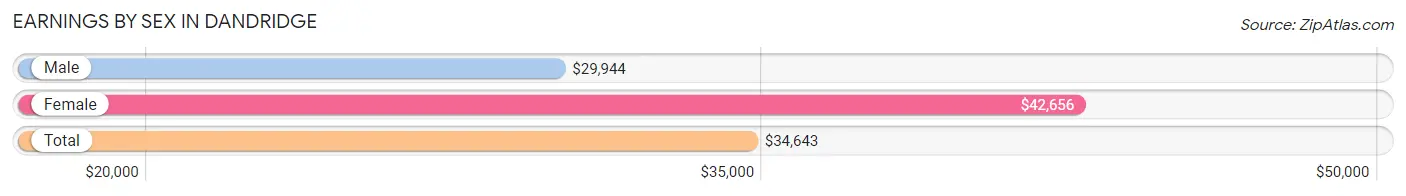
Earnings by Sex in Dandridge
Average Earnings in Dandridge are $34,643, $29,944 for men and $42,656 for women, a difference of 29.8%.
| Sex | Number | Average Earnings |
| Male | 858 (55.5%) | $29,944 |
| Female | 688 (44.5%) | $42,656 |
| Total | 1,546 (100.0%) | $34,643 |
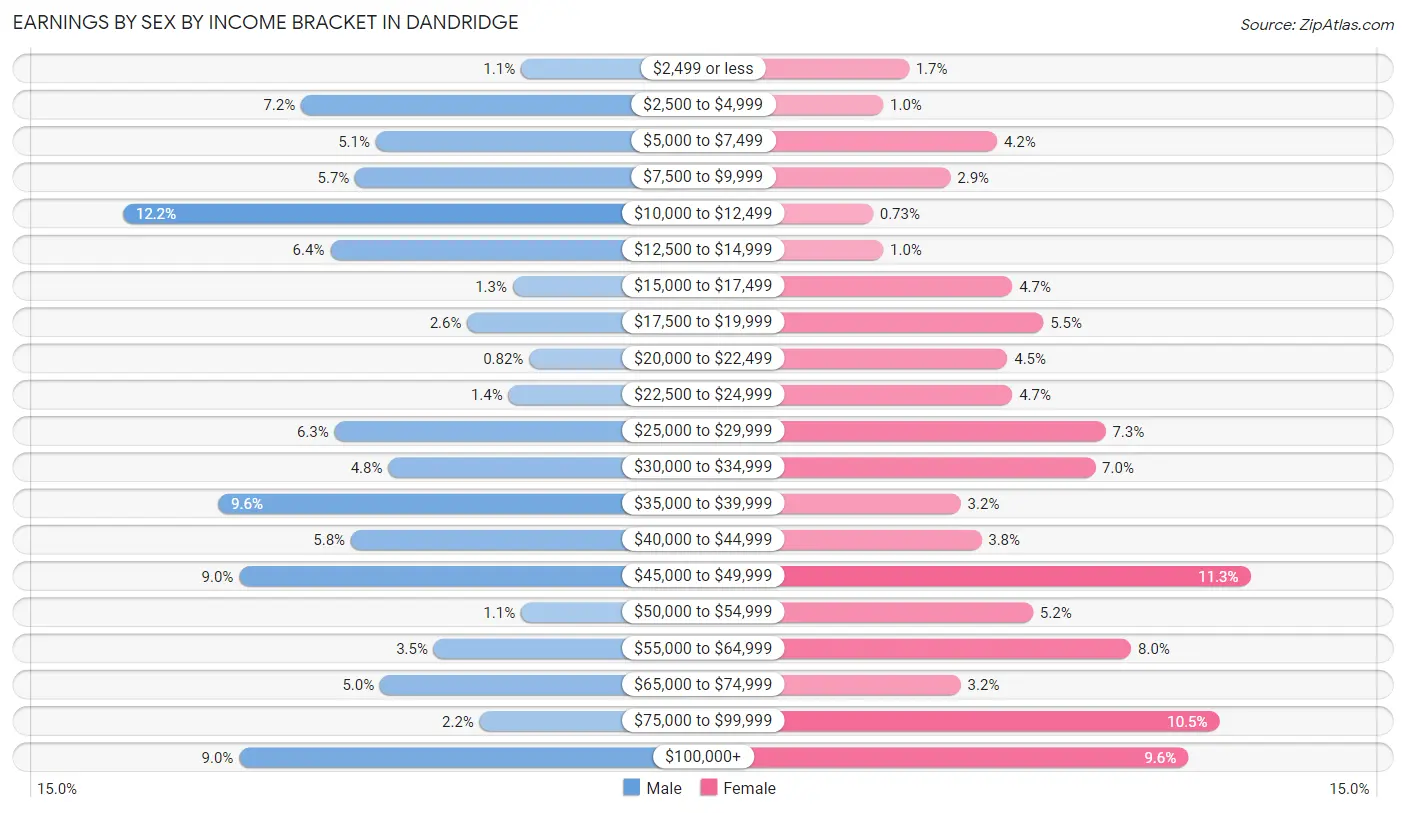
Earnings by Sex by Income Bracket in Dandridge
The most common earnings brackets in Dandridge are $10,000 to $12,499 for men (105 | 12.2%) and $45,000 to $49,999 for women (78 | 11.3%).
| Income | Male | Female |
| $2,499 or less | 9 (1.1%) | 12 (1.7%) |
| $2,500 to $4,999 | 62 (7.2%) | 7 (1.0%) |
| $5,000 to $7,499 | 44 (5.1%) | 29 (4.2%) |
| $7,500 to $9,999 | 49 (5.7%) | 20 (2.9%) |
| $10,000 to $12,499 | 105 (12.2%) | 5 (0.7%) |
| $12,500 to $14,999 | 55 (6.4%) | 7 (1.0%) |
| $15,000 to $17,499 | 11 (1.3%) | 32 (4.6%) |
| $17,500 to $19,999 | 22 (2.6%) | 38 (5.5%) |
| $20,000 to $22,499 | 7 (0.8%) | 31 (4.5%) |
| $22,500 to $24,999 | 12 (1.4%) | 32 (4.6%) |
| $25,000 to $29,999 | 54 (6.3%) | 50 (7.3%) |
| $30,000 to $34,999 | 41 (4.8%) | 48 (7.0%) |
| $35,000 to $39,999 | 82 (9.6%) | 22 (3.2%) |
| $40,000 to $44,999 | 50 (5.8%) | 26 (3.8%) |
| $45,000 to $49,999 | 77 (9.0%) | 78 (11.3%) |
| $50,000 to $54,999 | 9 (1.1%) | 36 (5.2%) |
| $55,000 to $64,999 | 30 (3.5%) | 55 (8.0%) |
| $65,000 to $74,999 | 43 (5.0%) | 22 (3.2%) |
| $75,000 to $99,999 | 19 (2.2%) | 72 (10.5%) |
| $100,000+ | 77 (9.0%) | 66 (9.6%) |
| Total | 858 (100.0%) | 688 (100.0%) |
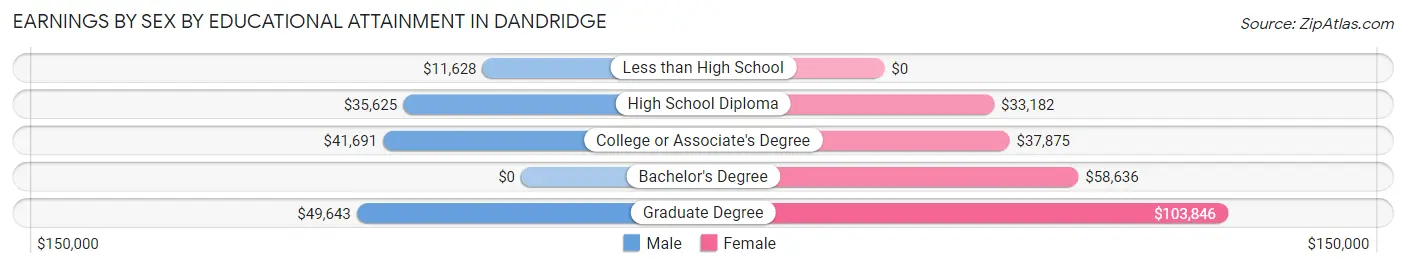
Earnings by Sex by Educational Attainment in Dandridge
Average earnings in Dandridge are $36,123 for men and $45,564 for women, a difference of 20.7%. Men with an educational attainment of graduate degree enjoy the highest average annual earnings of $49,643, while those with less than high school education earn the least with $11,628. Women with an educational attainment of graduate degree earn the most with the average annual earnings of $103,846, while those with high school diploma education have the smallest earnings of $33,182.
| Educational Attainment | Male Income | Female Income |
| Less than High School | $11,628 | $0 |
| High School Diploma | $35,625 | $33,182 |
| College or Associate's Degree | $41,691 | $37,875 |
| Bachelor's Degree | - | - |
| Graduate Degree | $49,643 | $103,846 |
| Total | $36,123 | $45,564 |
Family Income in Dandridge
Family Income Brackets in Dandridge
According to the Dandridge family income data, there are 237 families falling into the $35,000 to $49,999 income range, which is the most common income bracket and makes up 28.9% of all families. Conversely, the less than $10,000 income bracket is the least frequent group with only 3 families (0.4%) belonging to this category.
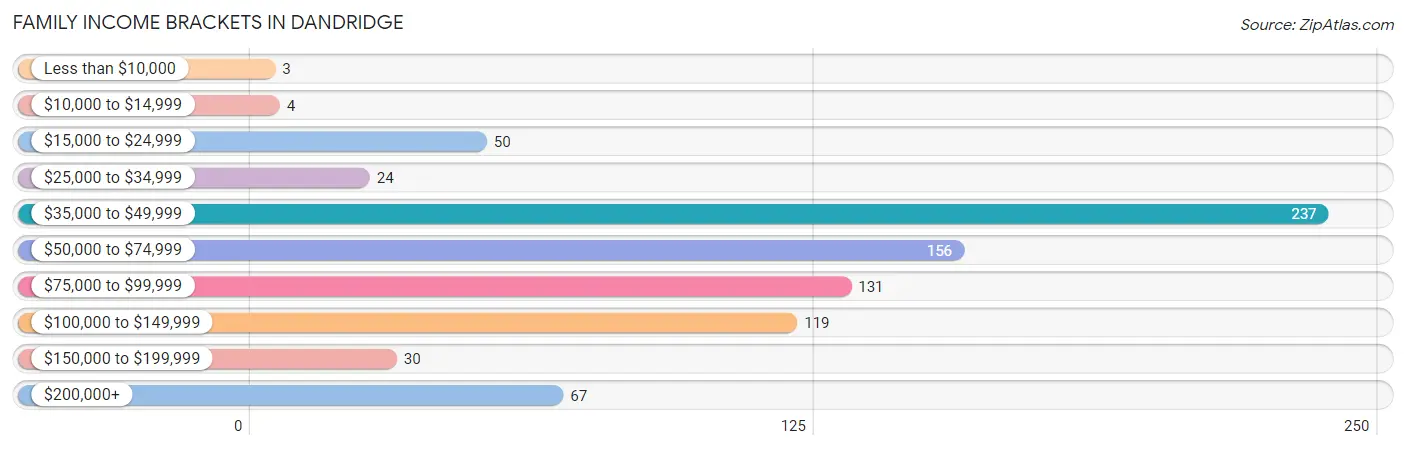
| Income Bracket | # Families | % Families |
| Less than $10,000 | 3 | 0.4% |
| $10,000 to $14,999 | 4 | 0.5% |
| $15,000 to $24,999 | 50 | 6.1% |
| $25,000 to $34,999 | 24 | 2.9% |
| $35,000 to $49,999 | 237 | 28.9% |
| $50,000 to $74,999 | 156 | 19.0% |
| $75,000 to $99,999 | 131 | 16.0% |
| $100,000 to $149,999 | 119 | 14.5% |
| $150,000 to $199,999 | 30 | 3.7% |
| $200,000+ | 67 | 8.2% |
Family Income by Famaliy Size in Dandridge
3-person families (124 | 15.1%) account for the highest median family income in Dandridge with $95,000 per family, while 3-person families (124 | 15.1%) have the highest median income of $31,667 per family member.
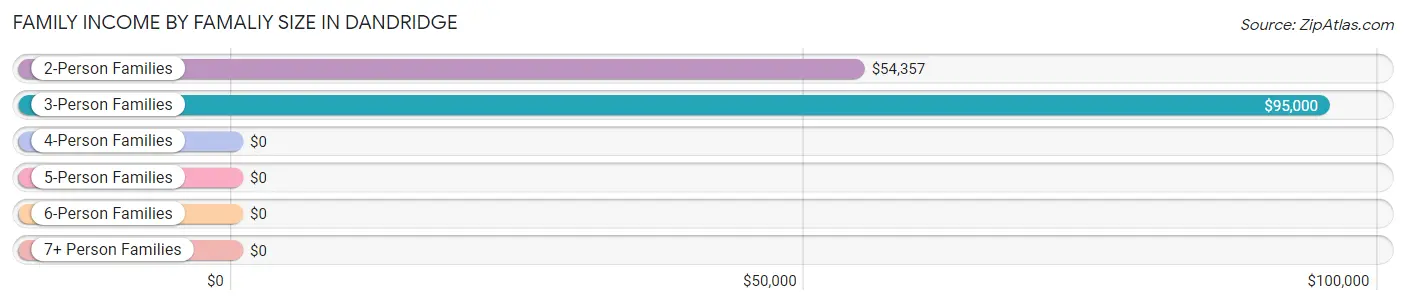
| Income Bracket | # Families | Median Income |
| 2-Person Families | 536 (65.3%) | $54,357 |
| 3-Person Families | 124 (15.1%) | $95,000 |
| 4-Person Families | 123 (15.0%) | $0 |
| 5-Person Families | 27 (3.3%) | $0 |
| 6-Person Families | 6 (0.7%) | $0 |
| 7+ Person Families | 5 (0.6%) | $0 |
| Total | 821 (100.0%) | $67,652 |
Family Income by Number of Earners in Dandridge
The median family income in Dandridge is $67,652, with families comprising 3+ earners (54) having the highest median family income of $109,063, while families with no earners (208) have the lowest median family income of $48,605, accounting for 6.6% and 25.3% of families, respectively.
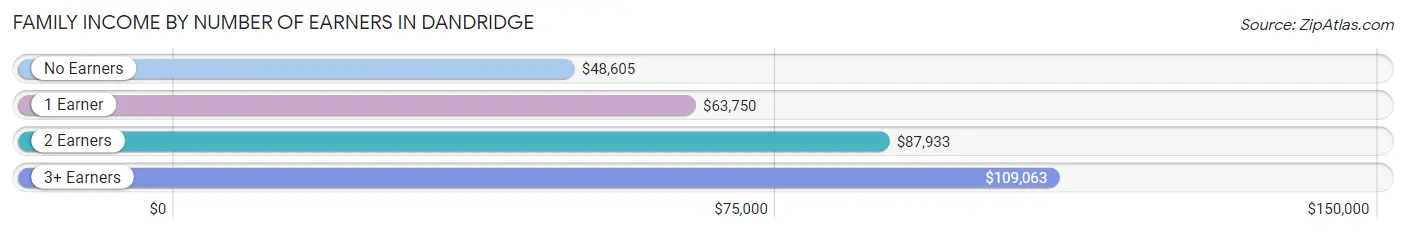
| Number of Earners | # Families | Median Income |
| No Earners | 208 (25.3%) | $48,605 |
| 1 Earner | 226 (27.5%) | $63,750 |
| 2 Earners | 333 (40.6%) | $87,933 |
| 3+ Earners | 54 (6.6%) | $109,063 |
| Total | 821 (100.0%) | $67,652 |
Household Income in Dandridge
Household Income Brackets in Dandridge
With 273 households falling in the category, the $35,000 to $49,999 income range is the most frequent in Dandridge, accounting for 20.6% of all households. In contrast, only 7 households (0.5%) fall into the less than $10,000 income bracket, making it the least populous group.
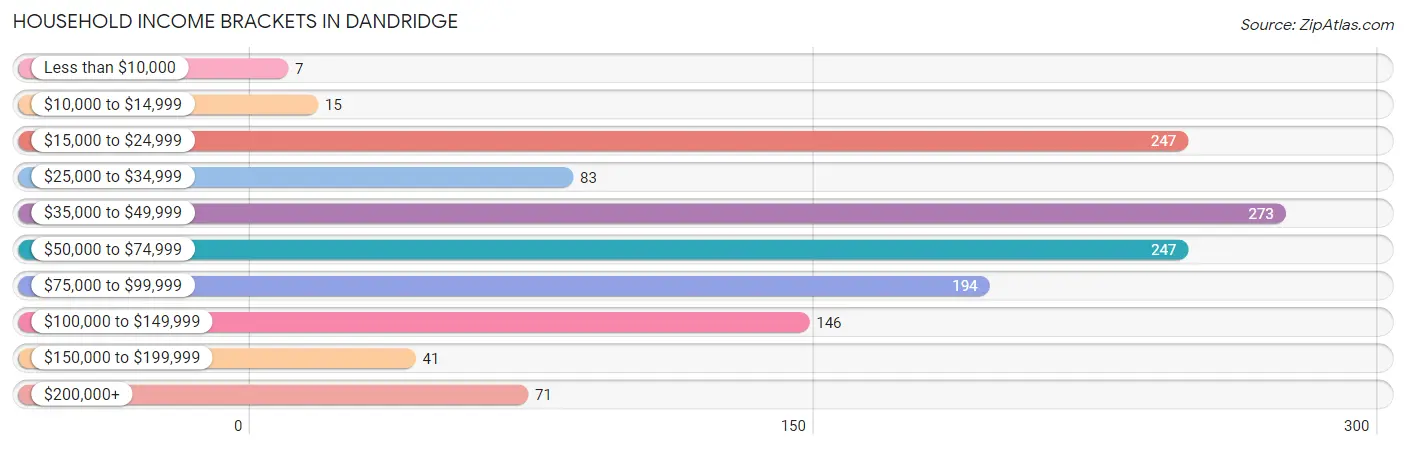
| Income Bracket | # Households | % Households |
| Less than $10,000 | 7 | 0.5% |
| $10,000 to $14,999 | 15 | 1.1% |
| $15,000 to $24,999 | 247 | 18.7% |
| $25,000 to $34,999 | 83 | 6.3% |
| $35,000 to $49,999 | 273 | 20.6% |
| $50,000 to $74,999 | 247 | 18.7% |
| $75,000 to $99,999 | 194 | 14.7% |
| $100,000 to $149,999 | 146 | 11.0% |
| $150,000 to $199,999 | 41 | 3.1% |
| $200,000+ | 71 | 5.4% |
Household Income by Householder Age in Dandridge
The median household income in Dandridge is $53,422, with the highest median household income of $78,933 found in the 45 to 64 years age bracket for the primary householder. A total of 463 households (35.0%) fall into this category. Meanwhile, the 65+ years age bracket for the primary householder has the lowest median household income of $36,838, with 563 households (42.5%) in this group.
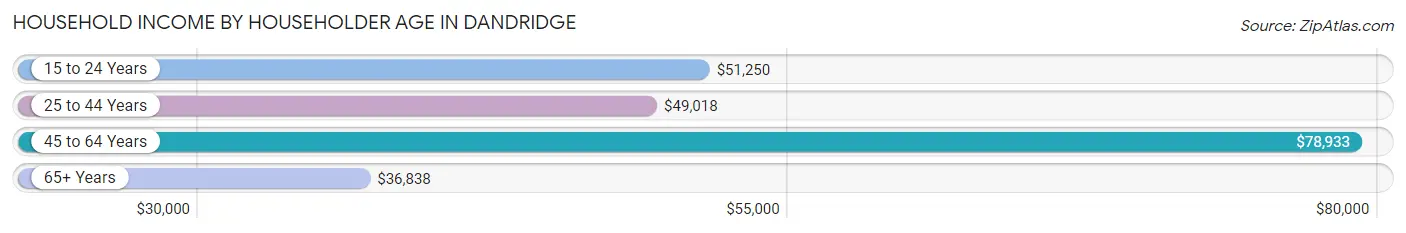
| Income Bracket | # Households | Median Income |
| 15 to 24 Years | 7 (0.5%) | $51,250 |
| 25 to 44 Years | 290 (21.9%) | $49,018 |
| 45 to 64 Years | 463 (35.0%) | $78,933 |
| 65+ Years | 563 (42.5%) | $36,838 |
| Total | 1,323 (100.0%) | $53,422 |
Poverty in Dandridge
Income Below Poverty by Sex and Age in Dandridge
With 7.1% poverty level for males and 7.6% for females among the residents of Dandridge, 16 and 17 year old males and 12 to 14 year old females are the most vulnerable to poverty, with 16 males (21.9%) and 16 females (69.6%) in their respective age groups living below the poverty level.
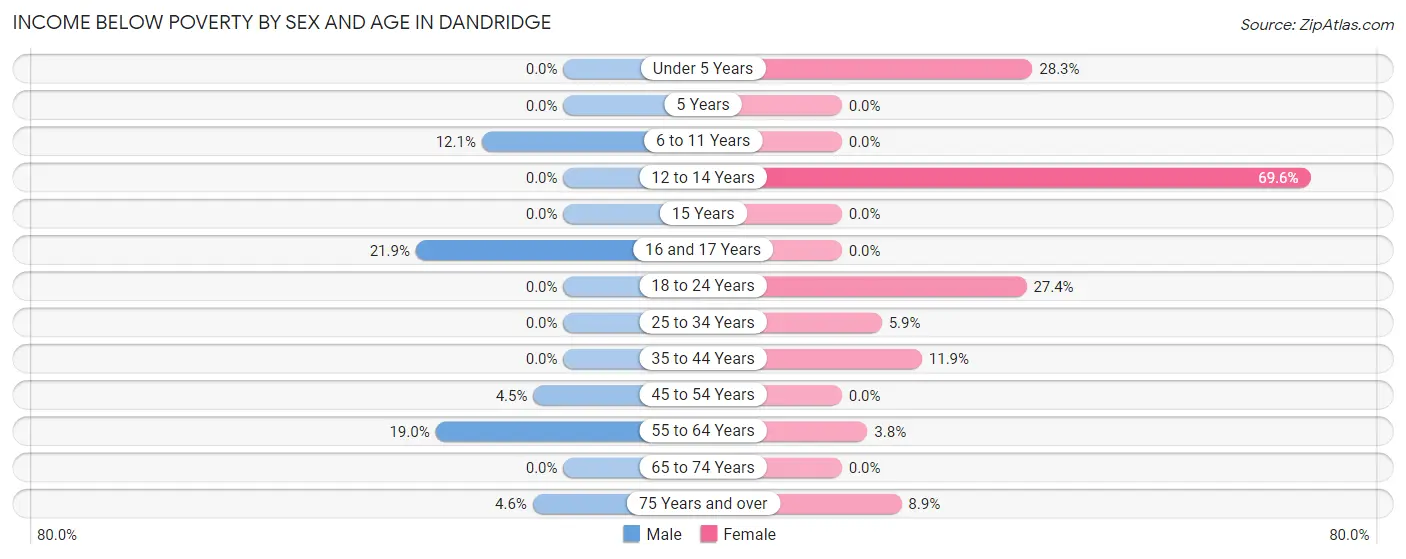
| Age Bracket | Male | Female |
| Under 5 Years | 0 (0.0%) | 15 (28.3%) |
| 5 Years | 0 (0.0%) | 0 (0.0%) |
| 6 to 11 Years | 8 (12.1%) | 0 (0.0%) |
| 12 to 14 Years | 0 (0.0%) | 16 (69.6%) |
| 15 Years | 0 (0.0%) | 0 (0.0%) |
| 16 and 17 Years | 16 (21.9%) | 0 (0.0%) |
| 18 to 24 Years | 0 (0.0%) | 17 (27.4%) |
| 25 to 34 Years | 0 (0.0%) | 7 (5.9%) |
| 35 to 44 Years | 0 (0.0%) | 27 (11.9%) |
| 45 to 54 Years | 5 (4.5%) | 0 (0.0%) |
| 55 to 64 Years | 60 (19.0%) | 7 (3.8%) |
| 65 to 74 Years | 0 (0.0%) | 0 (0.0%) |
| 75 Years and over | 13 (4.5%) | 17 (8.8%) |
| Total | 102 (7.1%) | 106 (7.6%) |
Income Above Poverty by Sex and Age in Dandridge
According to the poverty statistics in Dandridge, males aged under 5 years and females aged 5 years are the age groups that are most secure financially, with 100.0% of males and 100.0% of females in these age groups living above the poverty line.
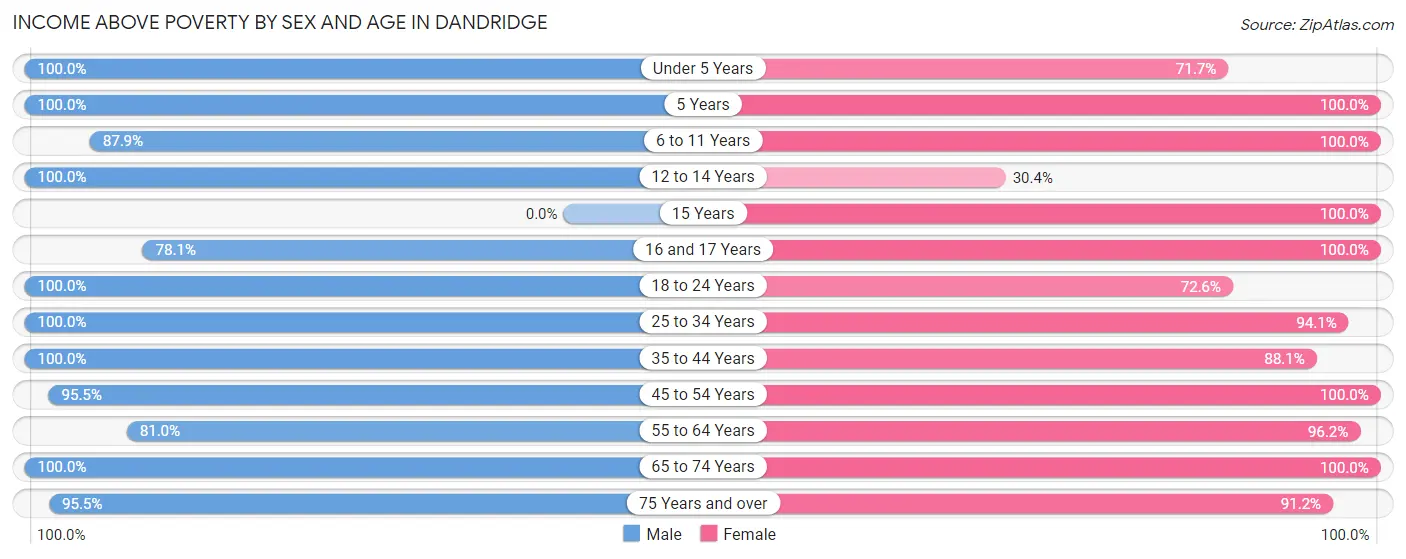
| Age Bracket | Male | Female |
| Under 5 Years | 57 (100.0%) | 38 (71.7%) |
| 5 Years | 5 (100.0%) | 8 (100.0%) |
| 6 to 11 Years | 58 (87.9%) | 91 (100.0%) |
| 12 to 14 Years | 24 (100.0%) | 7 (30.4%) |
| 15 Years | 0 (0.0%) | 7 (100.0%) |
| 16 and 17 Years | 57 (78.1%) | 1 (100.0%) |
| 18 to 24 Years | 129 (100.0%) | 45 (72.6%) |
| 25 to 34 Years | 129 (100.0%) | 111 (94.1%) |
| 35 to 44 Years | 132 (100.0%) | 200 (88.1%) |
| 45 to 54 Years | 107 (95.5%) | 253 (100.0%) |
| 55 to 64 Years | 256 (81.0%) | 177 (96.2%) |
| 65 to 74 Years | 101 (100.0%) | 181 (100.0%) |
| 75 Years and over | 273 (95.5%) | 175 (91.1%) |
| Total | 1,328 (92.9%) | 1,294 (92.4%) |
Income Below Poverty Among Married-Couple Families in Dandridge
The poverty statistics for married-couple families in Dandridge show that 2.2% or 15 of the total 696 families live below the poverty line. Families with 1 or 2 children have the highest poverty rate of 2.6%, comprising of 4 families. On the other hand, families with 3 or 4 children have the lowest poverty rate of 0.0%, which includes 0 families.
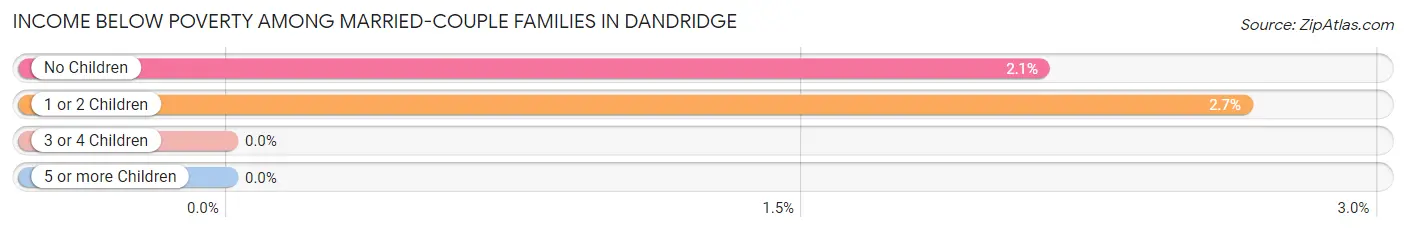
| Children | Above Poverty | Below Poverty |
| No Children | 509 (97.9%) | 11 (2.1%) |
| 1 or 2 Children | 147 (97.4%) | 4 (2.6%) |
| 3 or 4 Children | 20 (100.0%) | 0 (0.0%) |
| 5 or more Children | 5 (100.0%) | 0 (0.0%) |
| Total | 681 (97.8%) | 15 (2.2%) |
Income Below Poverty Among Single-Parent Households in Dandridge
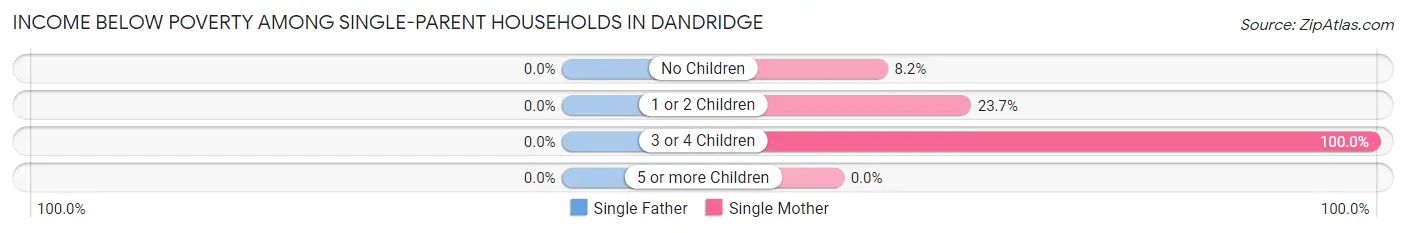
| Children | Single Father | Single Mother |
| No Children | 0 (0.0%) | 4 (8.2%) |
| 1 or 2 Children | 0 (0.0%) | 9 (23.7%) |
| 3 or 4 Children | 0 (0.0%) | 14 (100.0%) |
| 5 or more Children | 0 (0.0%) | 0 (0.0%) |
| Total | 0 (0.0%) | 27 (26.7%) |
Income Below Poverty Among Married-Couple vs Single-Parent Households in Dandridge
The poverty data for Dandridge shows that 15 of the married-couple family households (2.2%) and 27 of the single-parent households (21.6%) are living below the poverty level. Within the married-couple family households, those with 1 or 2 children have the highest poverty rate, with 4 households (2.6%) falling below the poverty line. Among the single-parent households, those with 3 or 4 children have the highest poverty rate, with 14 household (100.0%) living below poverty.
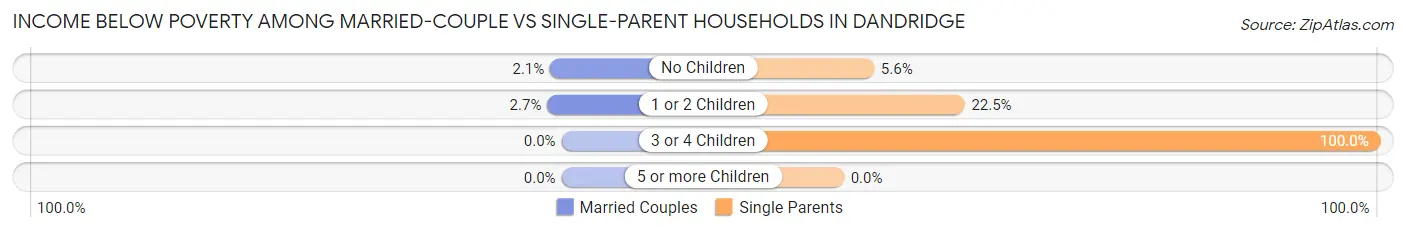
| Children | Married-Couple Families | Single-Parent Households |
| No Children | 11 (2.1%) | 4 (5.6%) |
| 1 or 2 Children | 4 (2.6%) | 9 (22.5%) |
| 3 or 4 Children | 0 (0.0%) | 14 (100.0%) |
| 5 or more Children | 0 (0.0%) | 0 (0.0%) |
| Total | 15 (2.2%) | 27 (21.6%) |
Race in Dandridge
The most populous races in Dandridge are White / Caucasian (3,001 | 89.6%), Some other Race (148 | 4.4%), and Hispanic or Latino (135 | 4.0%).
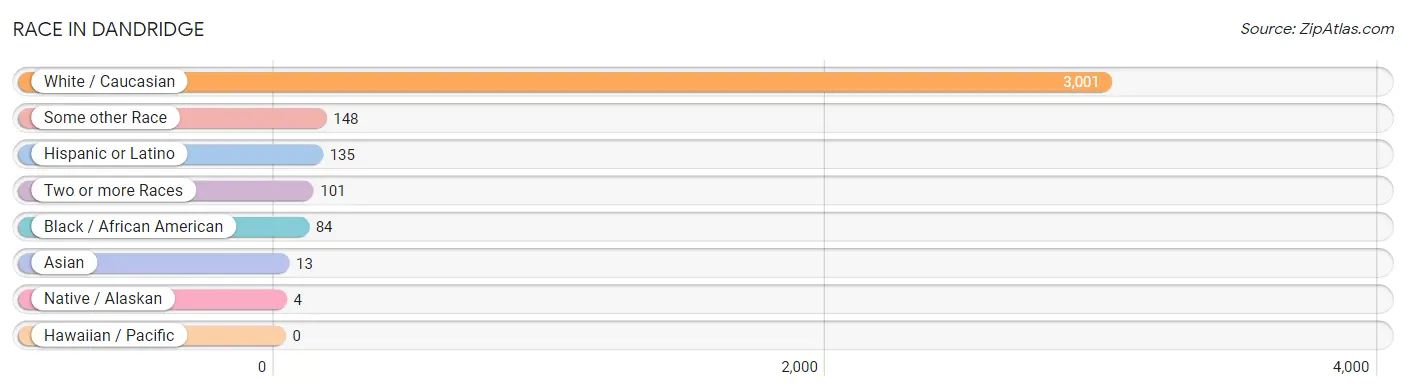
| Race | # Population | % Population |
| Asian | 13 | 0.4% |
| Black / African American | 84 | 2.5% |
| Hawaiian / Pacific | 0 | 0.0% |
| Hispanic or Latino | 135 | 4.0% |
| Native / Alaskan | 4 | 0.1% |
| White / Caucasian | 3,001 | 89.6% |
| Two or more Races | 101 | 3.0% |
| Some other Race | 148 | 4.4% |
| Total | 3,351 | 100.0% |
Ancestry in Dandridge
The most populous ancestries reported in Dandridge are American (585 | 17.5%), English (554 | 16.5%), Irish (331 | 9.9%), German (277 | 8.3%), and French (202 | 6.0%), together accounting for 58.2% of all Dandridge residents.
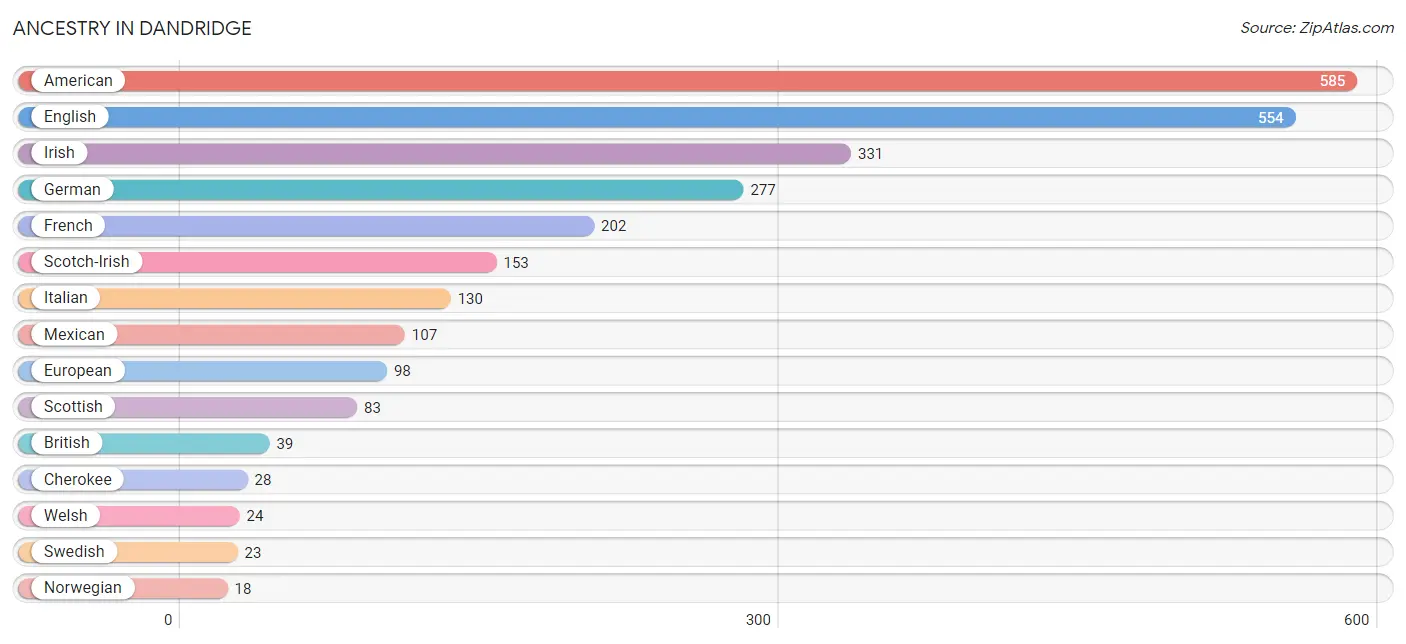
| Ancestry | # Population | % Population |
| American | 585 | 17.5% |
| Austrian | 3 | 0.1% |
| Belgian | 3 | 0.1% |
| Blackfeet | 6 | 0.2% |
| British | 39 | 1.2% |
| Central American | 10 | 0.3% |
| Cherokee | 28 | 0.8% |
| Danish | 6 | 0.2% |
| Dutch | 17 | 0.5% |
| English | 554 | 16.5% |
| European | 98 | 2.9% |
| French | 202 | 6.0% |
| French Canadian | 5 | 0.2% |
| German | 277 | 8.3% |
| Hungarian | 6 | 0.2% |
| Irish | 331 | 9.9% |
| Italian | 130 | 3.9% |
| Liberian | 6 | 0.2% |
| Mexican | 107 | 3.2% |
| Norwegian | 18 | 0.5% |
| Polish | 16 | 0.5% |
| Puerto Rican | 18 | 0.5% |
| Salvadoran | 10 | 0.3% |
| Scandinavian | 15 | 0.4% |
| Scotch-Irish | 153 | 4.6% |
| Scottish | 83 | 2.5% |
| Subsaharan African | 6 | 0.2% |
| Swedish | 23 | 0.7% |
| Swiss | 7 | 0.2% |
| Thai | 13 | 0.4% |
| Welsh | 24 | 0.7% | View All 31 Rows |
Immigrants in Dandridge
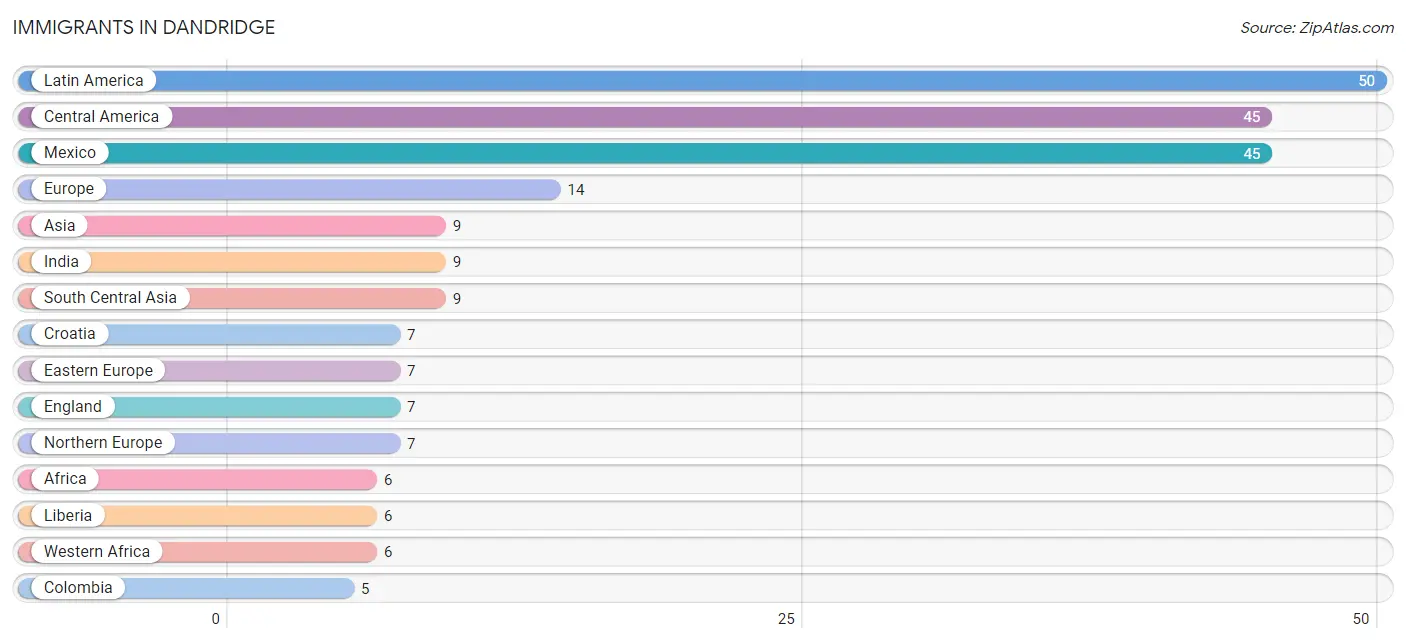
The most numerous immigrant groups reported in Dandridge came from Latin America (50 | 1.5%), Central America (45 | 1.3%), Mexico (45 | 1.3%), Europe (14 | 0.4%), and Asia (9 | 0.3%), together accounting for 4.9% of all Dandridge residents.
| Immigration Origin | # Population | % Population |
| Africa | 6 | 0.2% |
| Asia | 9 | 0.3% |
| Central America | 45 | 1.3% |
| Colombia | 5 | 0.2% |
| Croatia | 7 | 0.2% |
| Eastern Europe | 7 | 0.2% |
| England | 7 | 0.2% |
| Europe | 14 | 0.4% |
| India | 9 | 0.3% |
| Latin America | 50 | 1.5% |
| Liberia | 6 | 0.2% |
| Mexico | 45 | 1.3% |
| Northern Europe | 7 | 0.2% |
| South America | 5 | 0.2% |
| South Central Asia | 9 | 0.3% |
| Western Africa | 6 | 0.2% | View All 16 Rows |
Sex and Age in Dandridge
Sex and Age in Dandridge
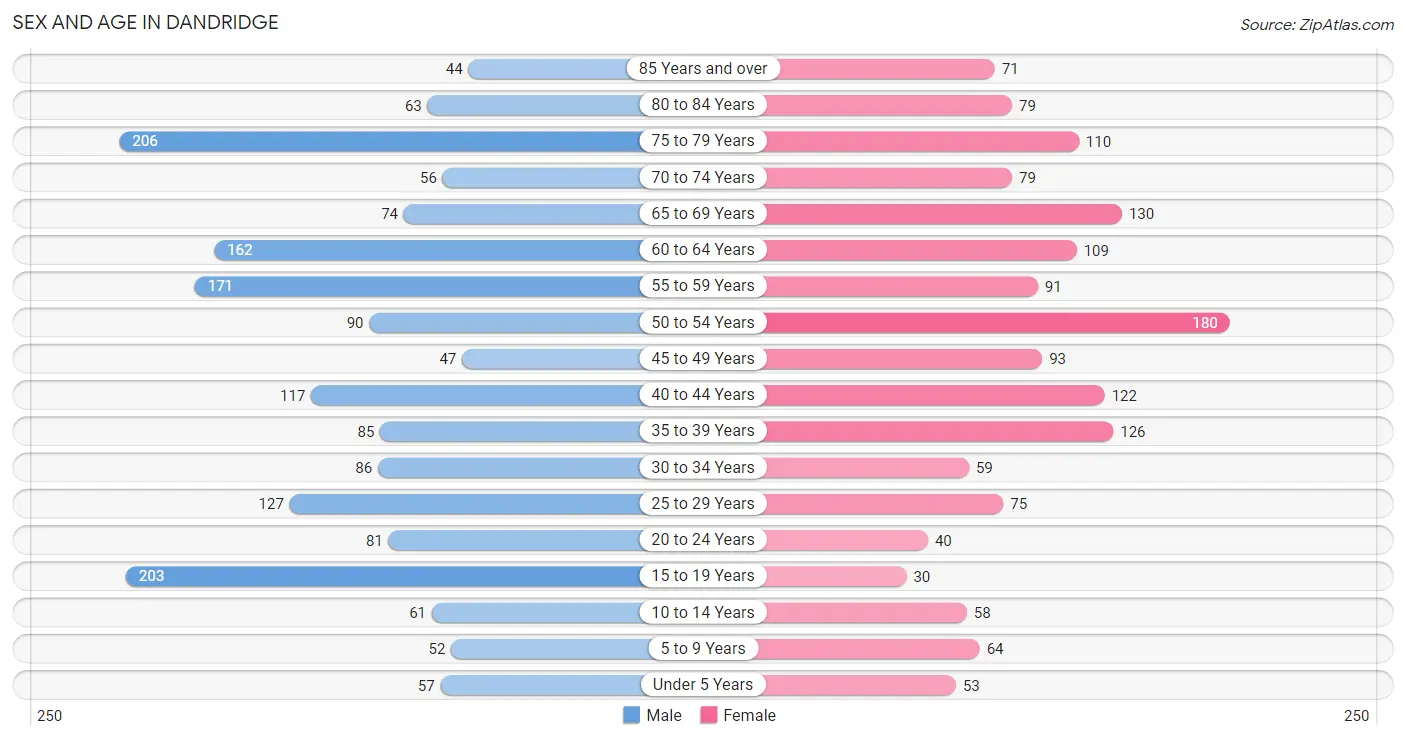
The most populous age groups in Dandridge are 75 to 79 Years (206 | 11.6%) for men and 50 to 54 Years (180 | 11.5%) for women.
| Age Bracket | Male | Female |
| Under 5 Years | 57 (3.2%) | 53 (3.4%) |
| 5 to 9 Years | 52 (2.9%) | 64 (4.1%) |
| 10 to 14 Years | 61 (3.4%) | 58 (3.7%) |
| 15 to 19 Years | 203 (11.4%) | 30 (1.9%) |
| 20 to 24 Years | 81 (4.5%) | 40 (2.5%) |
| 25 to 29 Years | 127 (7.1%) | 75 (4.8%) |
| 30 to 34 Years | 86 (4.8%) | 59 (3.8%) |
| 35 to 39 Years | 85 (4.8%) | 126 (8.0%) |
| 40 to 44 Years | 117 (6.6%) | 122 (7.8%) |
| 45 to 49 Years | 47 (2.6%) | 93 (5.9%) |
| 50 to 54 Years | 90 (5.1%) | 180 (11.5%) |
| 55 to 59 Years | 171 (9.6%) | 91 (5.8%) |
| 60 to 64 Years | 162 (9.1%) | 109 (7.0%) |
| 65 to 69 Years | 74 (4.2%) | 130 (8.3%) |
| 70 to 74 Years | 56 (3.1%) | 79 (5.0%) |
| 75 to 79 Years | 206 (11.6%) | 110 (7.0%) |
| 80 to 84 Years | 63 (3.5%) | 79 (5.0%) |
| 85 Years and over | 44 (2.5%) | 71 (4.5%) |
| Total | 1,782 (100.0%) | 1,569 (100.0%) |
Families and Households in Dandridge
Median Family Size in Dandridge
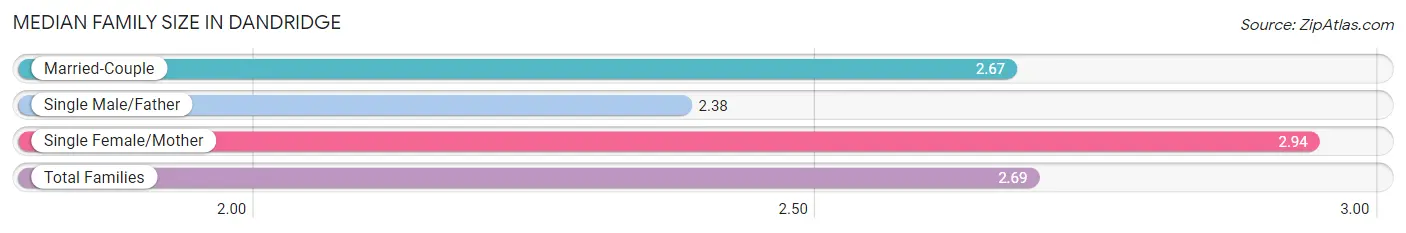
The median family size in Dandridge is 2.69 persons per family, with single female/mother families (101 | 12.3%) accounting for the largest median family size of 2.94 persons per family. On the other hand, single male/father families (24 | 2.9%) represent the smallest median family size with 2.38 persons per family.
| Family Type | # Families | Family Size |
| Married-Couple | 696 (84.8%) | 2.67 |
| Single Male/Father | 24 (2.9%) | 2.38 |
| Single Female/Mother | 101 (12.3%) | 2.94 |
| Total Families | 821 (100.0%) | 2.69 |
Median Household Size in Dandridge
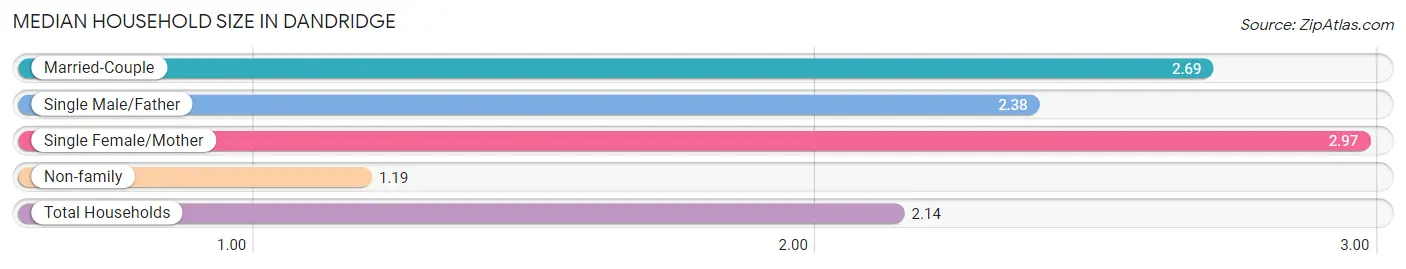
The median household size in Dandridge is 2.14 persons per household, with single female/mother households (101 | 7.6%) accounting for the largest median household size of 2.97 persons per household. non-family households (502 | 37.9%) represent the smallest median household size with 1.19 persons per household.
| Household Type | # Households | Household Size |
| Married-Couple | 696 (52.6%) | 2.69 |
| Single Male/Father | 24 (1.8%) | 2.38 |
| Single Female/Mother | 101 (7.6%) | 2.97 |
| Non-family | 502 (37.9%) | 1.19 |
| Total Households | 1,323 (100.0%) | 2.14 |
Household Size by Marriage Status in Dandridge
Out of a total of 1,323 households in Dandridge, 821 (62.1%) are family households, while 502 (37.9%) are nonfamily households. The most numerous type of family households are 2-person households, comprising 536, and the most common type of nonfamily households are 1-person households, comprising 443.
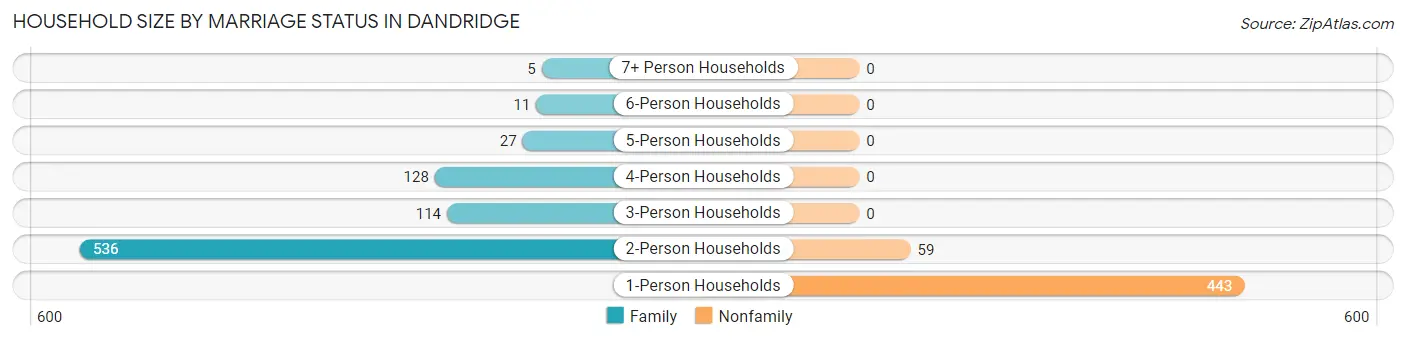
| Household Size | Family Households | Nonfamily Households |
| 1-Person Households | - | 443 (33.5%) |
| 2-Person Households | 536 (40.5%) | 59 (4.5%) |
| 3-Person Households | 114 (8.6%) | 0 (0.0%) |
| 4-Person Households | 128 (9.7%) | 0 (0.0%) |
| 5-Person Households | 27 (2.0%) | 0 (0.0%) |
| 6-Person Households | 11 (0.8%) | 0 (0.0%) |
| 7+ Person Households | 5 (0.4%) | 0 (0.0%) |
| Total | 821 (62.1%) | 502 (37.9%) |
Female Fertility in Dandridge
Fertility by Age in Dandridge
Average fertility rate in Dandridge is 65.0 births per 1,000 women. Women in the age bracket of 20 to 34 years have the highest fertility rate with 184.0 births per 1,000 women. Women in the age bracket of 20 to 34 years acount for 84.2% of all women with births.
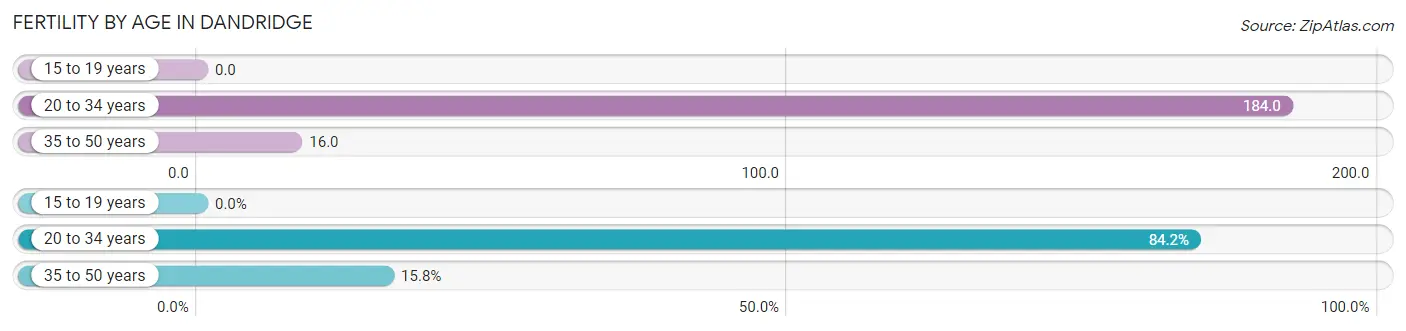
| Age Bracket | Women with Births | Births / 1,000 Women |
| 15 to 19 years | 0 (0.0%) | 0.0 |
| 20 to 34 years | 32 (84.2%) | 184.0 |
| 35 to 50 years | 6 (15.8%) | 16.0 |
| Total | 38 (100.0%) | 65.0 |
Fertility by Age by Marriage Status in Dandridge
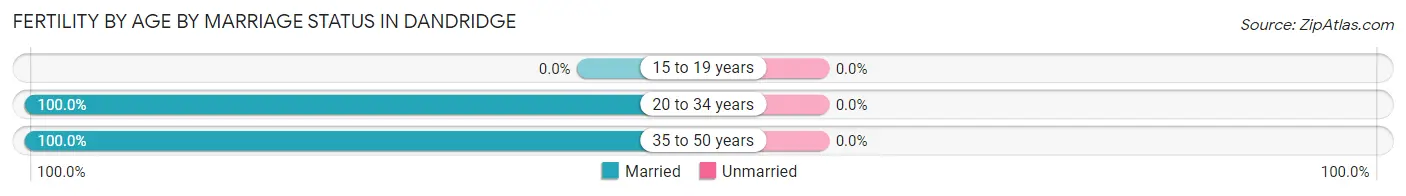
| Age Bracket | Married | Unmarried |
| 15 to 19 years | 0 (0.0%) | 0 (0.0%) |
| 20 to 34 years | 32 (100.0%) | 0 (0.0%) |
| 35 to 50 years | 6 (100.0%) | 0 (0.0%) |
| Total | 38 (100.0%) | 0 (0.0%) |
Fertility by Education in Dandridge
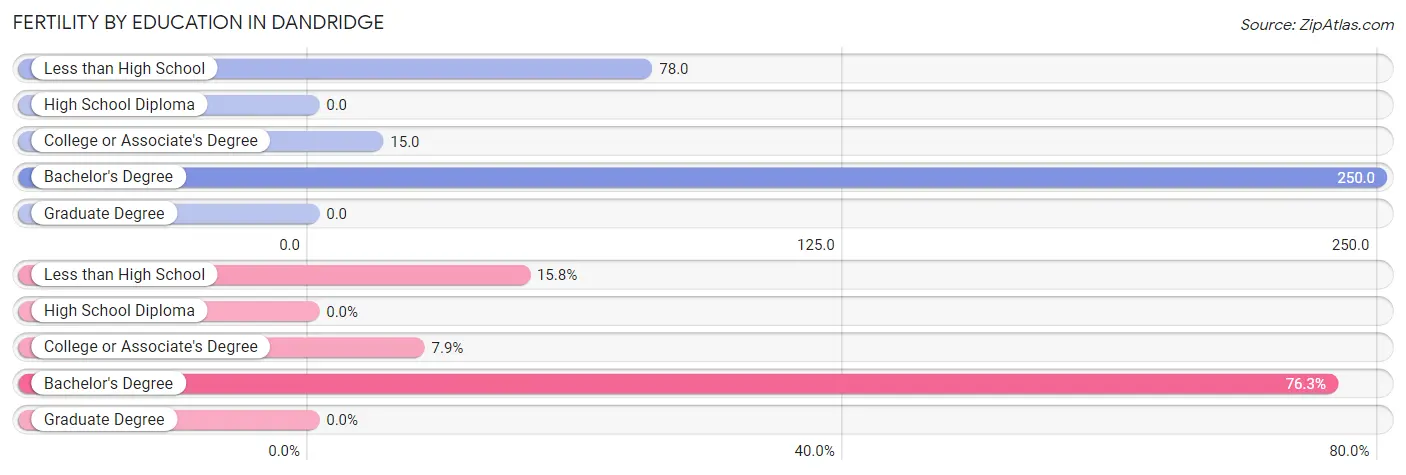
| Educational Attainment | Women with Births | Births / 1,000 Women |
| Less than High School | 6 (15.8%) | 78.0 |
| High School Diploma | 0 (0.0%) | 0.0 |
| College or Associate's Degree | 3 (7.9%) | 15.0 |
| Bachelor's Degree | 29 (76.3%) | 250.0 |
| Graduate Degree | 0 (0.0%) | 0.0 |
| Total | 38 (100.0%) | 65.0 |
Fertility by Education by Marriage Status in Dandridge
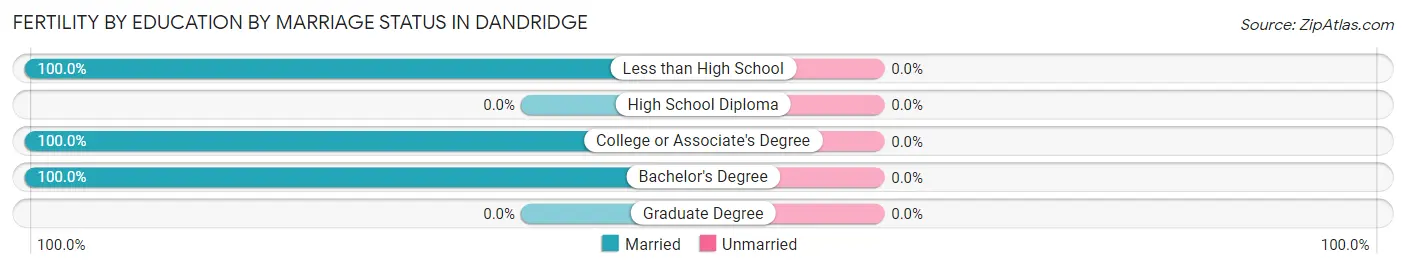
| Educational Attainment | Married | Unmarried |
| Less than High School | 6 (100.0%) | 0 (0.0%) |
| High School Diploma | 0 (0.0%) | 0 (0.0%) |
| College or Associate's Degree | 3 (100.0%) | 0 (0.0%) |
| Bachelor's Degree | 29 (100.0%) | 0 (0.0%) |
| Graduate Degree | 0 (0.0%) | 0 (0.0%) |
| Total | 38 (100.0%) | 0 (0.0%) |
Employment Characteristics in Dandridge
Employment by Class of Employer in Dandridge
Among the 1,248 employed individuals in Dandridge, private company employees (720 | 57.7%), self-employed (not incorporated) (150 | 12.0%), and not-for-profit organizations (103 | 8.3%) make up the most common classes of employment.
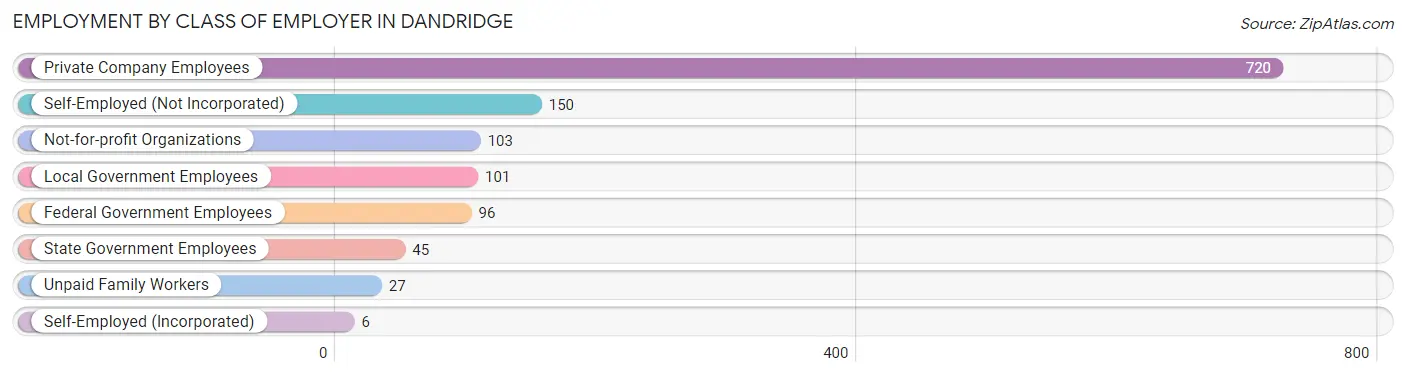
| Employer Class | # Employees | % Employees |
| Private Company Employees | 720 | 57.7% |
| Self-Employed (Incorporated) | 6 | 0.5% |
| Self-Employed (Not Incorporated) | 150 | 12.0% |
| Not-for-profit Organizations | 103 | 8.3% |
| Local Government Employees | 101 | 8.1% |
| State Government Employees | 45 | 3.6% |
| Federal Government Employees | 96 | 7.7% |
| Unpaid Family Workers | 27 | 2.2% |
| Total | 1,248 | 100.0% |
Employment Status by Age in Dandridge
According to the labor force statistics for Dandridge, out of the total population over 16 years of age (2,987), 45.8% or 1,368 individuals are in the labor force, with 7.0% or 96 of them unemployed. The age group with the highest labor force participation rate is 55 to 59 years, with 80.5% or 211 individuals in the labor force. Within the labor force, the 55 to 59 years age range has the highest percentage of unemployed individuals, with 16.1% or 34 of them being unemployed.
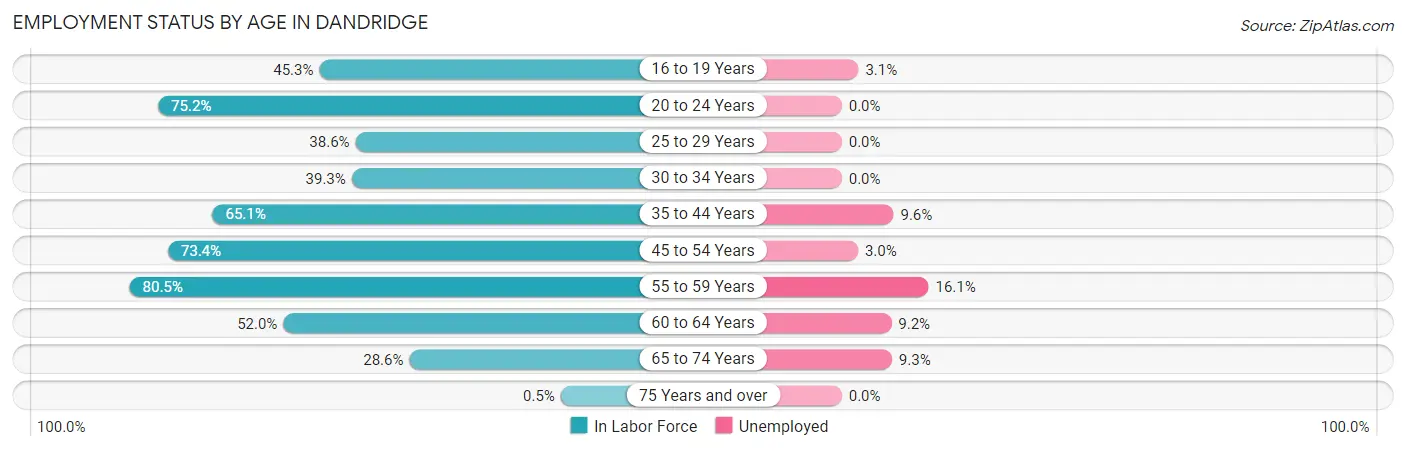
| Age Bracket | In Labor Force | Unemployed |
| 16 to 19 Years | 97 (45.3%) | 3 (3.1%) |
| 20 to 24 Years | 91 (75.2%) | 0 (0.0%) |
| 25 to 29 Years | 78 (38.6%) | 0 (0.0%) |
| 30 to 34 Years | 57 (39.3%) | 0 (0.0%) |
| 35 to 44 Years | 293 (65.1%) | 28 (9.6%) |
| 45 to 54 Years | 301 (73.4%) | 9 (3.0%) |
| 55 to 59 Years | 211 (80.5%) | 34 (16.1%) |
| 60 to 64 Years | 141 (52.0%) | 13 (9.2%) |
| 65 to 74 Years | 97 (28.6%) | 9 (9.3%) |
| 75 Years and over | 3 (0.5%) | 0 (0.0%) |
| Total | 1,368 (45.8%) | 96 (7.0%) |
Employment Status by Educational Attainment in Dandridge
According to labor force statistics for Dandridge, 62.1% of individuals (1,081) out of the total population between 25 and 64 years of age (1,740) are in the labor force, with 7.8% or 84 of them being unemployed. The group with the highest labor force participation rate are those with the educational attainment of bachelor's degree or higher, with 72.1% or 199 individuals in the labor force. Within the labor force, individuals with high school diploma education have the highest percentage of unemployment, with 25.4% or 54 of them being unemployed.
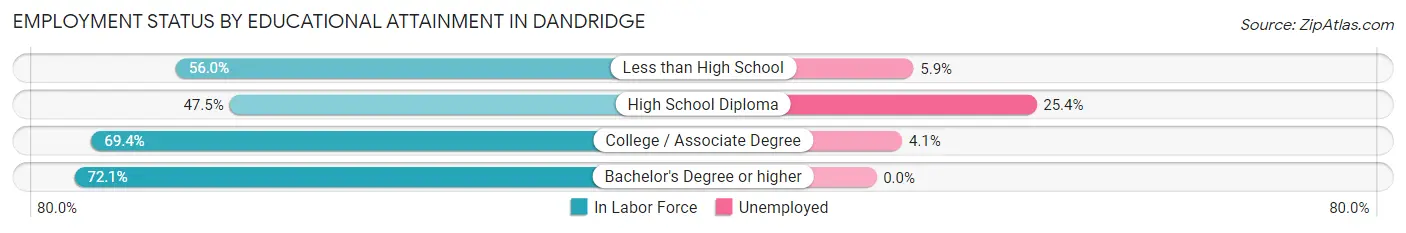
| Educational Attainment | In Labor Force | Unemployed |
| Less than High School | 153 (56.0%) | 16 (5.9%) |
| High School Diploma | 213 (47.5%) | 114 (25.4%) |
| College / Associate Degree | 516 (69.4%) | 30 (4.1%) |
| Bachelor's Degree or higher | 199 (72.1%) | 0 (0.0%) |
| Total | 1,081 (62.1%) | 136 (7.8%) |
Employment Occupations by Sex in Dandridge
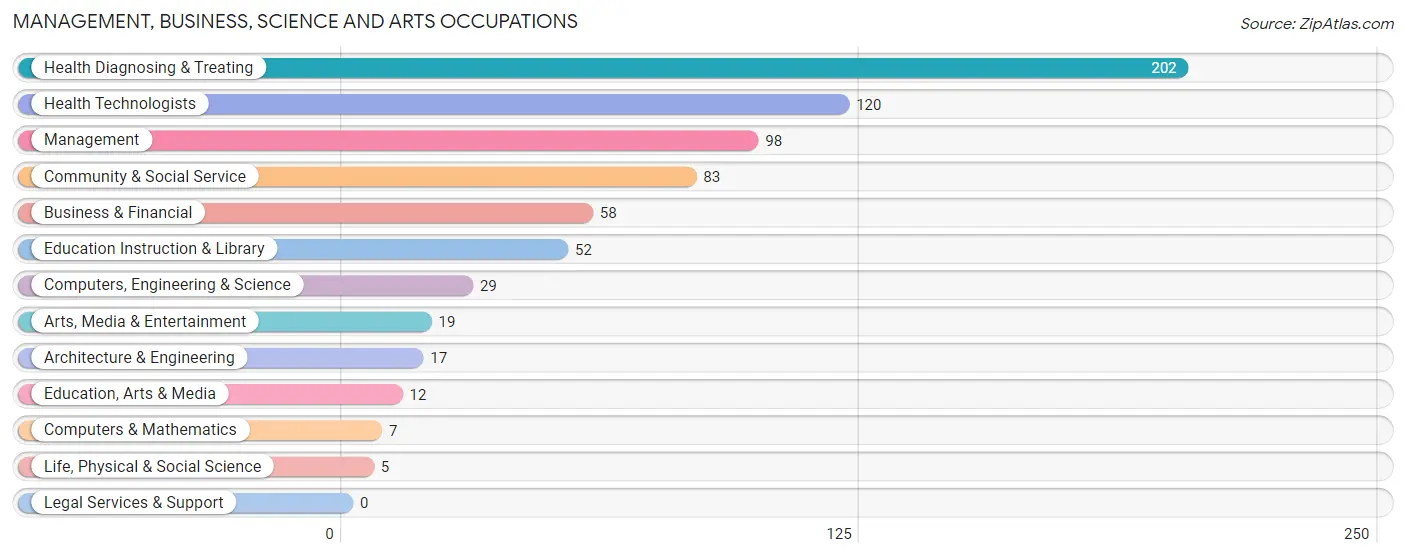
Management, Business, Science and Arts Occupations
The most common Management, Business, Science and Arts occupations in Dandridge are Health Diagnosing & Treating (202 | 15.9%), Health Technologists (120 | 9.4%), Management (98 | 7.7%), Community & Social Service (83 | 6.5%), and Business & Financial (58 | 4.6%).
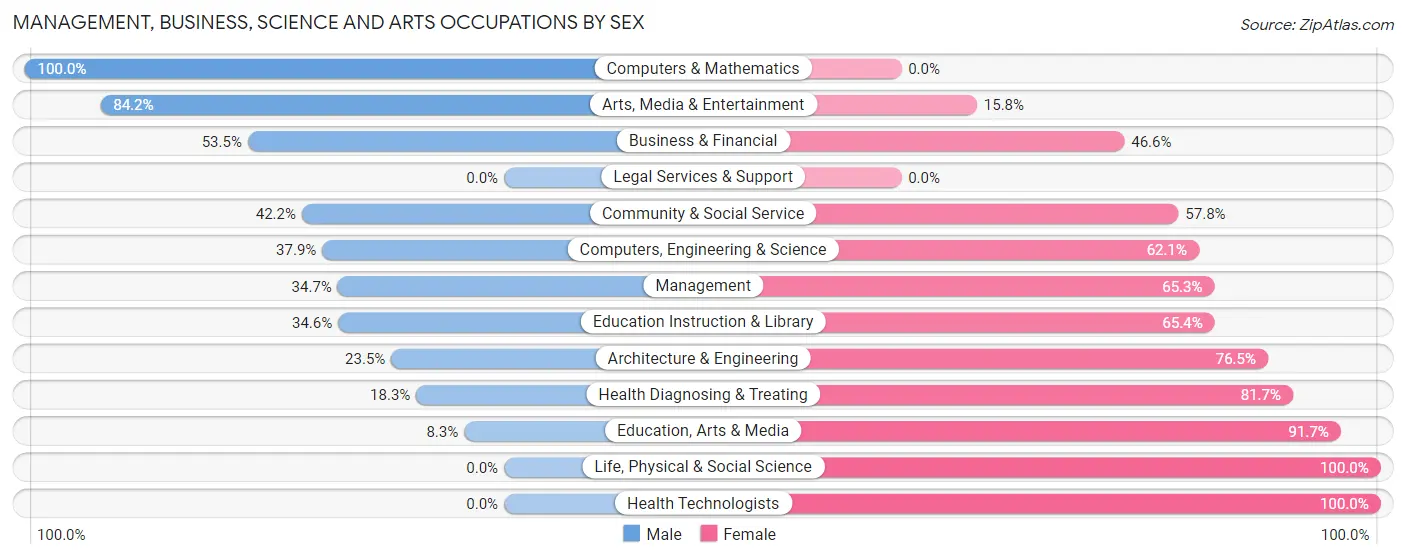
Management, Business, Science and Arts Occupations by Sex
Within the Management, Business, Science and Arts occupations in Dandridge, the most male-oriented occupations are Computers & Mathematics (100.0%), Arts, Media & Entertainment (84.2%), and Business & Financial (53.4%), while the most female-oriented occupations are Life, Physical & Social Science (100.0%), Health Technologists (100.0%), and Education, Arts & Media (91.7%).
| Occupation | Male | Female |
| Management | 34 (34.7%) | 64 (65.3%) |
| Business & Financial | 31 (53.4%) | 27 (46.6%) |
| Computers, Engineering & Science | 11 (37.9%) | 18 (62.1%) |
| Computers & Mathematics | 7 (100.0%) | 0 (0.0%) |
| Architecture & Engineering | 4 (23.5%) | 13 (76.5%) |
| Life, Physical & Social Science | 0 (0.0%) | 5 (100.0%) |
| Community & Social Service | 35 (42.2%) | 48 (57.8%) |
| Education, Arts & Media | 1 (8.3%) | 11 (91.7%) |
| Legal Services & Support | 0 (0.0%) | 0 (0.0%) |
| Education Instruction & Library | 18 (34.6%) | 34 (65.4%) |
| Arts, Media & Entertainment | 16 (84.2%) | 3 (15.8%) |
| Health Diagnosing & Treating | 37 (18.3%) | 165 (81.7%) |
| Health Technologists | 0 (0.0%) | 120 (100.0%) |
| Total (Category) | 148 (31.5%) | 322 (68.5%) |
| Total (Overall) | 662 (52.0%) | 611 (48.0%) |
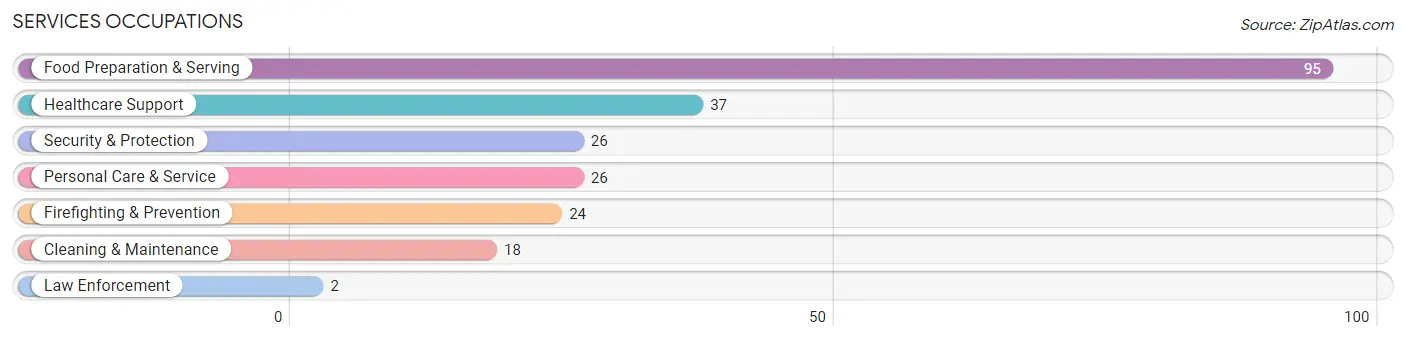
Services Occupations
The most common Services occupations in Dandridge are Food Preparation & Serving (95 | 7.5%), Healthcare Support (37 | 2.9%), Security & Protection (26 | 2.0%), Personal Care & Service (26 | 2.0%), and Firefighting & Prevention (24 | 1.9%).
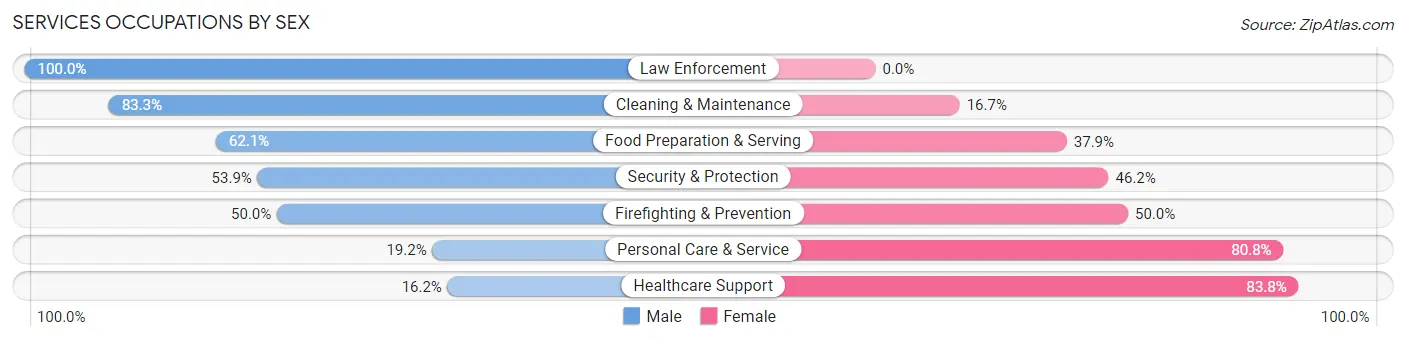
Services Occupations by Sex
Within the Services occupations in Dandridge, the most male-oriented occupations are Law Enforcement (100.0%), Cleaning & Maintenance (83.3%), and Food Preparation & Serving (62.1%), while the most female-oriented occupations are Healthcare Support (83.8%), Personal Care & Service (80.8%), and Firefighting & Prevention (50.0%).
| Occupation | Male | Female |
| Healthcare Support | 6 (16.2%) | 31 (83.8%) |
| Security & Protection | 14 (53.8%) | 12 (46.2%) |
| Firefighting & Prevention | 12 (50.0%) | 12 (50.0%) |
| Law Enforcement | 2 (100.0%) | 0 (0.0%) |
| Food Preparation & Serving | 59 (62.1%) | 36 (37.9%) |
| Cleaning & Maintenance | 15 (83.3%) | 3 (16.7%) |
| Personal Care & Service | 5 (19.2%) | 21 (80.8%) |
| Total (Category) | 99 (49.0%) | 103 (51.0%) |
| Total (Overall) | 662 (52.0%) | 611 (48.0%) |
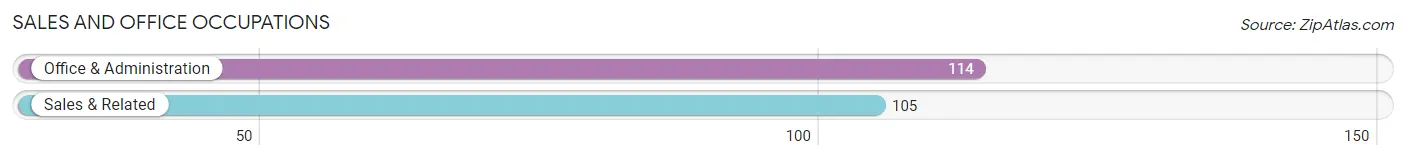
Sales and Office Occupations
The most common Sales and Office occupations in Dandridge are Office & Administration (114 | 9.0%), and Sales & Related (105 | 8.3%).
Sales and Office Occupations by Sex
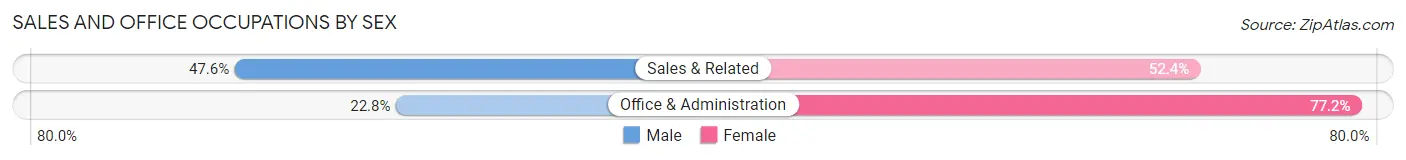
| Occupation | Male | Female |
| Sales & Related | 50 (47.6%) | 55 (52.4%) |
| Office & Administration | 26 (22.8%) | 88 (77.2%) |
| Total (Category) | 76 (34.7%) | 143 (65.3%) |
| Total (Overall) | 662 (52.0%) | 611 (48.0%) |
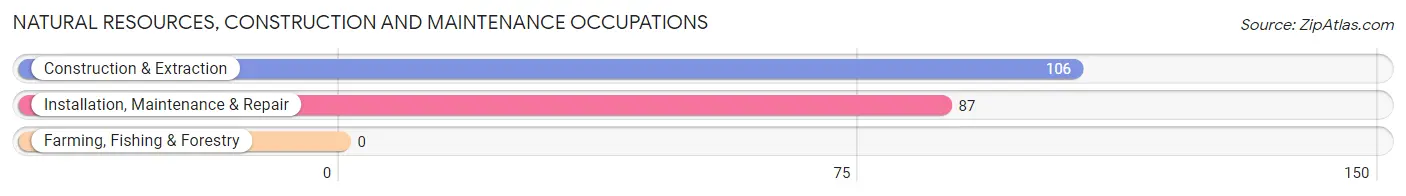
Natural Resources, Construction and Maintenance Occupations
The most common Natural Resources, Construction and Maintenance occupations in Dandridge are Construction & Extraction (106 | 8.3%), and Installation, Maintenance & Repair (87 | 6.8%).
Natural Resources, Construction and Maintenance Occupations by Sex
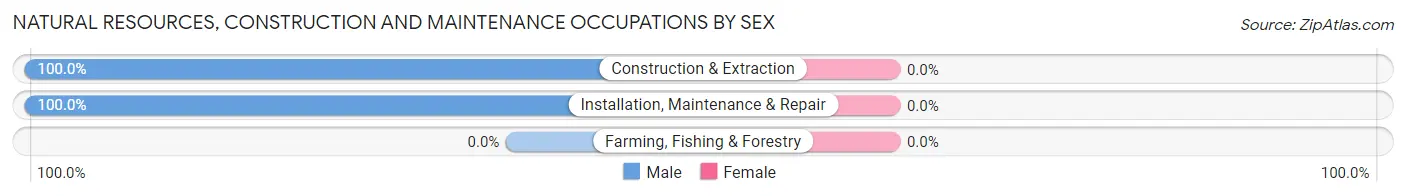
| Occupation | Male | Female |
| Farming, Fishing & Forestry | 0 (0.0%) | 0 (0.0%) |
| Construction & Extraction | 106 (100.0%) | 0 (0.0%) |
| Installation, Maintenance & Repair | 87 (100.0%) | 0 (0.0%) |
| Total (Category) | 193 (100.0%) | 0 (0.0%) |
| Total (Overall) | 662 (52.0%) | 611 (48.0%) |
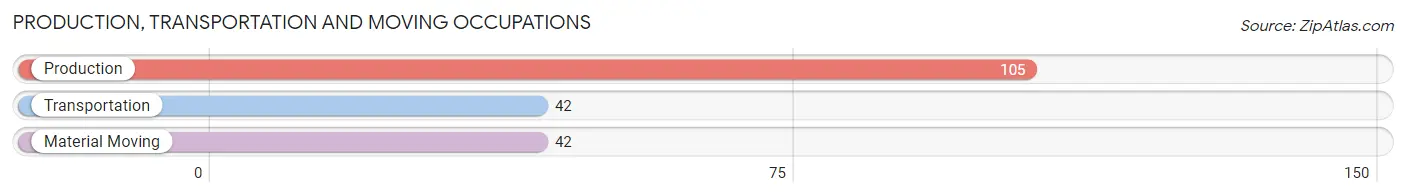
Production, Transportation and Moving Occupations
The most common Production, Transportation and Moving occupations in Dandridge are Production (105 | 8.3%), Transportation (42 | 3.3%), and Material Moving (42 | 3.3%).
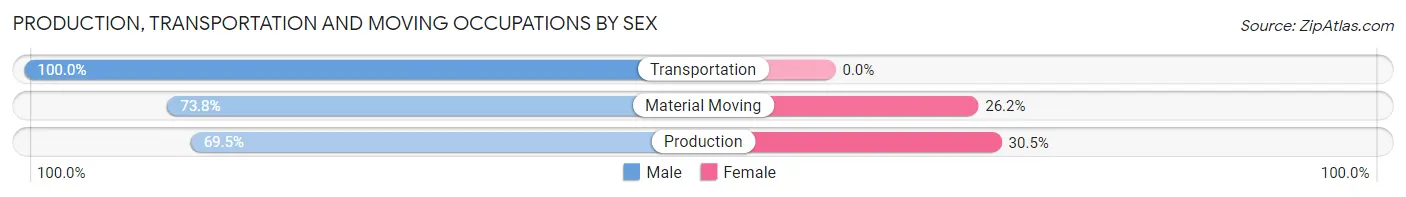
Production, Transportation and Moving Occupations by Sex
| Occupation | Male | Female |
| Production | 73 (69.5%) | 32 (30.5%) |
| Transportation | 42 (100.0%) | 0 (0.0%) |
| Material Moving | 31 (73.8%) | 11 (26.2%) |
| Total (Category) | 146 (77.2%) | 43 (22.8%) |
| Total (Overall) | 662 (52.0%) | 611 (48.0%) |
Employment Industries by Sex in Dandridge
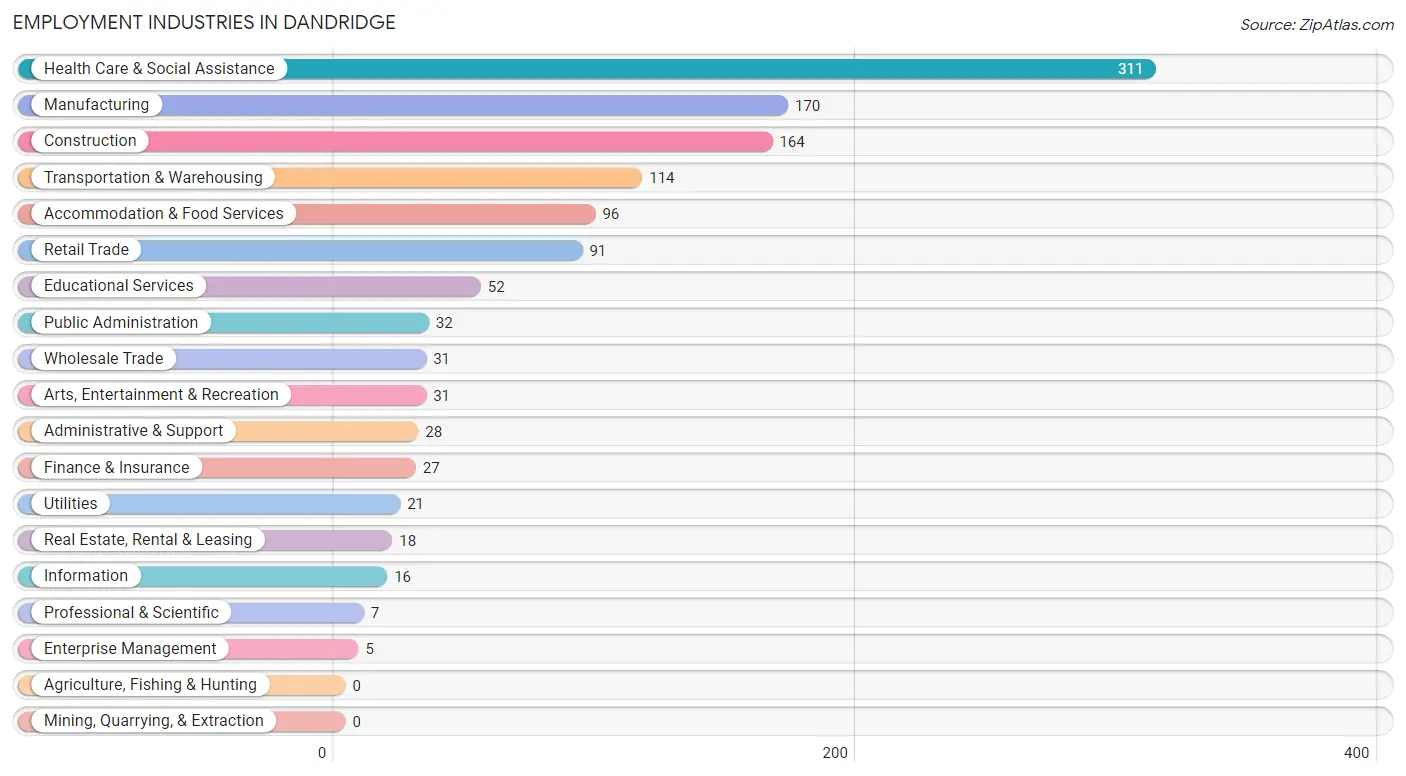
Employment Industries in Dandridge
The major employment industries in Dandridge include Health Care & Social Assistance (311 | 24.4%), Manufacturing (170 | 13.4%), Construction (164 | 12.9%), Transportation & Warehousing (114 | 9.0%), and Accommodation & Food Services (96 | 7.5%).
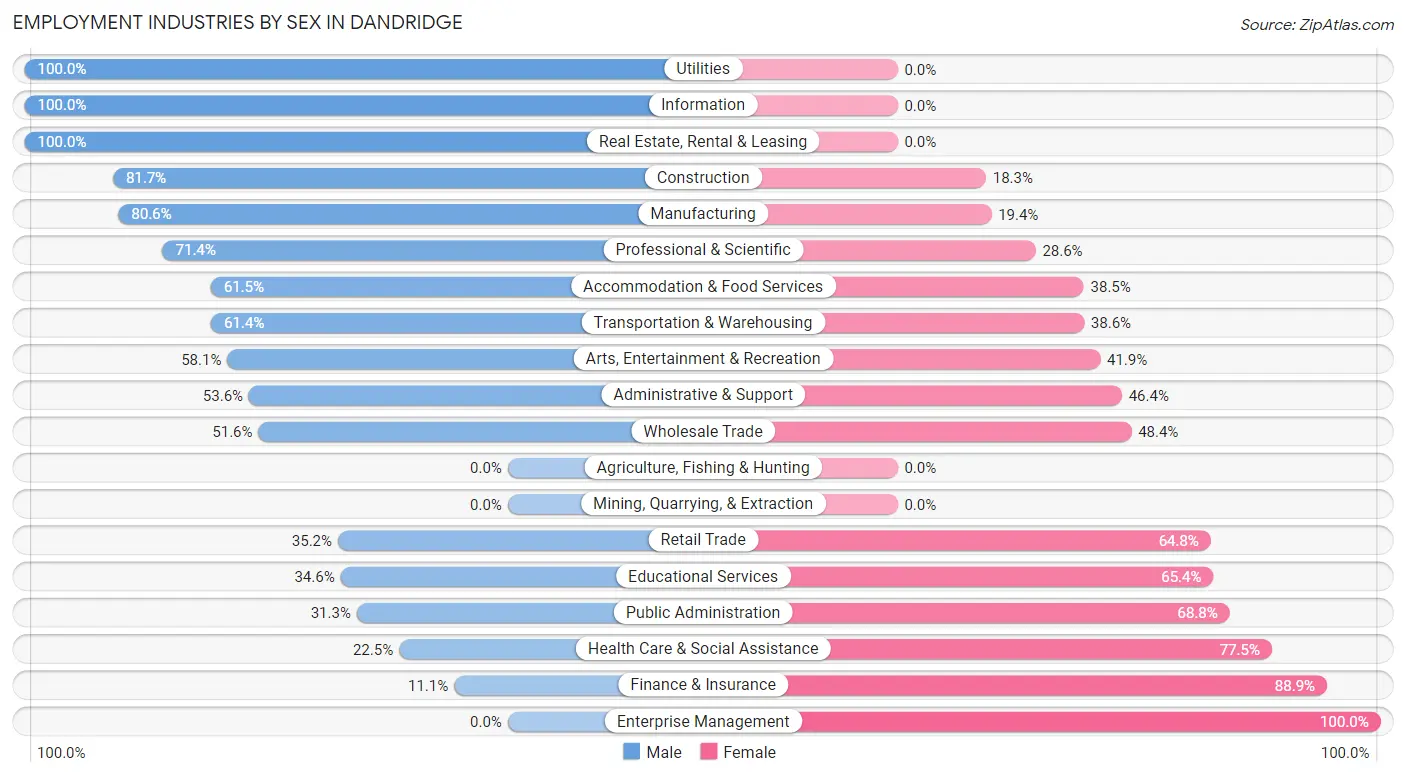
Employment Industries by Sex in Dandridge
The Dandridge industries that see more men than women are Utilities (100.0%), Information (100.0%), and Real Estate, Rental & Leasing (100.0%), whereas the industries that tend to have a higher number of women are Enterprise Management (100.0%), Finance & Insurance (88.9%), and Health Care & Social Assistance (77.5%).
| Industry | Male | Female |
| Agriculture, Fishing & Hunting | 0 (0.0%) | 0 (0.0%) |
| Mining, Quarrying, & Extraction | 0 (0.0%) | 0 (0.0%) |
| Construction | 134 (81.7%) | 30 (18.3%) |
| Manufacturing | 137 (80.6%) | 33 (19.4%) |
| Wholesale Trade | 16 (51.6%) | 15 (48.4%) |
| Retail Trade | 32 (35.2%) | 59 (64.8%) |
| Transportation & Warehousing | 70 (61.4%) | 44 (38.6%) |
| Utilities | 21 (100.0%) | 0 (0.0%) |
| Information | 16 (100.0%) | 0 (0.0%) |
| Finance & Insurance | 3 (11.1%) | 24 (88.9%) |
| Real Estate, Rental & Leasing | 18 (100.0%) | 0 (0.0%) |
| Professional & Scientific | 5 (71.4%) | 2 (28.6%) |
| Enterprise Management | 0 (0.0%) | 5 (100.0%) |
| Administrative & Support | 15 (53.6%) | 13 (46.4%) |
| Educational Services | 18 (34.6%) | 34 (65.4%) |
| Health Care & Social Assistance | 70 (22.5%) | 241 (77.5%) |
| Arts, Entertainment & Recreation | 18 (58.1%) | 13 (41.9%) |
| Accommodation & Food Services | 59 (61.5%) | 37 (38.5%) |
| Public Administration | 10 (31.2%) | 22 (68.8%) |
| Total | 662 (52.0%) | 611 (48.0%) |
Education in Dandridge
School Enrollment in Dandridge
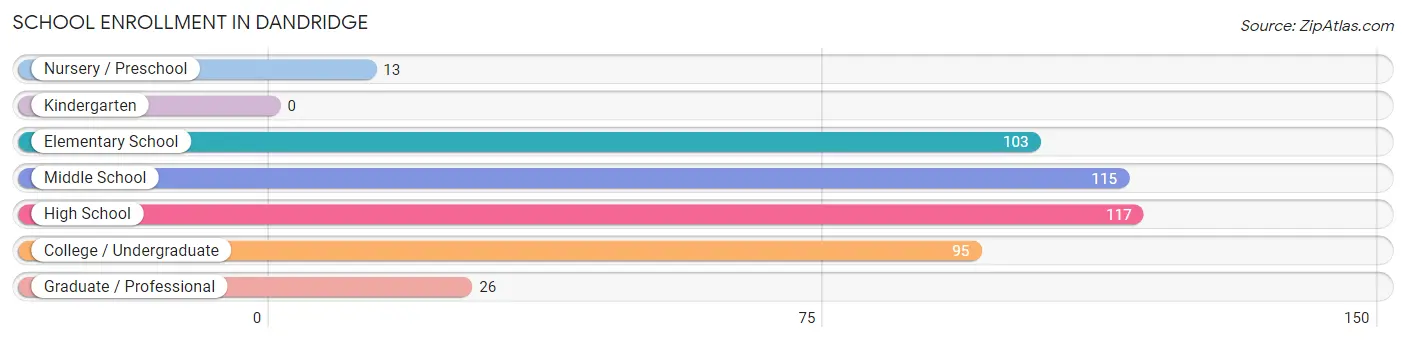
The most common levels of schooling among the 469 students in Dandridge are high school (117 | 24.9%), middle school (115 | 24.5%), and elementary school (103 | 22.0%).
| School Level | # Students | % Students |
| Nursery / Preschool | 13 | 2.8% |
| Kindergarten | 0 | 0.0% |
| Elementary School | 103 | 22.0% |
| Middle School | 115 | 24.5% |
| High School | 117 | 24.9% |
| College / Undergraduate | 95 | 20.3% |
| Graduate / Professional | 26 | 5.5% |
| Total | 469 | 100.0% |
School Enrollment by Age by Funding Source in Dandridge
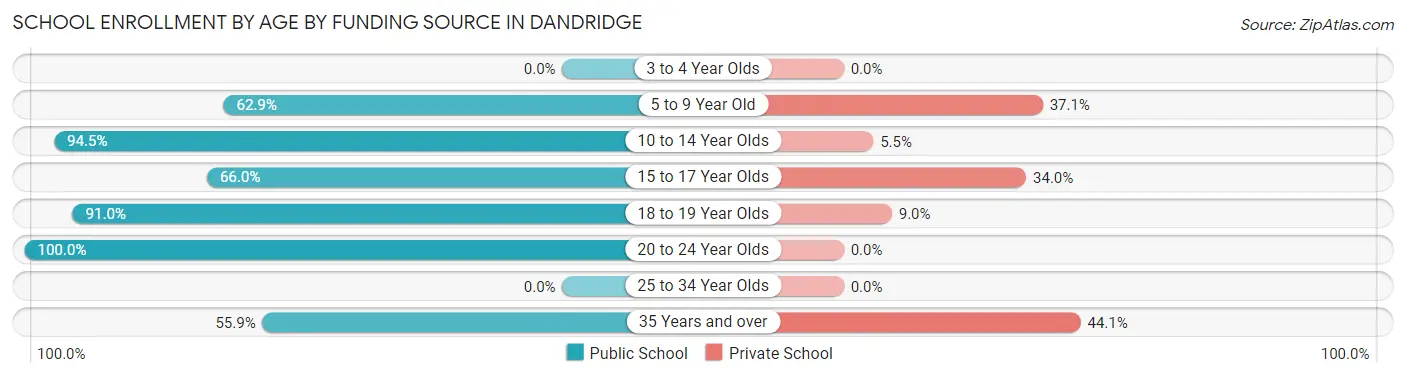
Out of a total of 469 students who are enrolled in schools in Dandridge, 105 (22.4%) attend a private institution, while the remaining 364 (77.6%) are enrolled in public schools. The age group of 35 years and over has the highest likelihood of being enrolled in private schools, with 15 (44.1% in the age bracket) enrolled. Conversely, the age group of 20 to 24 year olds has the lowest likelihood of being enrolled in a private school, with 40 (100.0% in the age bracket) attending a public institution.
| Age Bracket | Public School | Private School |
| 3 to 4 Year Olds | 0 (0.0%) | 0 (0.0%) |
| 5 to 9 Year Old | 73 (62.9%) | 43 (37.1%) |
| 10 to 14 Year Olds | 103 (94.5%) | 6 (5.5%) |
| 15 to 17 Year Olds | 68 (66.0%) | 35 (34.0%) |
| 18 to 19 Year Olds | 61 (91.0%) | 6 (9.0%) |
| 20 to 24 Year Olds | 40 (100.0%) | 0 (0.0%) |
| 25 to 34 Year Olds | 0 (0.0%) | 0 (0.0%) |
| 35 Years and over | 19 (55.9%) | 15 (44.1%) |
| Total | 364 (77.6%) | 105 (22.4%) |
Educational Attainment by Field of Study in Dandridge
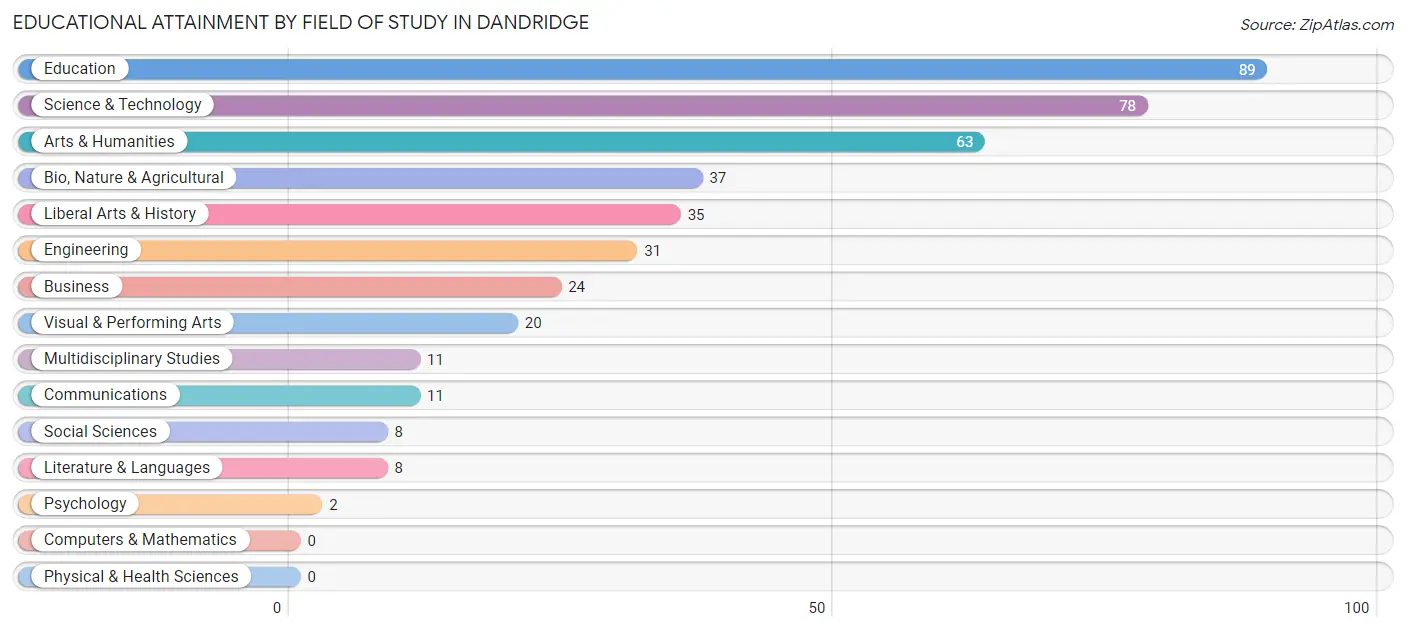
Education (89 | 21.3%), science & technology (78 | 18.7%), arts & humanities (63 | 15.1%), bio, nature & agricultural (37 | 8.9%), and liberal arts & history (35 | 8.4%) are the most common fields of study among 417 individuals in Dandridge who have obtained a bachelor's degree or higher.
| Field of Study | # Graduates | % Graduates |
| Computers & Mathematics | 0 | 0.0% |
| Bio, Nature & Agricultural | 37 | 8.9% |
| Physical & Health Sciences | 0 | 0.0% |
| Psychology | 2 | 0.5% |
| Social Sciences | 8 | 1.9% |
| Engineering | 31 | 7.4% |
| Multidisciplinary Studies | 11 | 2.6% |
| Science & Technology | 78 | 18.7% |
| Business | 24 | 5.8% |
| Education | 89 | 21.3% |
| Literature & Languages | 8 | 1.9% |
| Liberal Arts & History | 35 | 8.4% |
| Visual & Performing Arts | 20 | 4.8% |
| Communications | 11 | 2.6% |
| Arts & Humanities | 63 | 15.1% |
| Total | 417 | 100.0% |
Transportation & Commute in Dandridge
Vehicle Availability by Sex in Dandridge
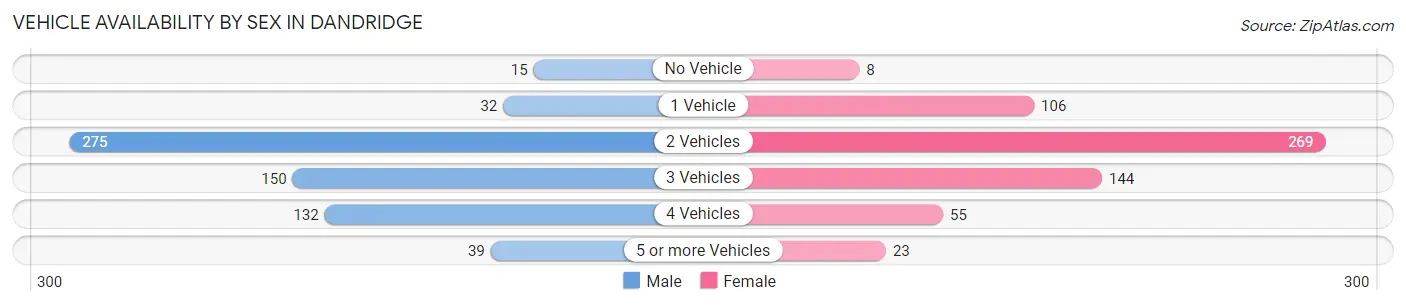
The most prevalent vehicle ownership categories in Dandridge are males with 2 vehicles (275, accounting for 42.8%) and females with 2 vehicles (269, making up 45.5%).
| Vehicles Available | Male | Female |
| No Vehicle | 15 (2.3%) | 8 (1.3%) |
| 1 Vehicle | 32 (5.0%) | 106 (17.5%) |
| 2 Vehicles | 275 (42.8%) | 269 (44.5%) |
| 3 Vehicles | 150 (23.3%) | 144 (23.8%) |
| 4 Vehicles | 132 (20.5%) | 55 (9.1%) |
| 5 or more Vehicles | 39 (6.1%) | 23 (3.8%) |
| Total | 643 (100.0%) | 605 (100.0%) |
Commute Time in Dandridge
The most frequently occuring commute durations in Dandridge are 5 to 9 minutes (249 commuters, 22.1%), 30 to 34 minutes (200 commuters, 17.7%), and 20 to 24 minutes (118 commuters, 10.5%).
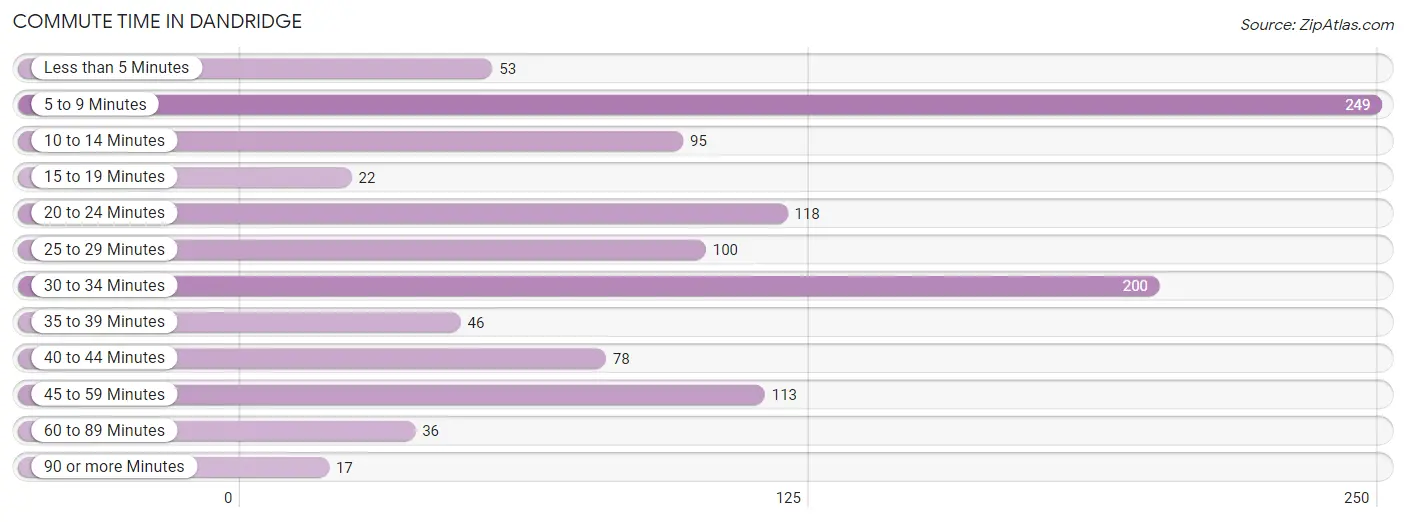
| Commute Time | # Commuters | % Commuters |
| Less than 5 Minutes | 53 | 4.7% |
| 5 to 9 Minutes | 249 | 22.1% |
| 10 to 14 Minutes | 95 | 8.4% |
| 15 to 19 Minutes | 22 | 1.9% |
| 20 to 24 Minutes | 118 | 10.5% |
| 25 to 29 Minutes | 100 | 8.9% |
| 30 to 34 Minutes | 200 | 17.7% |
| 35 to 39 Minutes | 46 | 4.1% |
| 40 to 44 Minutes | 78 | 6.9% |
| 45 to 59 Minutes | 113 | 10.0% |
| 60 to 89 Minutes | 36 | 3.2% |
| 90 or more Minutes | 17 | 1.5% |
Commute Time by Sex in Dandridge
The most common commute times in Dandridge are 30 to 34 minutes (140 commuters, 24.5%) for males and 5 to 9 minutes (138 commuters, 24.8%) for females.
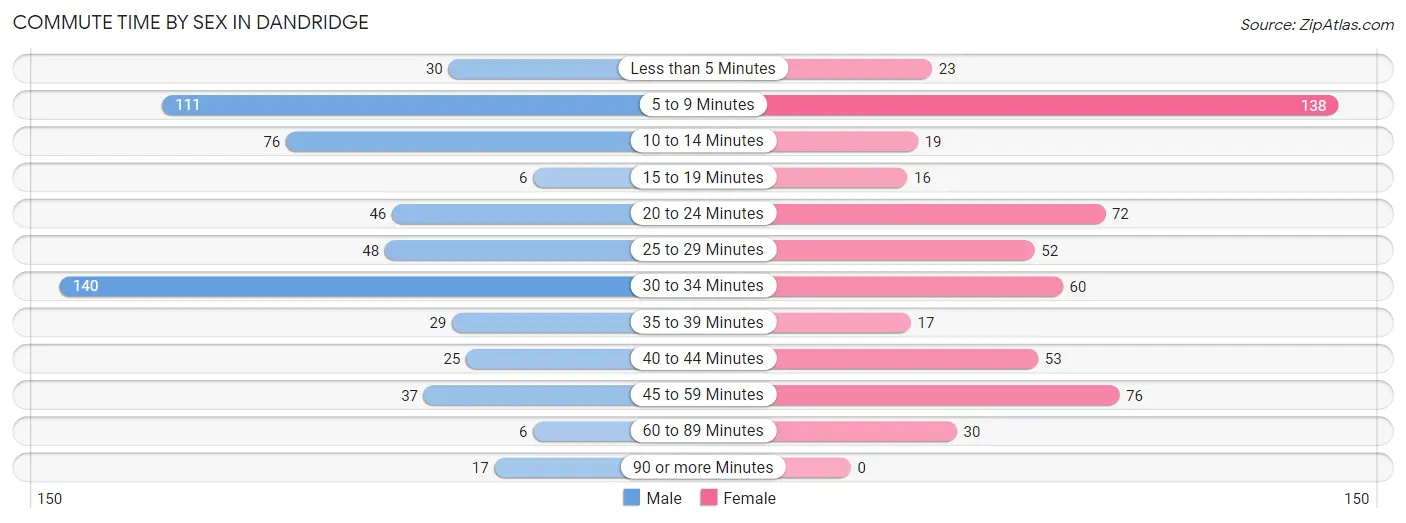
| Commute Time | Male | Female |
| Less than 5 Minutes | 30 (5.2%) | 23 (4.1%) |
| 5 to 9 Minutes | 111 (19.4%) | 138 (24.8%) |
| 10 to 14 Minutes | 76 (13.3%) | 19 (3.4%) |
| 15 to 19 Minutes | 6 (1.1%) | 16 (2.9%) |
| 20 to 24 Minutes | 46 (8.1%) | 72 (13.0%) |
| 25 to 29 Minutes | 48 (8.4%) | 52 (9.3%) |
| 30 to 34 Minutes | 140 (24.5%) | 60 (10.8%) |
| 35 to 39 Minutes | 29 (5.1%) | 17 (3.1%) |
| 40 to 44 Minutes | 25 (4.4%) | 53 (9.5%) |
| 45 to 59 Minutes | 37 (6.5%) | 76 (13.7%) |
| 60 to 89 Minutes | 6 (1.1%) | 30 (5.4%) |
| 90 or more Minutes | 17 (3.0%) | 0 (0.0%) |
Time of Departure to Work by Sex in Dandridge
The most frequent times of departure to work in Dandridge are 7:30 AM to 7:59 AM (81, 14.2%) for males and 8:00 AM to 8:29 AM (105, 18.9%) for females.
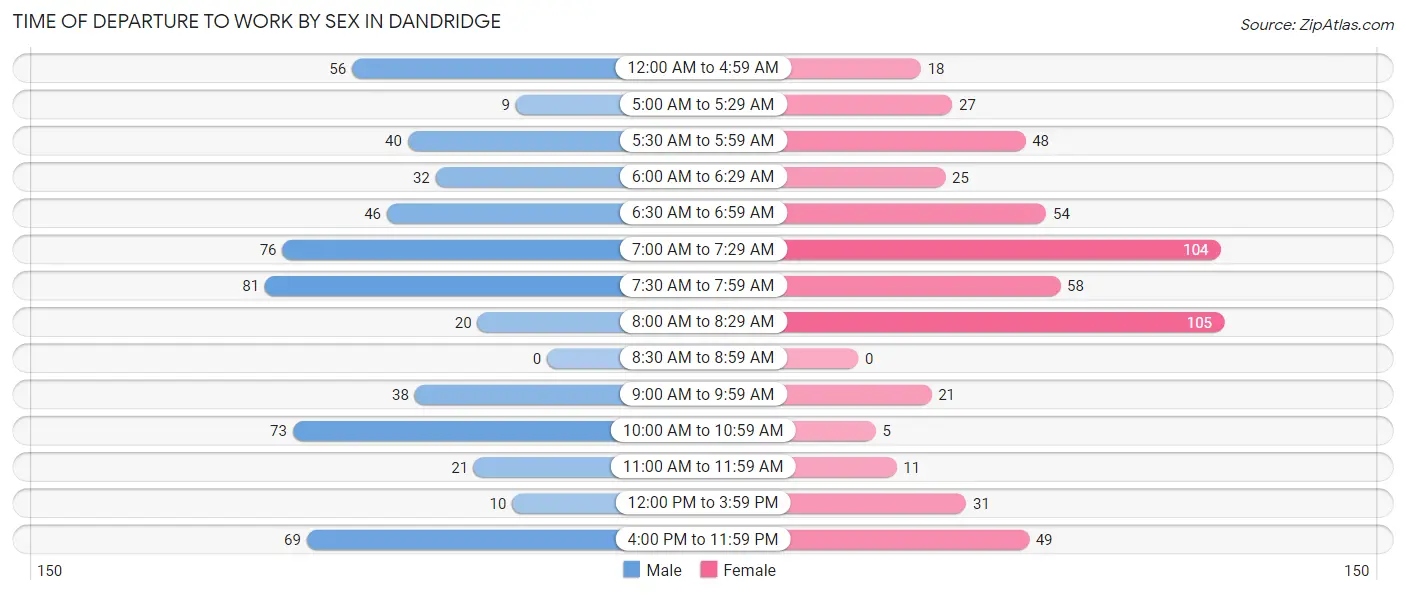
| Time of Departure | Male | Female |
| 12:00 AM to 4:59 AM | 56 (9.8%) | 18 (3.2%) |
| 5:00 AM to 5:29 AM | 9 (1.6%) | 27 (4.9%) |
| 5:30 AM to 5:59 AM | 40 (7.0%) | 48 (8.6%) |
| 6:00 AM to 6:29 AM | 32 (5.6%) | 25 (4.5%) |
| 6:30 AM to 6:59 AM | 46 (8.1%) | 54 (9.7%) |
| 7:00 AM to 7:29 AM | 76 (13.3%) | 104 (18.7%) |
| 7:30 AM to 7:59 AM | 81 (14.2%) | 58 (10.4%) |
| 8:00 AM to 8:29 AM | 20 (3.5%) | 105 (18.9%) |
| 8:30 AM to 8:59 AM | 0 (0.0%) | 0 (0.0%) |
| 9:00 AM to 9:59 AM | 38 (6.7%) | 21 (3.8%) |
| 10:00 AM to 10:59 AM | 73 (12.8%) | 5 (0.9%) |
| 11:00 AM to 11:59 AM | 21 (3.7%) | 11 (2.0%) |
| 12:00 PM to 3:59 PM | 10 (1.8%) | 31 (5.6%) |
| 4:00 PM to 11:59 PM | 69 (12.1%) | 49 (8.8%) |
| Total | 571 (100.0%) | 556 (100.0%) |
Housing Occupancy in Dandridge
Occupancy by Ownership in Dandridge
Of the total 1,323 dwellings in Dandridge, owner-occupied units account for 869 (65.7%), while renter-occupied units make up 454 (34.3%).
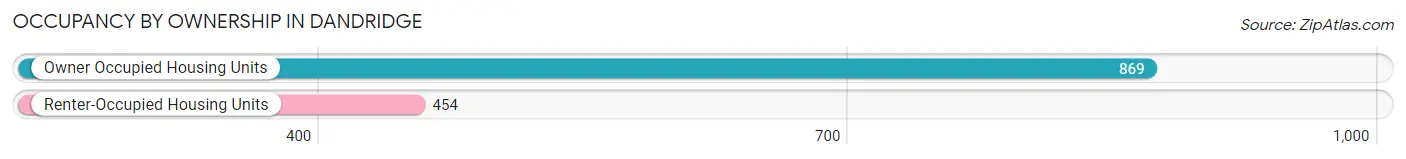
| Occupancy | # Housing Units | % Housing Units |
| Owner Occupied Housing Units | 869 | 65.7% |
| Renter-Occupied Housing Units | 454 | 34.3% |
| Total Occupied Housing Units | 1,323 | 100.0% |
Occupancy by Household Size in Dandridge
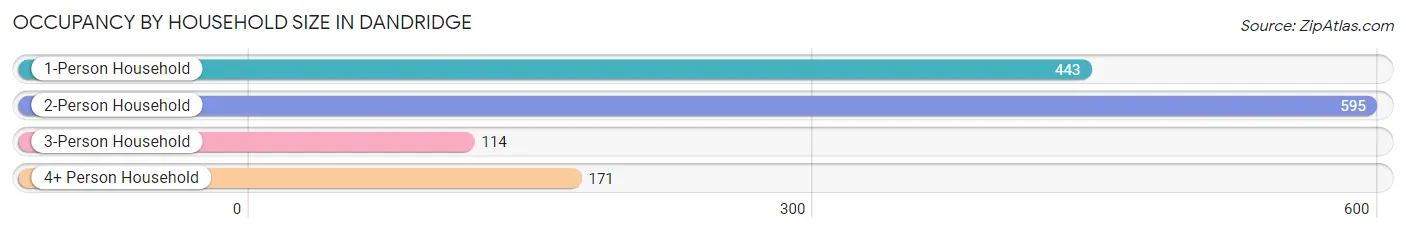
| Household Size | # Housing Units | % Housing Units |
| 1-Person Household | 443 | 33.5% |
| 2-Person Household | 595 | 45.0% |
| 3-Person Household | 114 | 8.6% |
| 4+ Person Household | 171 | 12.9% |
| Total Housing Units | 1,323 | 100.0% |
Occupancy by Ownership by Household Size in Dandridge
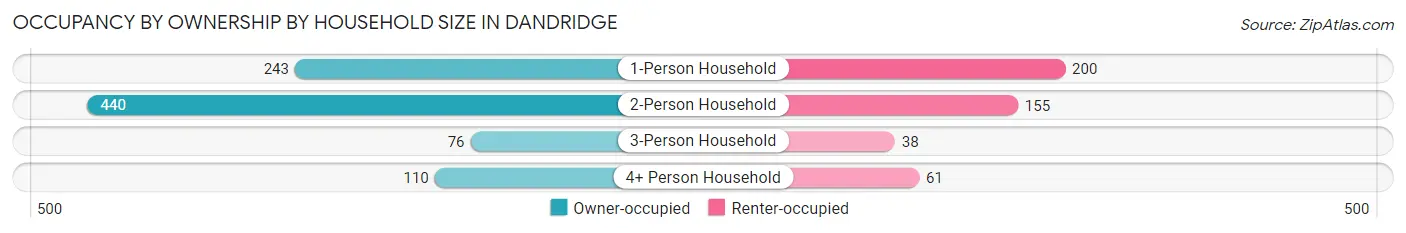
| Household Size | Owner-occupied | Renter-occupied |
| 1-Person Household | 243 (54.8%) | 200 (45.2%) |
| 2-Person Household | 440 (74.0%) | 155 (26.1%) |
| 3-Person Household | 76 (66.7%) | 38 (33.3%) |
| 4+ Person Household | 110 (64.3%) | 61 (35.7%) |
| Total Housing Units | 869 (65.7%) | 454 (34.3%) |
Occupancy by Educational Attainment in Dandridge
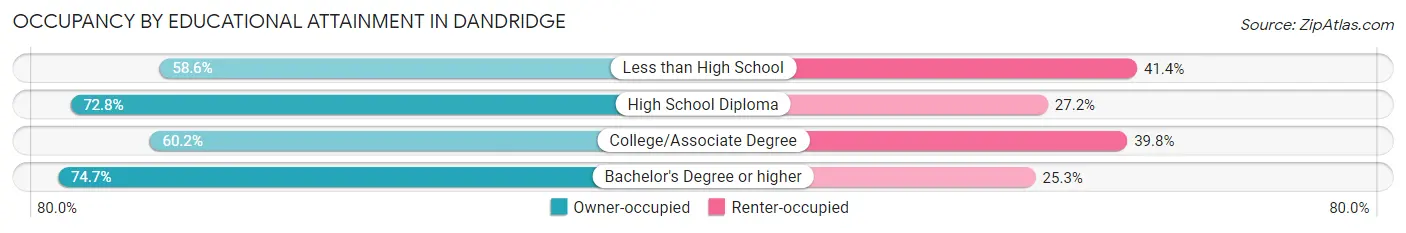
| Household Size | Owner-occupied | Renter-occupied |
| Less than High School | 68 (58.6%) | 48 (41.4%) |
| High School Diploma | 219 (72.8%) | 82 (27.2%) |
| College/Associate Degree | 393 (60.2%) | 260 (39.8%) |
| Bachelor's Degree or higher | 189 (74.7%) | 64 (25.3%) |
Occupancy by Age of Householder in Dandridge
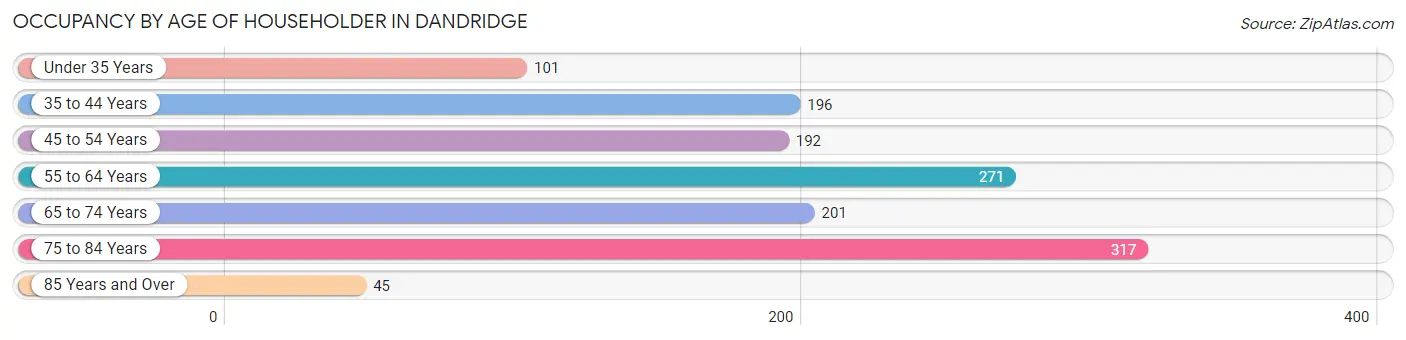
| Age Bracket | # Households | % Households |
| Under 35 Years | 101 | 7.6% |
| 35 to 44 Years | 196 | 14.8% |
| 45 to 54 Years | 192 | 14.5% |
| 55 to 64 Years | 271 | 20.5% |
| 65 to 74 Years | 201 | 15.2% |
| 75 to 84 Years | 317 | 24.0% |
| 85 Years and Over | 45 | 3.4% |
| Total | 1,323 | 100.0% |
Housing Finances in Dandridge
Median Income by Occupancy in Dandridge
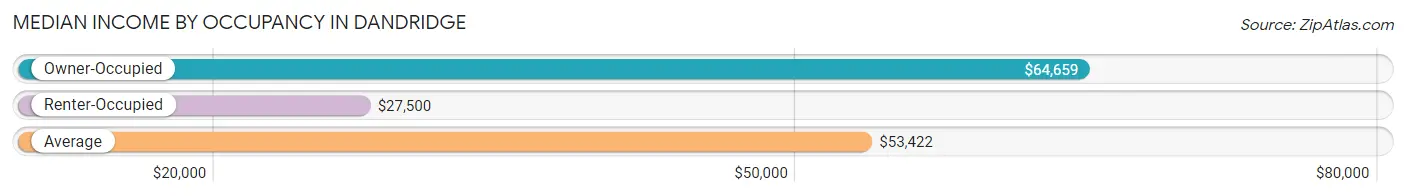
| Occupancy Type | # Households | Median Income |
| Owner-Occupied | 869 (65.7%) | $64,659 |
| Renter-Occupied | 454 (34.3%) | $27,500 |
| Average | 1,323 (100.0%) | $53,422 |
Occupancy by Householder Income Bracket in Dandridge
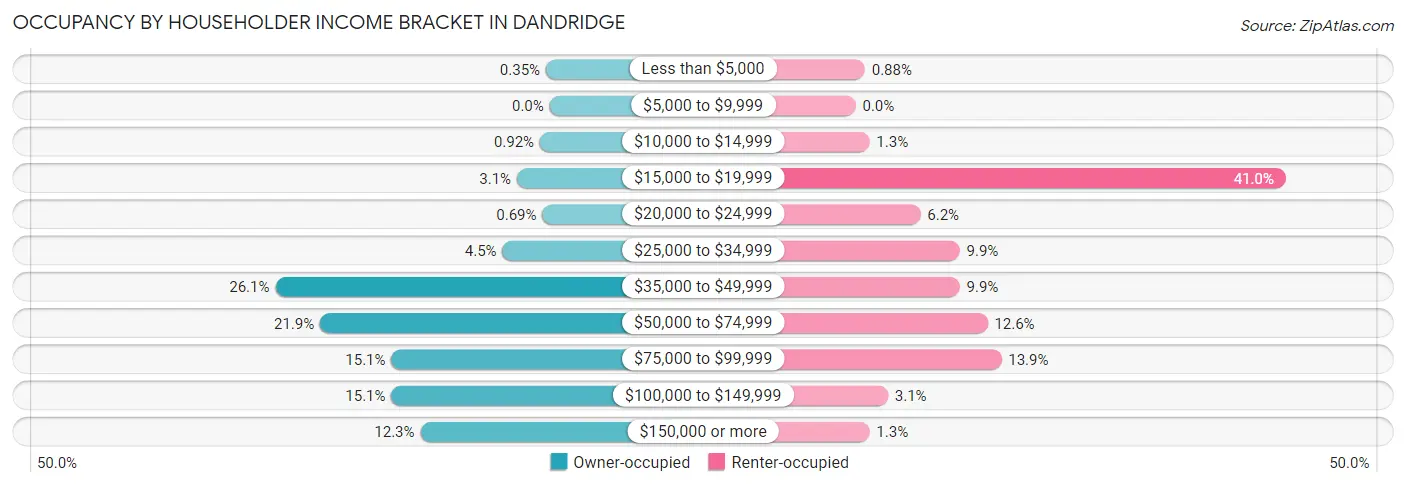
| Income Bracket | Owner-occupied | Renter-occupied |
| Less than $5,000 | 3 (0.4%) | 4 (0.9%) |
| $5,000 to $9,999 | 0 (0.0%) | 0 (0.0%) |
| $10,000 to $14,999 | 8 (0.9%) | 6 (1.3%) |
| $15,000 to $19,999 | 27 (3.1%) | 186 (41.0%) |
| $20,000 to $24,999 | 6 (0.7%) | 28 (6.2%) |
| $25,000 to $34,999 | 39 (4.5%) | 45 (9.9%) |
| $35,000 to $49,999 | 227 (26.1%) | 45 (9.9%) |
| $50,000 to $74,999 | 190 (21.9%) | 57 (12.6%) |
| $75,000 to $99,999 | 131 (15.1%) | 63 (13.9%) |
| $100,000 to $149,999 | 131 (15.1%) | 14 (3.1%) |
| $150,000 or more | 107 (12.3%) | 6 (1.3%) |
| Total | 869 (100.0%) | 454 (100.0%) |
Monthly Housing Cost Tiers in Dandridge
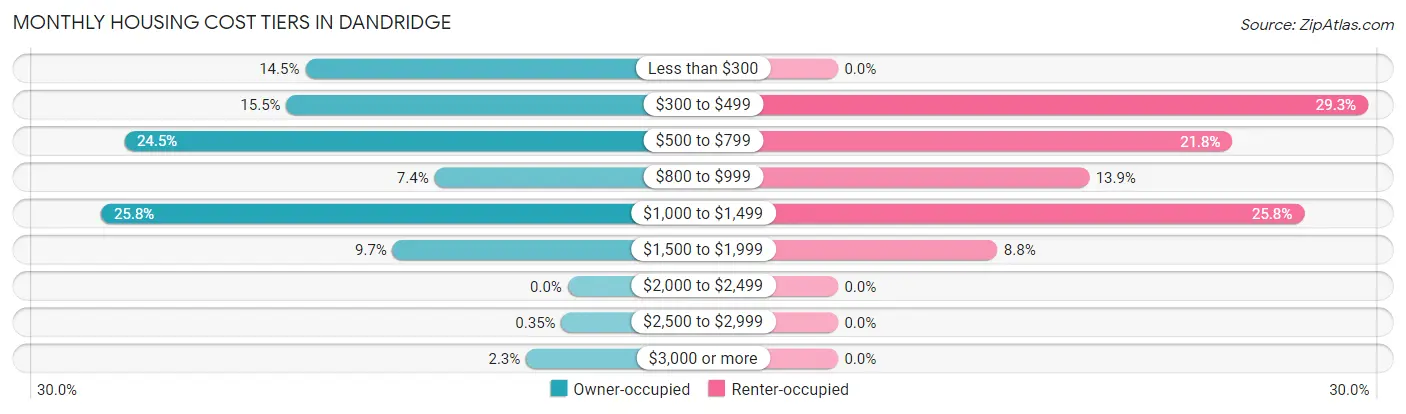
| Monthly Cost | Owner-occupied | Renter-occupied |
| Less than $300 | 126 (14.5%) | 0 (0.0%) |
| $300 to $499 | 135 (15.5%) | 133 (29.3%) |
| $500 to $799 | 213 (24.5%) | 99 (21.8%) |
| $800 to $999 | 64 (7.4%) | 63 (13.9%) |
| $1,000 to $1,499 | 224 (25.8%) | 117 (25.8%) |
| $1,500 to $1,999 | 84 (9.7%) | 40 (8.8%) |
| $2,000 to $2,499 | 0 (0.0%) | 0 (0.0%) |
| $2,500 to $2,999 | 3 (0.4%) | 0 (0.0%) |
| $3,000 or more | 20 (2.3%) | 0 (0.0%) |
| Total | 869 (100.0%) | 454 (100.0%) |
Physical Housing Characteristics in Dandridge
Housing Structures in Dandridge
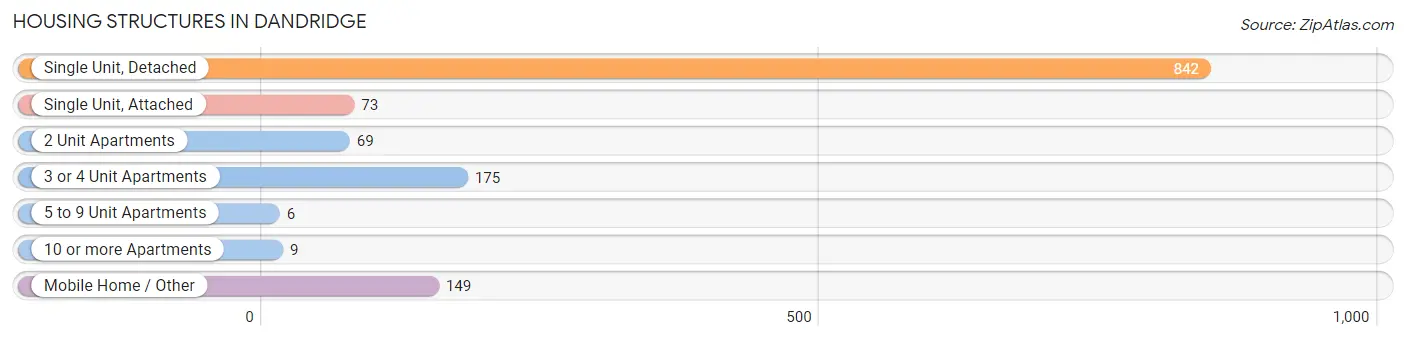
| Structure Type | # Housing Units | % Housing Units |
| Single Unit, Detached | 842 | 63.6% |
| Single Unit, Attached | 73 | 5.5% |
| 2 Unit Apartments | 69 | 5.2% |
| 3 or 4 Unit Apartments | 175 | 13.2% |
| 5 to 9 Unit Apartments | 6 | 0.4% |
| 10 or more Apartments | 9 | 0.7% |
| Mobile Home / Other | 149 | 11.3% |
| Total | 1,323 | 100.0% |
Housing Structures by Occupancy in Dandridge
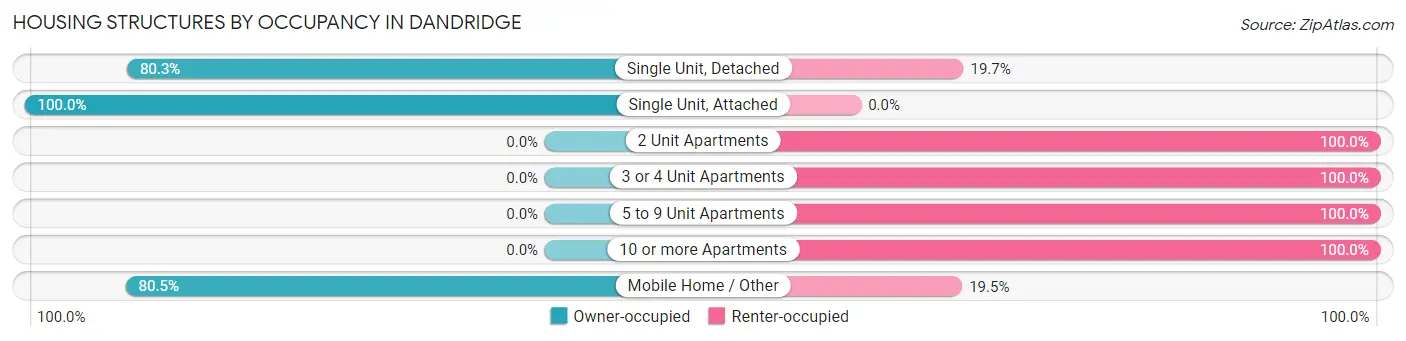
| Structure Type | Owner-occupied | Renter-occupied |
| Single Unit, Detached | 676 (80.3%) | 166 (19.7%) |
| Single Unit, Attached | 73 (100.0%) | 0 (0.0%) |
| 2 Unit Apartments | 0 (0.0%) | 69 (100.0%) |
| 3 or 4 Unit Apartments | 0 (0.0%) | 175 (100.0%) |
| 5 to 9 Unit Apartments | 0 (0.0%) | 6 (100.0%) |
| 10 or more Apartments | 0 (0.0%) | 9 (100.0%) |
| Mobile Home / Other | 120 (80.5%) | 29 (19.5%) |
| Total | 869 (65.7%) | 454 (34.3%) |
Housing Structures by Number of Rooms in Dandridge
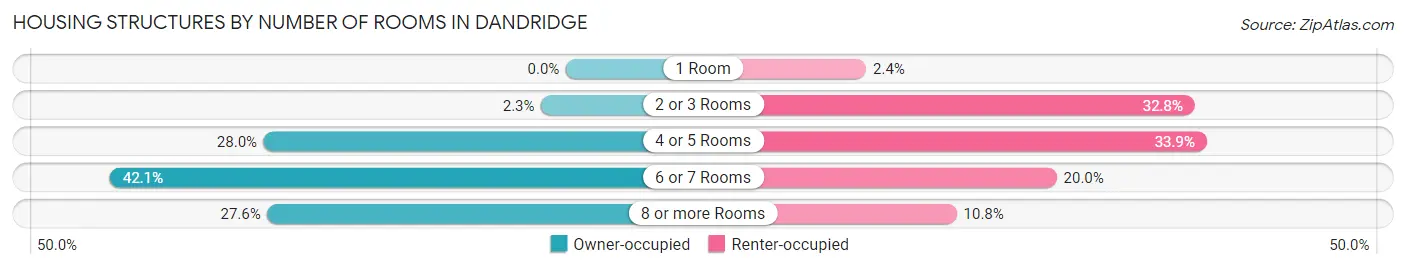
| Number of Rooms | Owner-occupied | Renter-occupied |
| 1 Room | 0 (0.0%) | 11 (2.4%) |
| 2 or 3 Rooms | 20 (2.3%) | 149 (32.8%) |
| 4 or 5 Rooms | 243 (28.0%) | 154 (33.9%) |
| 6 or 7 Rooms | 366 (42.1%) | 91 (20.0%) |
| 8 or more Rooms | 240 (27.6%) | 49 (10.8%) |
| Total | 869 (100.0%) | 454 (100.0%) |
Housing Structure by Heating Type in Dandridge
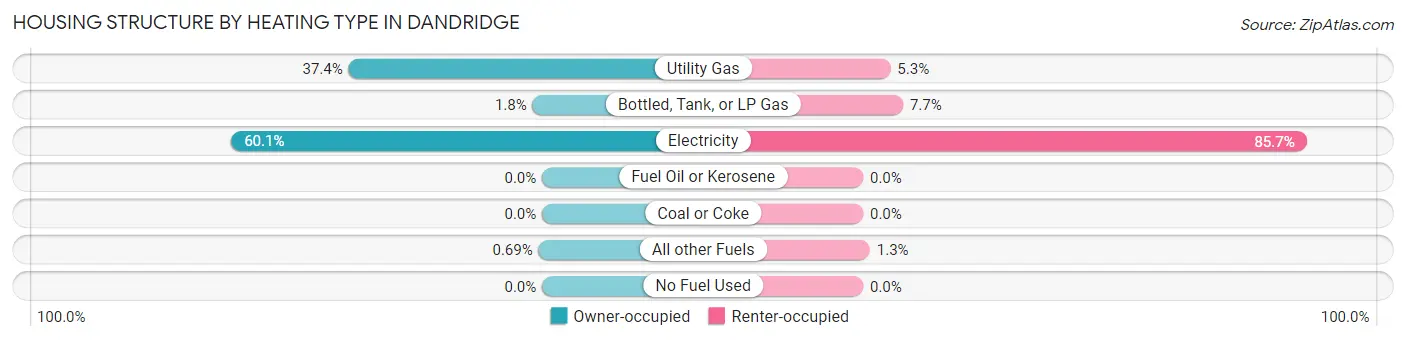
| Heating Type | Owner-occupied | Renter-occupied |
| Utility Gas | 325 (37.4%) | 24 (5.3%) |
| Bottled, Tank, or LP Gas | 16 (1.8%) | 35 (7.7%) |
| Electricity | 522 (60.1%) | 389 (85.7%) |
| Fuel Oil or Kerosene | 0 (0.0%) | 0 (0.0%) |
| Coal or Coke | 0 (0.0%) | 0 (0.0%) |
| All other Fuels | 6 (0.7%) | 6 (1.3%) |
| No Fuel Used | 0 (0.0%) | 0 (0.0%) |
| Total | 869 (100.0%) | 454 (100.0%) |
Household Vehicle Usage in Dandridge
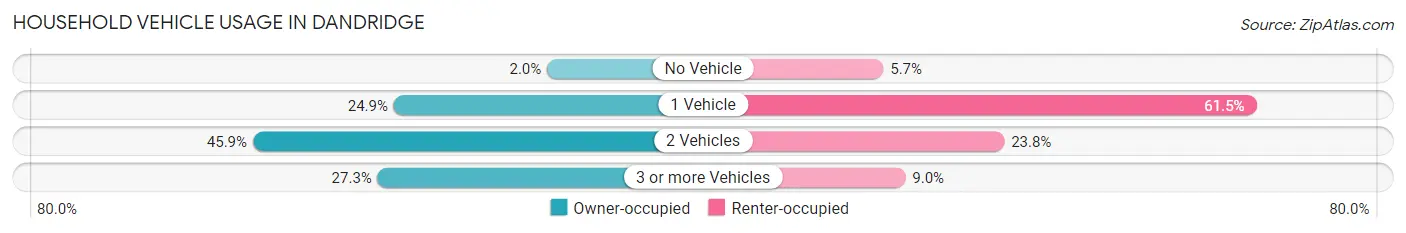
| Vehicles per Household | Owner-occupied | Renter-occupied |
| No Vehicle | 17 (2.0%) | 26 (5.7%) |
| 1 Vehicle | 216 (24.9%) | 279 (61.5%) |
| 2 Vehicles | 399 (45.9%) | 108 (23.8%) |
| 3 or more Vehicles | 237 (27.3%) | 41 (9.0%) |
| Total | 869 (100.0%) | 454 (100.0%) |
Real Estate & Mortgages in Dandridge
Real Estate and Mortgage Overview in Dandridge
| Characteristic | Without Mortgage | With Mortgage |
| Housing Units | 484 | 385 |
| Median Property Value | $254,700 | $195,100 |
| Median Household Income | $54,471 | $63 |
| Monthly Housing Costs | $474 | $20 |
| Real Estate Taxes | $1,804 | $13 |
Property Value by Mortgage Status in Dandridge
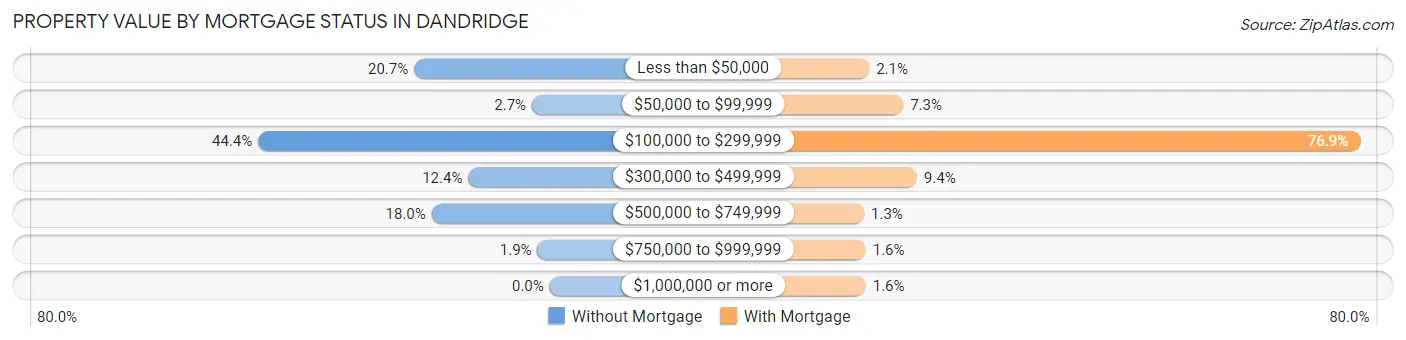
| Property Value | Without Mortgage | With Mortgage |
| Less than $50,000 | 100 (20.7%) | 8 (2.1%) |
| $50,000 to $99,999 | 13 (2.7%) | 28 (7.3%) |
| $100,000 to $299,999 | 215 (44.4%) | 296 (76.9%) |
| $300,000 to $499,999 | 60 (12.4%) | 36 (9.3%) |
| $500,000 to $749,999 | 87 (18.0%) | 5 (1.3%) |
| $750,000 to $999,999 | 9 (1.9%) | 6 (1.6%) |
| $1,000,000 or more | 0 (0.0%) | 6 (1.6%) |
| Total | 484 (100.0%) | 385 (100.0%) |
Household Income by Mortgage Status in Dandridge
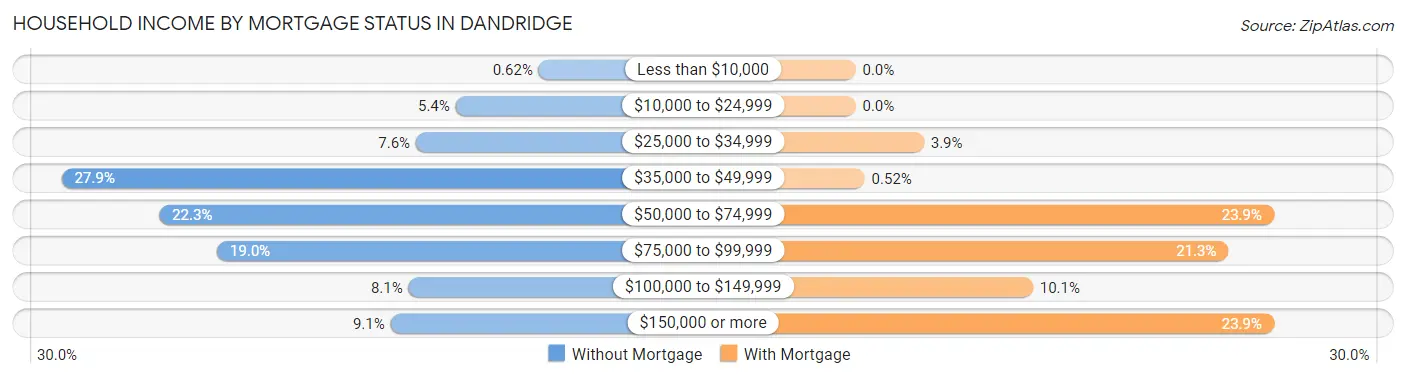
| Household Income | Without Mortgage | With Mortgage |
| Less than $10,000 | 3 (0.6%) | 0 (0.0%) |
| $10,000 to $24,999 | 26 (5.4%) | 0 (0.0%) |
| $25,000 to $34,999 | 37 (7.6%) | 15 (3.9%) |
| $35,000 to $49,999 | 135 (27.9%) | 2 (0.5%) |
| $50,000 to $74,999 | 108 (22.3%) | 92 (23.9%) |
| $75,000 to $99,999 | 92 (19.0%) | 82 (21.3%) |
| $100,000 to $149,999 | 39 (8.1%) | 39 (10.1%) |
| $150,000 or more | 44 (9.1%) | 92 (23.9%) |
| Total | 484 (100.0%) | 385 (100.0%) |
Property Value to Household Income Ratio in Dandridge
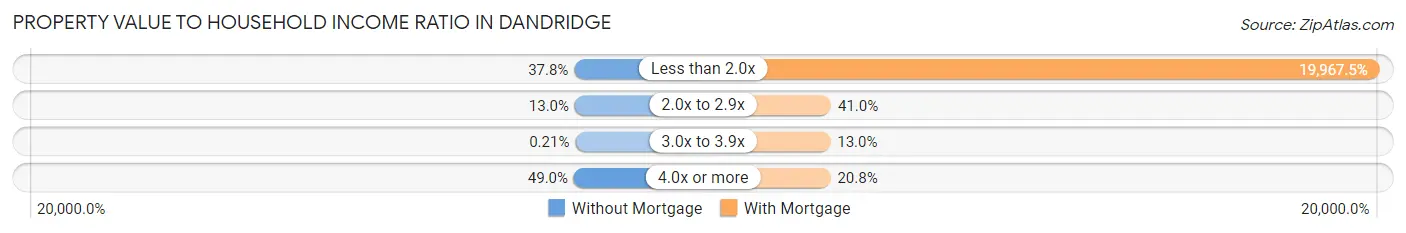
| Value-to-Income Ratio | Without Mortgage | With Mortgage |
| Less than 2.0x | 183 (37.8%) | 76,875 (19,967.5%) |
| 2.0x to 2.9x | 63 (13.0%) | 158 (41.0%) |
| 3.0x to 3.9x | 1 (0.2%) | 50 (13.0%) |
| 4.0x or more | 237 (49.0%) | 80 (20.8%) |
| Total | 484 (100.0%) | 385 (100.0%) |
Real Estate Taxes by Mortgage Status in Dandridge
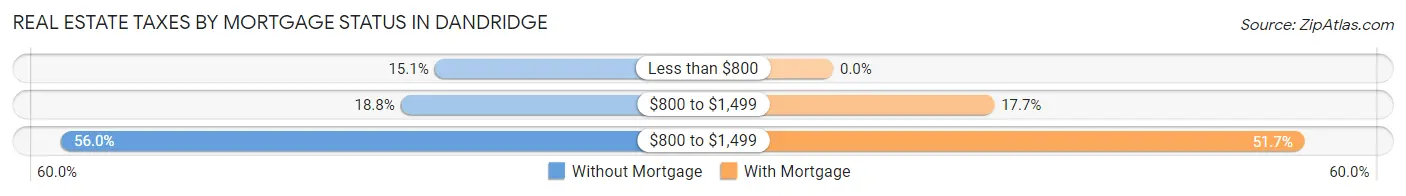
| Property Taxes | Without Mortgage | With Mortgage |
| Less than $800 | 73 (15.1%) | 0 (0.0%) |
| $800 to $1,499 | 91 (18.8%) | 68 (17.7%) |
| $800 to $1,499 | 271 (56.0%) | 199 (51.7%) |
| Total | 484 (100.0%) | 385 (100.0%) |
Health & Disability in Dandridge
Health Insurance Coverage by Age in Dandridge
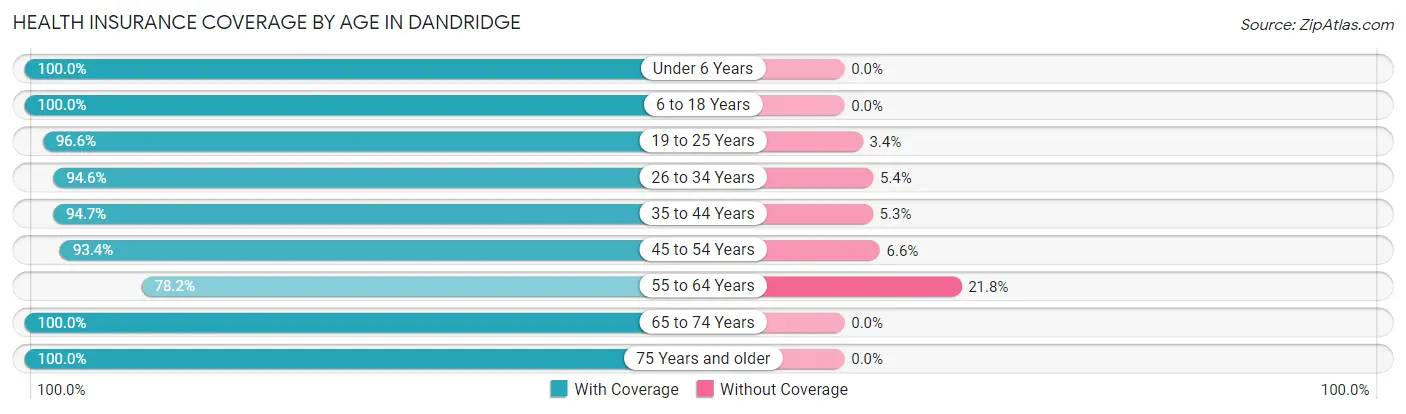
| Age Bracket | With Coverage | Without Coverage |
| Under 6 Years | 123 (100.0%) | 0 (0.0%) |
| 6 to 18 Years | 351 (100.0%) | 0 (0.0%) |
| 19 to 25 Years | 143 (96.6%) | 5 (3.4%) |
| 26 to 34 Years | 212 (94.6%) | 12 (5.4%) |
| 35 to 44 Years | 340 (94.7%) | 19 (5.3%) |
| 45 to 54 Years | 341 (93.4%) | 24 (6.6%) |
| 55 to 64 Years | 391 (78.2%) | 109 (21.8%) |
| 65 to 74 Years | 282 (100.0%) | 0 (0.0%) |
| 75 Years and older | 478 (100.0%) | 0 (0.0%) |
| Total | 2,661 (94.0%) | 169 (6.0%) |
Health Insurance Coverage by Citizenship Status in Dandridge
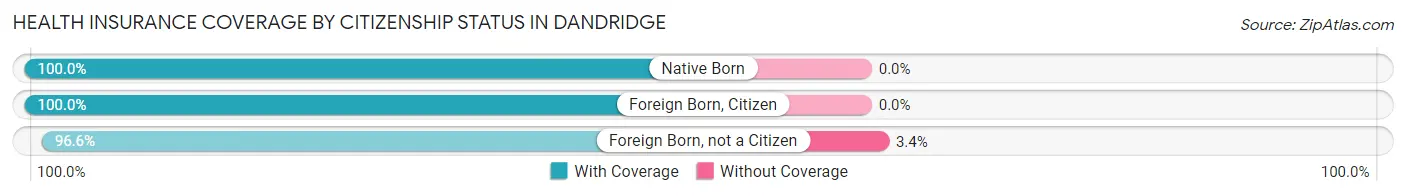
| Citizenship Status | With Coverage | Without Coverage |
| Native Born | 123 (100.0%) | 0 (0.0%) |
| Foreign Born, Citizen | 351 (100.0%) | 0 (0.0%) |
| Foreign Born, not a Citizen | 143 (96.6%) | 5 (3.4%) |
Health Insurance Coverage by Household Income in Dandridge
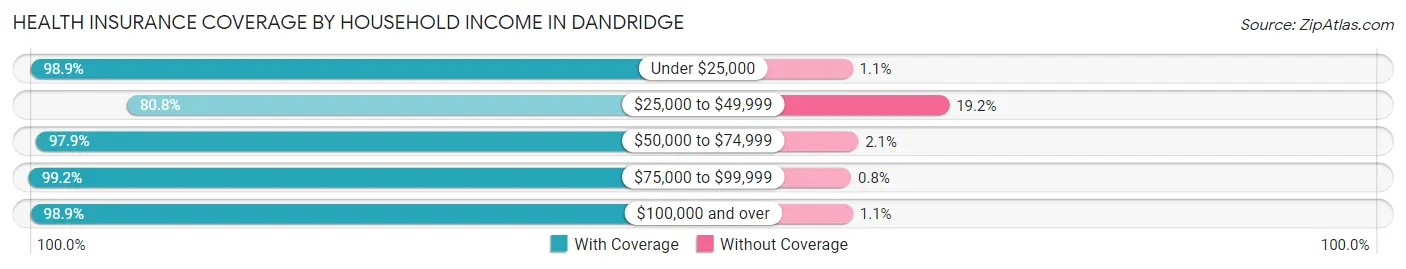
| Household Income | With Coverage | Without Coverage |
| Under $25,000 | 361 (98.9%) | 4 (1.1%) |
| $25,000 to $49,999 | 598 (80.8%) | 142 (19.2%) |
| $50,000 to $74,999 | 504 (97.9%) | 11 (2.1%) |
| $75,000 to $99,999 | 499 (99.2%) | 4 (0.8%) |
| $100,000 and over | 699 (98.9%) | 8 (1.1%) |
Public vs Private Health Insurance Coverage by Age in Dandridge
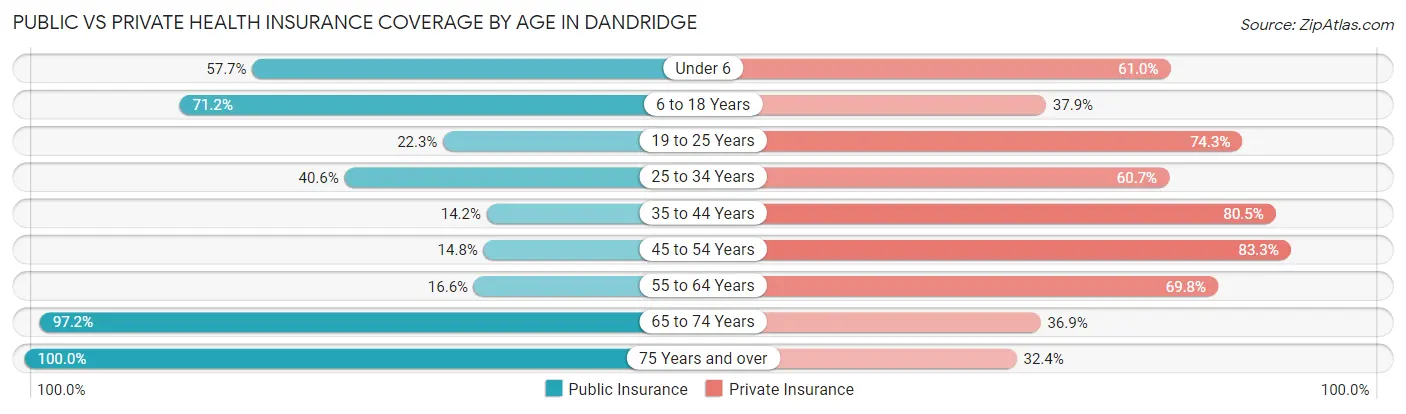
| Age Bracket | Public Insurance | Private Insurance |
| Under 6 | 71 (57.7%) | 75 (61.0%) |
| 6 to 18 Years | 250 (71.2%) | 133 (37.9%) |
| 19 to 25 Years | 33 (22.3%) | 110 (74.3%) |
| 25 to 34 Years | 91 (40.6%) | 136 (60.7%) |
| 35 to 44 Years | 51 (14.2%) | 289 (80.5%) |
| 45 to 54 Years | 54 (14.8%) | 304 (83.3%) |
| 55 to 64 Years | 83 (16.6%) | 349 (69.8%) |
| 65 to 74 Years | 274 (97.2%) | 104 (36.9%) |
| 75 Years and over | 478 (100.0%) | 155 (32.4%) |
| Total | 1,385 (48.9%) | 1,655 (58.5%) |
Disability Status by Sex by Age in Dandridge
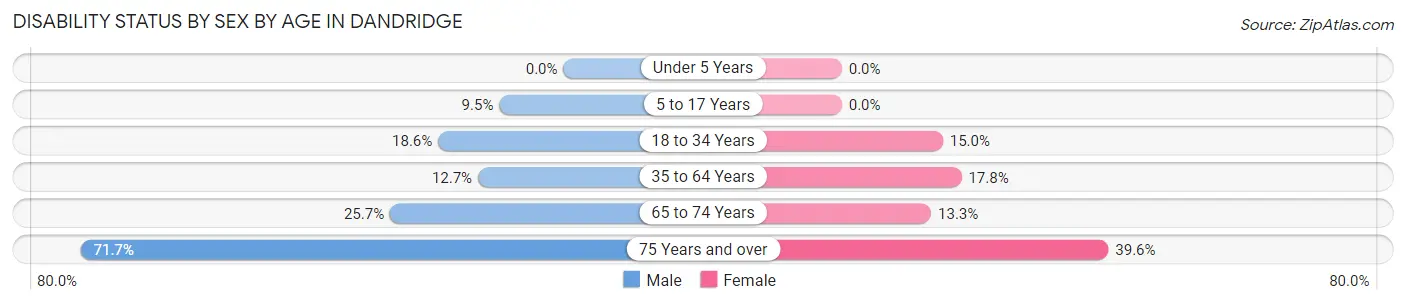
| Age Bracket | Male | Female |
| Under 5 Years | 0 (0.0%) | 0 (0.0%) |
| 5 to 17 Years | 16 (9.5%) | 0 (0.0%) |
| 18 to 34 Years | 48 (18.6%) | 27 (15.0%) |
| 35 to 64 Years | 71 (12.7%) | 118 (17.8%) |
| 65 to 74 Years | 26 (25.7%) | 24 (13.3%) |
| 75 Years and over | 205 (71.7%) | 76 (39.6%) |
Disability Class by Sex by Age in Dandridge
Disability Class: Hearing Difficulty
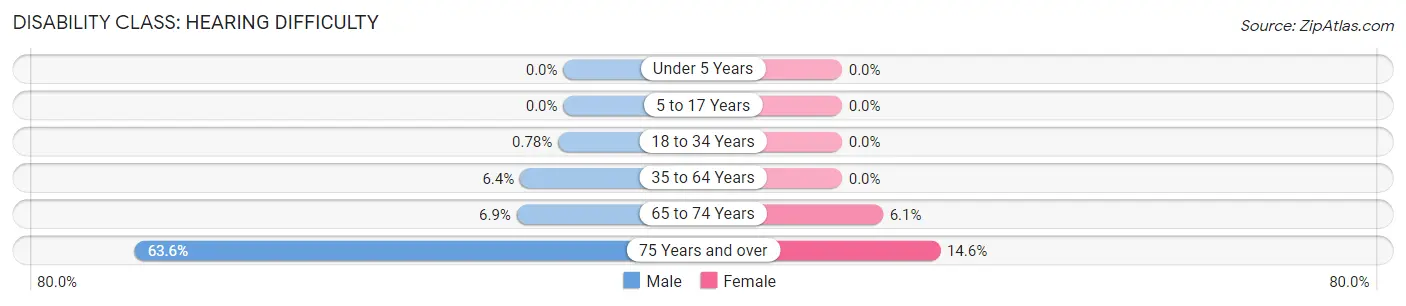
| Age Bracket | Male | Female |
| Under 5 Years | 0 (0.0%) | 0 (0.0%) |
| 5 to 17 Years | 0 (0.0%) | 0 (0.0%) |
| 18 to 34 Years | 2 (0.8%) | 0 (0.0%) |
| 35 to 64 Years | 36 (6.4%) | 0 (0.0%) |
| 65 to 74 Years | 7 (6.9%) | 11 (6.1%) |
| 75 Years and over | 182 (63.6%) | 28 (14.6%) |
Disability Class: Vision Difficulty
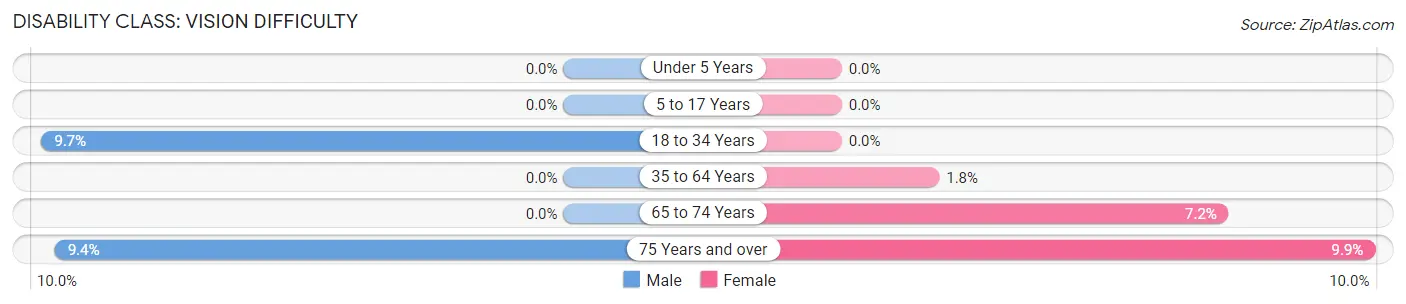
| Age Bracket | Male | Female |
| Under 5 Years | 0 (0.0%) | 0 (0.0%) |
| 5 to 17 Years | 0 (0.0%) | 0 (0.0%) |
| 18 to 34 Years | 25 (9.7%) | 0 (0.0%) |
| 35 to 64 Years | 0 (0.0%) | 12 (1.8%) |
| 65 to 74 Years | 0 (0.0%) | 13 (7.2%) |
| 75 Years and over | 27 (9.4%) | 19 (9.9%) |
Disability Class: Cognitive Difficulty
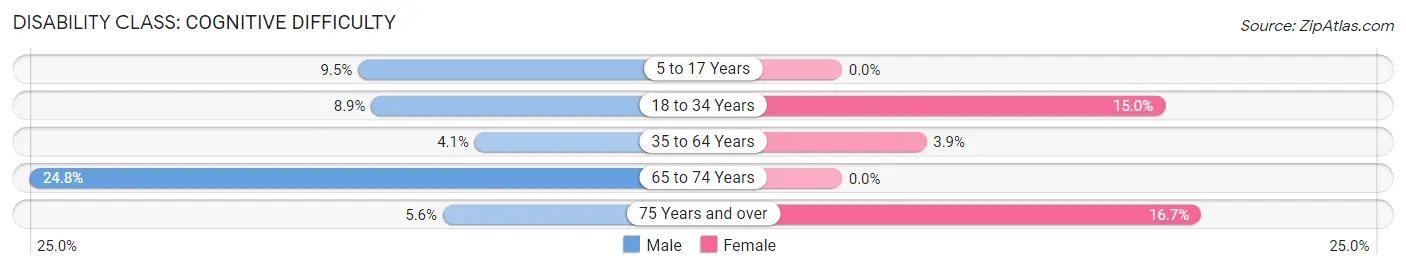
| Age Bracket | Male | Female |
| 5 to 17 Years | 16 (9.5%) | 0 (0.0%) |
| 18 to 34 Years | 23 (8.9%) | 27 (15.0%) |
| 35 to 64 Years | 23 (4.1%) | 26 (3.9%) |
| 65 to 74 Years | 25 (24.7%) | 0 (0.0%) |
| 75 Years and over | 16 (5.6%) | 32 (16.7%) |
Disability Class: Ambulatory Difficulty
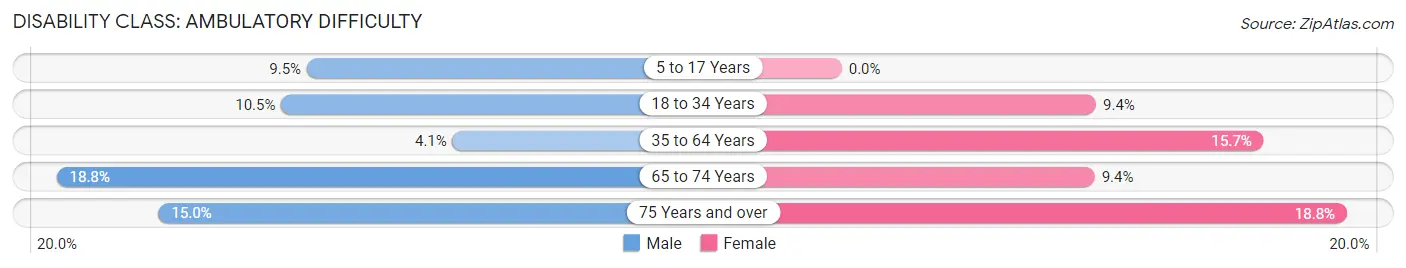
| Age Bracket | Male | Female |
| 5 to 17 Years | 16 (9.5%) | 0 (0.0%) |
| 18 to 34 Years | 27 (10.5%) | 17 (9.4%) |
| 35 to 64 Years | 23 (4.1%) | 104 (15.7%) |
| 65 to 74 Years | 19 (18.8%) | 17 (9.4%) |
| 75 Years and over | 43 (15.0%) | 36 (18.8%) |
Disability Class: Self-Care Difficulty
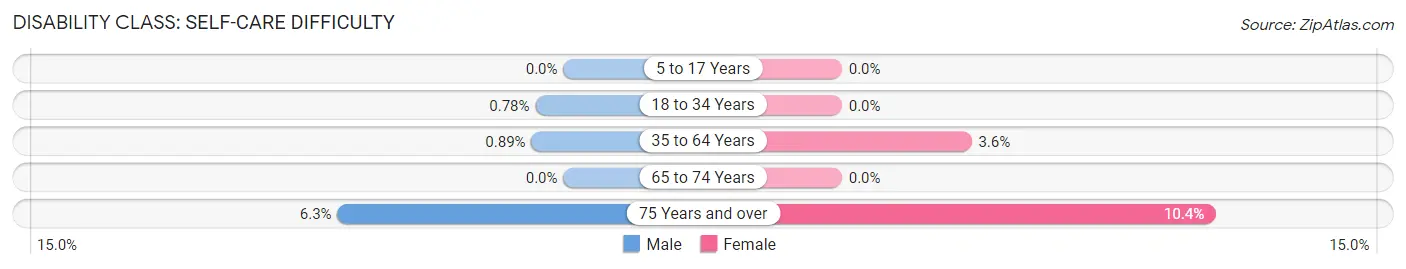
| Age Bracket | Male | Female |
| 5 to 17 Years | 0 (0.0%) | 0 (0.0%) |
| 18 to 34 Years | 2 (0.8%) | 0 (0.0%) |
| 35 to 64 Years | 5 (0.9%) | 24 (3.6%) |
| 65 to 74 Years | 0 (0.0%) | 0 (0.0%) |
| 75 Years and over | 18 (6.3%) | 20 (10.4%) |
Technology Access in Dandridge
Computing Device Access in Dandridge
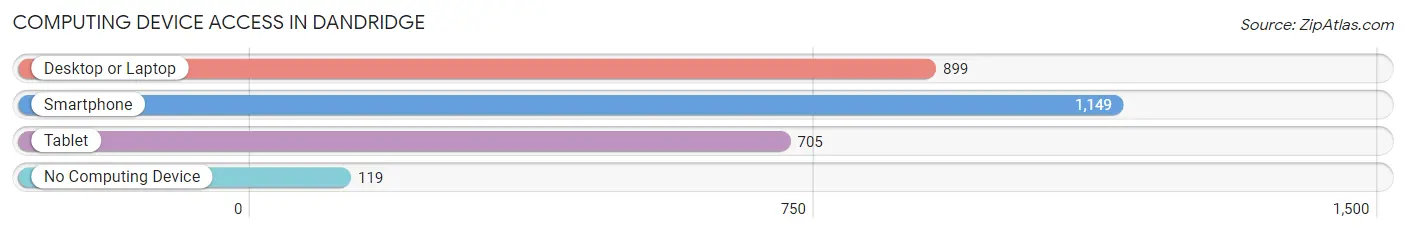
| Device Type | # Households | % Households |
| Desktop or Laptop | 899 | 67.9% |
| Smartphone | 1,149 | 86.9% |
| Tablet | 705 | 53.3% |
| No Computing Device | 119 | 9.0% |
| Total | 1,323 | 100.0% |
Internet Access in Dandridge
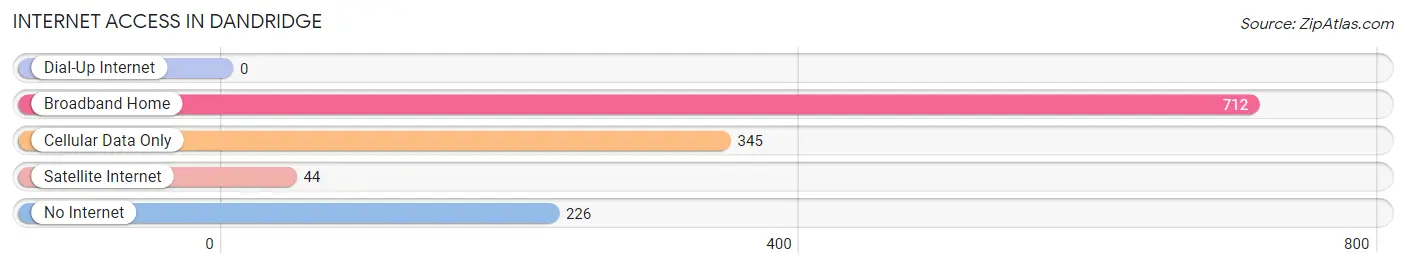
| Internet Type | # Households | % Households |
| Dial-Up Internet | 0 | 0.0% |
| Broadband Home | 712 | 53.8% |
| Cellular Data Only | 345 | 26.1% |
| Satellite Internet | 44 | 3.3% |
| No Internet | 226 | 17.1% |
| Total | 1,323 | 100.0% |
Dandridge Summary
Dandridge is a town located in Jefferson County, Tennessee, United States. It is the county seat of Jefferson County and is part of the Knoxville Metropolitan Statistical Area. The population of Dandridge was 2,076 at the 2010 census.
History
Dandridge was founded in 1783 by John Dandridge, a Revolutionary War veteran and the father of Martha Washington. The town was named after him and was the first county seat of Jefferson County. The town was incorporated in 1810 and was the first town in Tennessee to be incorporated by the state legislature.
In the early 19th century, Dandridge was a thriving river port and a major stop on the Great Stage Road, which connected Knoxville to Abingdon, Virginia. The town was also the site of the first post office in Jefferson County.
During the Civil War, Dandridge was the site of a major battle between Union and Confederate forces in December 1863. The Battle of Dandridge was a Confederate victory, but the town was heavily damaged in the fighting.
Geography
Dandridge is located at 35°51'25"N 83°25'45"W (35.856944, -83.429167). It is situated along the French Broad River, which forms the border between Jefferson and Sevier counties.
The town has a total area of 2 2 square miles all of which is land
Economy
The economy of Dandridge is largely based on tourism. The town is home to several historic sites, including the Dandridge Historic District, which is listed on the National Register of Historic Places. The town is also home to several popular attractions, including the Dandridge Golf and Country Club, the Dandridge Museum of History, and the Dandridge Drive-In Theater.
The town is also home to several businesses, including restaurants, retail stores, and professional services.
Demographics
As of the 2010 census, there were 2,076 people, 845 households, and 545 families residing in the town. The population density was 937.2 people per square mile. The racial makeup of the town was 92.2% White, 4.3% African American, 0.2% Native American, 0.7% Asian, 0.1% Pacific Islander, 1.2% from other races, and 1.3% from two or more races. Hispanic or Latino of any race were 2.3% of the population.
There were 845 households, out of which 28.2% had children under the age of 18 living with them, 46.2% were married couples living together, 14.2% had a female householder with no husband present, and 35.2% were non-families. 29.7% of all households were made up of individuals, and 12.2% had someone living alone who was 65 years of age or older. The average household size was 2.44 and the average family size was 3.02.
The median age in the town was 39.7 years. 22.7% of residents were under the age of 18; 8.2% were between the ages of 18 and 24; 25.2% were from 25 to 44; 28.2% were from 45 to 64; and 15.7% were 65 years of age or older. The gender makeup of the town was 48.2% male and 51.8% female.
The median income for a household in the town was $35,938, and the median income for a family was $45,000. Males had a median income of $31,250 versus $22,500 for females. The per capita income for the town was $18,945. About 11.2% of families and 14.2% of the population were below the poverty line, including 19.2% of those under age 18 and 11.2% of those age 65 or over.
Common Questions
What is Per Capita Income in Dandridge?
Per Capita income in Dandridge is $33,114.
What is the Median Family Income in Dandridge?
Median Family Income in Dandridge is $67,652.
What is the Median Household income in Dandridge?
Median Household Income in Dandridge is $53,422.
What is Income or Wage Gap in Dandridge?
Income or Wage Gap in Dandridge is 29.8%.
Women in Dandridge earn 70.2 cents for every dollar earned by a man.
What is Family Income Deficit in Dandridge?
Family Income Deficit in Dandridge is $7,776.
Families that are below poverty line in Dandridge earn $7,776 less on average than the poverty threshold level.
What is Inequality or Gini Index in Dandridge?
Inequality or Gini Index in Dandridge is 0.45.
What is the Total Population of Dandridge?
Total Population of Dandridge is 3,351.
What is the Total Male Population of Dandridge?
Total Male Population of Dandridge is 1,782.
What is the Total Female Population of Dandridge?
Total Female Population of Dandridge is 1,569.
What is the Ratio of Males per 100 Females in Dandridge?
There are 113.58 Males per 100 Females in Dandridge.
What is the Ratio of Females per 100 Males in Dandridge?
There are 88.05 Females per 100 Males in Dandridge.
What is the Median Population Age in Dandridge?
Median Population Age in Dandridge is 50.6 Years.
What is the Average Family Size in Dandridge
Average Family Size in Dandridge is 2.7 People.
What is the Average Household Size in Dandridge
Average Household Size in Dandridge is 2.1 People.
How Large is the Labor Force in Dandridge?
There are 1,368 People in the Labor Forcein in Dandridge.
What is the Percentage of People in the Labor Force in Dandridge?
45.8% of People are in the Labor Force in Dandridge.
What is the Unemployment Rate in Dandridge?
Unemployment Rate in Dandridge is 7.0%.