La Follette, TN Map & Demographics
La Follette Map
La Follette Overview
$21,294
PER CAPITA INCOME
$44,052
AVG FAMILY INCOME
$35,705
AVG HOUSEHOLD INCOME
34.4%
WAGE / INCOME GAP [ % ]
65.6¢/ $1
WAGE / INCOME GAP [ $ ]
$8,423
FAMILY INCOME DEFICIT
0.45
INEQUALITY / GINI INDEX
7,349
TOTAL POPULATION
3,176
MALE POPULATION
4,173
FEMALE POPULATION
76.11
MALES / 100 FEMALES
131.39
FEMALES / 100 MALES
38.5
MEDIAN AGE
2.7
AVG FAMILY SIZE
2.3
AVG HOUSEHOLD SIZE
3,049
LABOR FORCE [ PEOPLE ]
50.5%
PERCENT IN LABOR FORCE
12.5%
UNEMPLOYMENT RATE
La Follette Zip Codes
La Follette Area Codes
Income in La Follette
Income Overview in La Follette
Per Capita Income in La Follette is $21,294, while median incomes of families and households are $44,052 and $35,705 respectively.
| Characteristic | Number | Measure |
| Per Capita Income | 7,349 | $21,294 |
| Median Family Income | 1,903 | $44,052 |
| Mean Family Income | 1,903 | $55,788 |
| Median Household Income | 3,105 | $35,705 |
| Mean Household Income | 3,105 | $50,331 |
| Income Deficit | 1,903 | $8,423 |
| Wage / Income Gap (%) | 7,349 | 34.44% |
| Wage / Income Gap ($) | 7,349 | 65.56¢ per $1 |
| Gini / Inequality Index | 7,349 | 0.45 |
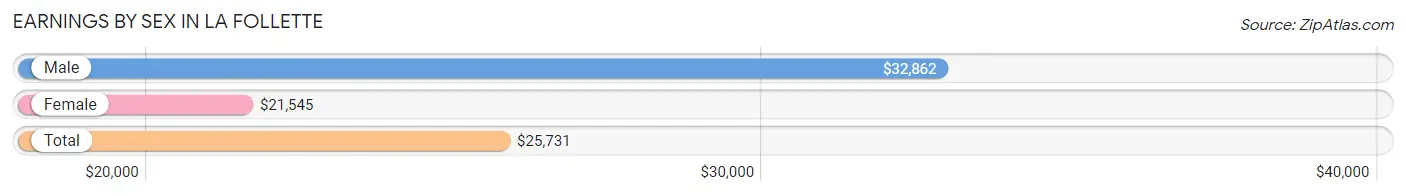
Earnings by Sex in La Follette
Average Earnings in La Follette are $25,731, $32,862 for men and $21,545 for women, a difference of 34.4%.
| Sex | Number | Average Earnings |
| Male | 1,433 (46.2%) | $32,862 |
| Female | 1,668 (53.8%) | $21,545 |
| Total | 3,101 (100.0%) | $25,731 |
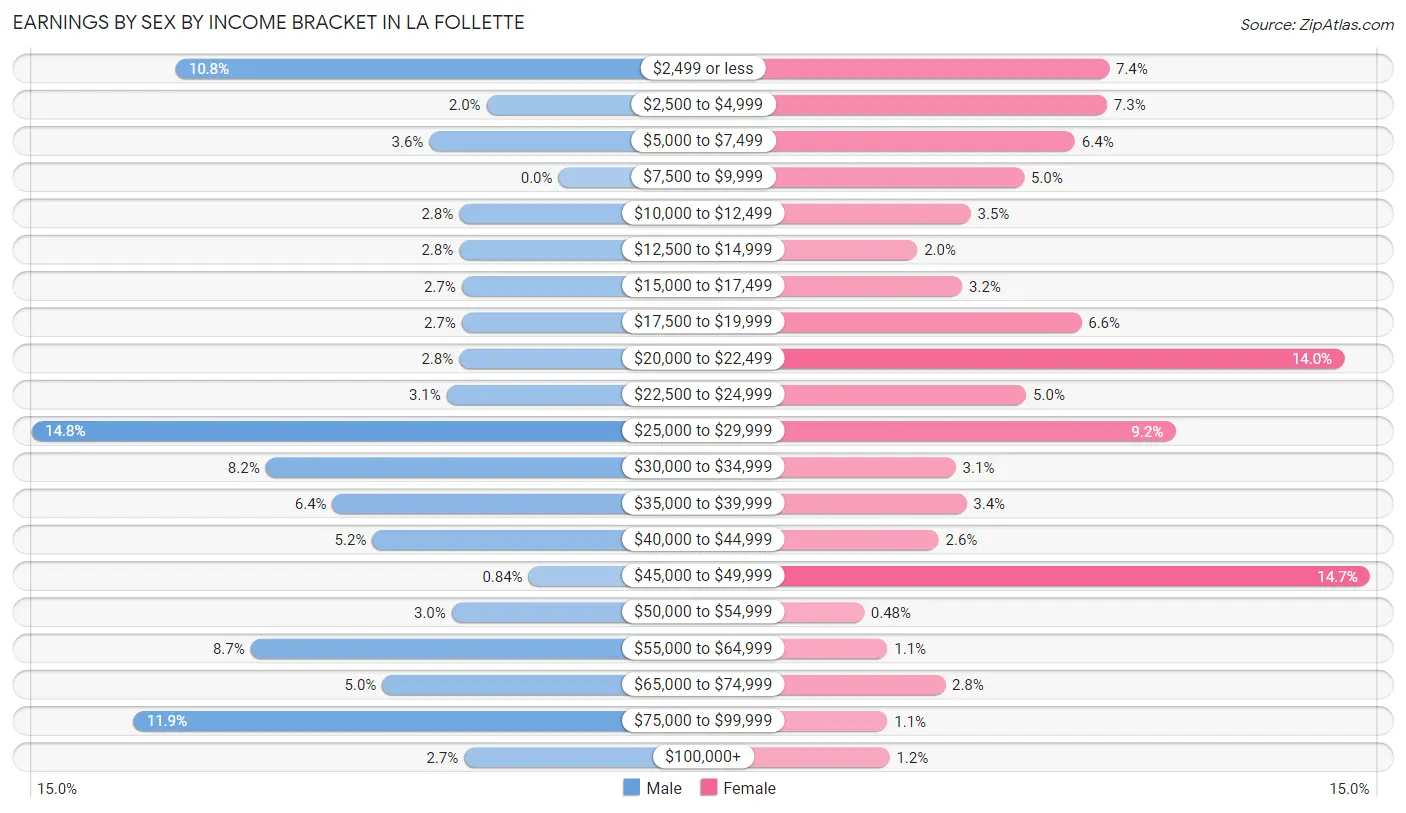
Earnings by Sex by Income Bracket in La Follette
The most common earnings brackets in La Follette are $25,000 to $29,999 for men (212 | 14.8%) and $45,000 to $49,999 for women (245 | 14.7%).
| Income | Male | Female |
| $2,499 or less | 154 (10.7%) | 123 (7.4%) |
| $2,500 to $4,999 | 29 (2.0%) | 122 (7.3%) |
| $5,000 to $7,499 | 52 (3.6%) | 107 (6.4%) |
| $7,500 to $9,999 | 0 (0.0%) | 83 (5.0%) |
| $10,000 to $12,499 | 40 (2.8%) | 58 (3.5%) |
| $12,500 to $14,999 | 40 (2.8%) | 33 (2.0%) |
| $15,000 to $17,499 | 39 (2.7%) | 54 (3.2%) |
| $17,500 to $19,999 | 39 (2.7%) | 110 (6.6%) |
| $20,000 to $22,499 | 40 (2.8%) | 233 (14.0%) |
| $22,500 to $24,999 | 45 (3.1%) | 84 (5.0%) |
| $25,000 to $29,999 | 212 (14.8%) | 154 (9.2%) |
| $30,000 to $34,999 | 118 (8.2%) | 51 (3.1%) |
| $35,000 to $39,999 | 91 (6.4%) | 56 (3.4%) |
| $40,000 to $44,999 | 75 (5.2%) | 43 (2.6%) |
| $45,000 to $49,999 | 12 (0.8%) | 245 (14.7%) |
| $50,000 to $54,999 | 43 (3.0%) | 8 (0.5%) |
| $55,000 to $64,999 | 124 (8.6%) | 19 (1.1%) |
| $65,000 to $74,999 | 71 (5.0%) | 46 (2.8%) |
| $75,000 to $99,999 | 171 (11.9%) | 19 (1.1%) |
| $100,000+ | 38 (2.6%) | 20 (1.2%) |
| Total | 1,433 (100.0%) | 1,668 (100.0%) |
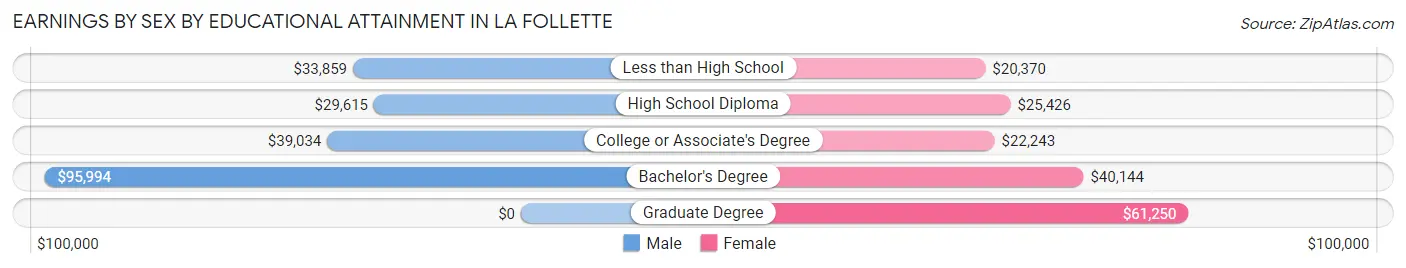
Earnings by Sex by Educational Attainment in La Follette
Average earnings in La Follette are $34,953 for men and $24,167 for women, a difference of 30.9%. Men with an educational attainment of bachelor's degree enjoy the highest average annual earnings of $95,994, while those with high school diploma education earn the least with $29,615. Women with an educational attainment of graduate degree earn the most with the average annual earnings of $61,250, while those with less than high school education have the smallest earnings of $20,370.
| Educational Attainment | Male Income | Female Income |
| Less than High School | $33,859 | $20,370 |
| High School Diploma | $29,615 | $25,426 |
| College or Associate's Degree | $39,034 | $22,243 |
| Bachelor's Degree | $95,994 | $40,144 |
| Graduate Degree | - | - |
| Total | $34,953 | $24,167 |
Family Income in La Follette
Family Income Brackets in La Follette
According to the La Follette family income data, there are 388 families falling into the $75,000 to $99,999 income range, which is the most common income bracket and makes up 20.4% of all families. Conversely, the $200,000+ income bracket is the least frequent group with only 21 families (1.1%) belonging to this category.
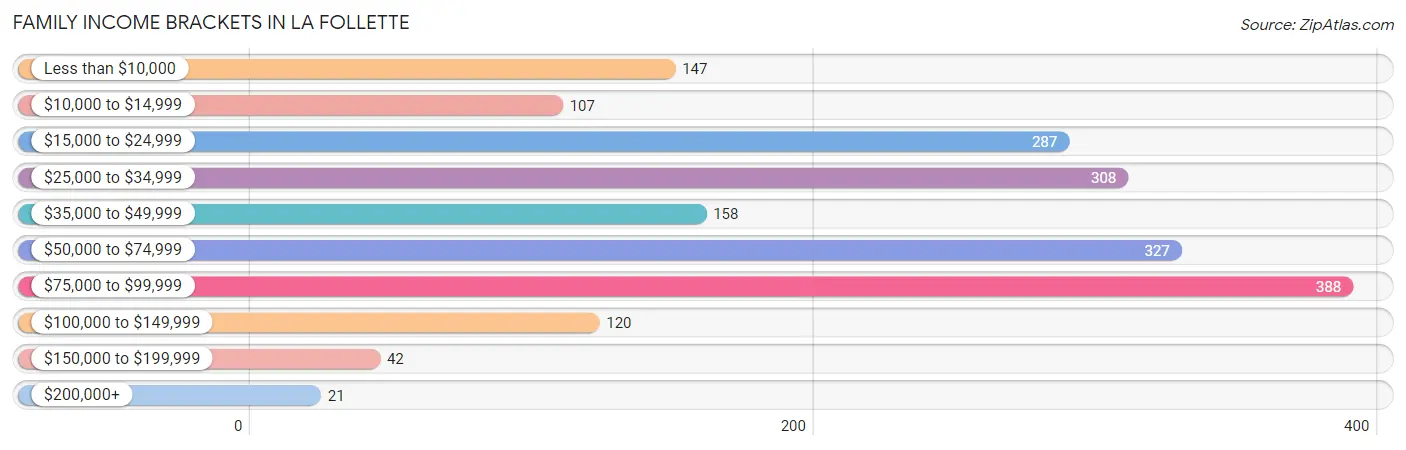
| Income Bracket | # Families | % Families |
| Less than $10,000 | 147 | 7.7% |
| $10,000 to $14,999 | 107 | 5.6% |
| $15,000 to $24,999 | 287 | 15.1% |
| $25,000 to $34,999 | 308 | 16.2% |
| $35,000 to $49,999 | 158 | 8.3% |
| $50,000 to $74,999 | 327 | 17.2% |
| $75,000 to $99,999 | 388 | 20.4% |
| $100,000 to $149,999 | 120 | 6.3% |
| $150,000 to $199,999 | 42 | 2.2% |
| $200,000+ | 21 | 1.1% |
Family Income by Famaliy Size in La Follette
4-person families (455 | 23.9%) account for the highest median family income in La Follette with $80,781 per family, while 4-person families (455 | 23.9%) have the highest median income of $20,195 per family member.
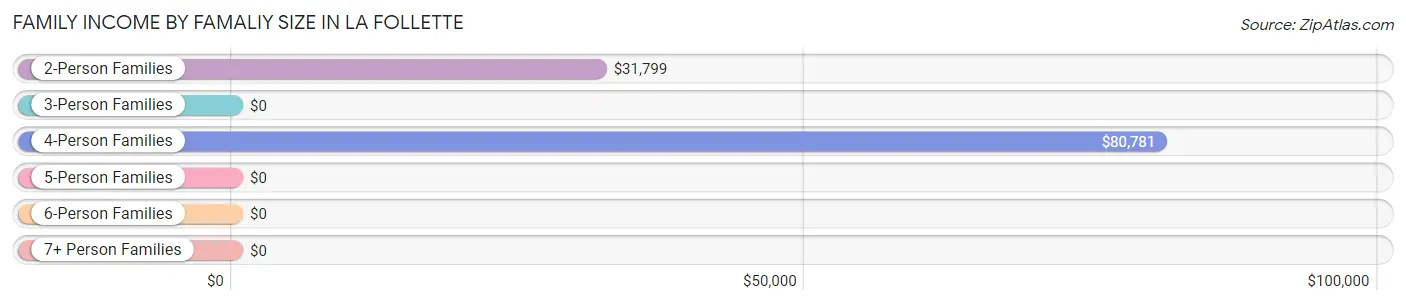
| Income Bracket | # Families | Median Income |
| 2-Person Families | 940 (49.4%) | $31,799 |
| 3-Person Families | 360 (18.9%) | $0 |
| 4-Person Families | 455 (23.9%) | $80,781 |
| 5-Person Families | 86 (4.5%) | $0 |
| 6-Person Families | 34 (1.8%) | $0 |
| 7+ Person Families | 28 (1.5%) | $0 |
| Total | 1,903 (100.0%) | $44,052 |
Family Income by Number of Earners in La Follette
The median family income in La Follette is $44,052, with families comprising 3+ earners (249) having the highest median family income of $91,250, while families with no earners (448) have the lowest median family income of $22,159, accounting for 13.1% and 23.5% of families, respectively.
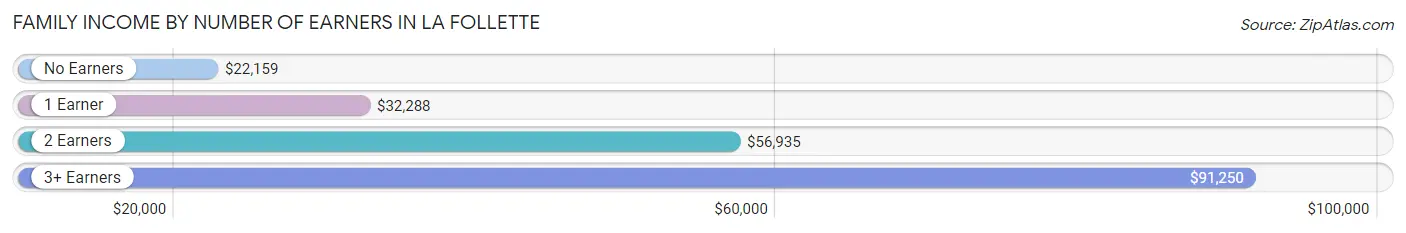
| Number of Earners | # Families | Median Income |
| No Earners | 448 (23.5%) | $22,159 |
| 1 Earner | 735 (38.6%) | $32,288 |
| 2 Earners | 471 (24.7%) | $56,935 |
| 3+ Earners | 249 (13.1%) | $91,250 |
| Total | 1,903 (100.0%) | $44,052 |
Household Income in La Follette
Household Income Brackets in La Follette
With 506 households falling in the category, the $15,000 to $24,999 income range is the most frequent in La Follette, accounting for 16.3% of all households. In contrast, only 22 households (0.7%) fall into the $200,000+ income bracket, making it the least populous group.
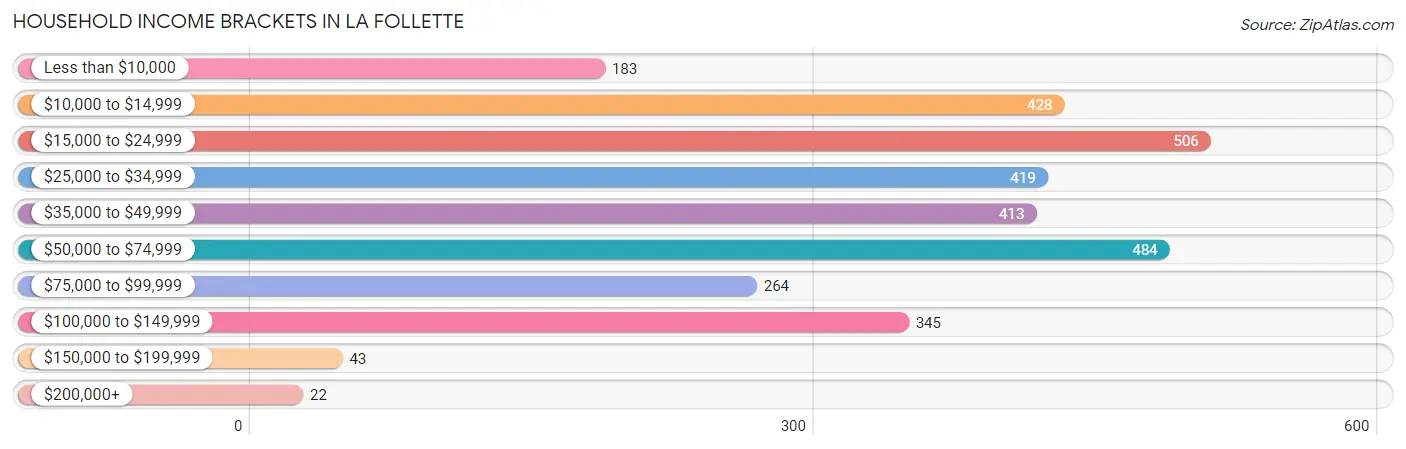
| Income Bracket | # Households | % Households |
| Less than $10,000 | 183 | 5.9% |
| $10,000 to $14,999 | 428 | 13.8% |
| $15,000 to $24,999 | 506 | 16.3% |
| $25,000 to $34,999 | 419 | 13.5% |
| $35,000 to $49,999 | 413 | 13.3% |
| $50,000 to $74,999 | 484 | 15.6% |
| $75,000 to $99,999 | 264 | 8.5% |
| $100,000 to $149,999 | 345 | 11.1% |
| $150,000 to $199,999 | 43 | 1.4% |
| $200,000+ | 22 | 0.7% |
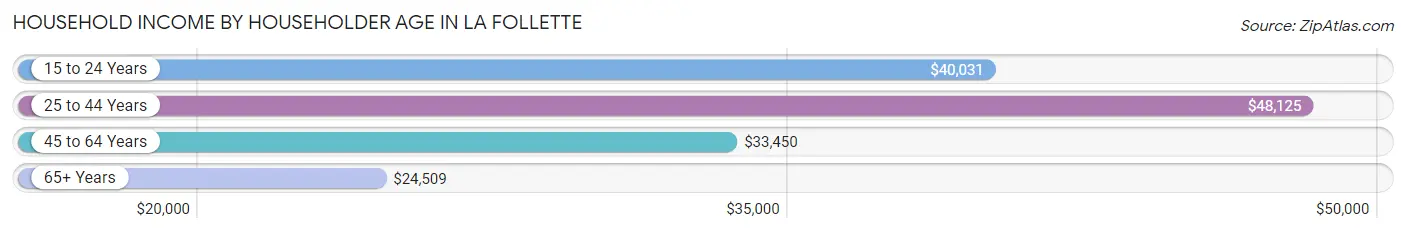
Household Income by Householder Age in La Follette
The median household income in La Follette is $35,705, with the highest median household income of $48,125 found in the 25 to 44 years age bracket for the primary householder. A total of 1,050 households (33.8%) fall into this category. Meanwhile, the 65+ years age bracket for the primary householder has the lowest median household income of $24,509, with 833 households (26.8%) in this group.
| Income Bracket | # Households | Median Income |
| 15 to 24 Years | 209 (6.7%) | $40,031 |
| 25 to 44 Years | 1,050 (33.8%) | $48,125 |
| 45 to 64 Years | 1,013 (32.6%) | $33,450 |
| 65+ Years | 833 (26.8%) | $24,509 |
| Total | 3,105 (100.0%) | $35,705 |
Poverty in La Follette
Income Below Poverty by Sex and Age in La Follette
With 30.1% poverty level for males and 32.4% for females among the residents of La Follette, under 5 year old males and 5 year old females are the most vulnerable to poverty, with 133 males (71.1%) and 23 females (67.6%) in their respective age groups living below the poverty level.
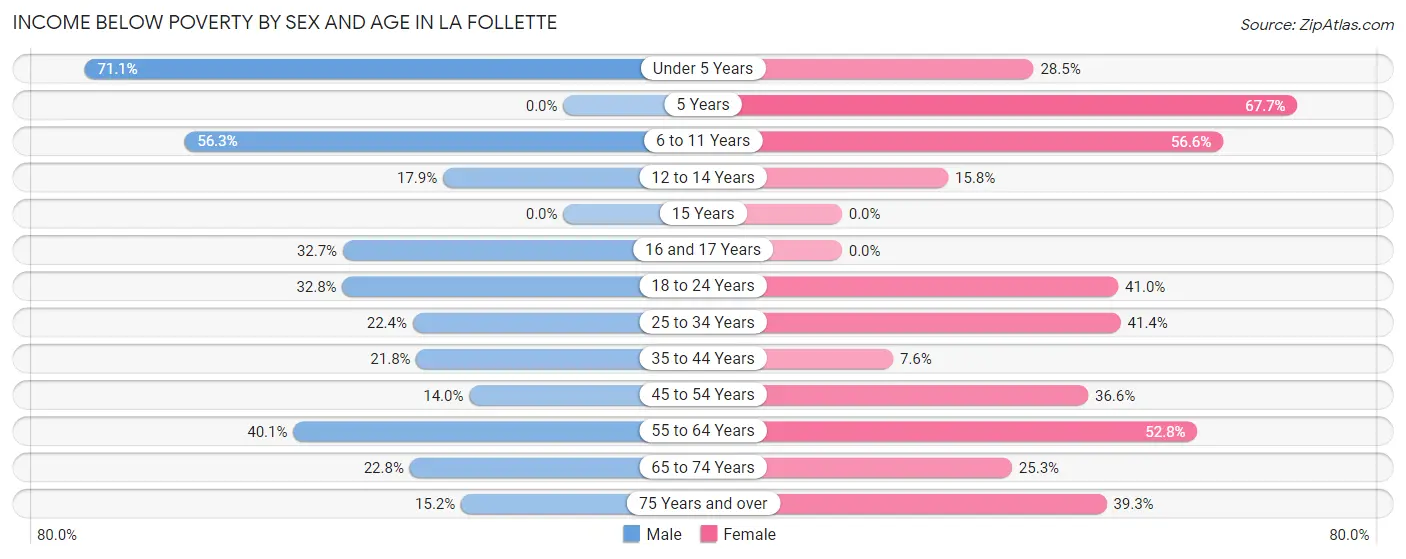
| Age Bracket | Male | Female |
| Under 5 Years | 133 (71.1%) | 74 (28.5%) |
| 5 Years | 0 (0.0%) | 23 (67.6%) |
| 6 to 11 Years | 112 (56.3%) | 124 (56.6%) |
| 12 to 14 Years | 20 (17.9%) | 6 (15.8%) |
| 15 Years | 0 (0.0%) | 0 (0.0%) |
| 16 and 17 Years | 36 (32.7%) | 0 (0.0%) |
| 18 to 24 Years | 144 (32.8%) | 142 (41.0%) |
| 25 to 34 Years | 74 (22.4%) | 231 (41.4%) |
| 35 to 44 Years | 79 (21.8%) | 44 (7.6%) |
| 45 to 54 Years | 57 (14.0%) | 181 (36.6%) |
| 55 to 64 Years | 164 (40.1%) | 198 (52.8%) |
| 65 to 74 Years | 73 (22.8%) | 99 (25.3%) |
| 75 Years and over | 17 (15.2%) | 134 (39.3%) |
| Total | 909 (30.1%) | 1,256 (32.4%) |
Income Above Poverty by Sex and Age in La Follette
According to the poverty statistics in La Follette, males aged 5 years and females aged 15 years are the age groups that are most secure financially, with 100.0% of males and 100.0% of females in these age groups living above the poverty line.
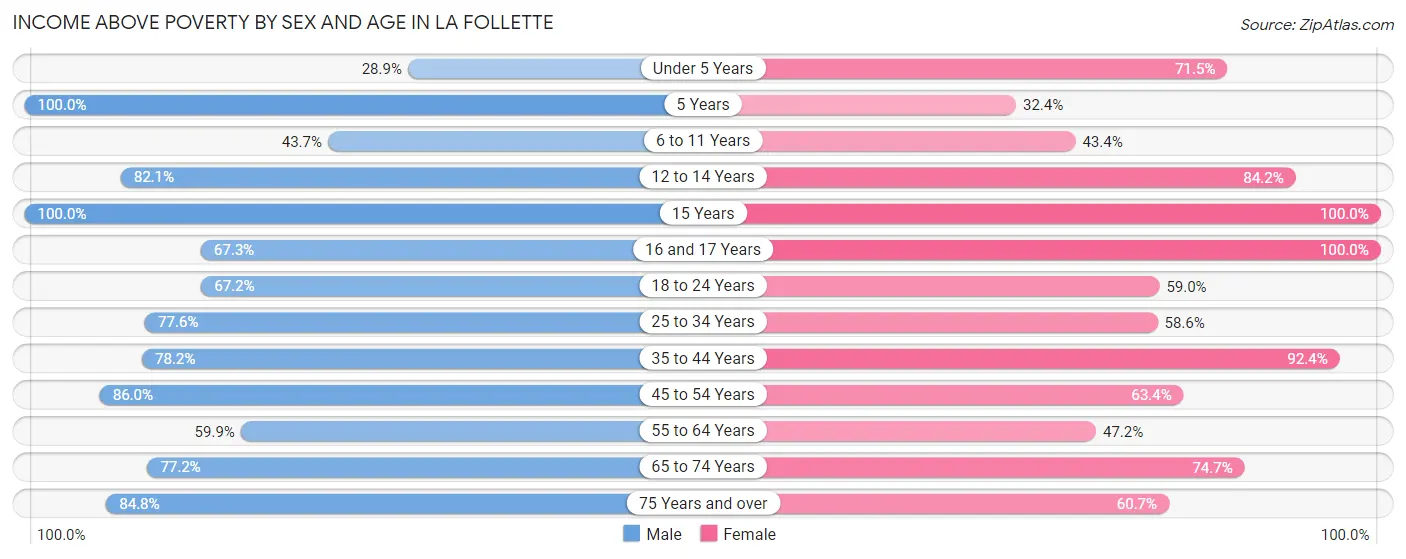
| Age Bracket | Male | Female |
| Under 5 Years | 54 (28.9%) | 186 (71.5%) |
| 5 Years | 18 (100.0%) | 11 (32.4%) |
| 6 to 11 Years | 87 (43.7%) | 95 (43.4%) |
| 12 to 14 Years | 92 (82.1%) | 32 (84.2%) |
| 15 Years | 13 (100.0%) | 115 (100.0%) |
| 16 and 17 Years | 74 (67.3%) | 130 (100.0%) |
| 18 to 24 Years | 295 (67.2%) | 204 (59.0%) |
| 25 to 34 Years | 257 (77.6%) | 327 (58.6%) |
| 35 to 44 Years | 283 (78.2%) | 534 (92.4%) |
| 45 to 54 Years | 351 (86.0%) | 314 (63.4%) |
| 55 to 64 Years | 245 (59.9%) | 177 (47.2%) |
| 65 to 74 Years | 247 (77.2%) | 293 (74.7%) |
| 75 Years and over | 95 (84.8%) | 207 (60.7%) |
| Total | 2,111 (69.9%) | 2,625 (67.6%) |
Income Below Poverty Among Married-Couple Families in La Follette
The poverty statistics for married-couple families in La Follette show that 12.2% or 99 of the total 812 families live below the poverty line. Families with no children have the highest poverty rate of 14.5%, comprising of 66 families. On the other hand, families with 3 or 4 children have the lowest poverty rate of 0.0%, which includes 0 families.
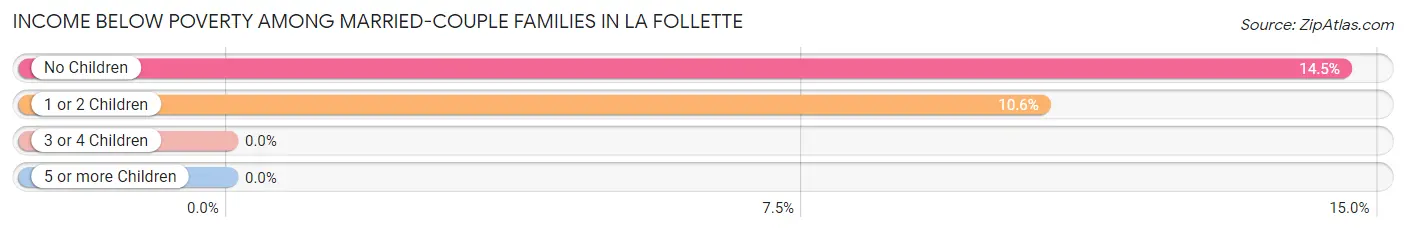
| Children | Above Poverty | Below Poverty |
| No Children | 388 (85.5%) | 66 (14.5%) |
| 1 or 2 Children | 278 (89.4%) | 33 (10.6%) |
| 3 or 4 Children | 26 (100.0%) | 0 (0.0%) |
| 5 or more Children | 21 (100.0%) | 0 (0.0%) |
| Total | 713 (87.8%) | 99 (12.2%) |
Income Below Poverty Among Single-Parent Households in La Follette
According to the poverty data in La Follette, 41.1% or 104 single-father households and 38.9% or 326 single-mother households are living below the poverty line. Among single-father households, those with 3 or 4 children have the highest poverty rate, with 26 households (100.0%) experiencing poverty. Likewise, among single-mother households, those with 3 or 4 children have the highest poverty rate, with 40 households (88.9%) falling below the poverty line.
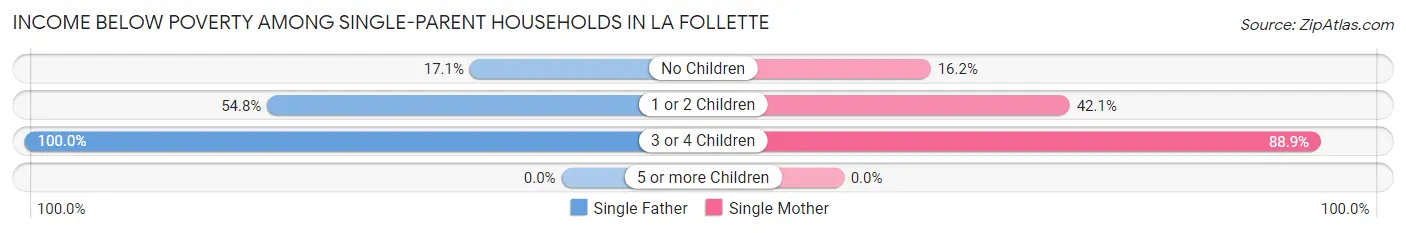
| Children | Single Father | Single Mother |
| No Children | 21 (17.1%) | 30 (16.2%) |
| 1 or 2 Children | 57 (54.8%) | 256 (42.1%) |
| 3 or 4 Children | 26 (100.0%) | 40 (88.9%) |
| 5 or more Children | 0 (0.0%) | 0 (0.0%) |
| Total | 104 (41.1%) | 326 (38.9%) |
Income Below Poverty Among Married-Couple vs Single-Parent Households in La Follette
The poverty data for La Follette shows that 99 of the married-couple family households (12.2%) and 430 of the single-parent households (39.4%) are living below the poverty level. Within the married-couple family households, those with no children have the highest poverty rate, with 66 households (14.5%) falling below the poverty line. Among the single-parent households, those with 3 or 4 children have the highest poverty rate, with 66 household (93.0%) living below poverty.
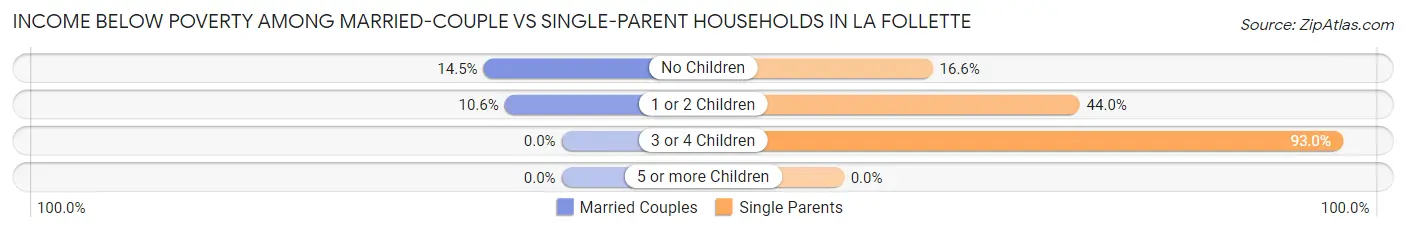
| Children | Married-Couple Families | Single-Parent Households |
| No Children | 66 (14.5%) | 51 (16.6%) |
| 1 or 2 Children | 33 (10.6%) | 313 (44.0%) |
| 3 or 4 Children | 0 (0.0%) | 66 (93.0%) |
| 5 or more Children | 0 (0.0%) | 0 (0.0%) |
| Total | 99 (12.2%) | 430 (39.4%) |
Race in La Follette
The most populous races in La Follette are White / Caucasian (6,787 | 92.3%), Two or more Races (383 | 5.2%), and Hispanic or Latino (343 | 4.7%).
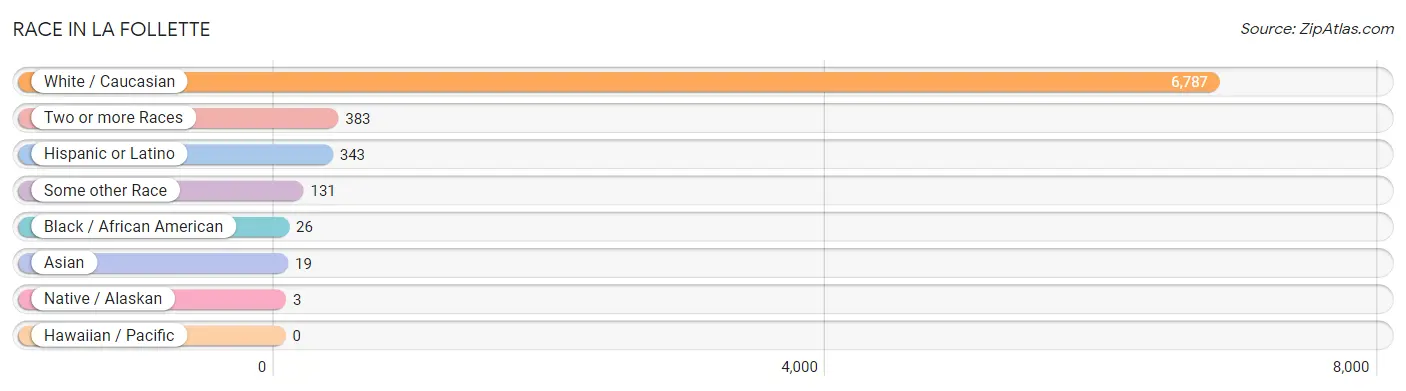
| Race | # Population | % Population |
| Asian | 19 | 0.3% |
| Black / African American | 26 | 0.4% |
| Hawaiian / Pacific | 0 | 0.0% |
| Hispanic or Latino | 343 | 4.7% |
| Native / Alaskan | 3 | 0.0% |
| White / Caucasian | 6,787 | 92.3% |
| Two or more Races | 383 | 5.2% |
| Some other Race | 131 | 1.8% |
| Total | 7,349 | 100.0% |
Ancestry in La Follette
The most populous ancestries reported in La Follette are Irish (638 | 8.7%), German (604 | 8.2%), American (599 | 8.2%), Scottish (478 | 6.5%), and English (402 | 5.5%), together accounting for 37.0% of all La Follette residents.
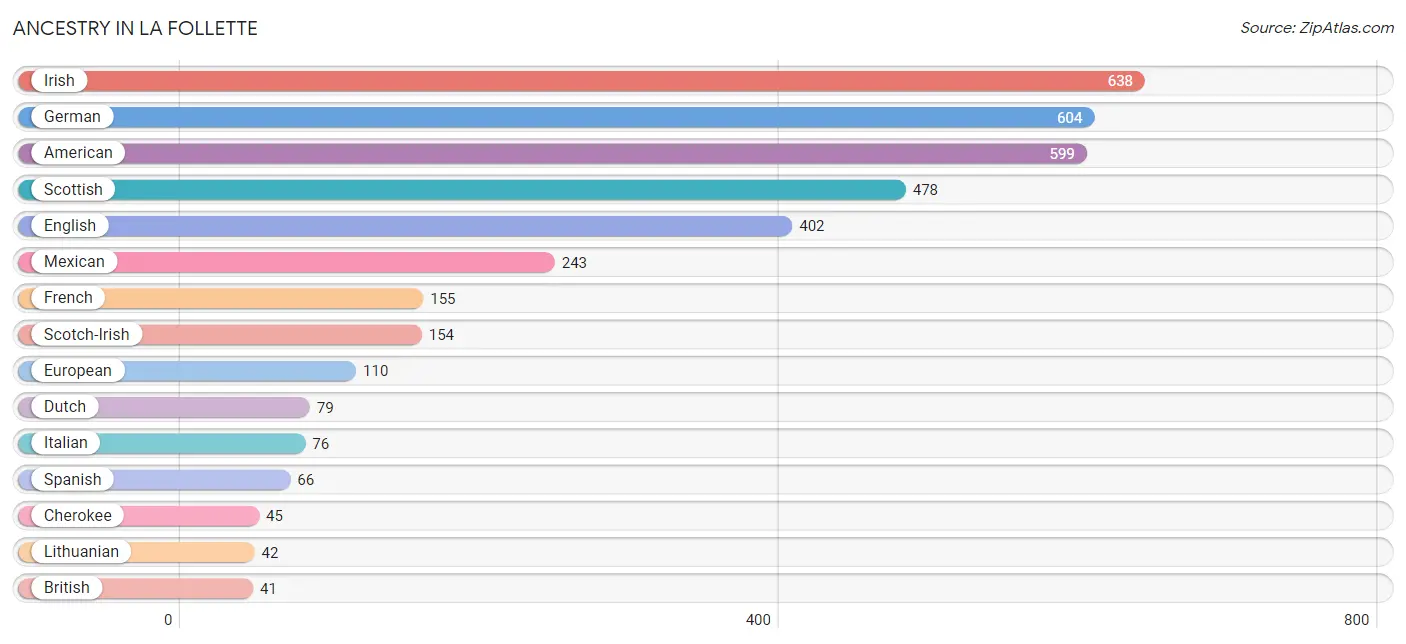
| Ancestry | # Population | % Population |
| American | 599 | 8.2% |
| Arab | 7 | 0.1% |
| British | 41 | 0.6% |
| Canadian | 11 | 0.2% |
| Central American | 23 | 0.3% |
| Cherokee | 45 | 0.6% |
| Creek | 3 | 0.0% |
| Dutch | 79 | 1.1% |
| English | 402 | 5.5% |
| European | 110 | 1.5% |
| French | 155 | 2.1% |
| French Canadian | 10 | 0.1% |
| German | 604 | 8.2% |
| Greek | 11 | 0.2% |
| Guatemalan | 23 | 0.3% |
| Indian (Asian) | 6 | 0.1% |
| Inupiat | 5 | 0.1% |
| Irish | 638 | 8.7% |
| Italian | 76 | 1.0% |
| Lithuanian | 42 | 0.6% |
| Malaysian | 13 | 0.2% |
| Mexican | 243 | 3.3% |
| Moroccan | 7 | 0.1% |
| Polish | 14 | 0.2% |
| Puerto Rican | 6 | 0.1% |
| Russian | 10 | 0.1% |
| Scandinavian | 9 | 0.1% |
| Scotch-Irish | 154 | 2.1% |
| Scottish | 478 | 6.5% |
| South American | 5 | 0.1% |
| Spanish | 66 | 0.9% |
| Subsaharan African | 18 | 0.2% |
| Swedish | 5 | 0.1% |
| Venezuelan | 5 | 0.1% | View All 34 Rows |
Immigrants in La Follette
The most numerous immigrant groups reported in La Follette came from Latin America (94 | 1.3%), Central America (89 | 1.2%), Mexico (66 | 0.9%), Guatemala (23 | 0.3%), and Asia (13 | 0.2%), together accounting for 3.9% of all La Follette residents.
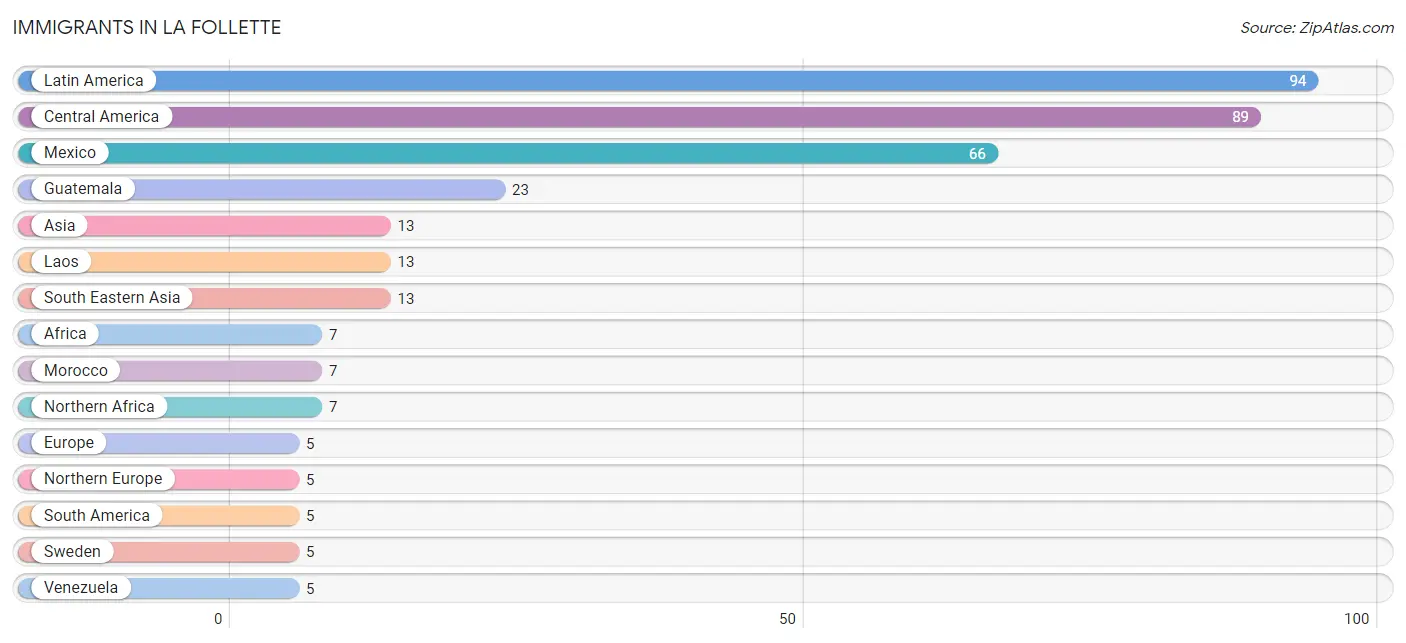
| Immigration Origin | # Population | % Population |
| Africa | 7 | 0.1% |
| Asia | 13 | 0.2% |
| Central America | 89 | 1.2% |
| Europe | 5 | 0.1% |
| Guatemala | 23 | 0.3% |
| Laos | 13 | 0.2% |
| Latin America | 94 | 1.3% |
| Mexico | 66 | 0.9% |
| Morocco | 7 | 0.1% |
| Northern Africa | 7 | 0.1% |
| Northern Europe | 5 | 0.1% |
| South America | 5 | 0.1% |
| South Eastern Asia | 13 | 0.2% |
| Sweden | 5 | 0.1% |
| Venezuela | 5 | 0.1% | View All 15 Rows |
Sex and Age in La Follette
Sex and Age in La Follette
The most populous age groups in La Follette are 20 to 24 Years (345 | 10.9%) for men and 35 to 39 Years (432 | 10.3%) for women.
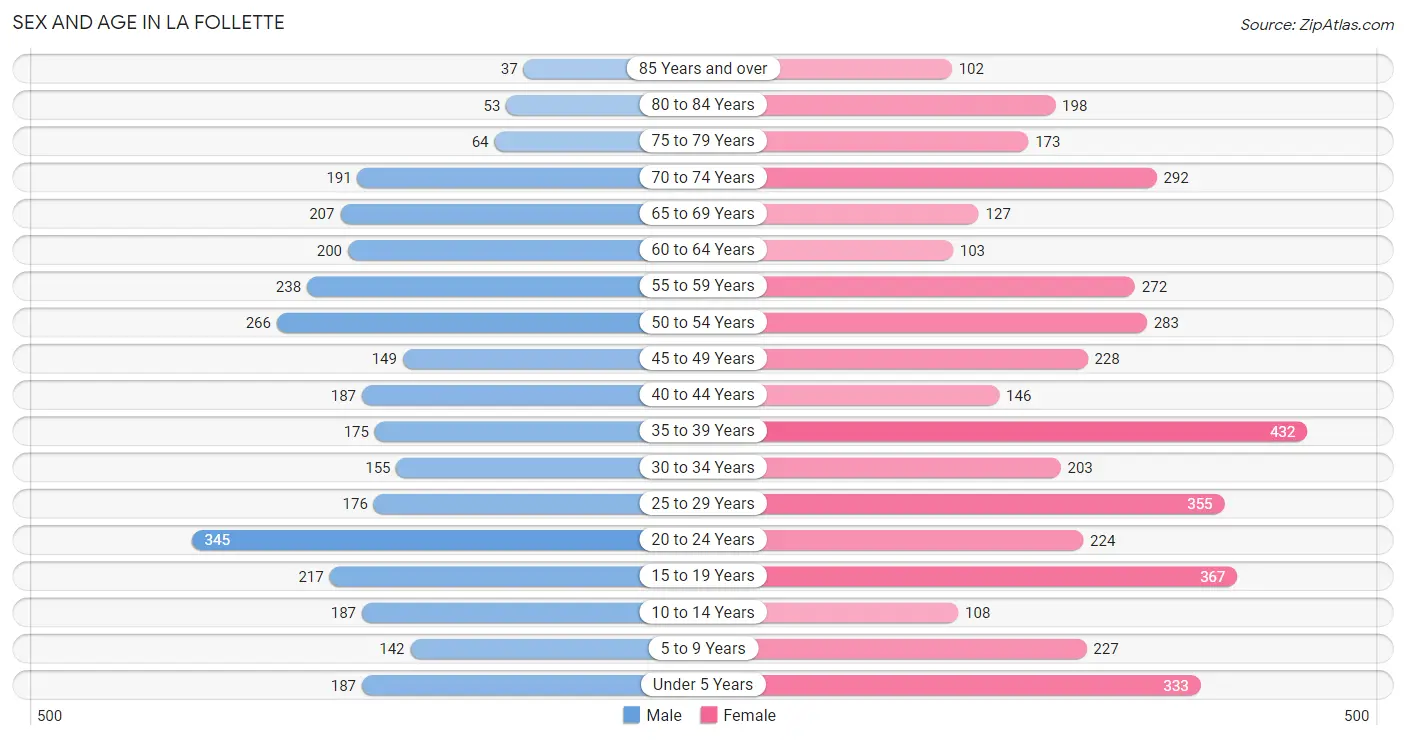
| Age Bracket | Male | Female |
| Under 5 Years | 187 (5.9%) | 333 (8.0%) |
| 5 to 9 Years | 142 (4.5%) | 227 (5.4%) |
| 10 to 14 Years | 187 (5.9%) | 108 (2.6%) |
| 15 to 19 Years | 217 (6.8%) | 367 (8.8%) |
| 20 to 24 Years | 345 (10.9%) | 224 (5.4%) |
| 25 to 29 Years | 176 (5.5%) | 355 (8.5%) |
| 30 to 34 Years | 155 (4.9%) | 203 (4.9%) |
| 35 to 39 Years | 175 (5.5%) | 432 (10.3%) |
| 40 to 44 Years | 187 (5.9%) | 146 (3.5%) |
| 45 to 49 Years | 149 (4.7%) | 228 (5.5%) |
| 50 to 54 Years | 266 (8.4%) | 283 (6.8%) |
| 55 to 59 Years | 238 (7.5%) | 272 (6.5%) |
| 60 to 64 Years | 200 (6.3%) | 103 (2.5%) |
| 65 to 69 Years | 207 (6.5%) | 127 (3.0%) |
| 70 to 74 Years | 191 (6.0%) | 292 (7.0%) |
| 75 to 79 Years | 64 (2.0%) | 173 (4.2%) |
| 80 to 84 Years | 53 (1.7%) | 198 (4.7%) |
| 85 Years and over | 37 (1.2%) | 102 (2.4%) |
| Total | 3,176 (100.0%) | 4,173 (100.0%) |
Families and Households in La Follette
Median Family Size in La Follette
The median family size in La Follette is 2.71 persons per family, with married-couple families (812 | 42.7%) accounting for the largest median family size of 3.05 persons per family. On the other hand, single male/father families (253 | 13.3%) represent the smallest median family size with 2.21 persons per family.
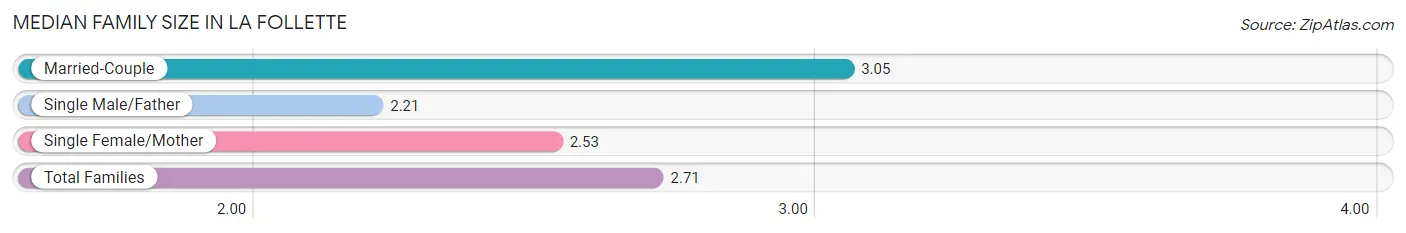
| Family Type | # Families | Family Size |
| Married-Couple | 812 (42.7%) | 3.05 |
| Single Male/Father | 253 (13.3%) | 2.21 |
| Single Female/Mother | 838 (44.0%) | 2.53 |
| Total Families | 1,903 (100.0%) | 2.71 |
Median Household Size in La Follette
The median household size in La Follette is 2.26 persons per household, with married-couple households (812 | 26.2%) accounting for the largest median household size of 3.08 persons per household. non-family households (1,202 | 38.7%) represent the smallest median household size with 1.41 persons per household.
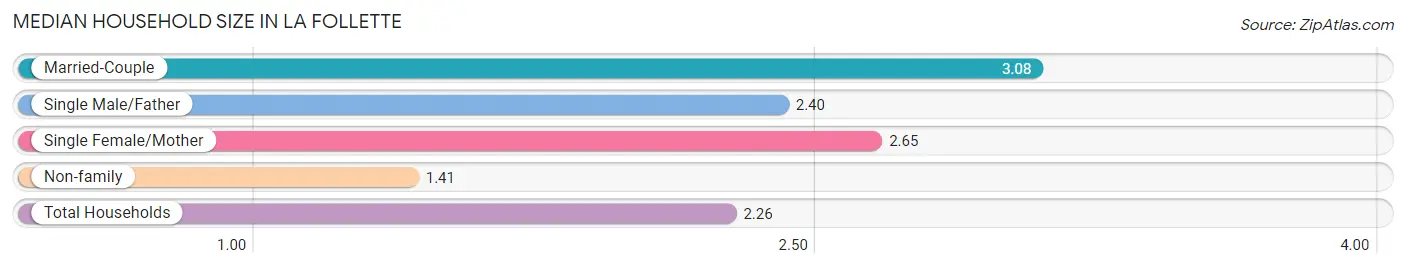
| Household Type | # Households | Household Size |
| Married-Couple | 812 (26.2%) | 3.08 |
| Single Male/Father | 253 (8.2%) | 2.40 |
| Single Female/Mother | 838 (27.0%) | 2.65 |
| Non-family | 1,202 (38.7%) | 1.41 |
| Total Households | 3,105 (100.0%) | 2.26 |
Household Size by Marriage Status in La Follette
Out of a total of 3,105 households in La Follette, 1,903 (61.3%) are family households, while 1,202 (38.7%) are nonfamily households. The most numerous type of family households are 2-person households, comprising 869, and the most common type of nonfamily households are 1-person households, comprising 890.
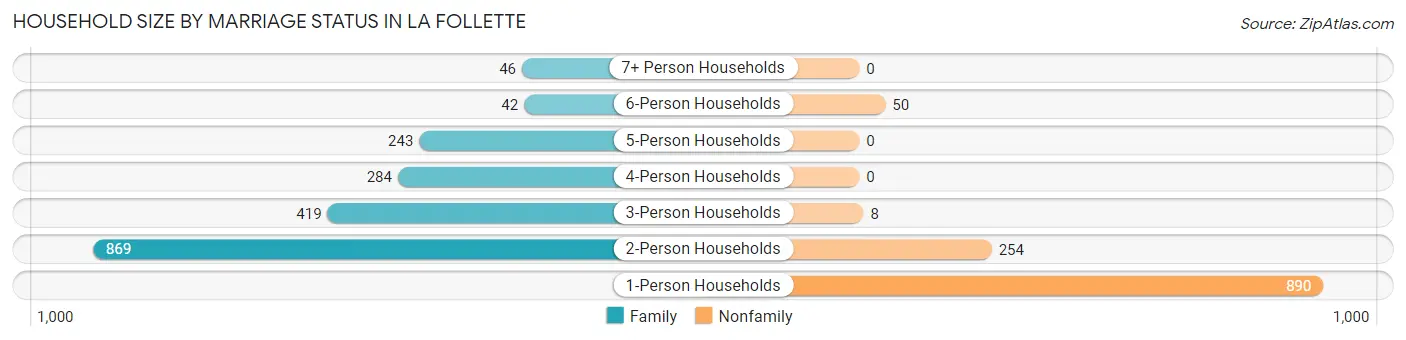
| Household Size | Family Households | Nonfamily Households |
| 1-Person Households | - | 890 (28.7%) |
| 2-Person Households | 869 (28.0%) | 254 (8.2%) |
| 3-Person Households | 419 (13.5%) | 8 (0.3%) |
| 4-Person Households | 284 (9.1%) | 0 (0.0%) |
| 5-Person Households | 243 (7.8%) | 0 (0.0%) |
| 6-Person Households | 42 (1.3%) | 50 (1.6%) |
| 7+ Person Households | 46 (1.5%) | 0 (0.0%) |
| Total | 1,903 (61.3%) | 1,202 (38.7%) |
Female Fertility in La Follette
Fertility by Age in La Follette
Average fertility rate in La Follette is 95.0 births per 1,000 women. Women in the age bracket of 20 to 34 years have the highest fertility rate with 221.0 births per 1,000 women. Women in the age bracket of 20 to 34 years acount for 91.0% of all women with births.
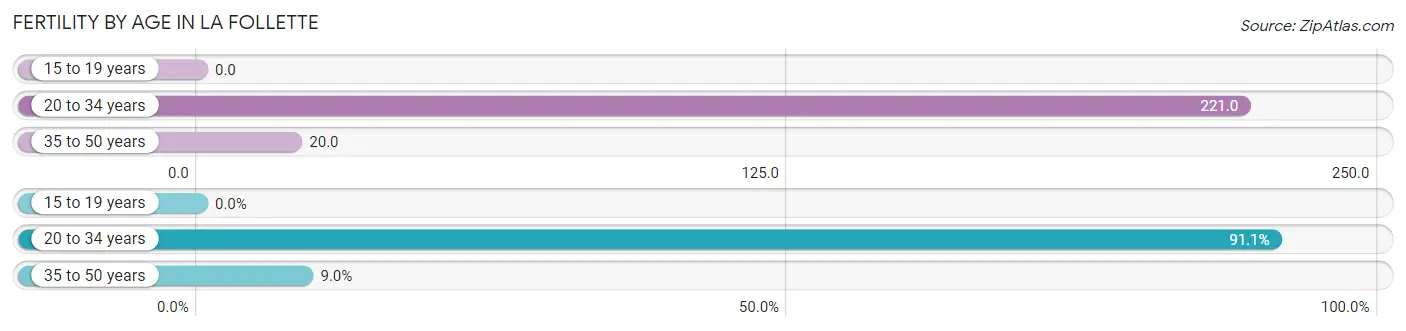
| Age Bracket | Women with Births | Births / 1,000 Women |
| 15 to 19 years | 0 (0.0%) | 0.0 |
| 20 to 34 years | 173 (91.0%) | 221.0 |
| 35 to 50 years | 17 (8.9%) | 20.0 |
| Total | 190 (100.0%) | 95.0 |
Fertility by Age by Marriage Status in La Follette
34.7% of women with births (190) in La Follette are married. The highest percentage of unmarried women with births falls into 35 to 50 years age bracket with 100.0% of them unmarried at the time of birth, while the lowest percentage of unmarried women with births belong to 20 to 34 years age bracket with 61.9% of them unmarried.
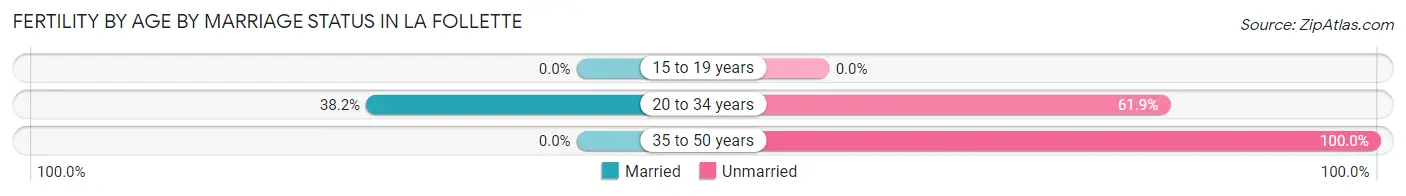
| Age Bracket | Married | Unmarried |
| 15 to 19 years | 0 (0.0%) | 0 (0.0%) |
| 20 to 34 years | 66 (38.2%) | 107 (61.9%) |
| 35 to 50 years | 0 (0.0%) | 17 (100.0%) |
| Total | 66 (34.7%) | 124 (65.3%) |
Fertility by Education in La Follette
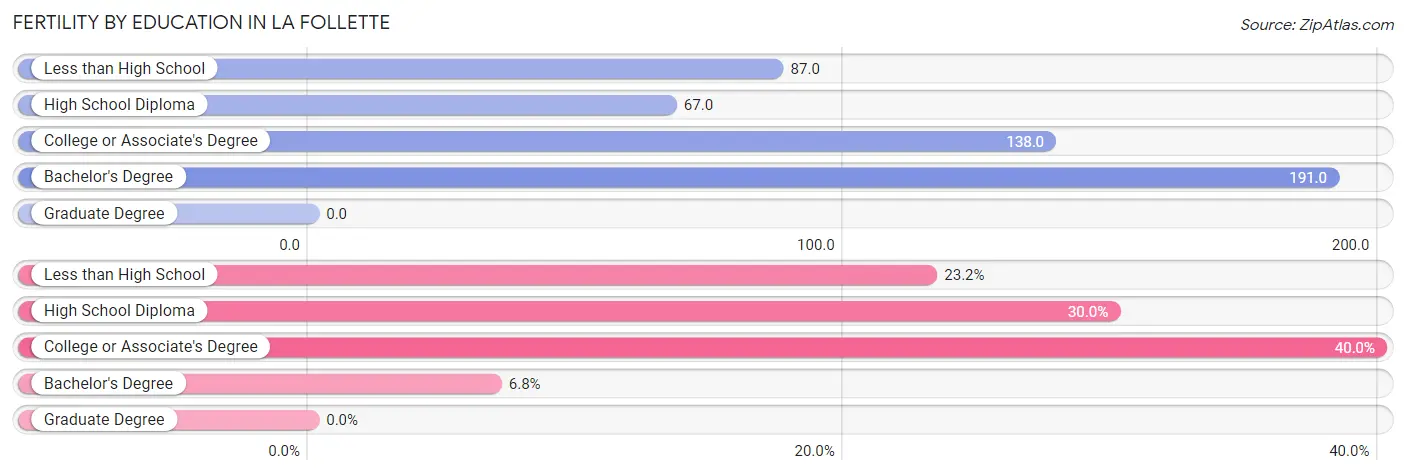
| Educational Attainment | Women with Births | Births / 1,000 Women |
| Less than High School | 44 (23.2%) | 87.0 |
| High School Diploma | 57 (30.0%) | 67.0 |
| College or Associate's Degree | 76 (40.0%) | 138.0 |
| Bachelor's Degree | 13 (6.8%) | 191.0 |
| Graduate Degree | 0 (0.0%) | 0.0 |
| Total | 190 (100.0%) | 95.0 |
Fertility by Education by Marriage Status in La Follette
65.3% of women with births in La Follette are unmarried. Women with the educational attainment of bachelor's degree are most likely to be married with 100.0% of them married at childbirth, while women with the educational attainment of high school diploma are least likely to be married with 89.5% of them unmarried at childbirth.
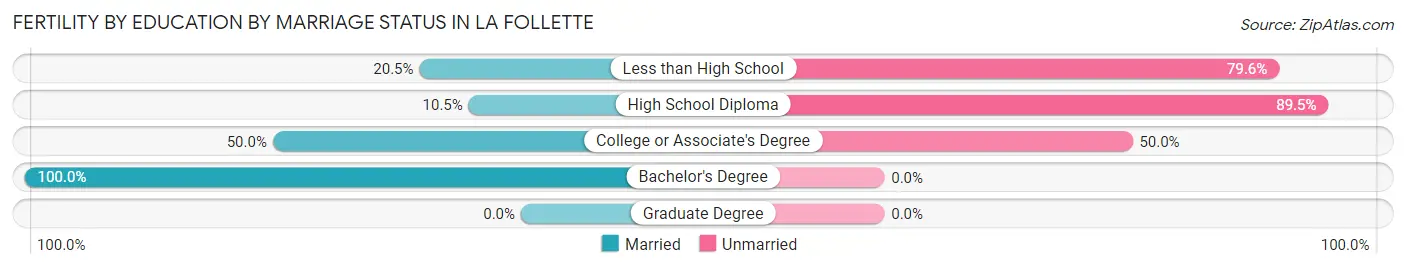
| Educational Attainment | Married | Unmarried |
| Less than High School | 9 (20.4%) | 35 (79.5%) |
| High School Diploma | 6 (10.5%) | 51 (89.5%) |
| College or Associate's Degree | 38 (50.0%) | 38 (50.0%) |
| Bachelor's Degree | 13 (100.0%) | 0 (0.0%) |
| Graduate Degree | 0 (0.0%) | 0 (0.0%) |
| Total | 66 (34.7%) | 124 (65.3%) |
Employment Characteristics in La Follette
Employment by Class of Employer in La Follette
Among the 2,588 employed individuals in La Follette, private company employees (1,969 | 76.1%), local government employees (217 | 8.4%), and self-employed (not incorporated) (168 | 6.5%) make up the most common classes of employment.
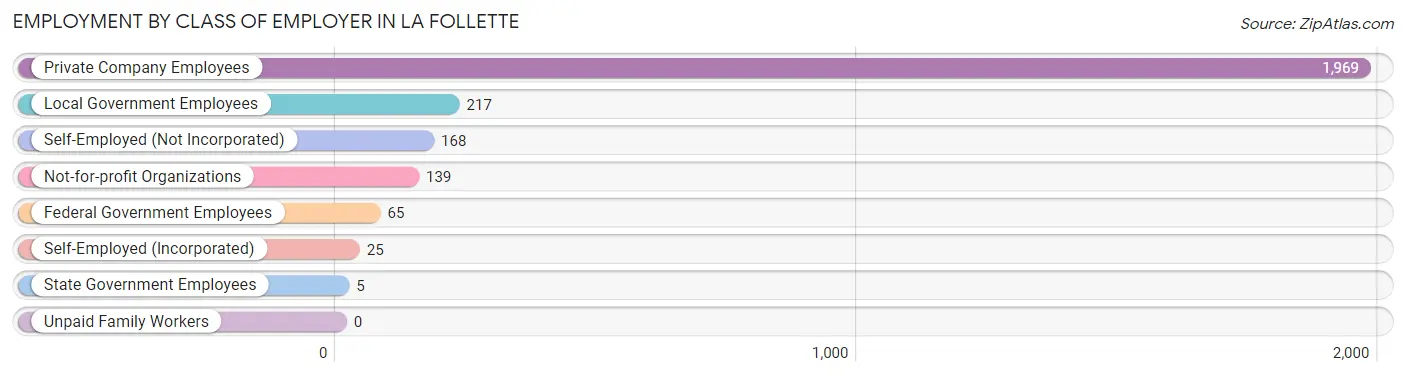
| Employer Class | # Employees | % Employees |
| Private Company Employees | 1,969 | 76.1% |
| Self-Employed (Incorporated) | 25 | 1.0% |
| Self-Employed (Not Incorporated) | 168 | 6.5% |
| Not-for-profit Organizations | 139 | 5.4% |
| Local Government Employees | 217 | 8.4% |
| State Government Employees | 5 | 0.2% |
| Federal Government Employees | 65 | 2.5% |
| Unpaid Family Workers | 0 | 0.0% |
| Total | 2,588 | 100.0% |
Employment Status by Age in La Follette
According to the labor force statistics for La Follette, out of the total population over 16 years of age (6,037), 50.5% or 3,049 individuals are in the labor force, with 12.5% or 381 of them unemployed. The age group with the highest labor force participation rate is 35 to 44 years, with 85.5% or 804 individuals in the labor force. Within the labor force, the 55 to 59 years age range has the highest percentage of unemployed individuals, with 36.8% or 92 of them being unemployed.
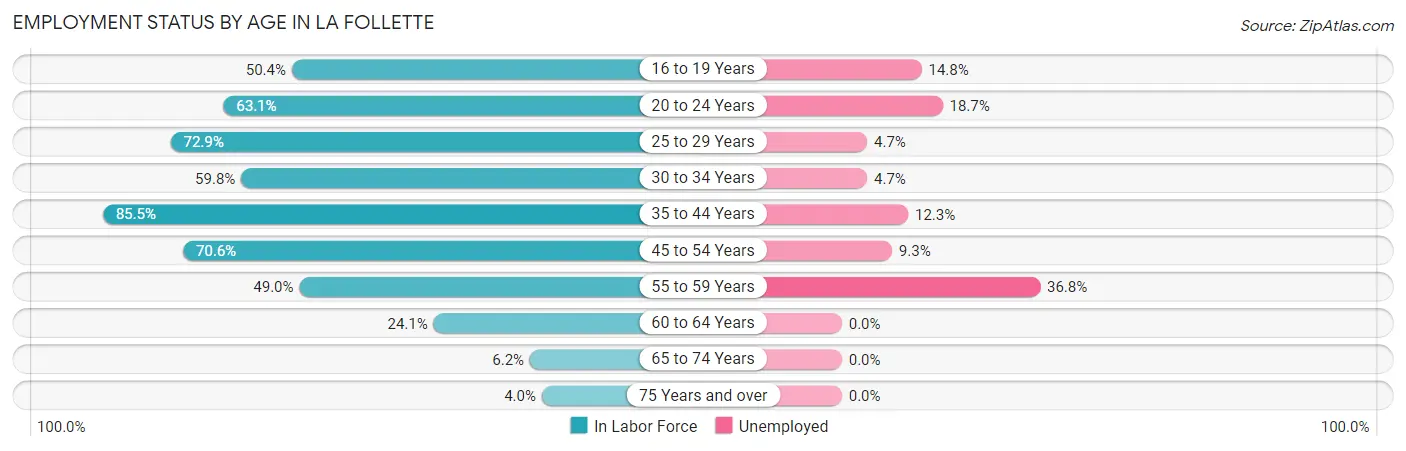
| Age Bracket | In Labor Force | Unemployed |
| 16 to 19 Years | 230 (50.4%) | 34 (14.8%) |
| 20 to 24 Years | 359 (63.1%) | 67 (18.7%) |
| 25 to 29 Years | 387 (72.9%) | 18 (4.7%) |
| 30 to 34 Years | 214 (59.8%) | 10 (4.7%) |
| 35 to 44 Years | 804 (85.5%) | 99 (12.3%) |
| 45 to 54 Years | 654 (70.6%) | 61 (9.3%) |
| 55 to 59 Years | 250 (49.0%) | 92 (36.8%) |
| 60 to 64 Years | 73 (24.1%) | 0 (0.0%) |
| 65 to 74 Years | 51 (6.2%) | 0 (0.0%) |
| 75 Years and over | 25 (4.0%) | 0 (0.0%) |
| Total | 3,049 (50.5%) | 381 (12.5%) |
Employment Status by Educational Attainment in La Follette
According to labor force statistics for La Follette, 66.8% of individuals (2,383) out of the total population between 25 and 64 years of age (3,568) are in the labor force, with 11.8% or 281 of them being unemployed. The group with the highest labor force participation rate are those with the educational attainment of bachelor's degree or higher, with 92.5% or 185 individuals in the labor force. Within the labor force, individuals with less than high school education have the highest percentage of unemployment, with 28.9% or 95 of them being unemployed.
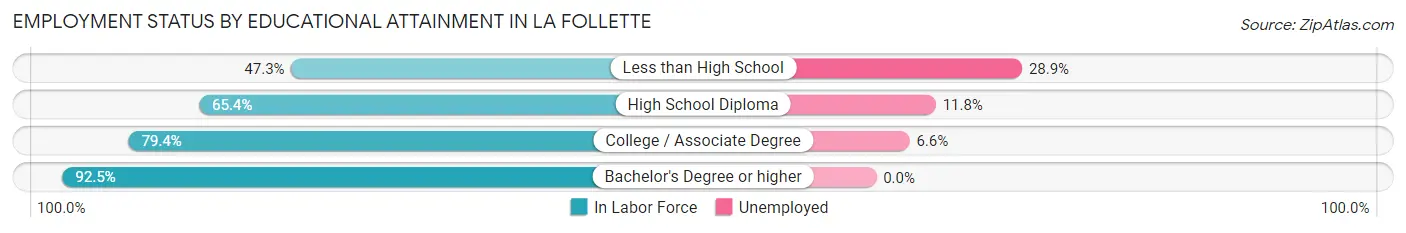
| Educational Attainment | In Labor Force | Unemployed |
| Less than High School | 329 (47.3%) | 201 (28.9%) |
| High School Diploma | 1,188 (65.4%) | 214 (11.8%) |
| College / Associate Degree | 680 (79.4%) | 56 (6.6%) |
| Bachelor's Degree or higher | 185 (92.5%) | 0 (0.0%) |
| Total | 2,383 (66.8%) | 421 (11.8%) |
Employment Occupations by Sex in La Follette
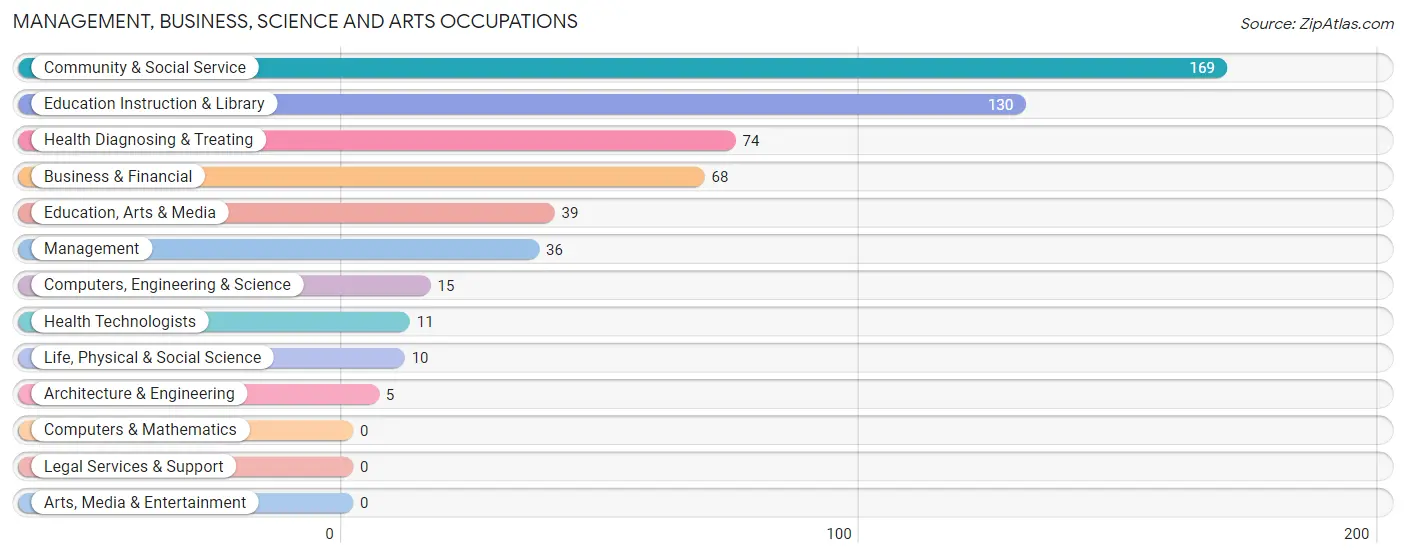
Management, Business, Science and Arts Occupations
The most common Management, Business, Science and Arts occupations in La Follette are Community & Social Service (169 | 6.3%), Education Instruction & Library (130 | 4.9%), Health Diagnosing & Treating (74 | 2.8%), Business & Financial (68 | 2.5%), and Education, Arts & Media (39 | 1.5%).
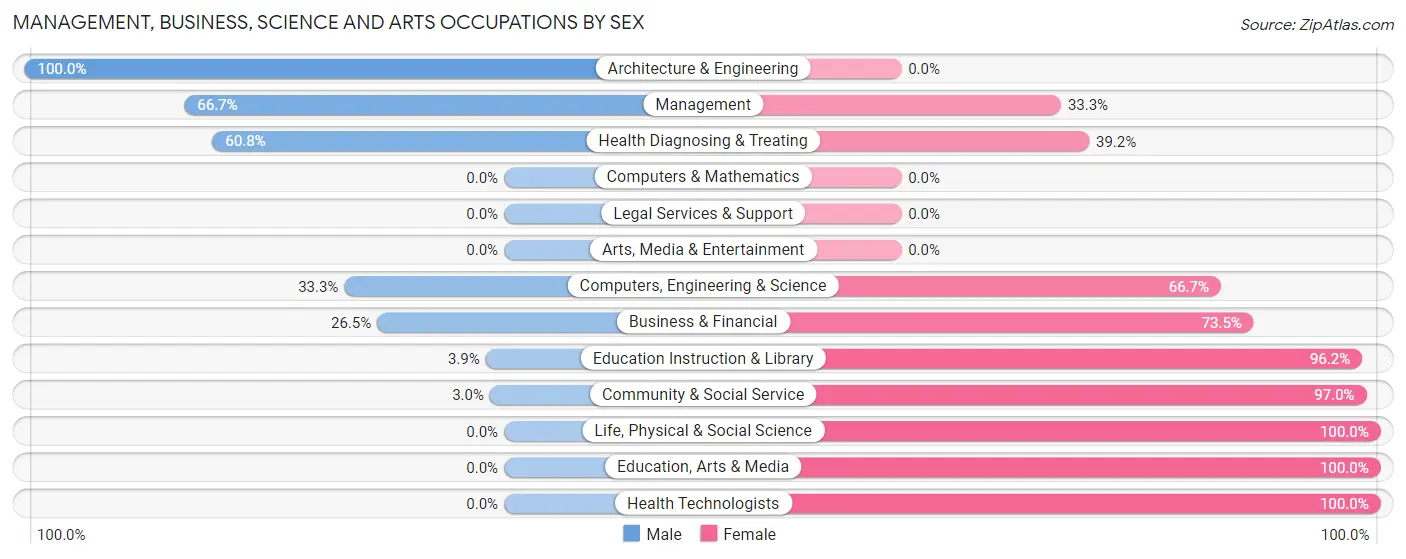
Management, Business, Science and Arts Occupations by Sex
Within the Management, Business, Science and Arts occupations in La Follette, the most male-oriented occupations are Architecture & Engineering (100.0%), Management (66.7%), and Health Diagnosing & Treating (60.8%), while the most female-oriented occupations are Life, Physical & Social Science (100.0%), Education, Arts & Media (100.0%), and Health Technologists (100.0%).
| Occupation | Male | Female |
| Management | 24 (66.7%) | 12 (33.3%) |
| Business & Financial | 18 (26.5%) | 50 (73.5%) |
| Computers, Engineering & Science | 5 (33.3%) | 10 (66.7%) |
| Computers & Mathematics | 0 (0.0%) | 0 (0.0%) |
| Architecture & Engineering | 5 (100.0%) | 0 (0.0%) |
| Life, Physical & Social Science | 0 (0.0%) | 10 (100.0%) |
| Community & Social Service | 5 (3.0%) | 164 (97.0%) |
| Education, Arts & Media | 0 (0.0%) | 39 (100.0%) |
| Legal Services & Support | 0 (0.0%) | 0 (0.0%) |
| Education Instruction & Library | 5 (3.8%) | 125 (96.2%) |
| Arts, Media & Entertainment | 0 (0.0%) | 0 (0.0%) |
| Health Diagnosing & Treating | 45 (60.8%) | 29 (39.2%) |
| Health Technologists | 0 (0.0%) | 11 (100.0%) |
| Total (Category) | 97 (26.8%) | 265 (73.2%) |
| Total (Overall) | 1,194 (44.8%) | 1,472 (55.2%) |
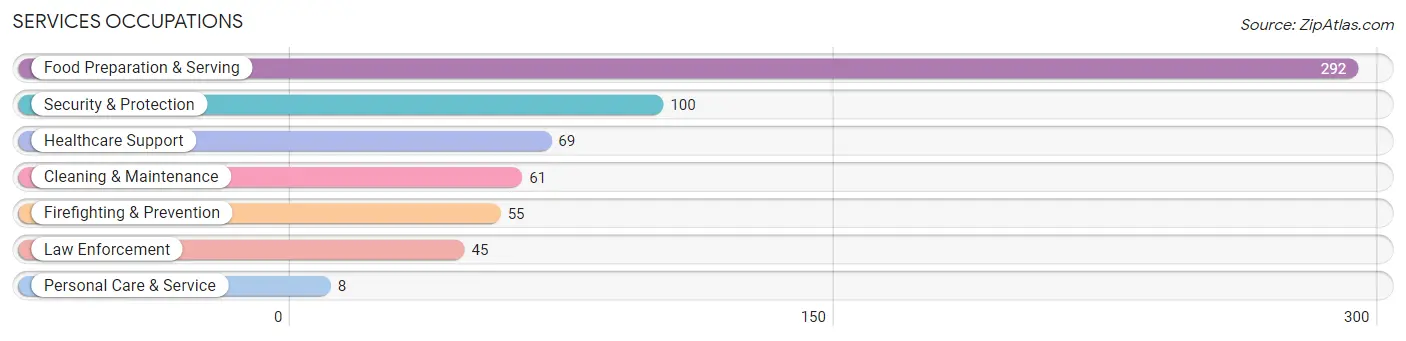
Services Occupations
The most common Services occupations in La Follette are Food Preparation & Serving (292 | 11.0%), Security & Protection (100 | 3.7%), Healthcare Support (69 | 2.6%), Cleaning & Maintenance (61 | 2.3%), and Firefighting & Prevention (55 | 2.1%).
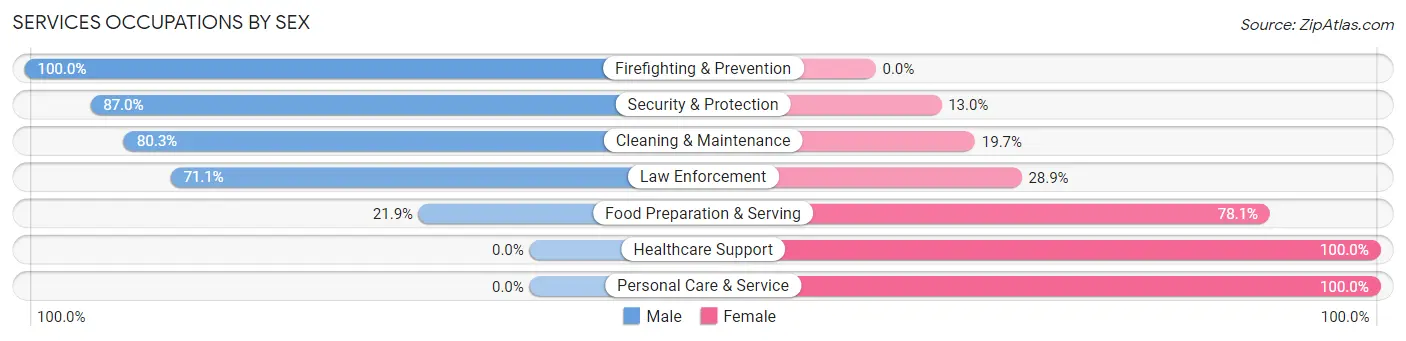
Services Occupations by Sex
Within the Services occupations in La Follette, the most male-oriented occupations are Firefighting & Prevention (100.0%), Security & Protection (87.0%), and Cleaning & Maintenance (80.3%), while the most female-oriented occupations are Healthcare Support (100.0%), Personal Care & Service (100.0%), and Food Preparation & Serving (78.1%).
| Occupation | Male | Female |
| Healthcare Support | 0 (0.0%) | 69 (100.0%) |
| Security & Protection | 87 (87.0%) | 13 (13.0%) |
| Firefighting & Prevention | 55 (100.0%) | 0 (0.0%) |
| Law Enforcement | 32 (71.1%) | 13 (28.9%) |
| Food Preparation & Serving | 64 (21.9%) | 228 (78.1%) |
| Cleaning & Maintenance | 49 (80.3%) | 12 (19.7%) |
| Personal Care & Service | 0 (0.0%) | 8 (100.0%) |
| Total (Category) | 200 (37.7%) | 330 (62.3%) |
| Total (Overall) | 1,194 (44.8%) | 1,472 (55.2%) |
Sales and Office Occupations
The most common Sales and Office occupations in La Follette are Sales & Related (309 | 11.6%), and Office & Administration (303 | 11.4%).
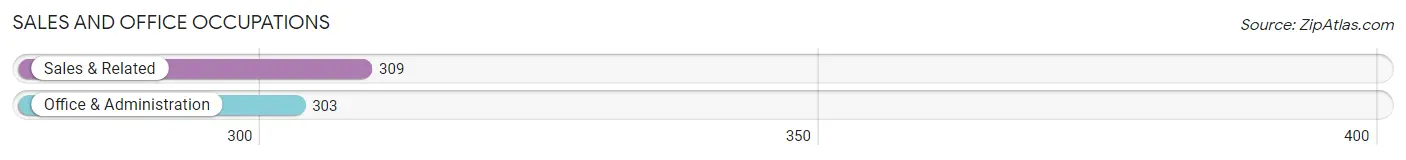
Sales and Office Occupations by Sex
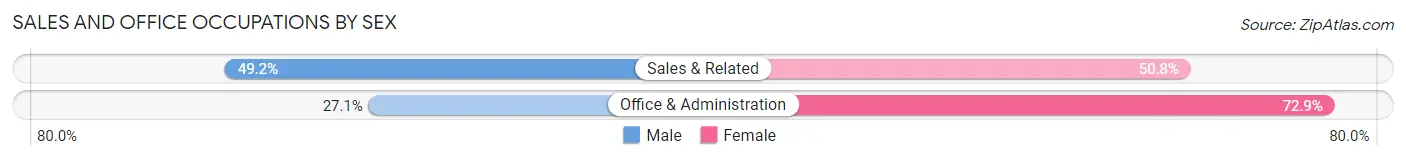
| Occupation | Male | Female |
| Sales & Related | 152 (49.2%) | 157 (50.8%) |
| Office & Administration | 82 (27.1%) | 221 (72.9%) |
| Total (Category) | 234 (38.2%) | 378 (61.8%) |
| Total (Overall) | 1,194 (44.8%) | 1,472 (55.2%) |
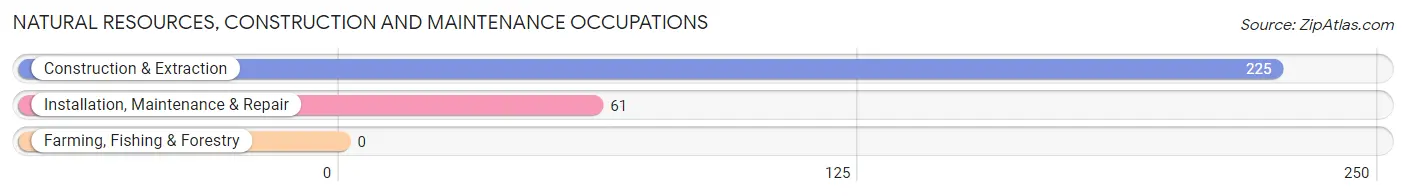
Natural Resources, Construction and Maintenance Occupations
The most common Natural Resources, Construction and Maintenance occupations in La Follette are Construction & Extraction (225 | 8.4%), and Installation, Maintenance & Repair (61 | 2.3%).
Natural Resources, Construction and Maintenance Occupations by Sex
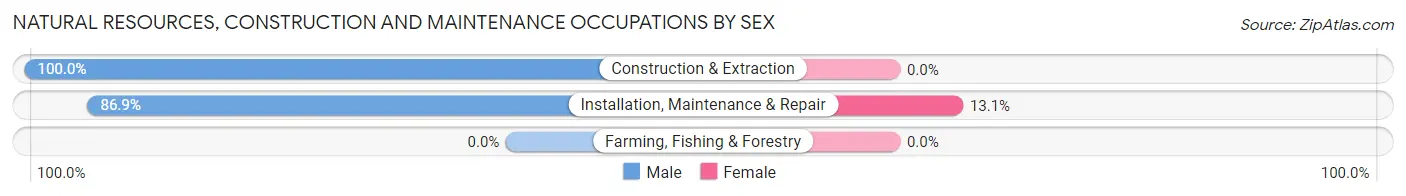
| Occupation | Male | Female |
| Farming, Fishing & Forestry | 0 (0.0%) | 0 (0.0%) |
| Construction & Extraction | 225 (100.0%) | 0 (0.0%) |
| Installation, Maintenance & Repair | 53 (86.9%) | 8 (13.1%) |
| Total (Category) | 278 (97.2%) | 8 (2.8%) |
| Total (Overall) | 1,194 (44.8%) | 1,472 (55.2%) |
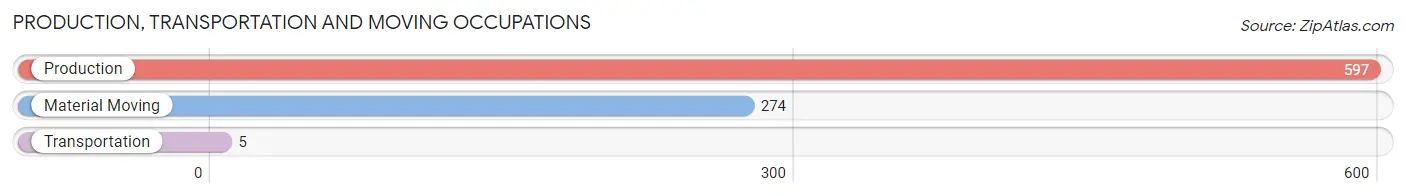
Production, Transportation and Moving Occupations
The most common Production, Transportation and Moving occupations in La Follette are Production (597 | 22.4%), Material Moving (274 | 10.3%), and Transportation (5 | 0.2%).
Production, Transportation and Moving Occupations by Sex
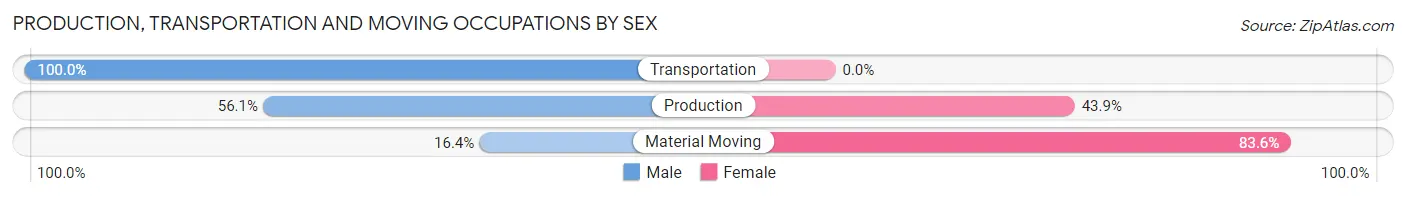
| Occupation | Male | Female |
| Production | 335 (56.1%) | 262 (43.9%) |
| Transportation | 5 (100.0%) | 0 (0.0%) |
| Material Moving | 45 (16.4%) | 229 (83.6%) |
| Total (Category) | 385 (44.0%) | 491 (56.0%) |
| Total (Overall) | 1,194 (44.8%) | 1,472 (55.2%) |
Employment Industries by Sex in La Follette
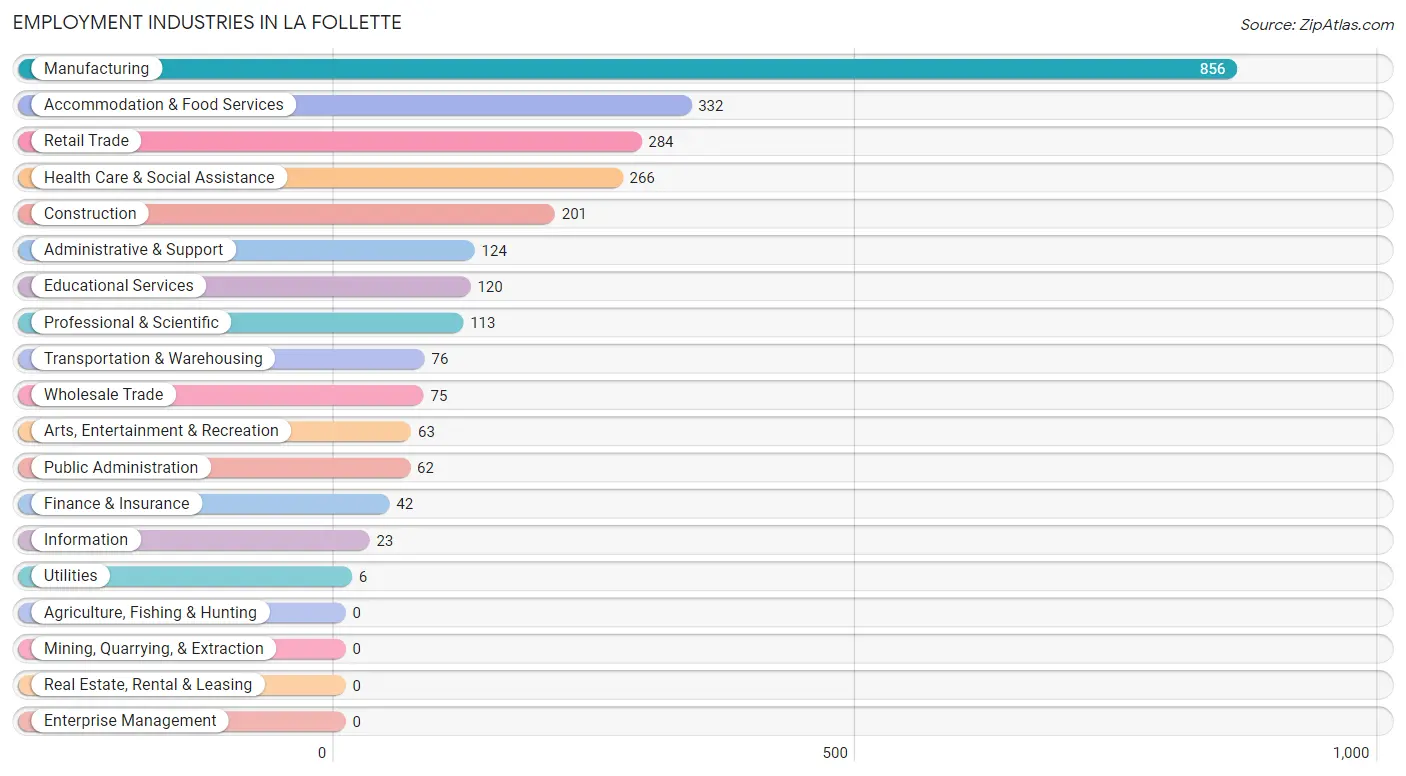
Employment Industries in La Follette
The major employment industries in La Follette include Manufacturing (856 | 32.1%), Accommodation & Food Services (332 | 12.4%), Retail Trade (284 | 10.6%), Health Care & Social Assistance (266 | 10.0%), and Construction (201 | 7.5%).
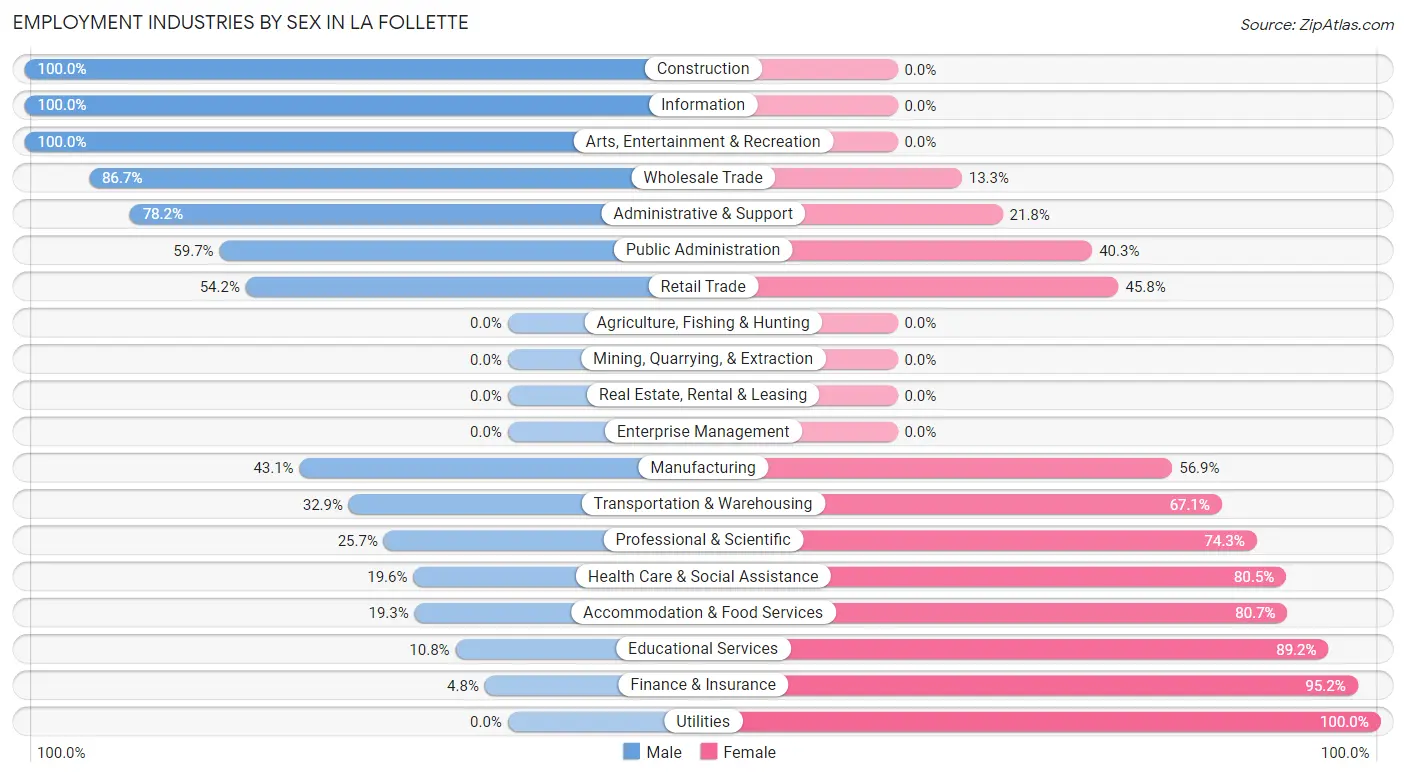
Employment Industries by Sex in La Follette
The La Follette industries that see more men than women are Construction (100.0%), Information (100.0%), and Arts, Entertainment & Recreation (100.0%), whereas the industries that tend to have a higher number of women are Utilities (100.0%), Finance & Insurance (95.2%), and Educational Services (89.2%).
| Industry | Male | Female |
| Agriculture, Fishing & Hunting | 0 (0.0%) | 0 (0.0%) |
| Mining, Quarrying, & Extraction | 0 (0.0%) | 0 (0.0%) |
| Construction | 201 (100.0%) | 0 (0.0%) |
| Manufacturing | 369 (43.1%) | 487 (56.9%) |
| Wholesale Trade | 65 (86.7%) | 10 (13.3%) |
| Retail Trade | 154 (54.2%) | 130 (45.8%) |
| Transportation & Warehousing | 25 (32.9%) | 51 (67.1%) |
| Utilities | 0 (0.0%) | 6 (100.0%) |
| Information | 23 (100.0%) | 0 (0.0%) |
| Finance & Insurance | 2 (4.8%) | 40 (95.2%) |
| Real Estate, Rental & Leasing | 0 (0.0%) | 0 (0.0%) |
| Professional & Scientific | 29 (25.7%) | 84 (74.3%) |
| Enterprise Management | 0 (0.0%) | 0 (0.0%) |
| Administrative & Support | 97 (78.2%) | 27 (21.8%) |
| Educational Services | 13 (10.8%) | 107 (89.2%) |
| Health Care & Social Assistance | 52 (19.6%) | 214 (80.4%) |
| Arts, Entertainment & Recreation | 63 (100.0%) | 0 (0.0%) |
| Accommodation & Food Services | 64 (19.3%) | 268 (80.7%) |
| Public Administration | 37 (59.7%) | 25 (40.3%) |
| Total | 1,194 (44.8%) | 1,472 (55.2%) |
Education in La Follette
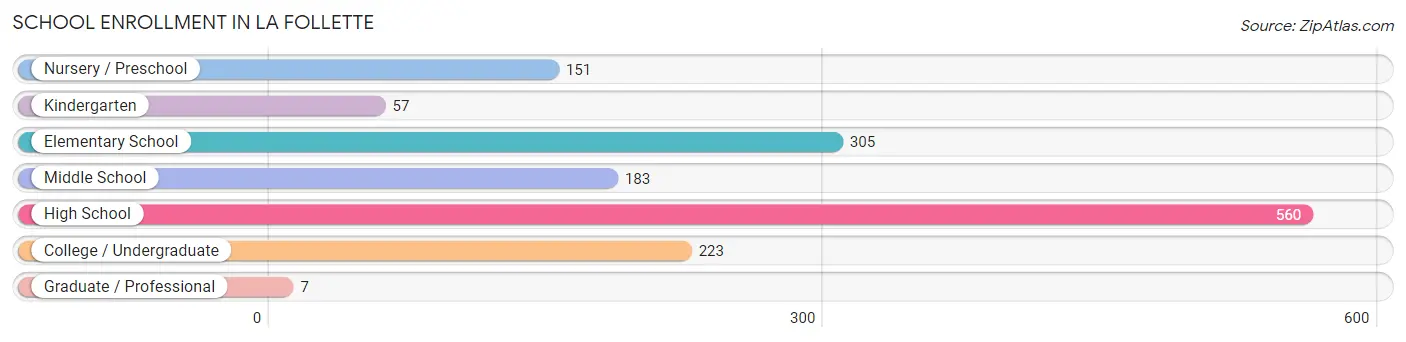
School Enrollment in La Follette
The most common levels of schooling among the 1,486 students in La Follette are high school (560 | 37.7%), elementary school (305 | 20.5%), and college / undergraduate (223 | 15.0%).
| School Level | # Students | % Students |
| Nursery / Preschool | 151 | 10.2% |
| Kindergarten | 57 | 3.8% |
| Elementary School | 305 | 20.5% |
| Middle School | 183 | 12.3% |
| High School | 560 | 37.7% |
| College / Undergraduate | 223 | 15.0% |
| Graduate / Professional | 7 | 0.5% |
| Total | 1,486 | 100.0% |
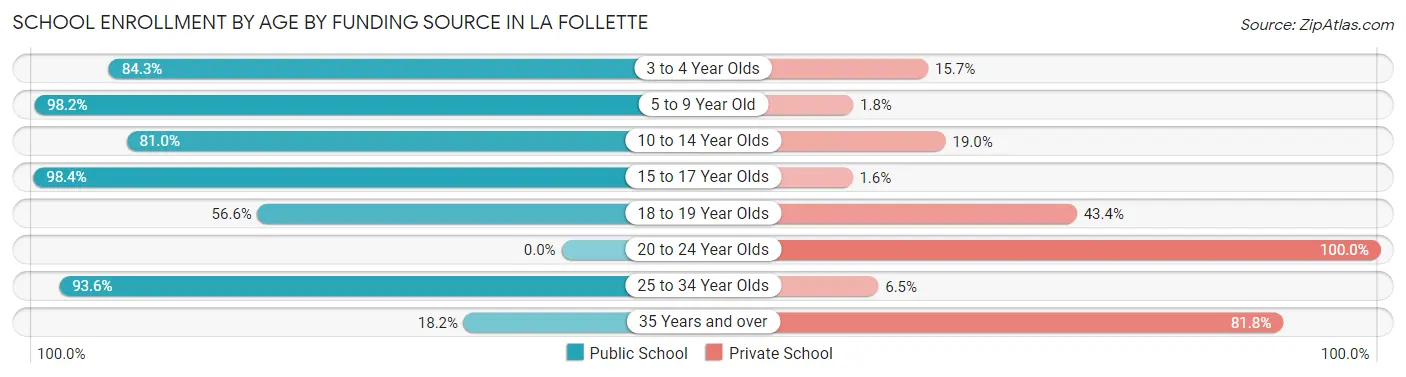
School Enrollment by Age by Funding Source in La Follette
Out of a total of 1,486 students who are enrolled in schools in La Follette, 250 (16.8%) attend a private institution, while the remaining 1,236 (83.2%) are enrolled in public schools. The age group of 20 to 24 year olds has the highest likelihood of being enrolled in private schools, with 21 (100.0% in the age bracket) enrolled. Conversely, the age group of 15 to 17 year olds has the lowest likelihood of being enrolled in a private school, with 362 (98.4% in the age bracket) attending a public institution.
| Age Bracket | Public School | Private School |
| 3 to 4 Year Olds | 118 (84.3%) | 22 (15.7%) |
| 5 to 9 Year Old | 334 (98.2%) | 6 (1.8%) |
| 10 to 14 Year Olds | 239 (81.0%) | 56 (19.0%) |
| 15 to 17 Year Olds | 362 (98.4%) | 6 (1.6%) |
| 18 to 19 Year Olds | 116 (56.6%) | 89 (43.4%) |
| 20 to 24 Year Olds | 0 (0.0%) | 21 (100.0%) |
| 25 to 34 Year Olds | 58 (93.5%) | 4 (6.5%) |
| 35 Years and over | 10 (18.2%) | 45 (81.8%) |
| Total | 1,236 (83.2%) | 250 (16.8%) |
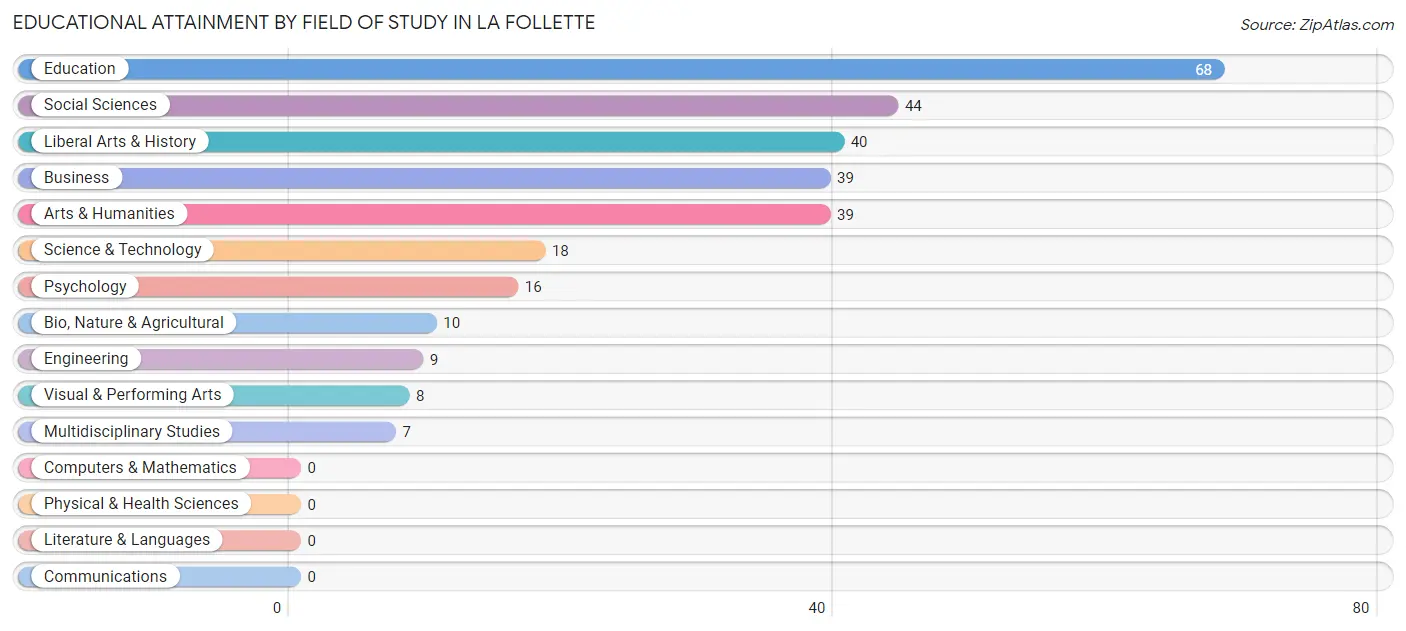
Educational Attainment by Field of Study in La Follette
Education (68 | 22.8%), social sciences (44 | 14.8%), liberal arts & history (40 | 13.4%), business (39 | 13.1%), and arts & humanities (39 | 13.1%) are the most common fields of study among 298 individuals in La Follette who have obtained a bachelor's degree or higher.
| Field of Study | # Graduates | % Graduates |
| Computers & Mathematics | 0 | 0.0% |
| Bio, Nature & Agricultural | 10 | 3.4% |
| Physical & Health Sciences | 0 | 0.0% |
| Psychology | 16 | 5.4% |
| Social Sciences | 44 | 14.8% |
| Engineering | 9 | 3.0% |
| Multidisciplinary Studies | 7 | 2.4% |
| Science & Technology | 18 | 6.0% |
| Business | 39 | 13.1% |
| Education | 68 | 22.8% |
| Literature & Languages | 0 | 0.0% |
| Liberal Arts & History | 40 | 13.4% |
| Visual & Performing Arts | 8 | 2.7% |
| Communications | 0 | 0.0% |
| Arts & Humanities | 39 | 13.1% |
| Total | 298 | 100.0% |
Transportation & Commute in La Follette
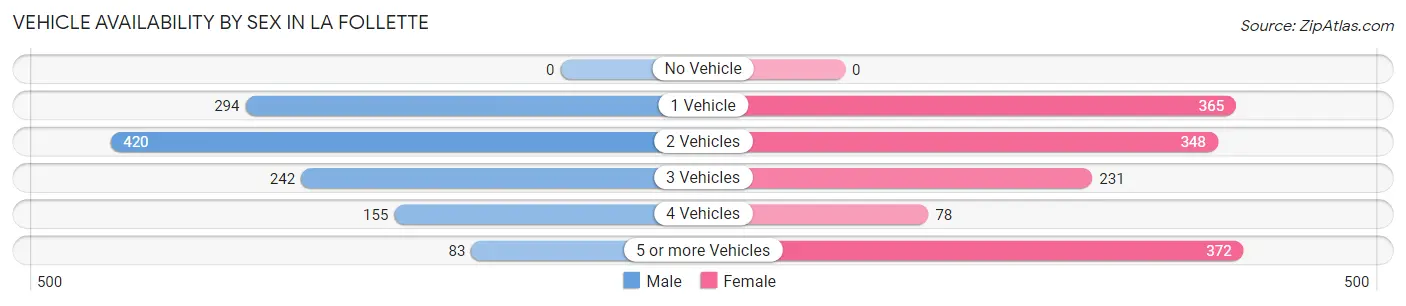
Vehicle Availability by Sex in La Follette
The most prevalent vehicle ownership categories in La Follette are males with 2 vehicles (420, accounting for 35.2%) and females with 2 vehicles (348, making up 30.1%).
| Vehicles Available | Male | Female |
| No Vehicle | 0 (0.0%) | 0 (0.0%) |
| 1 Vehicle | 294 (24.6%) | 365 (26.2%) |
| 2 Vehicles | 420 (35.2%) | 348 (25.0%) |
| 3 Vehicles | 242 (20.3%) | 231 (16.6%) |
| 4 Vehicles | 155 (13.0%) | 78 (5.6%) |
| 5 or more Vehicles | 83 (7.0%) | 372 (26.7%) |
| Total | 1,194 (100.0%) | 1,394 (100.0%) |
Commute Time in La Follette
The most frequently occuring commute durations in La Follette are 10 to 14 minutes (549 commuters, 22.2%), 15 to 19 minutes (495 commuters, 20.0%), and 45 to 59 minutes (469 commuters, 18.9%).
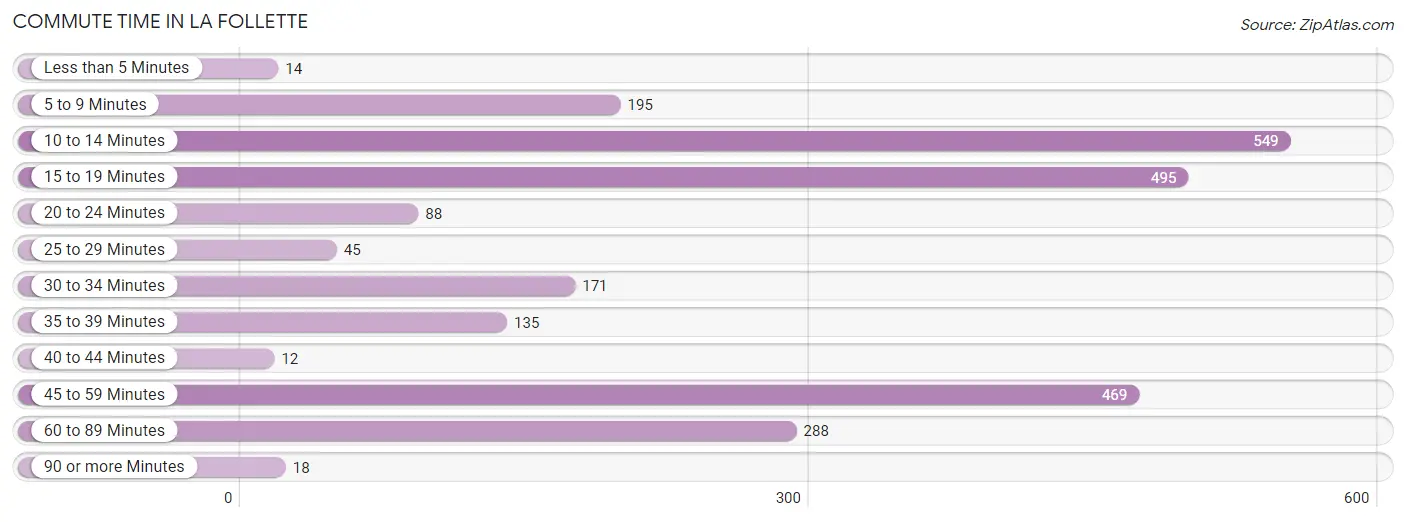
| Commute Time | # Commuters | % Commuters |
| Less than 5 Minutes | 14 | 0.6% |
| 5 to 9 Minutes | 195 | 7.9% |
| 10 to 14 Minutes | 549 | 22.2% |
| 15 to 19 Minutes | 495 | 20.0% |
| 20 to 24 Minutes | 88 | 3.5% |
| 25 to 29 Minutes | 45 | 1.8% |
| 30 to 34 Minutes | 171 | 6.9% |
| 35 to 39 Minutes | 135 | 5.4% |
| 40 to 44 Minutes | 12 | 0.5% |
| 45 to 59 Minutes | 469 | 18.9% |
| 60 to 89 Minutes | 288 | 11.6% |
| 90 or more Minutes | 18 | 0.7% |
Commute Time by Sex in La Follette
The most common commute times in La Follette are 15 to 19 minutes (254 commuters, 23.0%) for males and 10 to 14 minutes (387 commuters, 28.1%) for females.
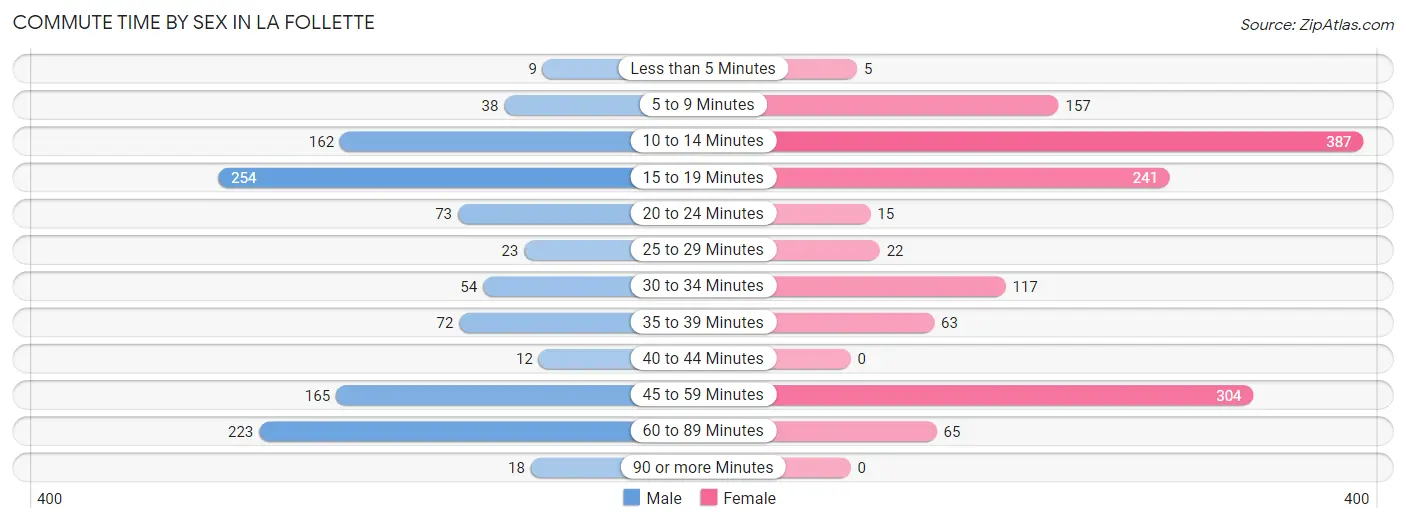
| Commute Time | Male | Female |
| Less than 5 Minutes | 9 (0.8%) | 5 (0.4%) |
| 5 to 9 Minutes | 38 (3.5%) | 157 (11.4%) |
| 10 to 14 Minutes | 162 (14.7%) | 387 (28.1%) |
| 15 to 19 Minutes | 254 (23.0%) | 241 (17.5%) |
| 20 to 24 Minutes | 73 (6.6%) | 15 (1.1%) |
| 25 to 29 Minutes | 23 (2.1%) | 22 (1.6%) |
| 30 to 34 Minutes | 54 (4.9%) | 117 (8.5%) |
| 35 to 39 Minutes | 72 (6.5%) | 63 (4.6%) |
| 40 to 44 Minutes | 12 (1.1%) | 0 (0.0%) |
| 45 to 59 Minutes | 165 (15.0%) | 304 (22.1%) |
| 60 to 89 Minutes | 223 (20.2%) | 65 (4.7%) |
| 90 or more Minutes | 18 (1.6%) | 0 (0.0%) |
Time of Departure to Work by Sex in La Follette
The most frequent times of departure to work in La Follette are 12:00 PM to 3:59 PM (167, 15.1%) for males and 5:00 AM to 5:29 AM (282, 20.5%) for females.
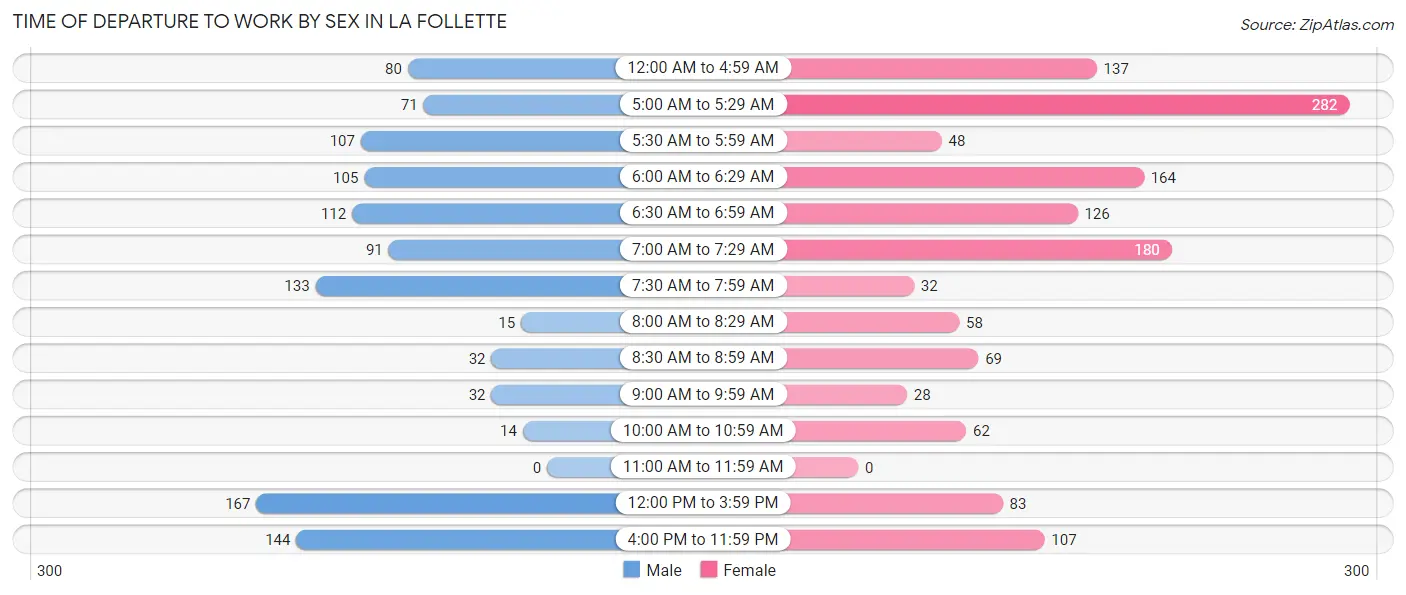
| Time of Departure | Male | Female |
| 12:00 AM to 4:59 AM | 80 (7.2%) | 137 (10.0%) |
| 5:00 AM to 5:29 AM | 71 (6.4%) | 282 (20.5%) |
| 5:30 AM to 5:59 AM | 107 (9.7%) | 48 (3.5%) |
| 6:00 AM to 6:29 AM | 105 (9.5%) | 164 (11.9%) |
| 6:30 AM to 6:59 AM | 112 (10.2%) | 126 (9.2%) |
| 7:00 AM to 7:29 AM | 91 (8.3%) | 180 (13.1%) |
| 7:30 AM to 7:59 AM | 133 (12.1%) | 32 (2.3%) |
| 8:00 AM to 8:29 AM | 15 (1.4%) | 58 (4.2%) |
| 8:30 AM to 8:59 AM | 32 (2.9%) | 69 (5.0%) |
| 9:00 AM to 9:59 AM | 32 (2.9%) | 28 (2.0%) |
| 10:00 AM to 10:59 AM | 14 (1.3%) | 62 (4.5%) |
| 11:00 AM to 11:59 AM | 0 (0.0%) | 0 (0.0%) |
| 12:00 PM to 3:59 PM | 167 (15.1%) | 83 (6.0%) |
| 4:00 PM to 11:59 PM | 144 (13.1%) | 107 (7.8%) |
| Total | 1,103 (100.0%) | 1,376 (100.0%) |
Housing Occupancy in La Follette
Occupancy by Ownership in La Follette
Of the total 3,105 dwellings in La Follette, owner-occupied units account for 1,204 (38.8%), while renter-occupied units make up 1,901 (61.2%).
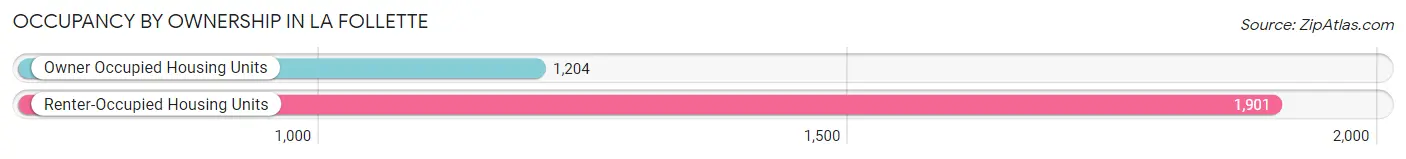
| Occupancy | # Housing Units | % Housing Units |
| Owner Occupied Housing Units | 1,204 | 38.8% |
| Renter-Occupied Housing Units | 1,901 | 61.2% |
| Total Occupied Housing Units | 3,105 | 100.0% |
Occupancy by Household Size in La Follette
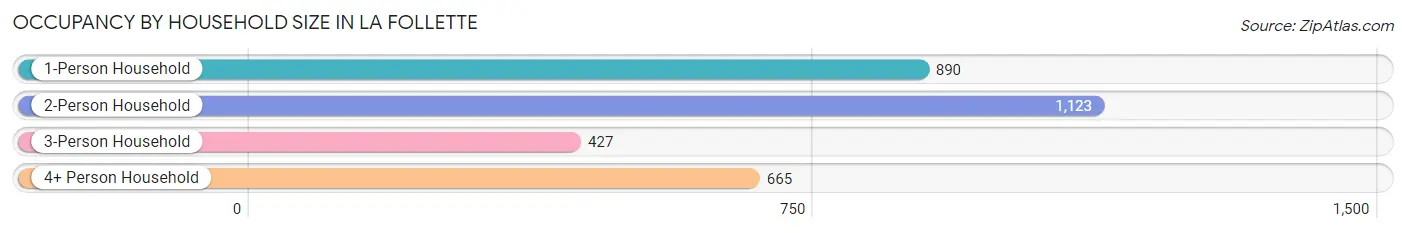
| Household Size | # Housing Units | % Housing Units |
| 1-Person Household | 890 | 28.7% |
| 2-Person Household | 1,123 | 36.2% |
| 3-Person Household | 427 | 13.8% |
| 4+ Person Household | 665 | 21.4% |
| Total Housing Units | 3,105 | 100.0% |
Occupancy by Ownership by Household Size in La Follette
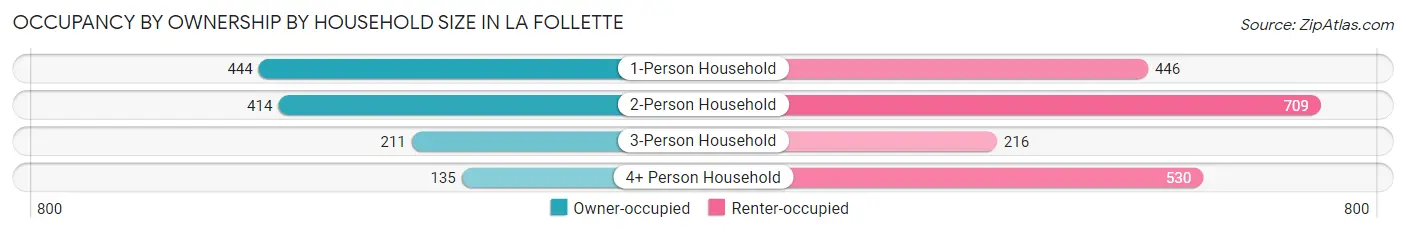
| Household Size | Owner-occupied | Renter-occupied |
| 1-Person Household | 444 (49.9%) | 446 (50.1%) |
| 2-Person Household | 414 (36.9%) | 709 (63.1%) |
| 3-Person Household | 211 (49.4%) | 216 (50.6%) |
| 4+ Person Household | 135 (20.3%) | 530 (79.7%) |
| Total Housing Units | 1,204 (38.8%) | 1,901 (61.2%) |
Occupancy by Educational Attainment in La Follette
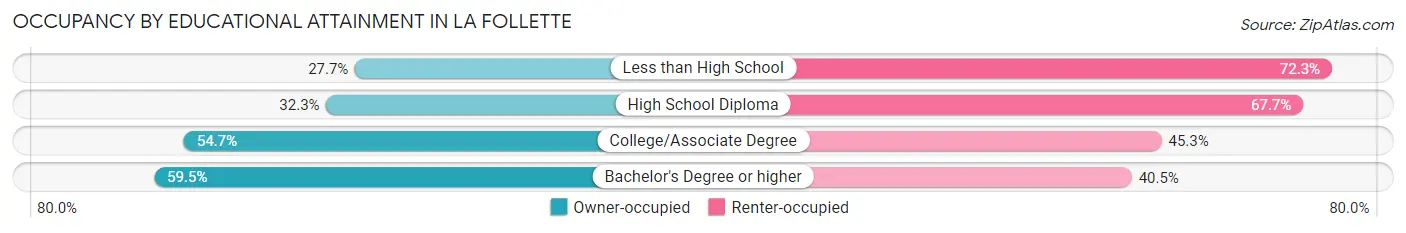
| Household Size | Owner-occupied | Renter-occupied |
| Less than High School | 158 (27.7%) | 412 (72.3%) |
| High School Diploma | 507 (32.3%) | 1,063 (67.7%) |
| College/Associate Degree | 404 (54.7%) | 334 (45.3%) |
| Bachelor's Degree or higher | 135 (59.5%) | 92 (40.5%) |
Occupancy by Age of Householder in La Follette
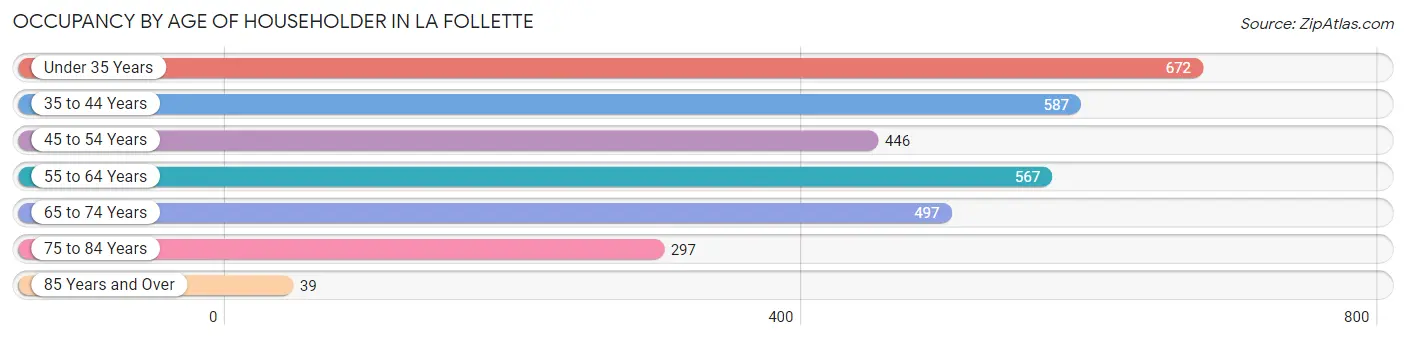
| Age Bracket | # Households | % Households |
| Under 35 Years | 672 | 21.6% |
| 35 to 44 Years | 587 | 18.9% |
| 45 to 54 Years | 446 | 14.4% |
| 55 to 64 Years | 567 | 18.3% |
| 65 to 74 Years | 497 | 16.0% |
| 75 to 84 Years | 297 | 9.6% |
| 85 Years and Over | 39 | 1.3% |
| Total | 3,105 | 100.0% |
Housing Finances in La Follette
Median Income by Occupancy in La Follette
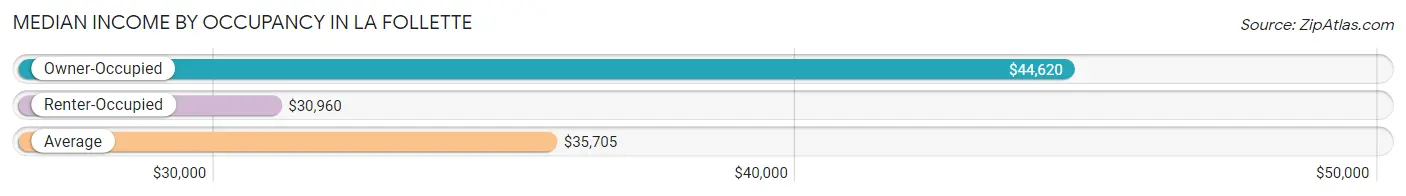
| Occupancy Type | # Households | Median Income |
| Owner-Occupied | 1,204 (38.8%) | $44,620 |
| Renter-Occupied | 1,901 (61.2%) | $30,960 |
| Average | 3,105 (100.0%) | $35,705 |
Occupancy by Householder Income Bracket in La Follette
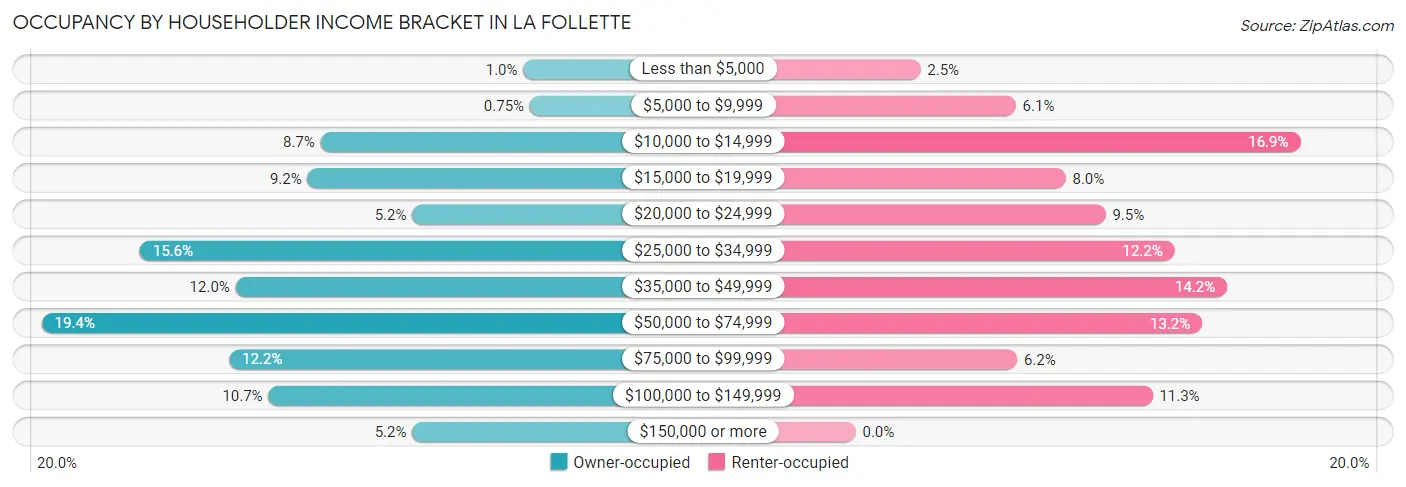
| Income Bracket | Owner-occupied | Renter-occupied |
| Less than $5,000 | 12 (1.0%) | 47 (2.5%) |
| $5,000 to $9,999 | 9 (0.7%) | 116 (6.1%) |
| $10,000 to $14,999 | 105 (8.7%) | 322 (16.9%) |
| $15,000 to $19,999 | 111 (9.2%) | 152 (8.0%) |
| $20,000 to $24,999 | 63 (5.2%) | 181 (9.5%) |
| $25,000 to $34,999 | 188 (15.6%) | 231 (12.1%) |
| $35,000 to $49,999 | 144 (12.0%) | 269 (14.1%) |
| $50,000 to $74,999 | 233 (19.4%) | 251 (13.2%) |
| $75,000 to $99,999 | 147 (12.2%) | 117 (6.1%) |
| $100,000 to $149,999 | 129 (10.7%) | 215 (11.3%) |
| $150,000 or more | 63 (5.2%) | 0 (0.0%) |
| Total | 1,204 (100.0%) | 1,901 (100.0%) |
Monthly Housing Cost Tiers in La Follette
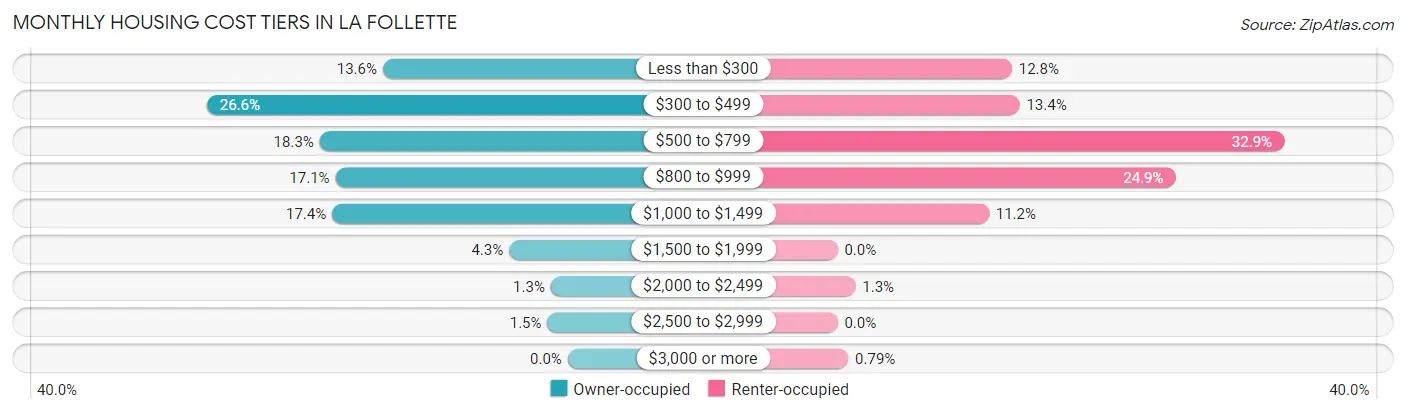
| Monthly Cost | Owner-occupied | Renter-occupied |
| Less than $300 | 164 (13.6%) | 244 (12.8%) |
| $300 to $499 | 320 (26.6%) | 255 (13.4%) |
| $500 to $799 | 220 (18.3%) | 625 (32.9%) |
| $800 to $999 | 206 (17.1%) | 473 (24.9%) |
| $1,000 to $1,499 | 209 (17.4%) | 212 (11.2%) |
| $1,500 to $1,999 | 52 (4.3%) | 0 (0.0%) |
| $2,000 to $2,499 | 15 (1.3%) | 25 (1.3%) |
| $2,500 to $2,999 | 18 (1.5%) | 0 (0.0%) |
| $3,000 or more | 0 (0.0%) | 15 (0.8%) |
| Total | 1,204 (100.0%) | 1,901 (100.0%) |
Physical Housing Characteristics in La Follette
Housing Structures in La Follette
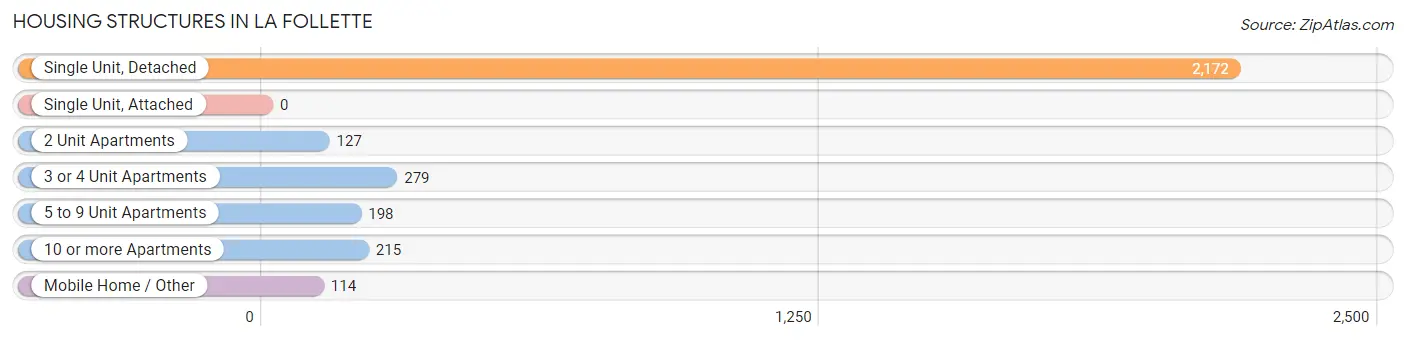
| Structure Type | # Housing Units | % Housing Units |
| Single Unit, Detached | 2,172 | 70.0% |
| Single Unit, Attached | 0 | 0.0% |
| 2 Unit Apartments | 127 | 4.1% |
| 3 or 4 Unit Apartments | 279 | 9.0% |
| 5 to 9 Unit Apartments | 198 | 6.4% |
| 10 or more Apartments | 215 | 6.9% |
| Mobile Home / Other | 114 | 3.7% |
| Total | 3,105 | 100.0% |
Housing Structures by Occupancy in La Follette
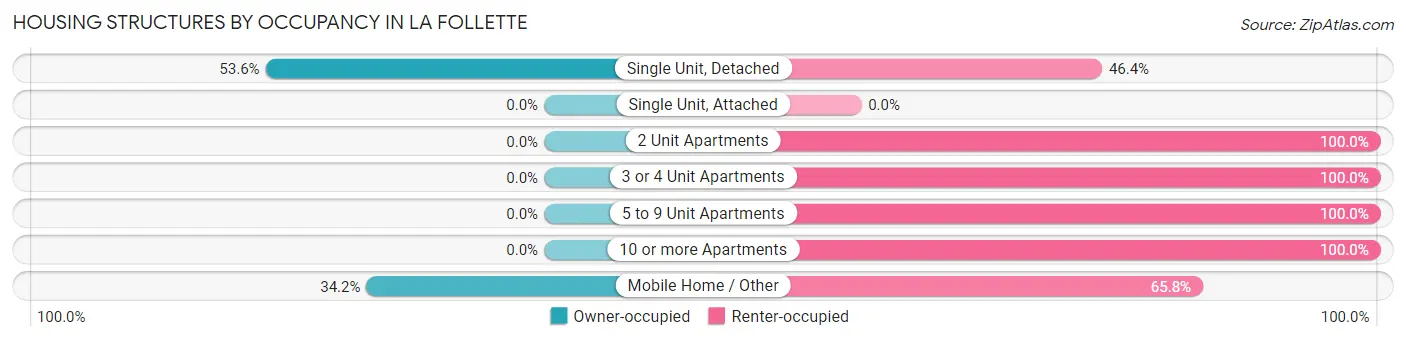
| Structure Type | Owner-occupied | Renter-occupied |
| Single Unit, Detached | 1,165 (53.6%) | 1,007 (46.4%) |
| Single Unit, Attached | 0 (0.0%) | 0 (0.0%) |
| 2 Unit Apartments | 0 (0.0%) | 127 (100.0%) |
| 3 or 4 Unit Apartments | 0 (0.0%) | 279 (100.0%) |
| 5 to 9 Unit Apartments | 0 (0.0%) | 198 (100.0%) |
| 10 or more Apartments | 0 (0.0%) | 215 (100.0%) |
| Mobile Home / Other | 39 (34.2%) | 75 (65.8%) |
| Total | 1,204 (38.8%) | 1,901 (61.2%) |
Housing Structures by Number of Rooms in La Follette
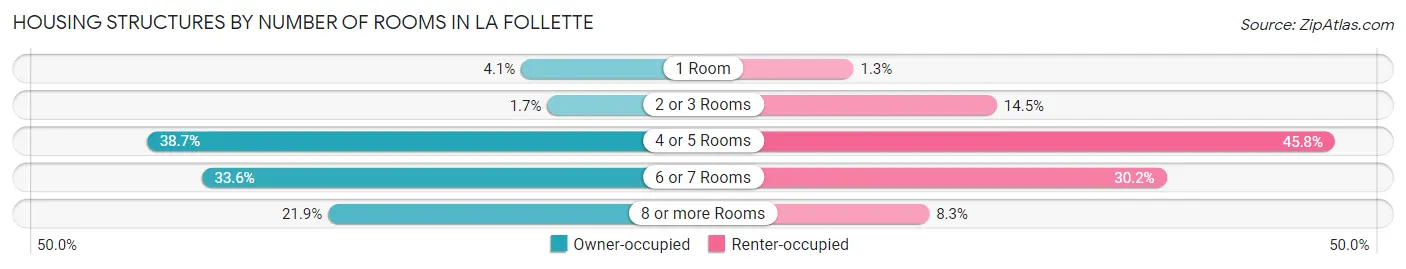
| Number of Rooms | Owner-occupied | Renter-occupied |
| 1 Room | 49 (4.1%) | 24 (1.3%) |
| 2 or 3 Rooms | 20 (1.7%) | 276 (14.5%) |
| 4 or 5 Rooms | 466 (38.7%) | 870 (45.8%) |
| 6 or 7 Rooms | 405 (33.6%) | 574 (30.2%) |
| 8 or more Rooms | 264 (21.9%) | 157 (8.3%) |
| Total | 1,204 (100.0%) | 1,901 (100.0%) |
Housing Structure by Heating Type in La Follette
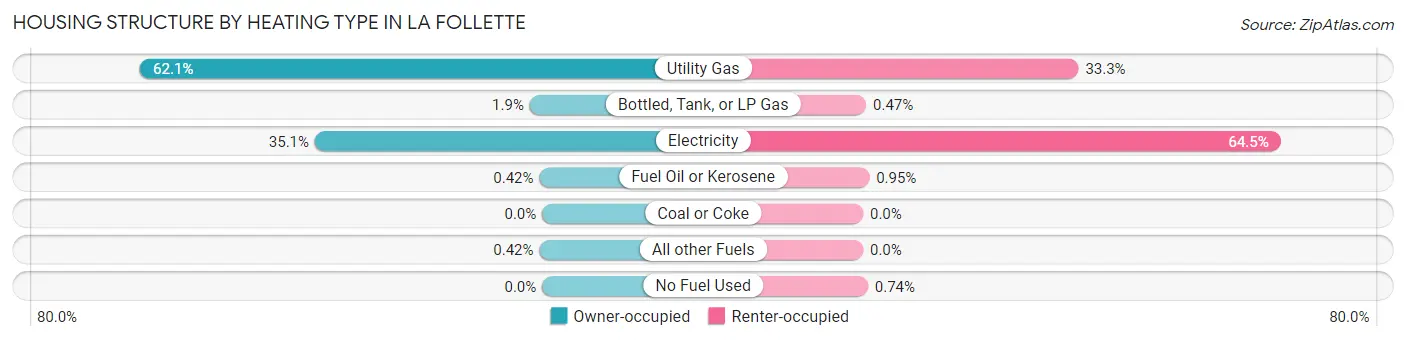
| Heating Type | Owner-occupied | Renter-occupied |
| Utility Gas | 748 (62.1%) | 633 (33.3%) |
| Bottled, Tank, or LP Gas | 23 (1.9%) | 9 (0.5%) |
| Electricity | 423 (35.1%) | 1,227 (64.5%) |
| Fuel Oil or Kerosene | 5 (0.4%) | 18 (0.9%) |
| Coal or Coke | 0 (0.0%) | 0 (0.0%) |
| All other Fuels | 5 (0.4%) | 0 (0.0%) |
| No Fuel Used | 0 (0.0%) | 14 (0.7%) |
| Total | 1,204 (100.0%) | 1,901 (100.0%) |
Household Vehicle Usage in La Follette
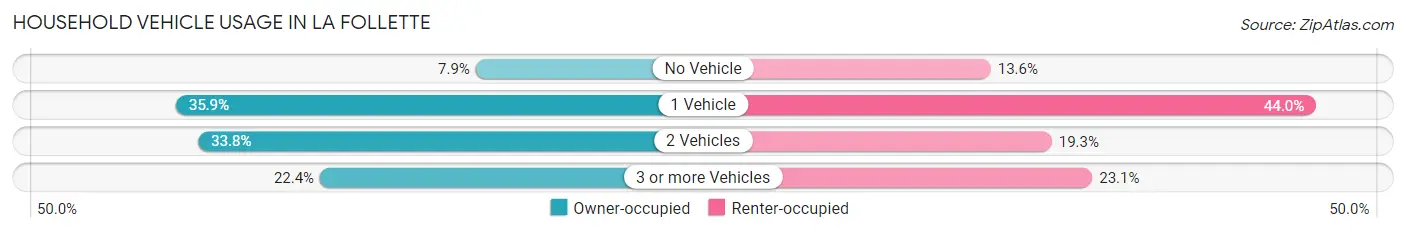
| Vehicles per Household | Owner-occupied | Renter-occupied |
| No Vehicle | 95 (7.9%) | 259 (13.6%) |
| 1 Vehicle | 432 (35.9%) | 836 (44.0%) |
| 2 Vehicles | 407 (33.8%) | 367 (19.3%) |
| 3 or more Vehicles | 270 (22.4%) | 439 (23.1%) |
| Total | 1,204 (100.0%) | 1,901 (100.0%) |
Real Estate & Mortgages in La Follette
Real Estate and Mortgage Overview in La Follette
| Characteristic | Without Mortgage | With Mortgage |
| Housing Units | 600 | 604 |
| Median Property Value | $67,200 | $123,800 |
| Median Household Income | $33,370 | $37 |
| Monthly Housing Costs | $391 | $0 |
| Real Estate Taxes | $452 | $8 |
Property Value by Mortgage Status in La Follette
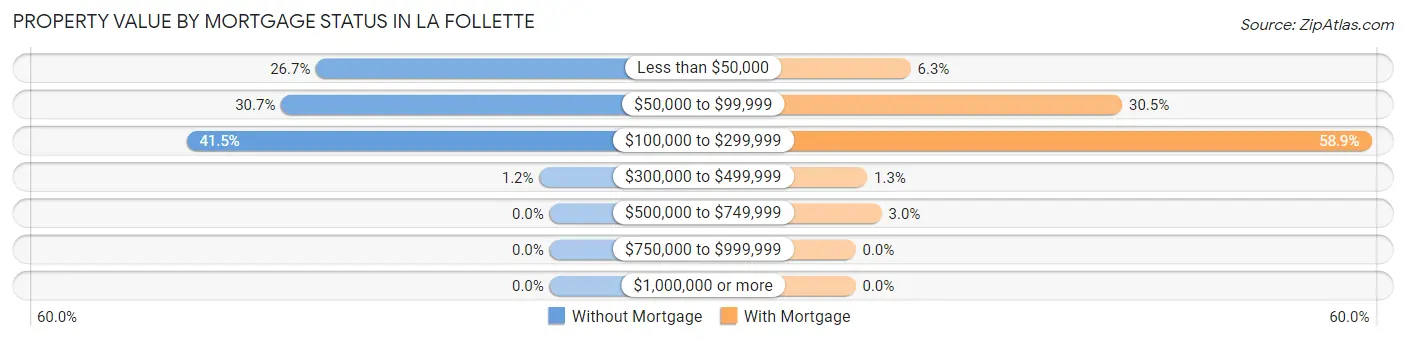
| Property Value | Without Mortgage | With Mortgage |
| Less than $50,000 | 160 (26.7%) | 38 (6.3%) |
| $50,000 to $99,999 | 184 (30.7%) | 184 (30.5%) |
| $100,000 to $299,999 | 249 (41.5%) | 356 (58.9%) |
| $300,000 to $499,999 | 7 (1.2%) | 8 (1.3%) |
| $500,000 to $749,999 | 0 (0.0%) | 18 (3.0%) |
| $750,000 to $999,999 | 0 (0.0%) | 0 (0.0%) |
| $1,000,000 or more | 0 (0.0%) | 0 (0.0%) |
| Total | 600 (100.0%) | 604 (100.0%) |
Household Income by Mortgage Status in La Follette
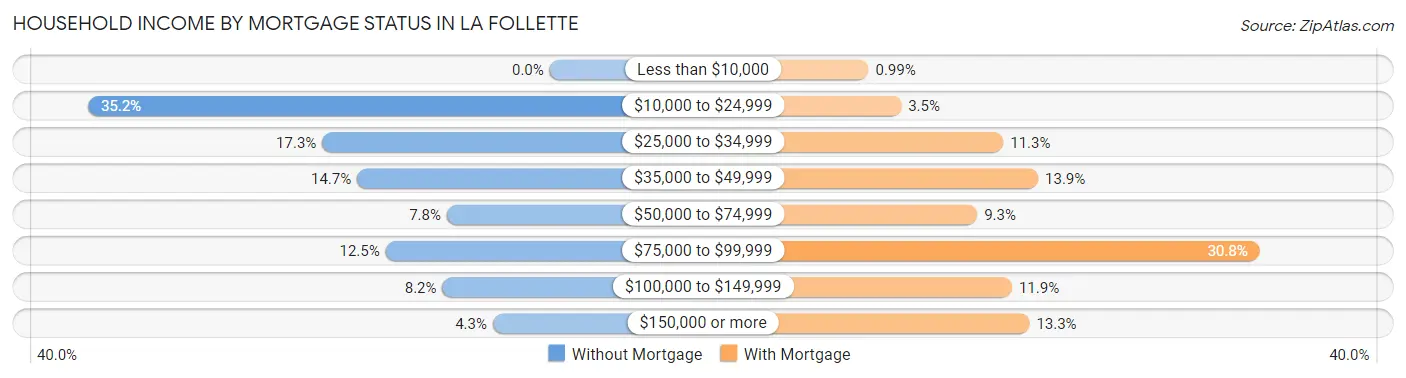
| Household Income | Without Mortgage | With Mortgage |
| Less than $10,000 | 0 (0.0%) | 6 (1.0%) |
| $10,000 to $24,999 | 211 (35.2%) | 21 (3.5%) |
| $25,000 to $34,999 | 104 (17.3%) | 68 (11.3%) |
| $35,000 to $49,999 | 88 (14.7%) | 84 (13.9%) |
| $50,000 to $74,999 | 47 (7.8%) | 56 (9.3%) |
| $75,000 to $99,999 | 75 (12.5%) | 186 (30.8%) |
| $100,000 to $149,999 | 49 (8.2%) | 72 (11.9%) |
| $150,000 or more | 26 (4.3%) | 80 (13.3%) |
| Total | 600 (100.0%) | 604 (100.0%) |
Property Value to Household Income Ratio in La Follette
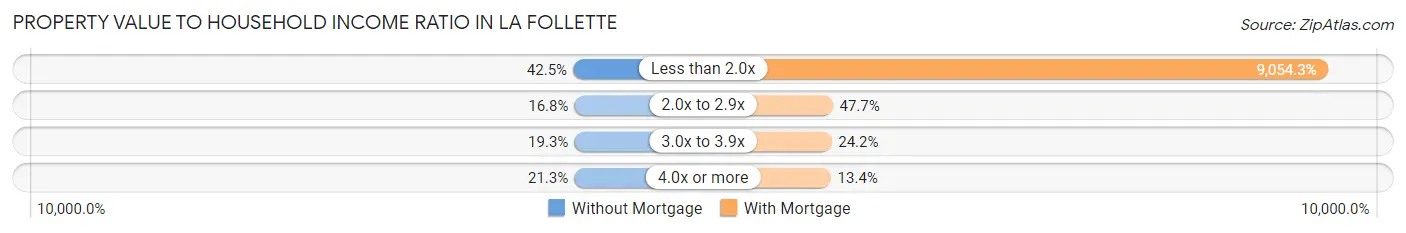
| Value-to-Income Ratio | Without Mortgage | With Mortgage |
| Less than 2.0x | 255 (42.5%) | 54,688 (9,054.3%) |
| 2.0x to 2.9x | 101 (16.8%) | 288 (47.7%) |
| 3.0x to 3.9x | 116 (19.3%) | 146 (24.2%) |
| 4.0x or more | 128 (21.3%) | 81 (13.4%) |
| Total | 600 (100.0%) | 604 (100.0%) |
Real Estate Taxes by Mortgage Status in La Follette
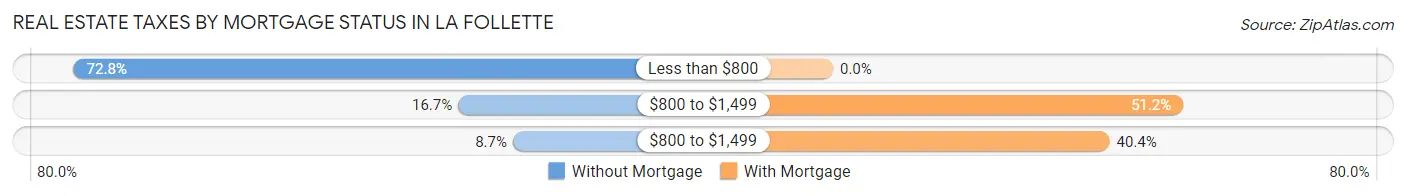
| Property Taxes | Without Mortgage | With Mortgage |
| Less than $800 | 437 (72.8%) | 0 (0.0%) |
| $800 to $1,499 | 100 (16.7%) | 309 (51.2%) |
| $800 to $1,499 | 52 (8.7%) | 244 (40.4%) |
| Total | 600 (100.0%) | 604 (100.0%) |
Health & Disability in La Follette
Health Insurance Coverage by Age in La Follette
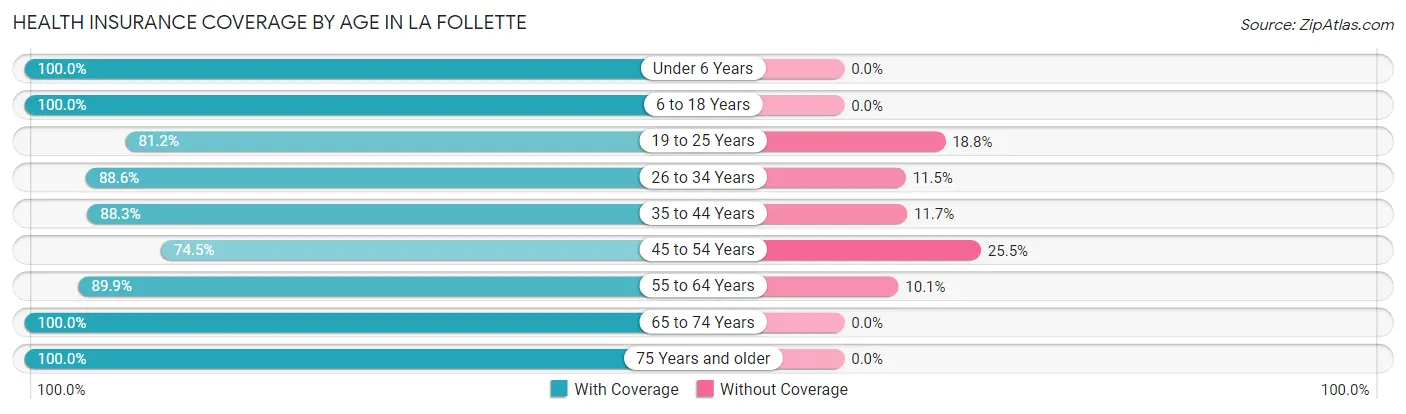
| Age Bracket | With Coverage | Without Coverage |
| Under 6 Years | 572 (100.0%) | 0 (0.0%) |
| 6 to 18 Years | 1,096 (100.0%) | 0 (0.0%) |
| 19 to 25 Years | 634 (81.2%) | 147 (18.8%) |
| 26 to 34 Years | 688 (88.5%) | 89 (11.5%) |
| 35 to 44 Years | 830 (88.3%) | 110 (11.7%) |
| 45 to 54 Years | 673 (74.5%) | 230 (25.5%) |
| 55 to 64 Years | 705 (89.9%) | 79 (10.1%) |
| 65 to 74 Years | 712 (100.0%) | 0 (0.0%) |
| 75 Years and older | 453 (100.0%) | 0 (0.0%) |
| Total | 6,363 (90.7%) | 655 (9.3%) |
Health Insurance Coverage by Citizenship Status in La Follette
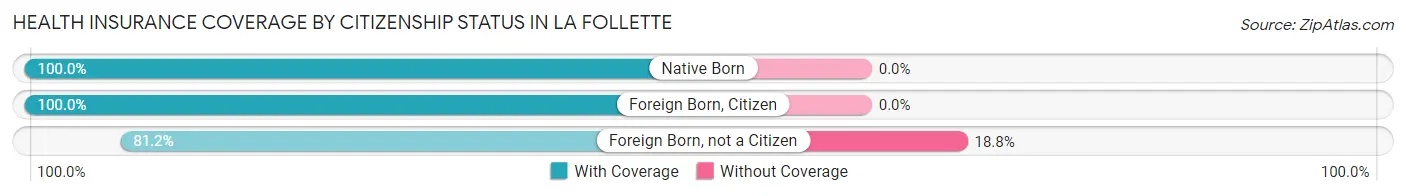
| Citizenship Status | With Coverage | Without Coverage |
| Native Born | 572 (100.0%) | 0 (0.0%) |
| Foreign Born, Citizen | 1,096 (100.0%) | 0 (0.0%) |
| Foreign Born, not a Citizen | 634 (81.2%) | 147 (18.8%) |
Health Insurance Coverage by Household Income in La Follette
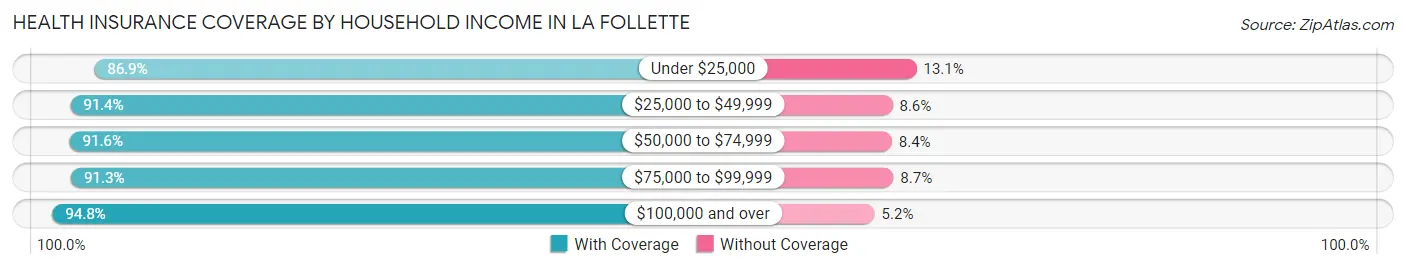
| Household Income | With Coverage | Without Coverage |
| Under $25,000 | 1,709 (86.9%) | 257 (13.1%) |
| $25,000 to $49,999 | 1,610 (91.4%) | 151 (8.6%) |
| $50,000 to $74,999 | 1,464 (91.6%) | 135 (8.4%) |
| $75,000 to $99,999 | 617 (91.3%) | 59 (8.7%) |
| $100,000 and over | 963 (94.8%) | 53 (5.2%) |
Public vs Private Health Insurance Coverage by Age in La Follette
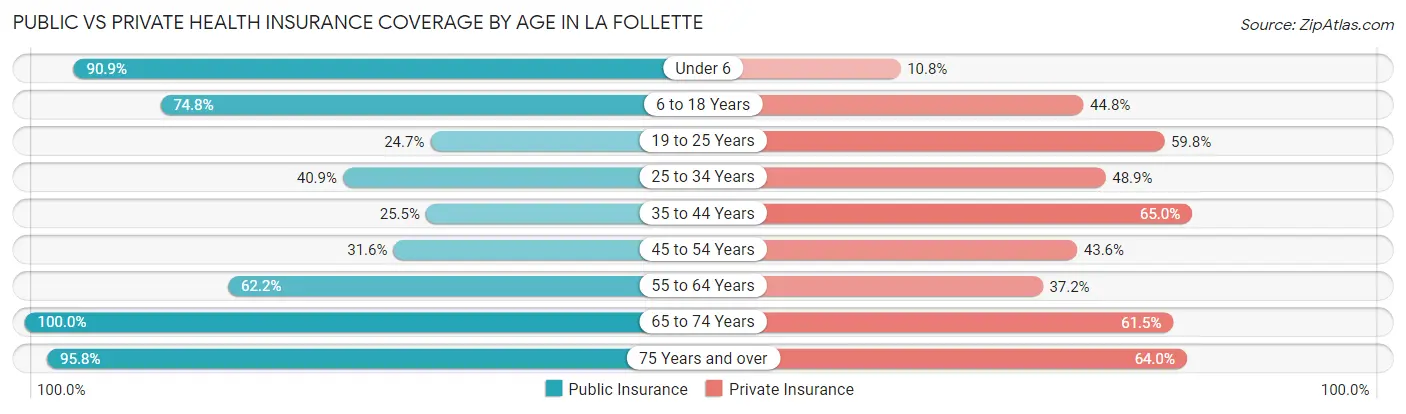
| Age Bracket | Public Insurance | Private Insurance |
| Under 6 | 520 (90.9%) | 62 (10.8%) |
| 6 to 18 Years | 820 (74.8%) | 491 (44.8%) |
| 19 to 25 Years | 193 (24.7%) | 467 (59.8%) |
| 25 to 34 Years | 318 (40.9%) | 380 (48.9%) |
| 35 to 44 Years | 240 (25.5%) | 611 (65.0%) |
| 45 to 54 Years | 285 (31.6%) | 394 (43.6%) |
| 55 to 64 Years | 488 (62.2%) | 292 (37.2%) |
| 65 to 74 Years | 712 (100.0%) | 438 (61.5%) |
| 75 Years and over | 434 (95.8%) | 290 (64.0%) |
| Total | 4,010 (57.1%) | 3,425 (48.8%) |
Disability Status by Sex by Age in La Follette
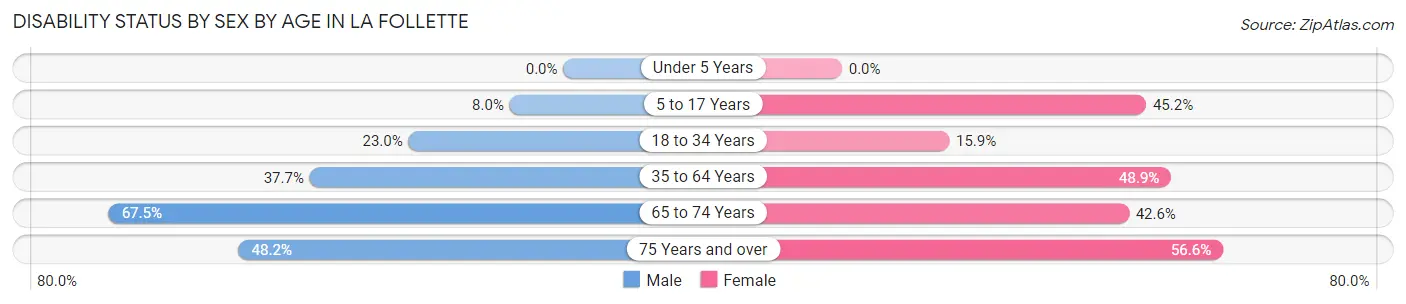
| Age Bracket | Male | Female |
| Under 5 Years | 0 (0.0%) | 0 (0.0%) |
| 5 to 17 Years | 36 (8.0%) | 262 (45.2%) |
| 18 to 34 Years | 177 (23.0%) | 144 (15.9%) |
| 35 to 64 Years | 444 (37.7%) | 708 (48.9%) |
| 65 to 74 Years | 216 (67.5%) | 167 (42.6%) |
| 75 Years and over | 54 (48.2%) | 193 (56.6%) |
Disability Class by Sex by Age in La Follette
Disability Class: Hearing Difficulty
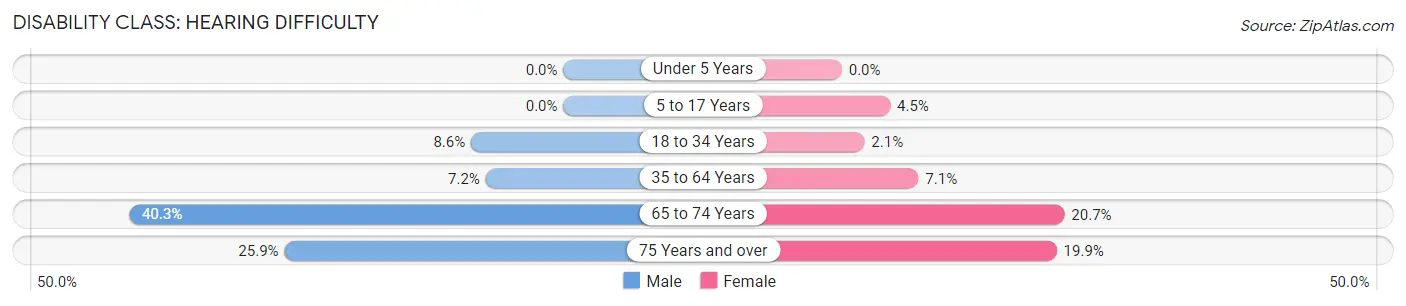
| Age Bracket | Male | Female |
| Under 5 Years | 0 (0.0%) | 0 (0.0%) |
| 5 to 17 Years | 0 (0.0%) | 26 (4.5%) |
| 18 to 34 Years | 66 (8.6%) | 19 (2.1%) |
| 35 to 64 Years | 85 (7.2%) | 103 (7.1%) |
| 65 to 74 Years | 129 (40.3%) | 81 (20.7%) |
| 75 Years and over | 29 (25.9%) | 68 (19.9%) |
Disability Class: Vision Difficulty
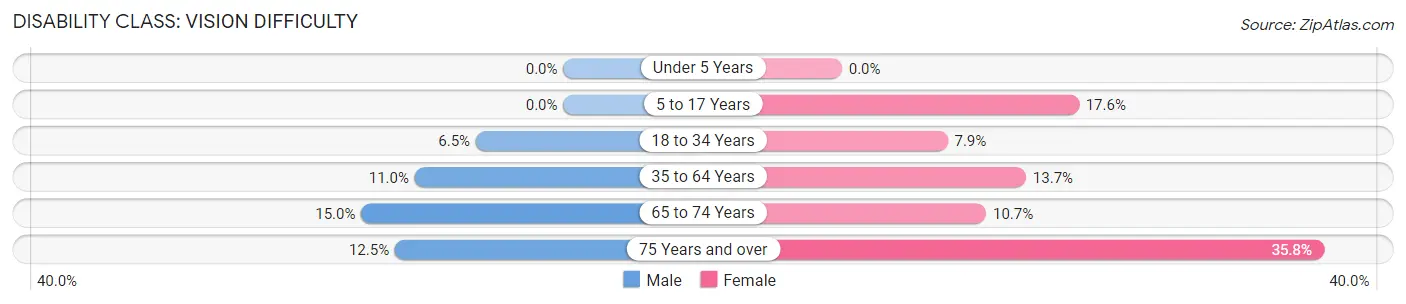
| Age Bracket | Male | Female |
| Under 5 Years | 0 (0.0%) | 0 (0.0%) |
| 5 to 17 Years | 0 (0.0%) | 102 (17.6%) |
| 18 to 34 Years | 50 (6.5%) | 71 (7.9%) |
| 35 to 64 Years | 130 (11.0%) | 198 (13.7%) |
| 65 to 74 Years | 48 (15.0%) | 42 (10.7%) |
| 75 Years and over | 14 (12.5%) | 122 (35.8%) |
Disability Class: Cognitive Difficulty
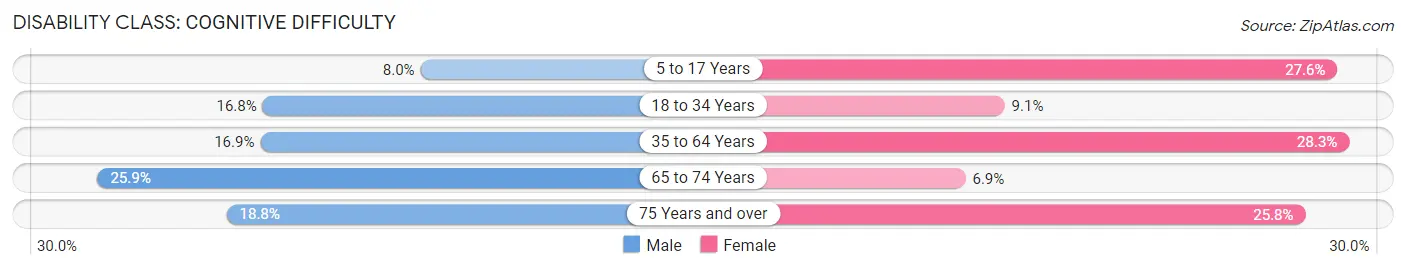
| Age Bracket | Male | Female |
| 5 to 17 Years | 36 (8.0%) | 160 (27.6%) |
| 18 to 34 Years | 129 (16.8%) | 82 (9.1%) |
| 35 to 64 Years | 199 (16.9%) | 409 (28.2%) |
| 65 to 74 Years | 83 (25.9%) | 27 (6.9%) |
| 75 Years and over | 21 (18.8%) | 88 (25.8%) |
Disability Class: Ambulatory Difficulty
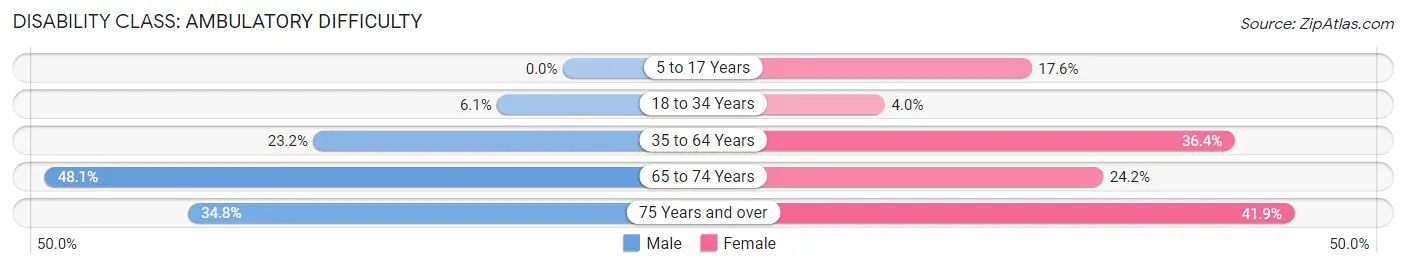
| Age Bracket | Male | Female |
| 5 to 17 Years | 0 (0.0%) | 102 (17.6%) |
| 18 to 34 Years | 47 (6.1%) | 36 (4.0%) |
| 35 to 64 Years | 273 (23.2%) | 527 (36.4%) |
| 65 to 74 Years | 154 (48.1%) | 95 (24.2%) |
| 75 Years and over | 39 (34.8%) | 143 (41.9%) |
Disability Class: Self-Care Difficulty
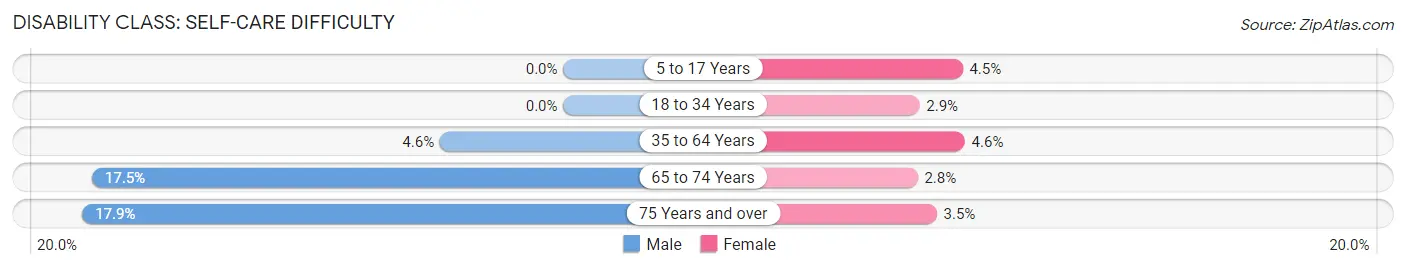
| Age Bracket | Male | Female |
| 5 to 17 Years | 0 (0.0%) | 26 (4.5%) |
| 18 to 34 Years | 0 (0.0%) | 26 (2.9%) |
| 35 to 64 Years | 54 (4.6%) | 66 (4.6%) |
| 65 to 74 Years | 56 (17.5%) | 11 (2.8%) |
| 75 Years and over | 20 (17.9%) | 12 (3.5%) |
Technology Access in La Follette
Computing Device Access in La Follette
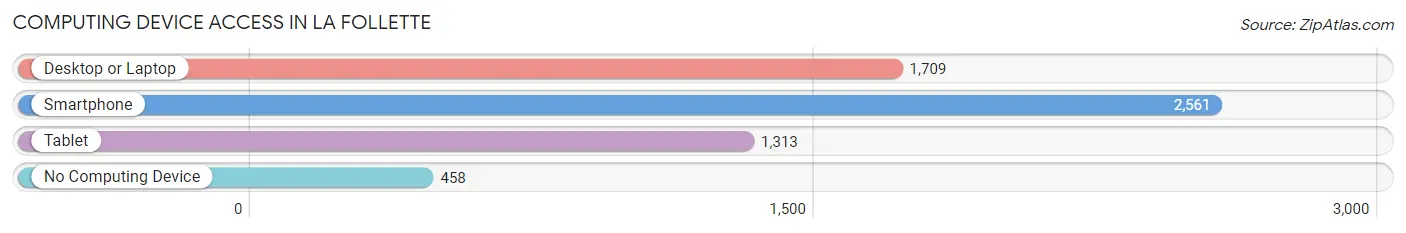
| Device Type | # Households | % Households |
| Desktop or Laptop | 1,709 | 55.0% |
| Smartphone | 2,561 | 82.5% |
| Tablet | 1,313 | 42.3% |
| No Computing Device | 458 | 14.7% |
| Total | 3,105 | 100.0% |
Internet Access in La Follette
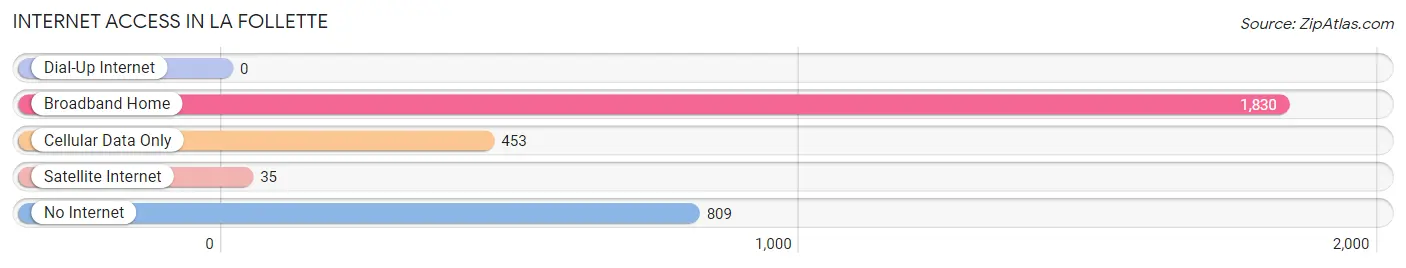
| Internet Type | # Households | % Households |
| Dial-Up Internet | 0 | 0.0% |
| Broadband Home | 1,830 | 58.9% |
| Cellular Data Only | 453 | 14.6% |
| Satellite Internet | 35 | 1.1% |
| No Internet | 809 | 26.1% |
| Total | 3,105 | 100.0% |
La Follette Summary
Founded in 1887, La Follette, Tennessee is a small city located in Campbell County, in the eastern part of the state. It is situated along the banks of the Powell River, and is part of the Knoxville Metropolitan Statistical Area. The city is named after Robert La Follette, a prominent Wisconsin politician and leader of the Progressive Movement.
Geography
La Follette is located at 36°20'N 84°7'W, and has an elevation of 890 feet. The city covers an area of 4.3 square miles, and is located in the Appalachian Mountains. The city is surrounded by the Cumberland Mountains to the north, and the Clinch Mountains to the south. The Powell River runs through the city, and is a major source of recreation for the area.
Climate
La Follette has a humid subtropical climate, with hot, humid summers and mild winters. The average annual temperature is around 57°F, and the average annual precipitation is around 45 inches.
Demographics
As of the 2010 census, La Follette had a population of 7,456. The racial makeup of the city was 92.3% White, 4.2% African American, 0.3% Native American, 0.7% Asian, 0.1% Pacific Islander, and 2.4% from other races. Hispanic or Latino of any race were 1.7% of the population.
Economy
La Follette is home to several industries, including manufacturing, retail, and healthcare. The city is home to several manufacturing plants, including a paper mill, a steel mill, and a plastics plant. The city is also home to several retail stores, including a Walmart Supercenter, a Lowe's Home Improvement store, and a variety of other stores. The city is also home to several healthcare facilities, including a hospital, a nursing home, and several medical clinics.
The city is also home to several educational institutions, including La Follette High School, La Follette Middle School, and several elementary schools. The city is also home to the University of Tennessee at La Follette, which offers a variety of degree programs.
The city is served by the La Follette Municipal Airport, which offers flights to several major cities in the region. The city is also served by several major highways, including Interstate 75, US Route 25W, and US Route 11W.
Conclusion
La Follette, Tennessee is a small city located in Campbell County, in the eastern part of the state. It is situated along the banks of the Powell River, and is part of the Knoxville Metropolitan Statistical Area. The city is home to several industries, including manufacturing, retail, and healthcare. The city is also home to several educational institutions, including La Follette High School, La Follette Middle School, and several elementary schools. The city is served by the La Follette Municipal Airport, which offers flights to several major cities in the region. La Follette is a great place to live, work, and play, and is a great place to call home.
Common Questions
What is Per Capita Income in La Follette?
Per Capita income in La Follette is $21,294.
What is the Median Family Income in La Follette?
Median Family Income in La Follette is $44,052.
What is the Median Household income in La Follette?
Median Household Income in La Follette is $35,705.
What is Income or Wage Gap in La Follette?
Income or Wage Gap in La Follette is 34.4%.
Women in La Follette earn 65.6 cents for every dollar earned by a man.
What is Family Income Deficit in La Follette?
Family Income Deficit in La Follette is $8,423.
Families that are below poverty line in La Follette earn $8,423 less on average than the poverty threshold level.
What is Inequality or Gini Index in La Follette?
Inequality or Gini Index in La Follette is 0.45.
What is the Total Population of La Follette?
Total Population of La Follette is 7,349.
What is the Total Male Population of La Follette?
Total Male Population of La Follette is 3,176.
What is the Total Female Population of La Follette?
Total Female Population of La Follette is 4,173.
What is the Ratio of Males per 100 Females in La Follette?
There are 76.11 Males per 100 Females in La Follette.
What is the Ratio of Females per 100 Males in La Follette?
There are 131.39 Females per 100 Males in La Follette.
What is the Median Population Age in La Follette?
Median Population Age in La Follette is 38.5 Years.
What is the Average Family Size in La Follette
Average Family Size in La Follette is 2.7 People.
What is the Average Household Size in La Follette
Average Household Size in La Follette is 2.3 People.
How Large is the Labor Force in La Follette?
There are 3,049 People in the Labor Forcein in La Follette.
What is the Percentage of People in the Labor Force in La Follette?
50.5% of People are in the Labor Force in La Follette.
What is the Unemployment Rate in La Follette?
Unemployment Rate in La Follette is 12.5%.