Townsend, TN Map & Demographics
Townsend Map
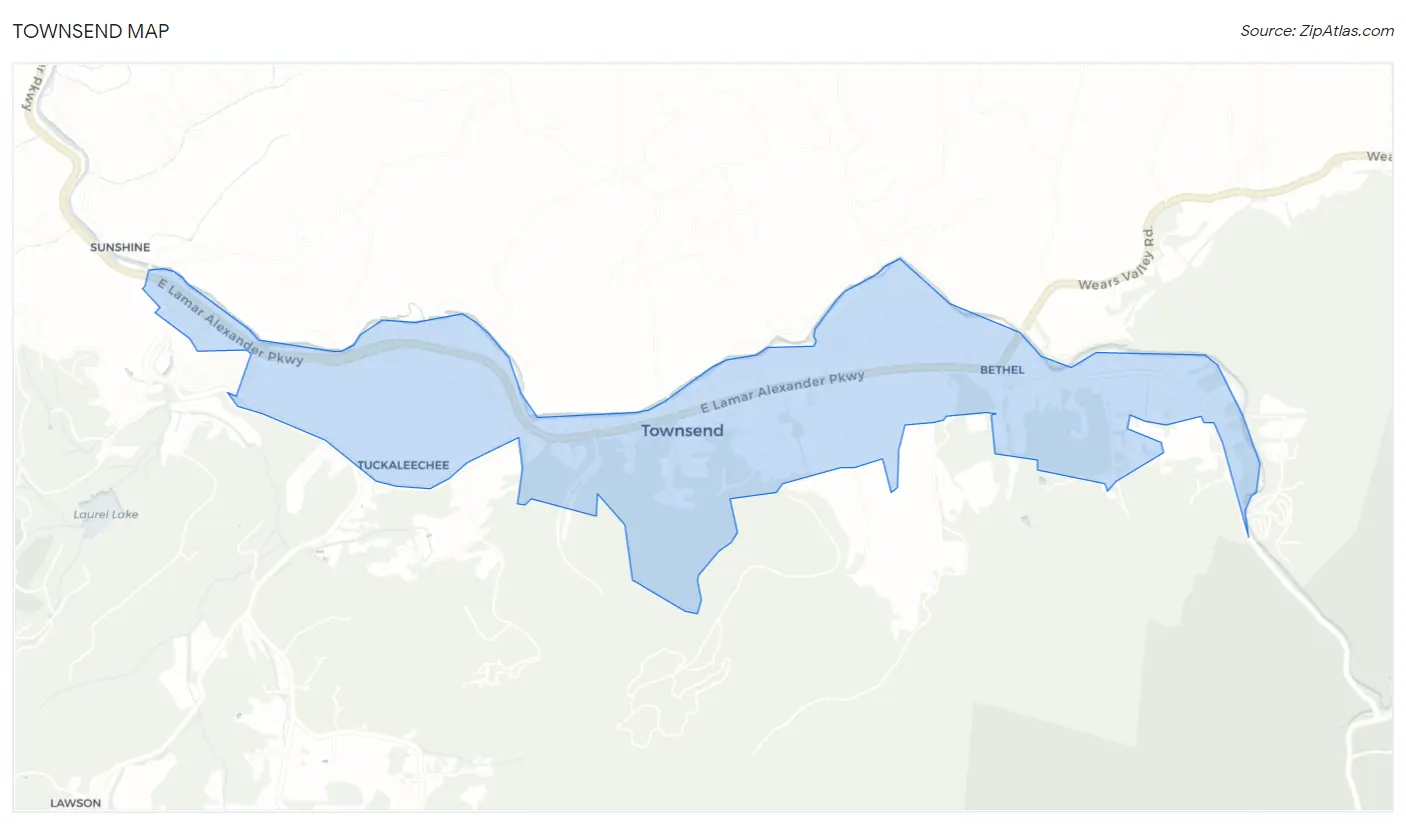
Townsend Overview
$33,246
PER CAPITA INCOME
$79,848
AVG FAMILY INCOME
$78,659
AVG HOUSEHOLD INCOME
42.0%
WAGE / INCOME GAP [ % ]
58.0¢/ $1
WAGE / INCOME GAP [ $ ]
0.33
INEQUALITY / GINI INDEX
583
TOTAL POPULATION
306
MALE POPULATION
277
FEMALE POPULATION
110.47
MALES / 100 FEMALES
90.52
FEMALES / 100 MALES
52.1
MEDIAN AGE
2.7
AVG FAMILY SIZE
2.3
AVG HOUSEHOLD SIZE
184
LABOR FORCE [ PEOPLE ]
36.9%
PERCENT IN LABOR FORCE
4.9%
UNEMPLOYMENT RATE
Townsend Zip Codes
Townsend Area Codes
Income in Townsend
Income Overview in Townsend
Per Capita Income in Townsend is $33,246, while median incomes of families and households are $79,848 and $78,659 respectively.
| Characteristic | Number | Measure |
| Per Capita Income | 583 | $33,246 |
| Median Family Income | 189 | $79,848 |
| Mean Family Income | 189 | $86,941 |
| Median Household Income | 250 | $78,659 |
| Mean Household Income | 250 | $75,704 |
| Income Deficit | 189 | $0 |
| Wage / Income Gap (%) | 583 | 41.99% |
| Wage / Income Gap ($) | 583 | 58.01¢ per $1 |
| Gini / Inequality Index | 583 | 0.33 |
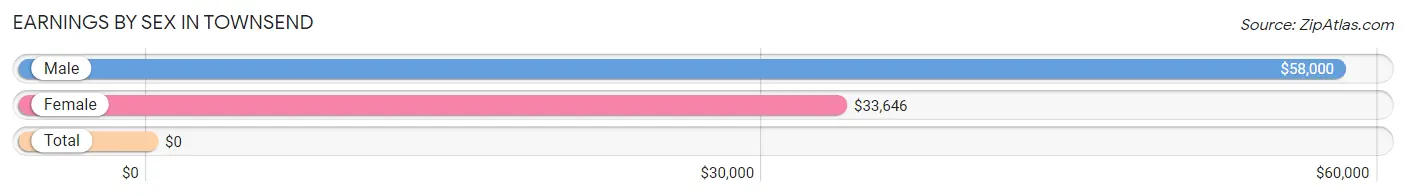
Earnings by Sex in Townsend
| Sex | Number | Average Earnings |
| Male | 140 (67.6%) | $58,000 |
| Female | 67 (32.4%) | $33,646 |
| Total | 207 (100.0%) | $0 |
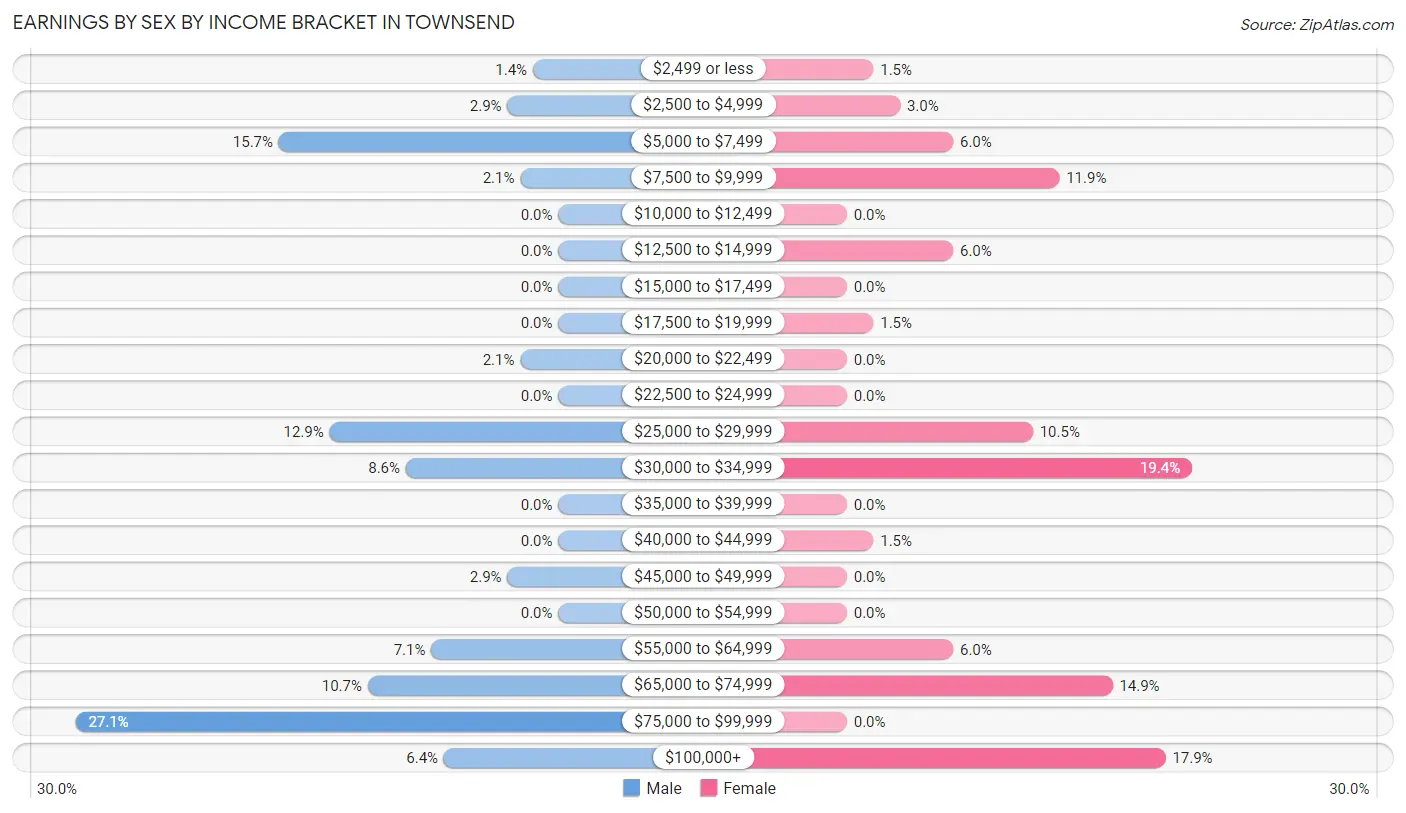
Earnings by Sex by Income Bracket in Townsend
The most common earnings brackets in Townsend are $75,000 to $99,999 for men (38 | 27.1%) and $30,000 to $34,999 for women (13 | 19.4%).
| Income | Male | Female |
| $2,499 or less | 2 (1.4%) | 1 (1.5%) |
| $2,500 to $4,999 | 4 (2.9%) | 2 (3.0%) |
| $5,000 to $7,499 | 22 (15.7%) | 4 (6.0%) |
| $7,500 to $9,999 | 3 (2.1%) | 8 (11.9%) |
| $10,000 to $12,499 | 0 (0.0%) | 0 (0.0%) |
| $12,500 to $14,999 | 0 (0.0%) | 4 (6.0%) |
| $15,000 to $17,499 | 0 (0.0%) | 0 (0.0%) |
| $17,500 to $19,999 | 0 (0.0%) | 1 (1.5%) |
| $20,000 to $22,499 | 3 (2.1%) | 0 (0.0%) |
| $22,500 to $24,999 | 0 (0.0%) | 0 (0.0%) |
| $25,000 to $29,999 | 18 (12.9%) | 7 (10.4%) |
| $30,000 to $34,999 | 12 (8.6%) | 13 (19.4%) |
| $35,000 to $39,999 | 0 (0.0%) | 0 (0.0%) |
| $40,000 to $44,999 | 0 (0.0%) | 1 (1.5%) |
| $45,000 to $49,999 | 4 (2.9%) | 0 (0.0%) |
| $50,000 to $54,999 | 0 (0.0%) | 0 (0.0%) |
| $55,000 to $64,999 | 10 (7.1%) | 4 (6.0%) |
| $65,000 to $74,999 | 15 (10.7%) | 10 (14.9%) |
| $75,000 to $99,999 | 38 (27.1%) | 0 (0.0%) |
| $100,000+ | 9 (6.4%) | 12 (17.9%) |
| Total | 140 (100.0%) | 67 (100.0%) |
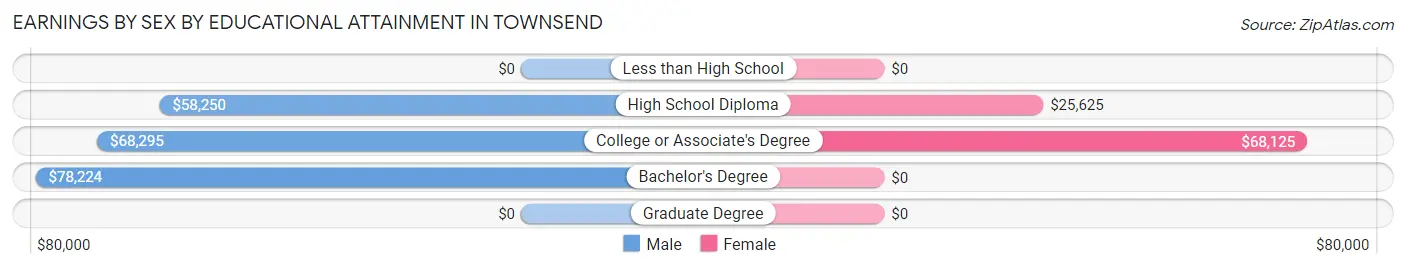
Earnings by Sex by Educational Attainment in Townsend
| Educational Attainment | Male Income | Female Income |
| Less than High School | - | - |
| High School Diploma | $58,250 | $25,625 |
| College or Associate's Degree | $68,295 | $68,125 |
| Bachelor's Degree | $78,224 | $0 |
| Graduate Degree | - | - |
| Total | $68,583 | $0 |
Family Income in Townsend
Family Income Brackets in Townsend
According to the Townsend family income data, there are 77 families falling into the $75,000 to $99,999 income range, which is the most common income bracket and makes up 40.7% of all families. Conversely, the $10,000 to $14,999 income bracket is the least frequent group with only 4 families (2.1%) belonging to this category.
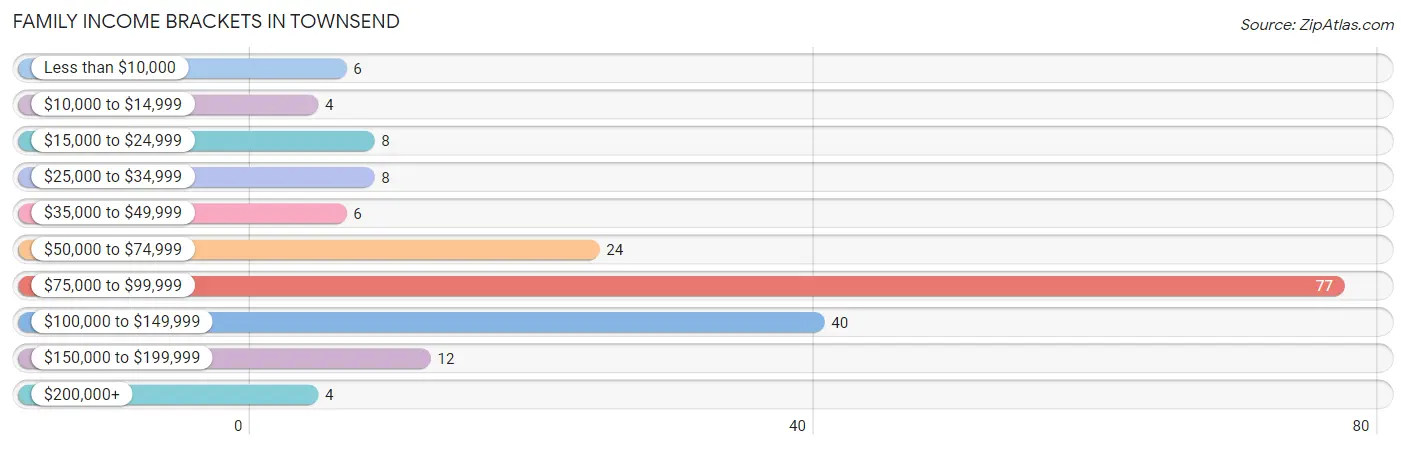
| Income Bracket | # Families | % Families |
| Less than $10,000 | 6 | 3.2% |
| $10,000 to $14,999 | 4 | 2.1% |
| $15,000 to $24,999 | 8 | 4.2% |
| $25,000 to $34,999 | 8 | 4.2% |
| $35,000 to $49,999 | 6 | 3.2% |
| $50,000 to $74,999 | 24 | 12.7% |
| $75,000 to $99,999 | 77 | 40.7% |
| $100,000 to $149,999 | 40 | 21.2% |
| $150,000 to $199,999 | 12 | 6.3% |
| $200,000+ | 4 | 2.1% |
Family Income by Famaliy Size in Townsend
2-person families (108 | 57.1%) account for the highest median family income in Townsend with $87,500 per family, while 2-person families (108 | 57.1%) have the highest median income of $43,750 per family member.
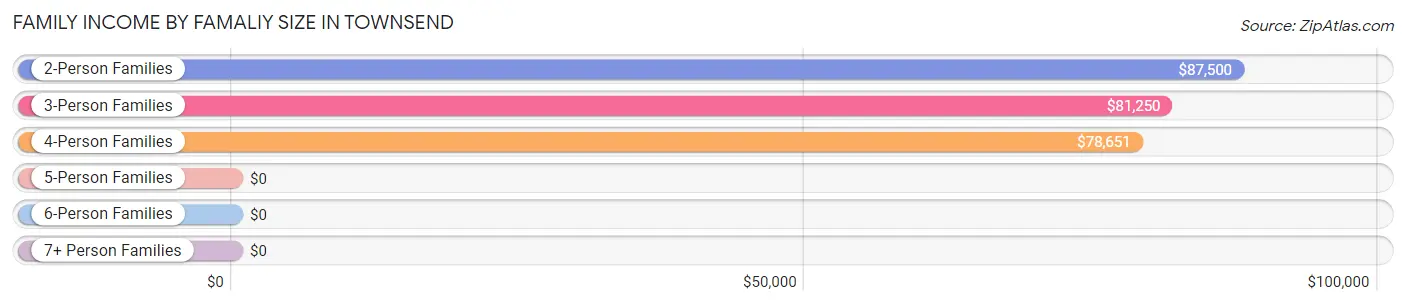
| Income Bracket | # Families | Median Income |
| 2-Person Families | 108 (57.1%) | $87,500 |
| 3-Person Families | 20 (10.6%) | $81,250 |
| 4-Person Families | 41 (21.7%) | $78,651 |
| 5-Person Families | 20 (10.6%) | $0 |
| 6-Person Families | 0 (0.0%) | $0 |
| 7+ Person Families | 0 (0.0%) | $0 |
| Total | 189 (100.0%) | $79,848 |
Family Income by Number of Earners in Townsend
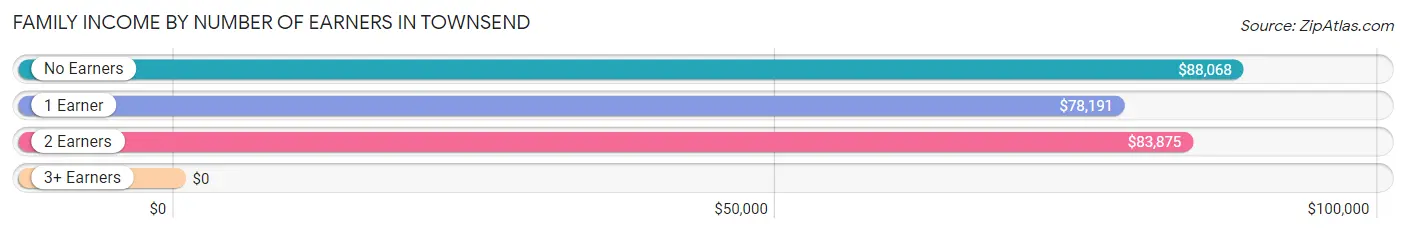
| Number of Earners | # Families | Median Income |
| No Earners | 81 (42.9%) | $88,068 |
| 1 Earner | 61 (32.3%) | $78,191 |
| 2 Earners | 27 (14.3%) | $83,875 |
| 3+ Earners | 20 (10.6%) | $0 |
| Total | 189 (100.0%) | $79,848 |
Household Income in Townsend
Household Income Brackets in Townsend
With 81 households falling in the category, the $75,000 to $99,999 income range is the most frequent in Townsend, accounting for 32.4% of all households. In contrast, only 4 households (1.6%) fall into the $200,000+ income bracket, making it the least populous group.
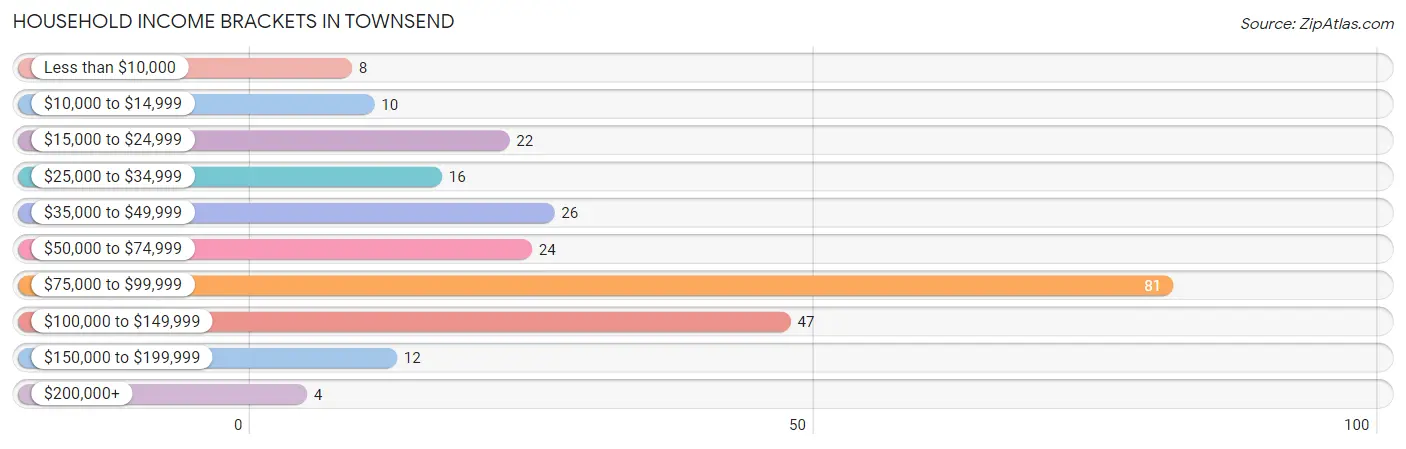
| Income Bracket | # Households | % Households |
| Less than $10,000 | 8 | 3.2% |
| $10,000 to $14,999 | 10 | 4.0% |
| $15,000 to $24,999 | 22 | 8.8% |
| $25,000 to $34,999 | 16 | 6.4% |
| $35,000 to $49,999 | 26 | 10.4% |
| $50,000 to $74,999 | 24 | 9.6% |
| $75,000 to $99,999 | 81 | 32.4% |
| $100,000 to $149,999 | 47 | 18.8% |
| $150,000 to $199,999 | 12 | 4.8% |
| $200,000+ | 4 | 1.6% |
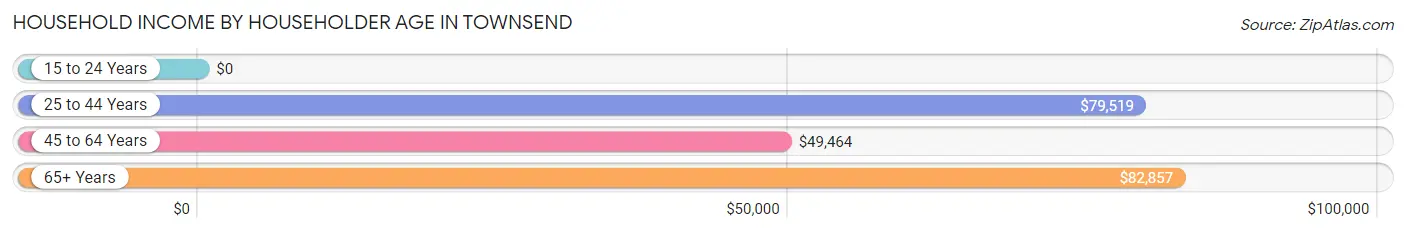
Household Income by Householder Age in Townsend
The median household income in Townsend is $78,659, with the highest median household income of $82,857 found in the 65+ years age bracket for the primary householder. A total of 114 households (45.6%) fall into this category.
| Income Bracket | # Households | Median Income |
| 15 to 24 Years | 0 (0.0%) | $0 |
| 25 to 44 Years | 75 (30.0%) | $79,519 |
| 45 to 64 Years | 61 (24.4%) | $49,464 |
| 65+ Years | 114 (45.6%) | $82,857 |
| Total | 250 (100.0%) | $78,659 |
Poverty in Townsend
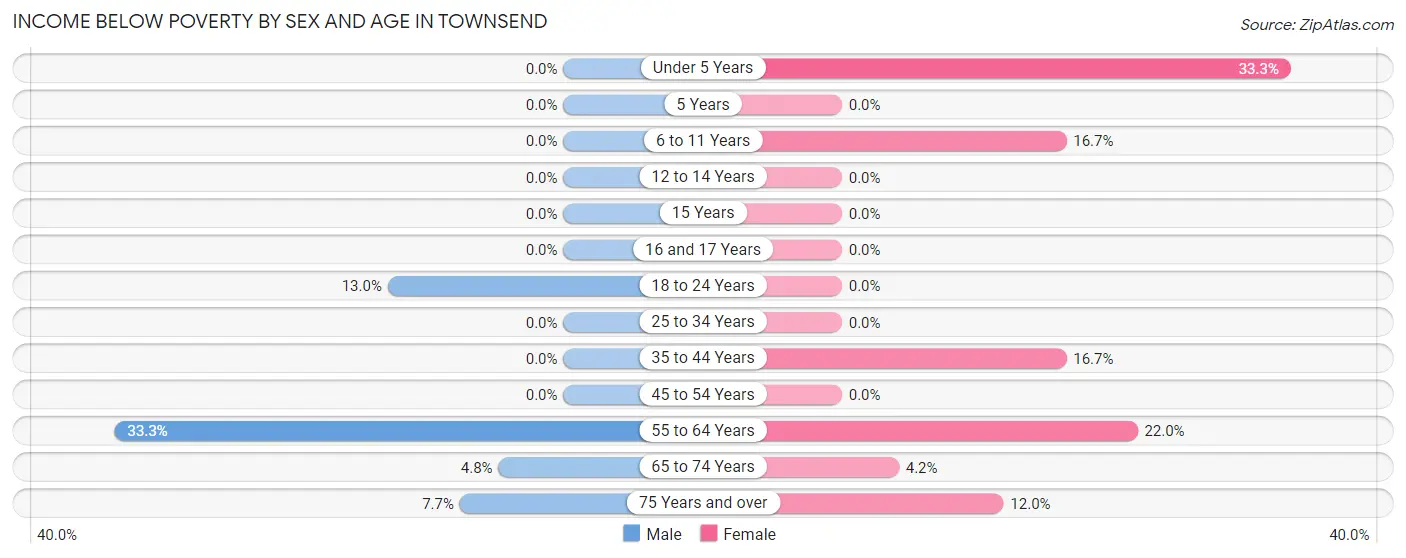
Income Below Poverty by Sex and Age in Townsend
With 6.9% poverty level for males and 9.8% for females among the residents of Townsend, 55 to 64 year old males and under 5 year old females are the most vulnerable to poverty, with 12 males (33.3%) and 1 females (33.3%) in their respective age groups living below the poverty level.
| Age Bracket | Male | Female |
| Under 5 Years | 0 (0.0%) | 1 (33.3%) |
| 5 Years | 0 (0.0%) | 0 (0.0%) |
| 6 to 11 Years | 0 (0.0%) | 7 (16.7%) |
| 12 to 14 Years | 0 (0.0%) | 0 (0.0%) |
| 15 Years | 0 (0.0%) | 0 (0.0%) |
| 16 and 17 Years | 0 (0.0%) | 0 (0.0%) |
| 18 to 24 Years | 3 (13.0%) | 0 (0.0%) |
| 25 to 34 Years | 0 (0.0%) | 0 (0.0%) |
| 35 to 44 Years | 0 (0.0%) | 4 (16.7%) |
| 45 to 54 Years | 0 (0.0%) | 0 (0.0%) |
| 55 to 64 Years | 12 (33.3%) | 9 (22.0%) |
| 65 to 74 Years | 4 (4.8%) | 3 (4.2%) |
| 75 Years and over | 2 (7.7%) | 3 (12.0%) |
| Total | 21 (6.9%) | 27 (9.8%) |
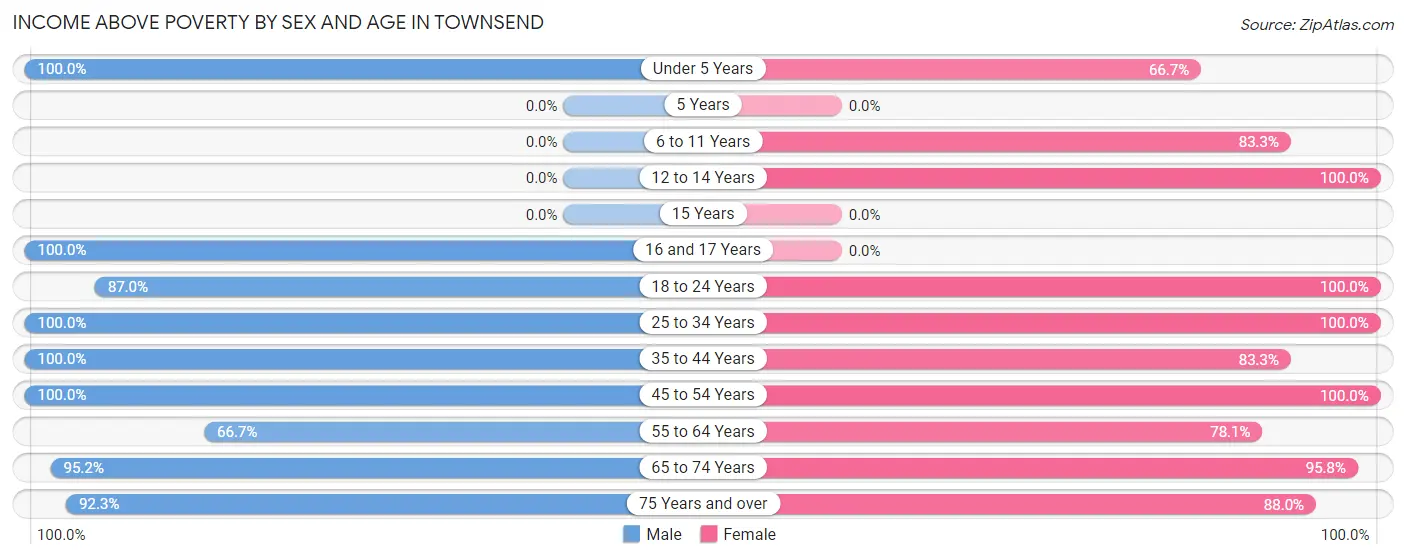
Income Above Poverty by Sex and Age in Townsend
According to the poverty statistics in Townsend, males aged under 5 years and females aged 12 to 14 years are the age groups that are most secure financially, with 100.0% of males and 100.0% of females in these age groups living above the poverty line.
| Age Bracket | Male | Female |
| Under 5 Years | 30 (100.0%) | 2 (66.7%) |
| 5 Years | 0 (0.0%) | 0 (0.0%) |
| 6 to 11 Years | 0 (0.0%) | 35 (83.3%) |
| 12 to 14 Years | 0 (0.0%) | 10 (100.0%) |
| 15 Years | 0 (0.0%) | 0 (0.0%) |
| 16 and 17 Years | 10 (100.0%) | 0 (0.0%) |
| 18 to 24 Years | 20 (87.0%) | 33 (100.0%) |
| 25 to 34 Years | 49 (100.0%) | 18 (100.0%) |
| 35 to 44 Years | 29 (100.0%) | 20 (83.3%) |
| 45 to 54 Years | 20 (100.0%) | 10 (100.0%) |
| 55 to 64 Years | 24 (66.7%) | 32 (78.0%) |
| 65 to 74 Years | 79 (95.2%) | 68 (95.8%) |
| 75 Years and over | 24 (92.3%) | 22 (88.0%) |
| Total | 285 (93.1%) | 250 (90.2%) |
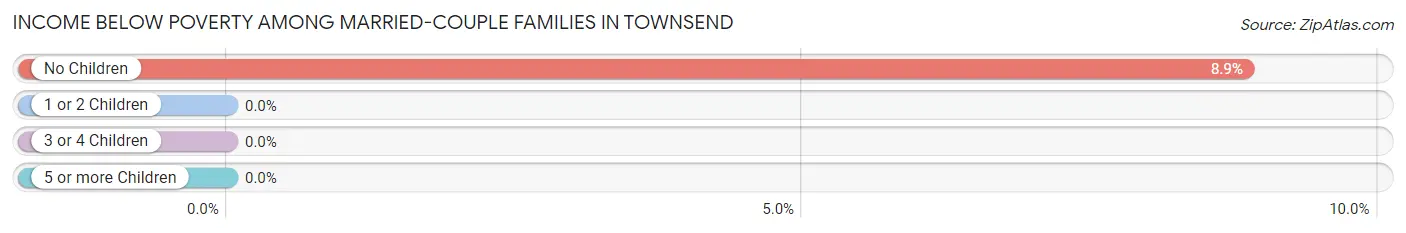
Income Below Poverty Among Married-Couple Families in Townsend
The poverty statistics for married-couple families in Townsend show that 5.8% or 10 of the total 174 families live below the poverty line. Families with no children have the highest poverty rate of 8.8%, comprising of 10 families. On the other hand, families with 1 or 2 children have the lowest poverty rate of 0.0%, which includes 0 families.
| Children | Above Poverty | Below Poverty |
| No Children | 103 (91.1%) | 10 (8.8%) |
| 1 or 2 Children | 61 (100.0%) | 0 (0.0%) |
| 3 or 4 Children | 0 (0.0%) | 0 (0.0%) |
| 5 or more Children | 0 (0.0%) | 0 (0.0%) |
| Total | 164 (94.3%) | 10 (5.8%) |
Income Below Poverty Among Single-Parent Households in Townsend
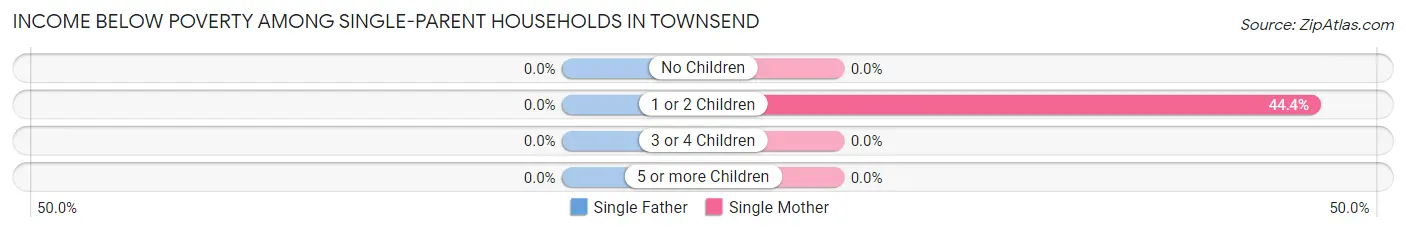
| Children | Single Father | Single Mother |
| No Children | 0 (0.0%) | 0 (0.0%) |
| 1 or 2 Children | 0 (0.0%) | 4 (44.4%) |
| 3 or 4 Children | 0 (0.0%) | 0 (0.0%) |
| 5 or more Children | 0 (0.0%) | 0 (0.0%) |
| Total | 0 (0.0%) | 4 (30.8%) |
Income Below Poverty Among Married-Couple vs Single-Parent Households in Townsend
The poverty data for Townsend shows that 10 of the married-couple family households (5.8%) and 4 of the single-parent households (26.7%) are living below the poverty level. Within the married-couple family households, those with no children have the highest poverty rate, with 10 households (8.8%) falling below the poverty line. Among the single-parent households, those with 1 or 2 children have the highest poverty rate, with 4 household (44.4%) living below poverty.
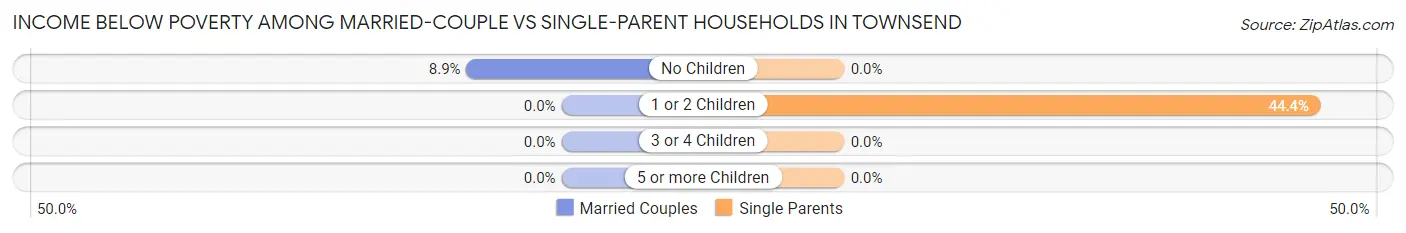
| Children | Married-Couple Families | Single-Parent Households |
| No Children | 10 (8.8%) | 0 (0.0%) |
| 1 or 2 Children | 0 (0.0%) | 4 (44.4%) |
| 3 or 4 Children | 0 (0.0%) | 0 (0.0%) |
| 5 or more Children | 0 (0.0%) | 0 (0.0%) |
| Total | 10 (5.8%) | 4 (26.7%) |
Race in Townsend
The most populous races in Townsend are White / Caucasian (546 | 93.6%), Two or more Races (26 | 4.5%), and Hispanic or Latino (8 | 1.4%).
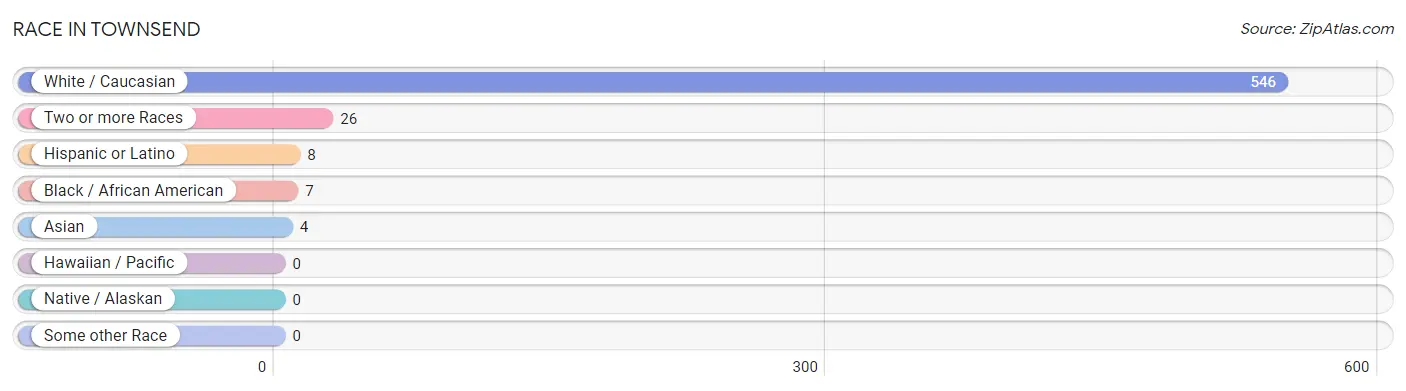
| Race | # Population | % Population |
| Asian | 4 | 0.7% |
| Black / African American | 7 | 1.2% |
| Hawaiian / Pacific | 0 | 0.0% |
| Hispanic or Latino | 8 | 1.4% |
| Native / Alaskan | 0 | 0.0% |
| White / Caucasian | 546 | 93.6% |
| Two or more Races | 26 | 4.5% |
| Some other Race | 0 | 0.0% |
| Total | 583 | 100.0% |
Ancestry in Townsend
The most populous ancestries reported in Townsend are English (107 | 18.3%), German (104 | 17.8%), Irish (95 | 16.3%), Italian (46 | 7.9%), and American (28 | 4.8%), together accounting for 65.2% of all Townsend residents.
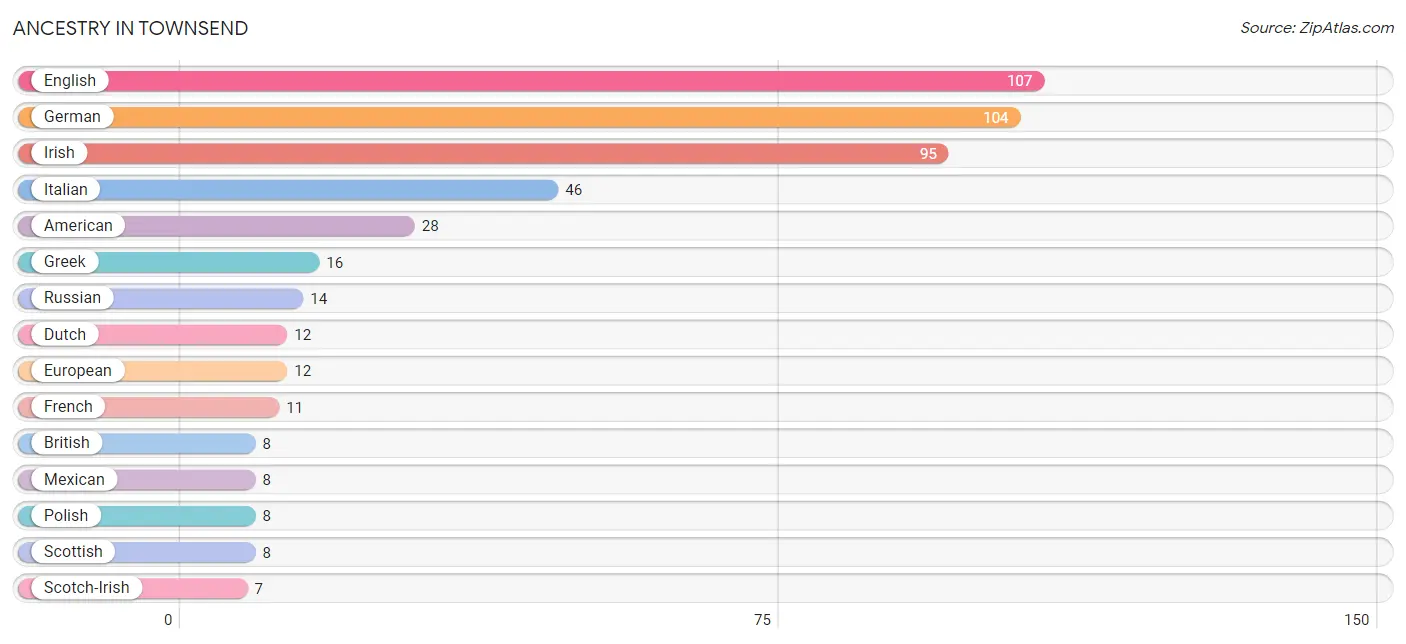
| Ancestry | # Population | % Population |
| American | 28 | 4.8% |
| British | 8 | 1.4% |
| Dutch | 12 | 2.1% |
| English | 107 | 18.3% |
| European | 12 | 2.1% |
| French | 11 | 1.9% |
| German | 104 | 17.8% |
| Greek | 16 | 2.7% |
| Hungarian | 2 | 0.3% |
| Irish | 95 | 16.3% |
| Italian | 46 | 7.9% |
| Mexican | 8 | 1.4% |
| Polish | 8 | 1.4% |
| Russian | 14 | 2.4% |
| Scotch-Irish | 7 | 1.2% |
| Scottish | 8 | 1.4% |
| Sri Lankan | 4 | 0.7% |
| Welsh | 2 | 0.3% | View All 18 Rows |
Immigrants in Townsend
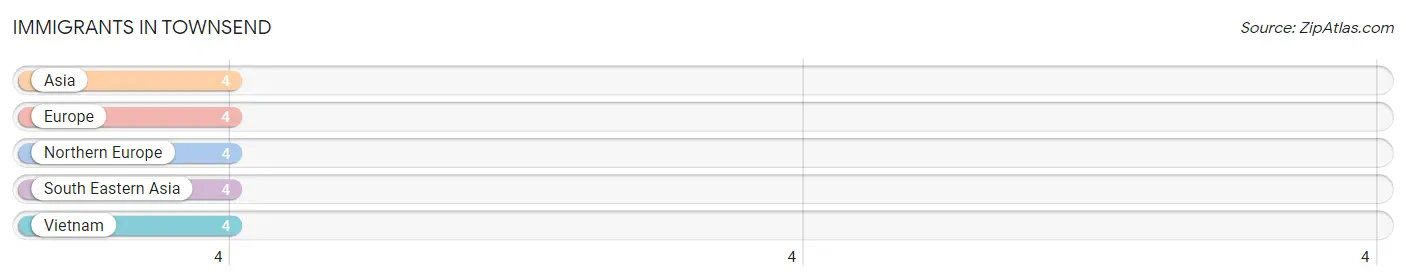
The most numerous immigrant groups reported in Townsend came from Asia (4 | 0.7%), Europe (4 | 0.7%), Northern Europe (4 | 0.7%), South Eastern Asia (4 | 0.7%), and Vietnam (4 | 0.7%), together accounting for 3.5% of all Townsend residents.
| Immigration Origin | # Population | % Population |
| Asia | 4 | 0.7% |
| Europe | 4 | 0.7% |
| Northern Europe | 4 | 0.7% |
| South Eastern Asia | 4 | 0.7% |
| Vietnam | 4 | 0.7% | View All 5 Rows |
Sex and Age in Townsend
Sex and Age in Townsend
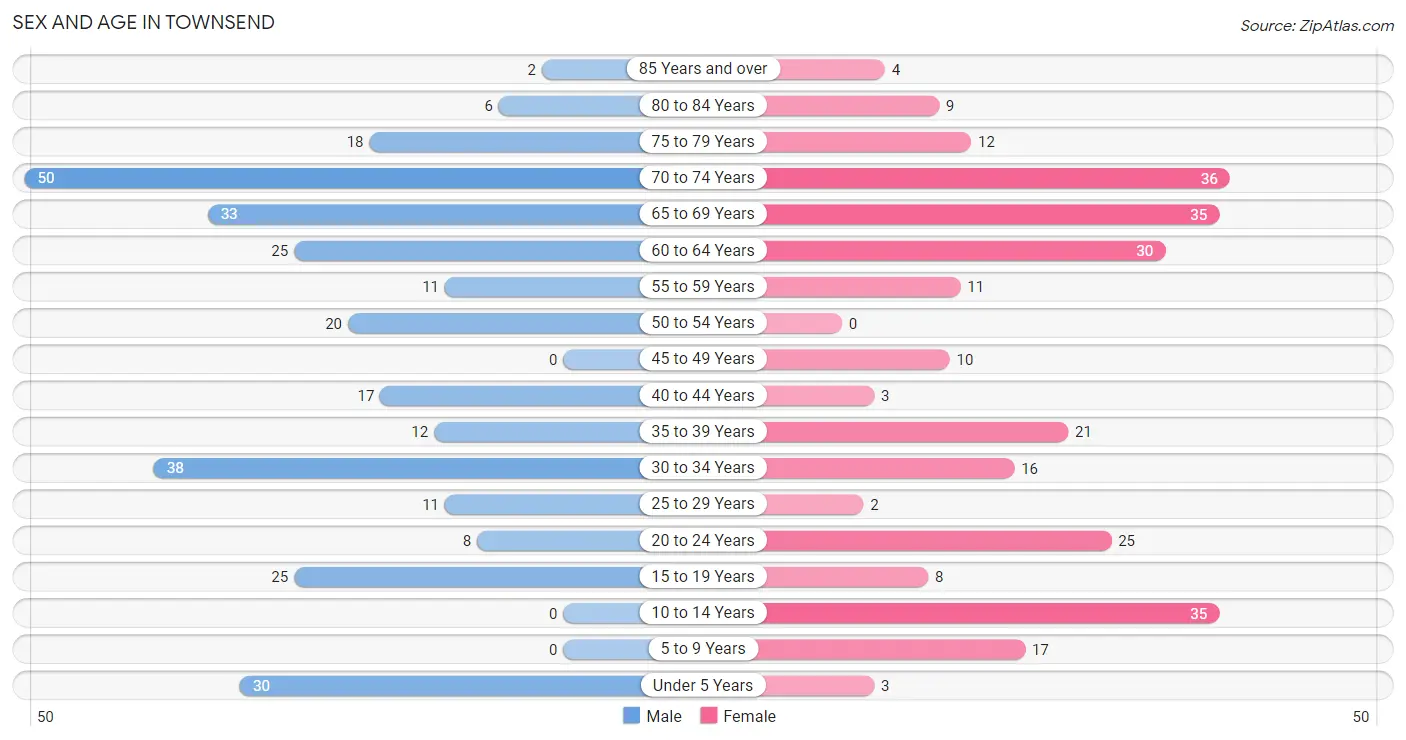
The most populous age groups in Townsend are 70 to 74 Years (50 | 16.3%) for men and 70 to 74 Years (36 | 13.0%) for women.
| Age Bracket | Male | Female |
| Under 5 Years | 30 (9.8%) | 3 (1.1%) |
| 5 to 9 Years | 0 (0.0%) | 17 (6.1%) |
| 10 to 14 Years | 0 (0.0%) | 35 (12.6%) |
| 15 to 19 Years | 25 (8.2%) | 8 (2.9%) |
| 20 to 24 Years | 8 (2.6%) | 25 (9.0%) |
| 25 to 29 Years | 11 (3.6%) | 2 (0.7%) |
| 30 to 34 Years | 38 (12.4%) | 16 (5.8%) |
| 35 to 39 Years | 12 (3.9%) | 21 (7.6%) |
| 40 to 44 Years | 17 (5.6%) | 3 (1.1%) |
| 45 to 49 Years | 0 (0.0%) | 10 (3.6%) |
| 50 to 54 Years | 20 (6.5%) | 0 (0.0%) |
| 55 to 59 Years | 11 (3.6%) | 11 (4.0%) |
| 60 to 64 Years | 25 (8.2%) | 30 (10.8%) |
| 65 to 69 Years | 33 (10.8%) | 35 (12.6%) |
| 70 to 74 Years | 50 (16.3%) | 36 (13.0%) |
| 75 to 79 Years | 18 (5.9%) | 12 (4.3%) |
| 80 to 84 Years | 6 (2.0%) | 9 (3.3%) |
| 85 Years and over | 2 (0.6%) | 4 (1.4%) |
| Total | 306 (100.0%) | 277 (100.0%) |
Families and Households in Townsend
Median Family Size in Townsend
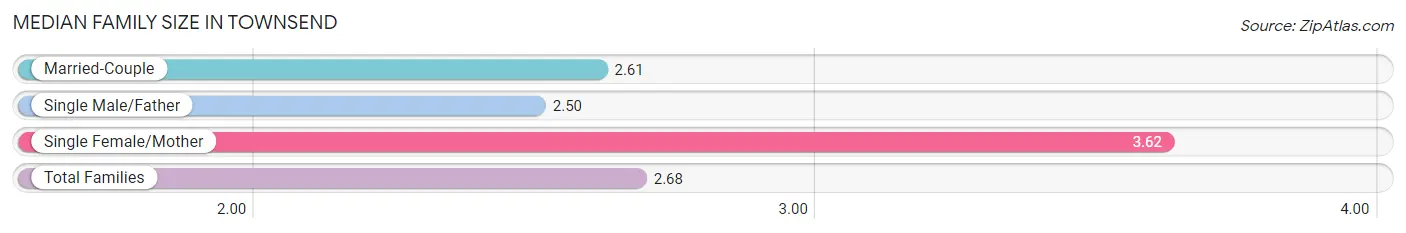
The median family size in Townsend is 2.68 persons per family, with single female/mother families (13 | 6.9%) accounting for the largest median family size of 3.62 persons per family. On the other hand, single male/father families (2 | 1.1%) represent the smallest median family size with 2.50 persons per family.
| Family Type | # Families | Family Size |
| Married-Couple | 174 (92.1%) | 2.61 |
| Single Male/Father | 2 (1.1%) | 2.50 |
| Single Female/Mother | 13 (6.9%) | 3.62 |
| Total Families | 189 (100.0%) | 2.68 |
Median Household Size in Townsend
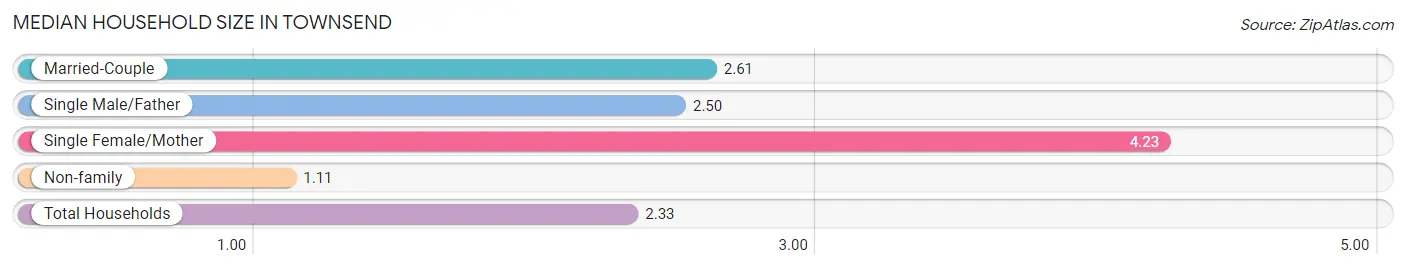
The median household size in Townsend is 2.33 persons per household, with single female/mother households (13 | 5.2%) accounting for the largest median household size of 4.23 persons per household. non-family households (61 | 24.4%) represent the smallest median household size with 1.11 persons per household.
| Household Type | # Households | Household Size |
| Married-Couple | 174 (69.6%) | 2.61 |
| Single Male/Father | 2 (0.8%) | 2.50 |
| Single Female/Mother | 13 (5.2%) | 4.23 |
| Non-family | 61 (24.4%) | 1.11 |
| Total Households | 250 (100.0%) | 2.33 |
Household Size by Marriage Status in Townsend
Out of a total of 250 households in Townsend, 189 (75.6%) are family households, while 61 (24.4%) are nonfamily households. The most numerous type of family households are 2-person households, comprising 103, and the most common type of nonfamily households are 1-person households, comprising 54.
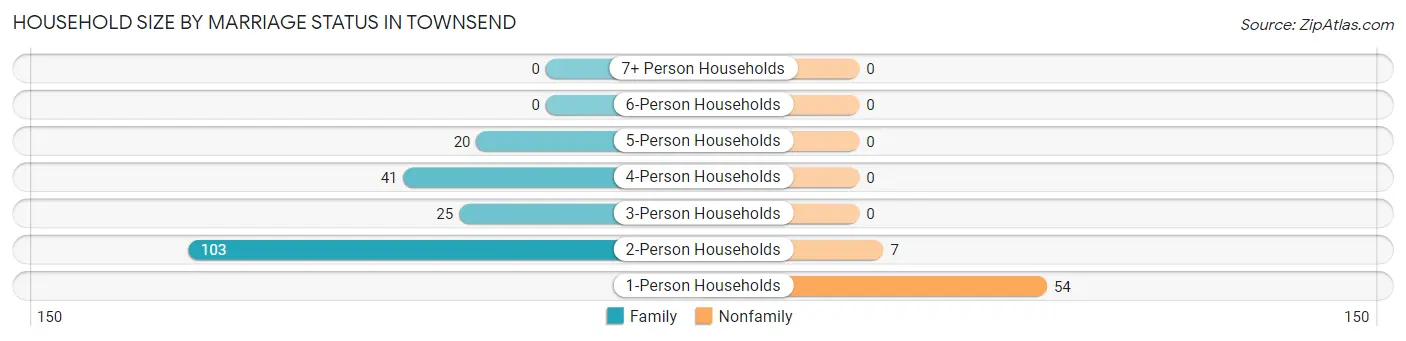
| Household Size | Family Households | Nonfamily Households |
| 1-Person Households | - | 54 (21.6%) |
| 2-Person Households | 103 (41.2%) | 7 (2.8%) |
| 3-Person Households | 25 (10.0%) | 0 (0.0%) |
| 4-Person Households | 41 (16.4%) | 0 (0.0%) |
| 5-Person Households | 20 (8.0%) | 0 (0.0%) |
| 6-Person Households | 0 (0.0%) | 0 (0.0%) |
| 7+ Person Households | 0 (0.0%) | 0 (0.0%) |
| Total | 189 (75.6%) | 61 (24.4%) |
Female Fertility in Townsend
Fertility by Age in Townsend
Average fertility rate in Townsend is 318.0 births per 1,000 women. Women in the age bracket of 20 to 34 years have the highest fertility rate with 628.0 births per 1,000 women. Women in the age bracket of 20 to 34 years acount for 100.0% of all women with births.
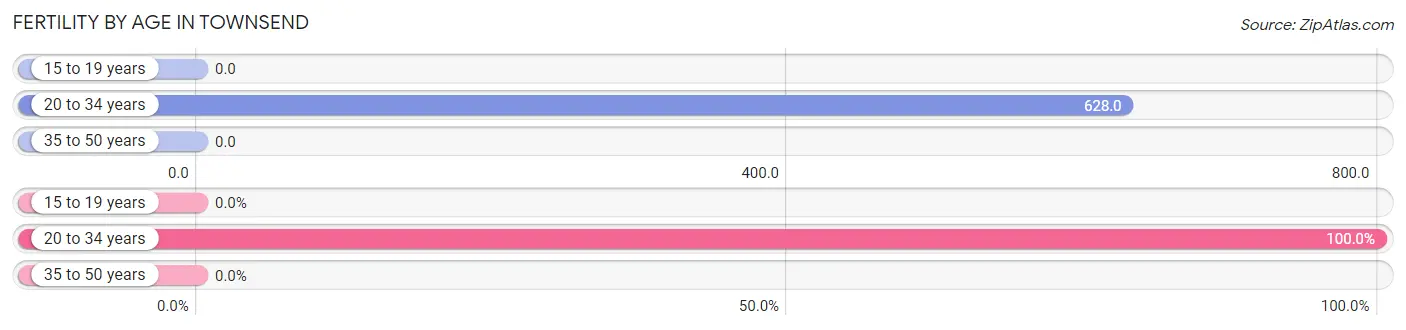
| Age Bracket | Women with Births | Births / 1,000 Women |
| 15 to 19 years | 0 (0.0%) | 0.0 |
| 20 to 34 years | 27 (100.0%) | 628.0 |
| 35 to 50 years | 0 (0.0%) | 0.0 |
| Total | 27 (100.0%) | 318.0 |
Fertility by Age by Marriage Status in Townsend
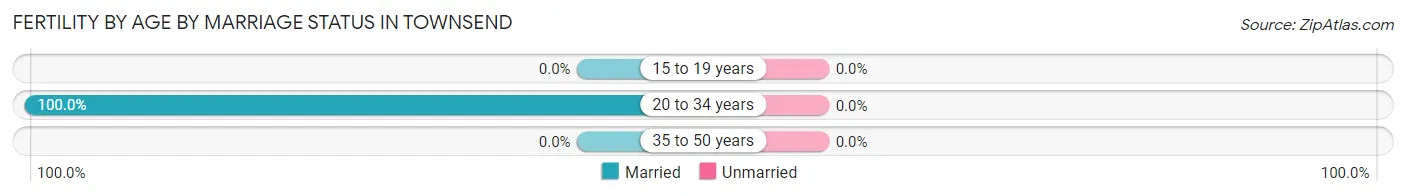
| Age Bracket | Married | Unmarried |
| 15 to 19 years | 0 (0.0%) | 0 (0.0%) |
| 20 to 34 years | 27 (100.0%) | 0 (0.0%) |
| 35 to 50 years | 0 (0.0%) | 0 (0.0%) |
| Total | 27 (100.0%) | 0 (0.0%) |
Fertility by Education in Townsend
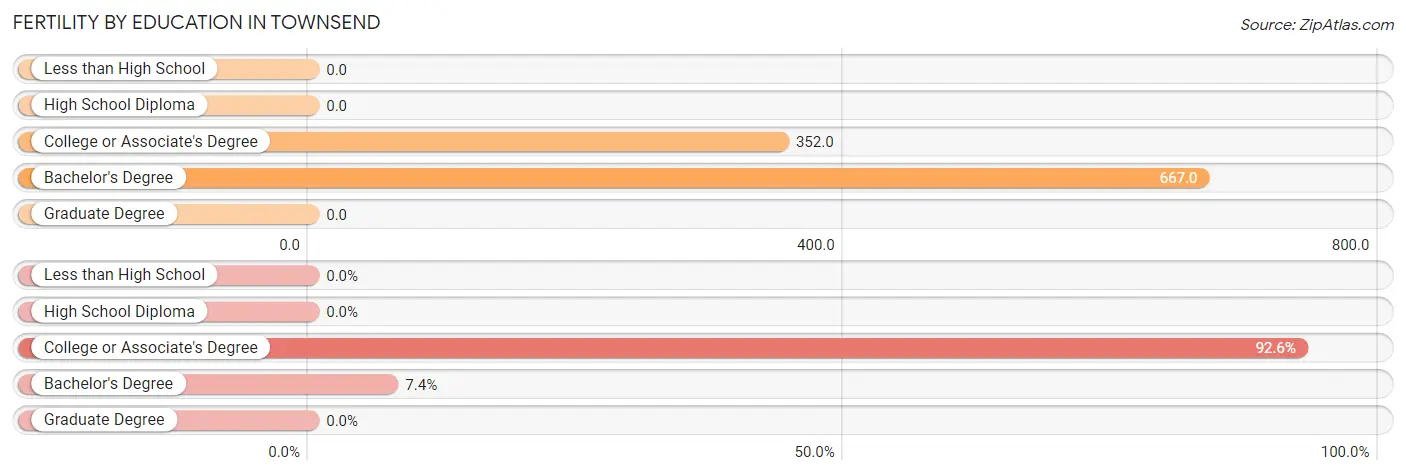
| Educational Attainment | Women with Births | Births / 1,000 Women |
| Less than High School | 0 (0.0%) | 0.0 |
| High School Diploma | 0 (0.0%) | 0.0 |
| College or Associate's Degree | 25 (92.6%) | 352.0 |
| Bachelor's Degree | 2 (7.4%) | 667.0 |
| Graduate Degree | 0 (0.0%) | 0.0 |
| Total | 27 (100.0%) | 318.0 |
Fertility by Education by Marriage Status in Townsend
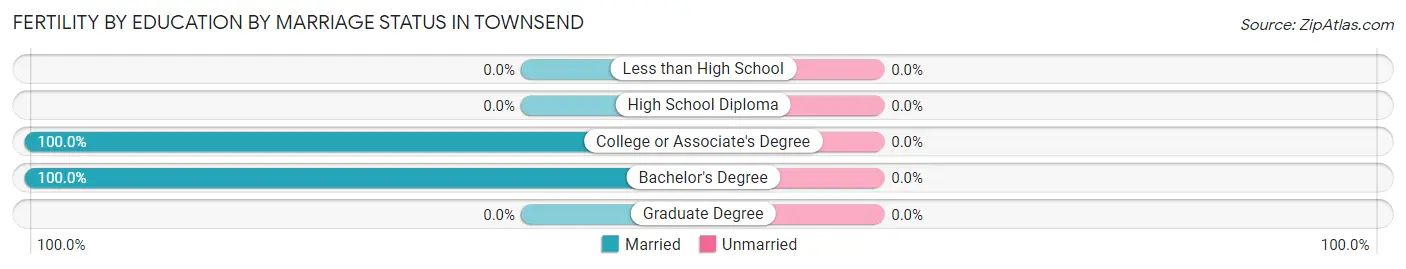
| Educational Attainment | Married | Unmarried |
| Less than High School | 0 (0.0%) | 0 (0.0%) |
| High School Diploma | 0 (0.0%) | 0 (0.0%) |
| College or Associate's Degree | 25 (100.0%) | 0 (0.0%) |
| Bachelor's Degree | 2 (100.0%) | 0 (0.0%) |
| Graduate Degree | 0 (0.0%) | 0 (0.0%) |
| Total | 27 (100.0%) | 0 (0.0%) |
Employment Characteristics in Townsend
Employment by Class of Employer in Townsend
Among the 175 employed individuals in Townsend, private company employees (78 | 44.6%), self-employed (incorporated) (38 | 21.7%), and not-for-profit organizations (35 | 20.0%) make up the most common classes of employment.
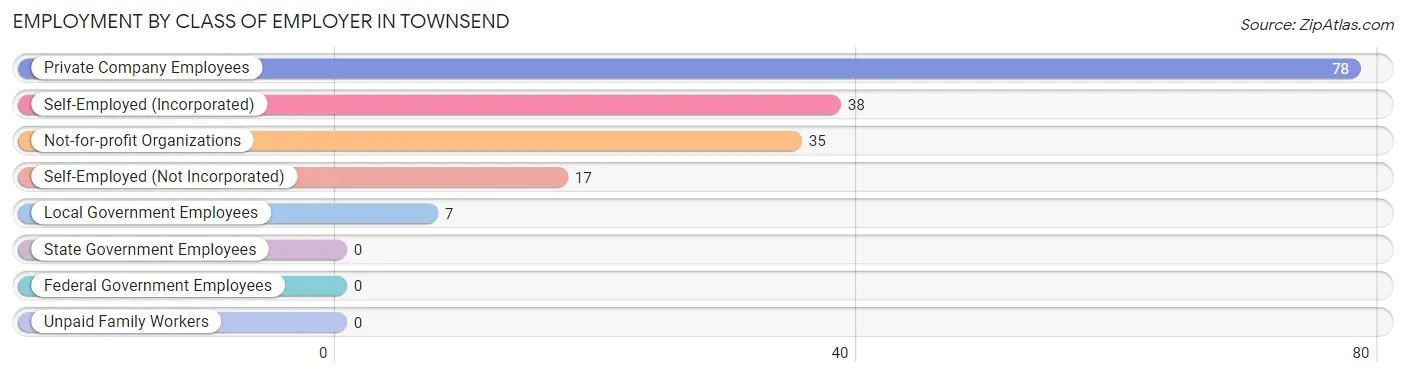
| Employer Class | # Employees | % Employees |
| Private Company Employees | 78 | 44.6% |
| Self-Employed (Incorporated) | 38 | 21.7% |
| Self-Employed (Not Incorporated) | 17 | 9.7% |
| Not-for-profit Organizations | 35 | 20.0% |
| Local Government Employees | 7 | 4.0% |
| State Government Employees | 0 | 0.0% |
| Federal Government Employees | 0 | 0.0% |
| Unpaid Family Workers | 0 | 0.0% |
| Total | 175 | 100.0% |
Employment Status by Age in Townsend
According to the labor force statistics for Townsend, out of the total population over 16 years of age (498), 36.9% or 184 individuals are in the labor force, with 4.9% or 9 of them unemployed. The age group with the highest labor force participation rate is 35 to 44 years, with 98.1% or 52 individuals in the labor force. Within the labor force, the 20 to 24 years age range has the highest percentage of unemployed individuals, with 100.0% or 8 of them being unemployed.
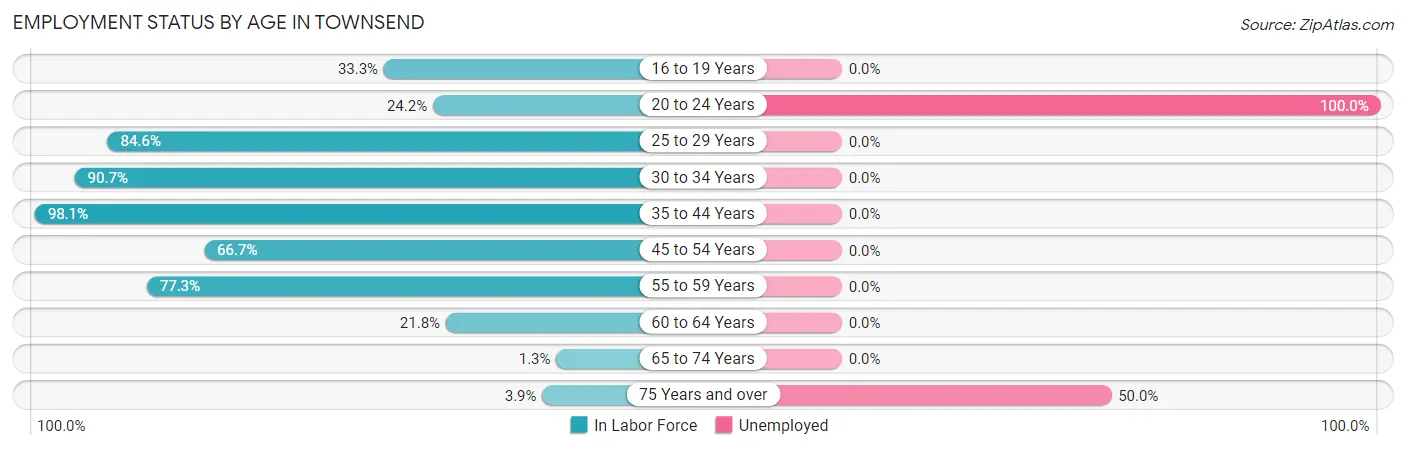
| Age Bracket | In Labor Force | Unemployed |
| 16 to 19 Years | 11 (33.3%) | 0 (0.0%) |
| 20 to 24 Years | 8 (24.2%) | 8 (100.0%) |
| 25 to 29 Years | 11 (84.6%) | 0 (0.0%) |
| 30 to 34 Years | 49 (90.7%) | 0 (0.0%) |
| 35 to 44 Years | 52 (98.1%) | 0 (0.0%) |
| 45 to 54 Years | 20 (66.7%) | 0 (0.0%) |
| 55 to 59 Years | 17 (77.3%) | 0 (0.0%) |
| 60 to 64 Years | 12 (21.8%) | 0 (0.0%) |
| 65 to 74 Years | 2 (1.3%) | 0 (0.0%) |
| 75 Years and over | 2 (3.9%) | 1 (50.0%) |
| Total | 184 (36.9%) | 9 (4.9%) |
Employment Status by Educational Attainment in Townsend
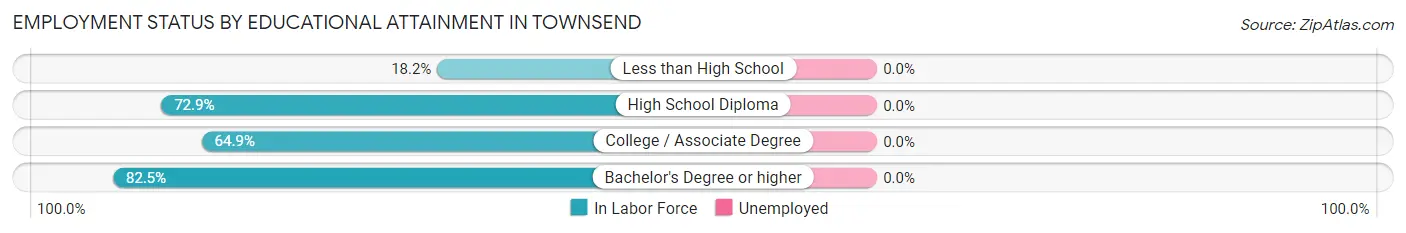
| Educational Attainment | In Labor Force | Unemployed |
| Less than High School | 2 (18.2%) | 0 (0.0%) |
| High School Diploma | 43 (72.9%) | 0 (0.0%) |
| College / Associate Degree | 50 (64.9%) | 0 (0.0%) |
| Bachelor's Degree or higher | 66 (82.5%) | 0 (0.0%) |
| Total | 161 (70.9%) | 0 (0.0%) |
Employment Occupations by Sex in Townsend
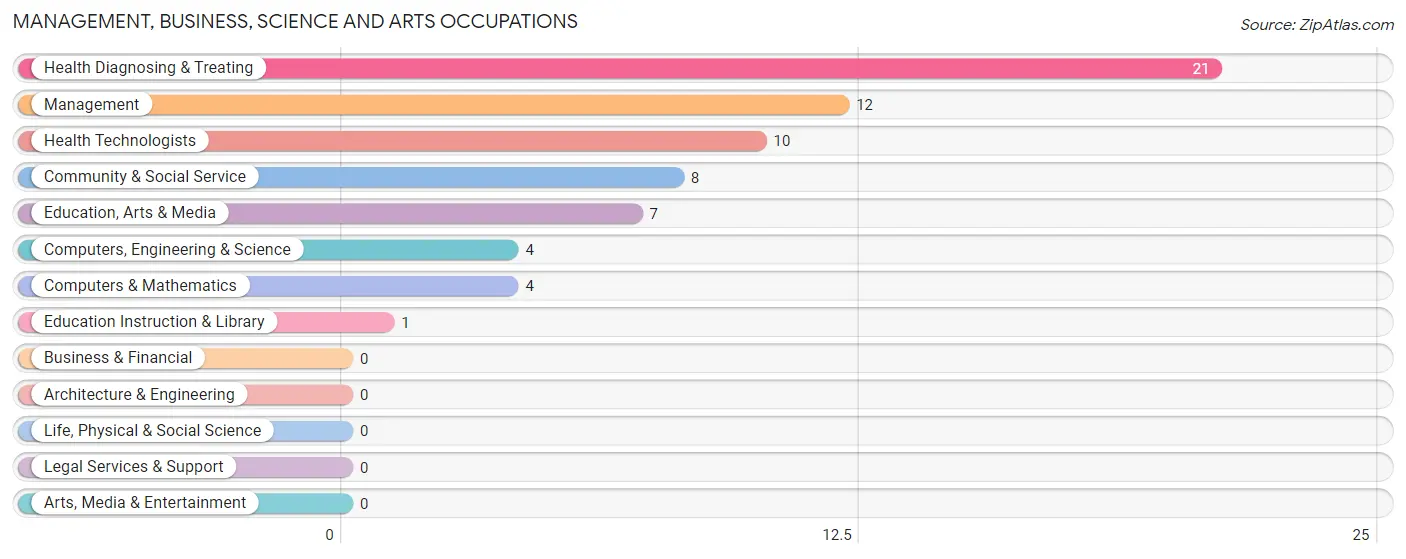
Management, Business, Science and Arts Occupations
The most common Management, Business, Science and Arts occupations in Townsend are Health Diagnosing & Treating (21 | 12.0%), Management (12 | 6.9%), Health Technologists (10 | 5.7%), Community & Social Service (8 | 4.6%), and Education, Arts & Media (7 | 4.0%).
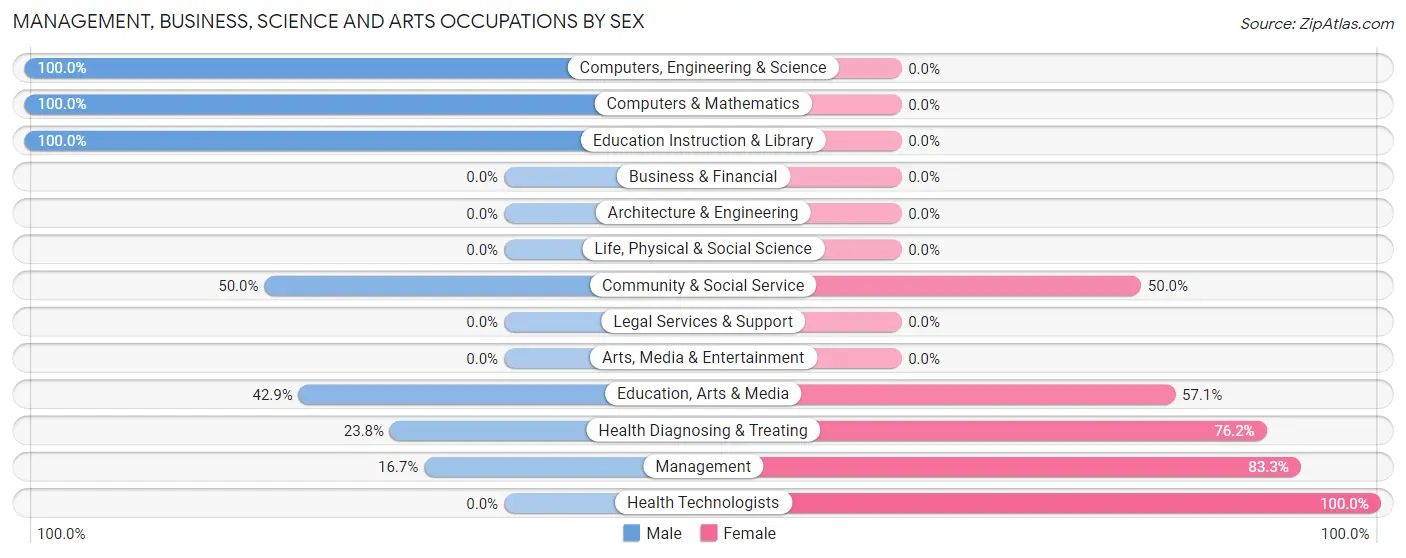
Management, Business, Science and Arts Occupations by Sex
Within the Management, Business, Science and Arts occupations in Townsend, the most male-oriented occupations are Computers, Engineering & Science (100.0%), Computers & Mathematics (100.0%), and Education Instruction & Library (100.0%), while the most female-oriented occupations are Health Technologists (100.0%), Management (83.3%), and Health Diagnosing & Treating (76.2%).
| Occupation | Male | Female |
| Management | 2 (16.7%) | 10 (83.3%) |
| Business & Financial | 0 (0.0%) | 0 (0.0%) |
| Computers, Engineering & Science | 4 (100.0%) | 0 (0.0%) |
| Computers & Mathematics | 4 (100.0%) | 0 (0.0%) |
| Architecture & Engineering | 0 (0.0%) | 0 (0.0%) |
| Life, Physical & Social Science | 0 (0.0%) | 0 (0.0%) |
| Community & Social Service | 4 (50.0%) | 4 (50.0%) |
| Education, Arts & Media | 3 (42.9%) | 4 (57.1%) |
| Legal Services & Support | 0 (0.0%) | 0 (0.0%) |
| Education Instruction & Library | 1 (100.0%) | 0 (0.0%) |
| Arts, Media & Entertainment | 0 (0.0%) | 0 (0.0%) |
| Health Diagnosing & Treating | 5 (23.8%) | 16 (76.2%) |
| Health Technologists | 0 (0.0%) | 10 (100.0%) |
| Total (Category) | 15 (33.3%) | 30 (66.7%) |
| Total (Overall) | 110 (62.9%) | 65 (37.1%) |
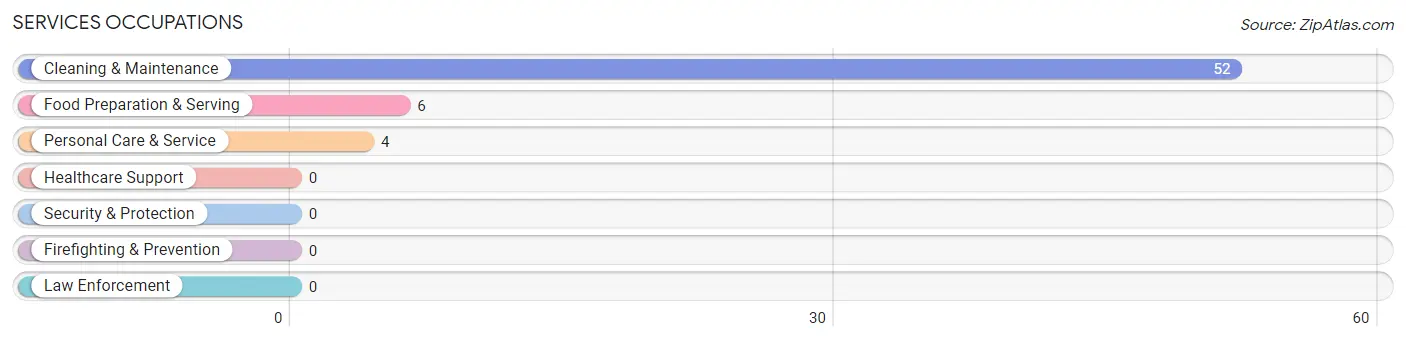
Services Occupations
The most common Services occupations in Townsend are Cleaning & Maintenance (52 | 29.7%), Food Preparation & Serving (6 | 3.4%), and Personal Care & Service (4 | 2.3%).
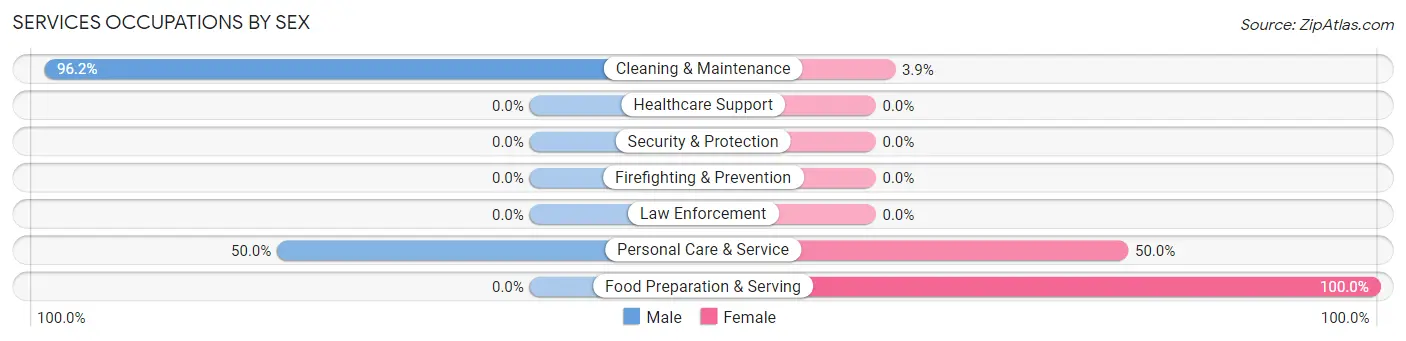
Services Occupations by Sex
Within the Services occupations in Townsend, the most male-oriented occupations are Cleaning & Maintenance (96.2%), and Personal Care & Service (50.0%), while the most female-oriented occupations are Food Preparation & Serving (100.0%), Personal Care & Service (50.0%), and Cleaning & Maintenance (3.8%).
| Occupation | Male | Female |
| Healthcare Support | 0 (0.0%) | 0 (0.0%) |
| Security & Protection | 0 (0.0%) | 0 (0.0%) |
| Firefighting & Prevention | 0 (0.0%) | 0 (0.0%) |
| Law Enforcement | 0 (0.0%) | 0 (0.0%) |
| Food Preparation & Serving | 0 (0.0%) | 6 (100.0%) |
| Cleaning & Maintenance | 50 (96.2%) | 2 (3.8%) |
| Personal Care & Service | 2 (50.0%) | 2 (50.0%) |
| Total (Category) | 52 (83.9%) | 10 (16.1%) |
| Total (Overall) | 110 (62.9%) | 65 (37.1%) |
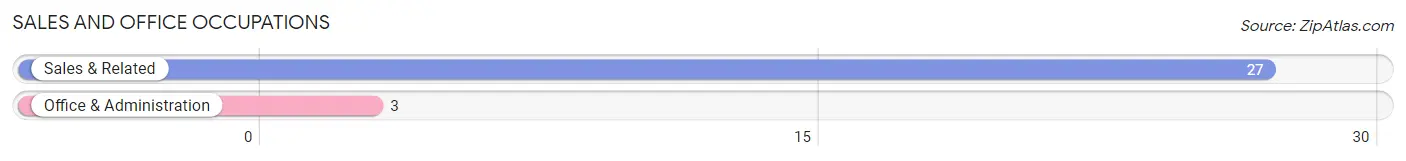
Sales and Office Occupations
The most common Sales and Office occupations in Townsend are Sales & Related (27 | 15.4%), and Office & Administration (3 | 1.7%).
Sales and Office Occupations by Sex
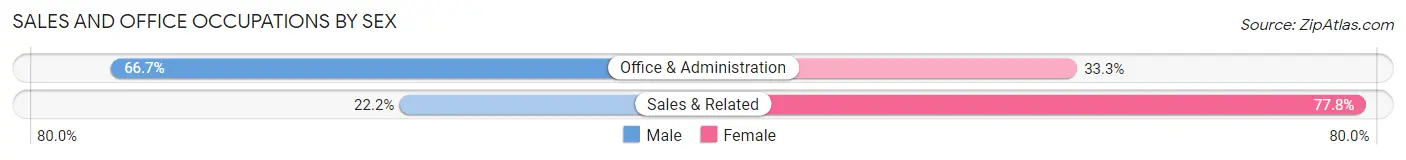
| Occupation | Male | Female |
| Sales & Related | 6 (22.2%) | 21 (77.8%) |
| Office & Administration | 2 (66.7%) | 1 (33.3%) |
| Total (Category) | 8 (26.7%) | 22 (73.3%) |
| Total (Overall) | 110 (62.9%) | 65 (37.1%) |
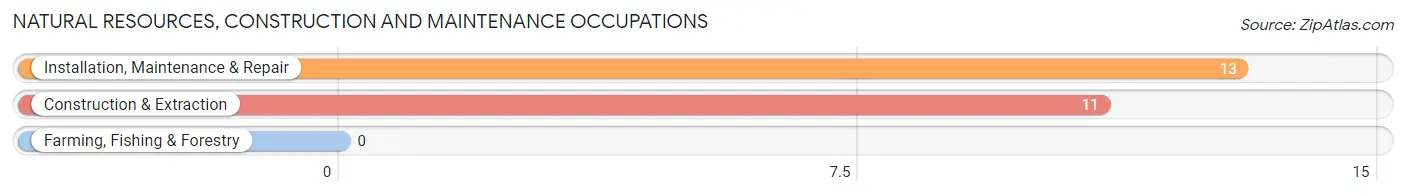
Natural Resources, Construction and Maintenance Occupations
The most common Natural Resources, Construction and Maintenance occupations in Townsend are Installation, Maintenance & Repair (13 | 7.4%), and Construction & Extraction (11 | 6.3%).
Natural Resources, Construction and Maintenance Occupations by Sex
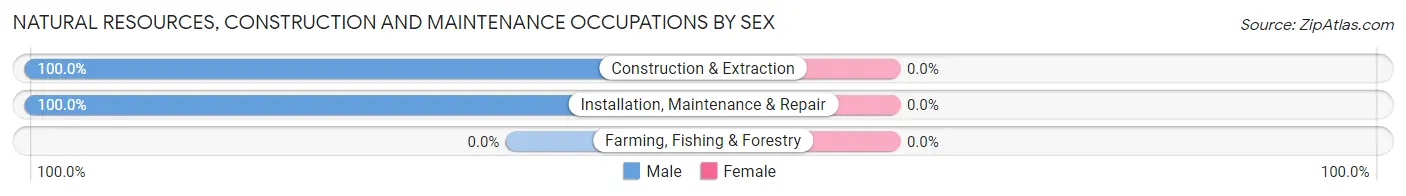
| Occupation | Male | Female |
| Farming, Fishing & Forestry | 0 (0.0%) | 0 (0.0%) |
| Construction & Extraction | 11 (100.0%) | 0 (0.0%) |
| Installation, Maintenance & Repair | 13 (100.0%) | 0 (0.0%) |
| Total (Category) | 24 (100.0%) | 0 (0.0%) |
| Total (Overall) | 110 (62.9%) | 65 (37.1%) |
Production, Transportation and Moving Occupations
The most common Production, Transportation and Moving occupations in Townsend are Transportation (8 | 4.6%), Production (3 | 1.7%), and Material Moving (3 | 1.7%).
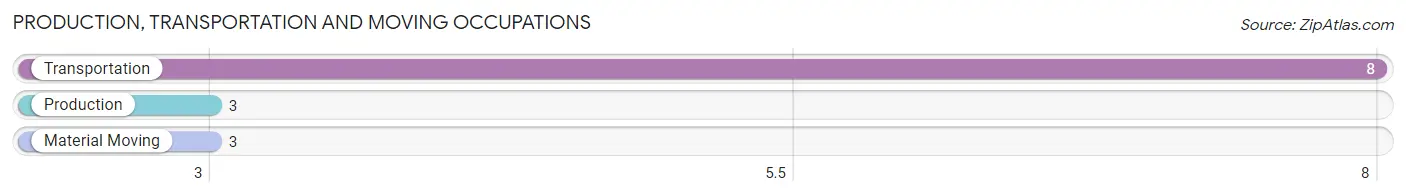
Production, Transportation and Moving Occupations by Sex
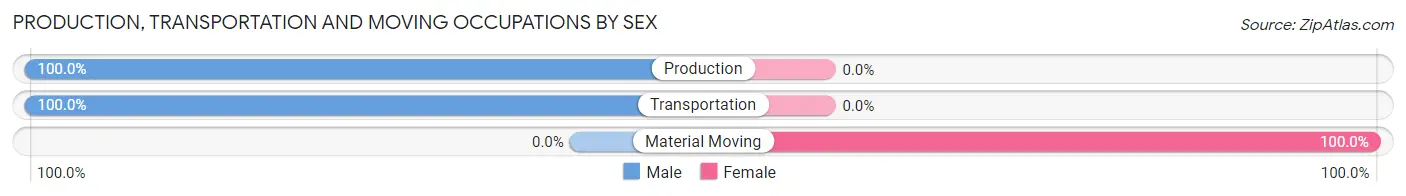
| Occupation | Male | Female |
| Production | 3 (100.0%) | 0 (0.0%) |
| Transportation | 8 (100.0%) | 0 (0.0%) |
| Material Moving | 0 (0.0%) | 3 (100.0%) |
| Total (Category) | 11 (78.6%) | 3 (21.4%) |
| Total (Overall) | 110 (62.9%) | 65 (37.1%) |
Employment Industries by Sex in Townsend
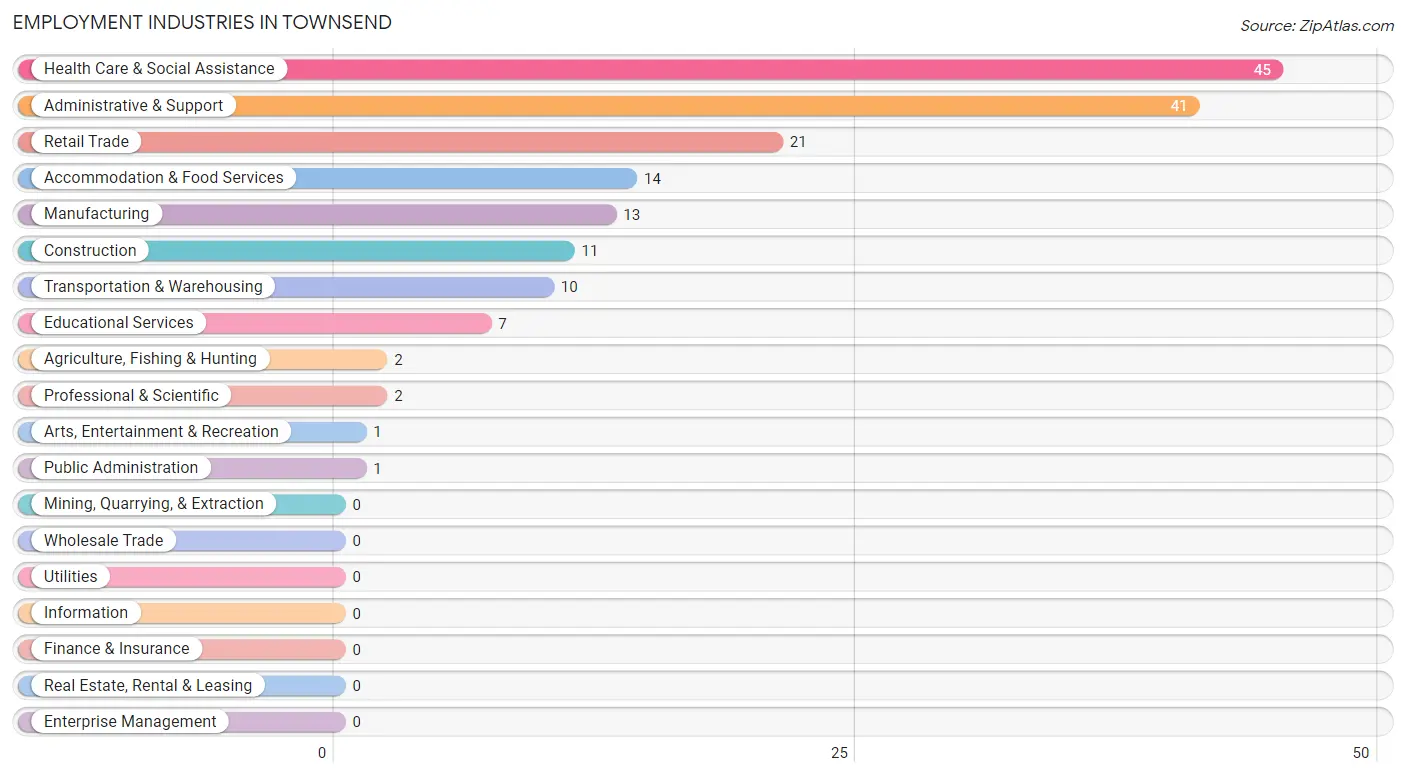
Employment Industries in Townsend
The major employment industries in Townsend include Health Care & Social Assistance (45 | 25.7%), Administrative & Support (41 | 23.4%), Retail Trade (21 | 12.0%), Accommodation & Food Services (14 | 8.0%), and Manufacturing (13 | 7.4%).
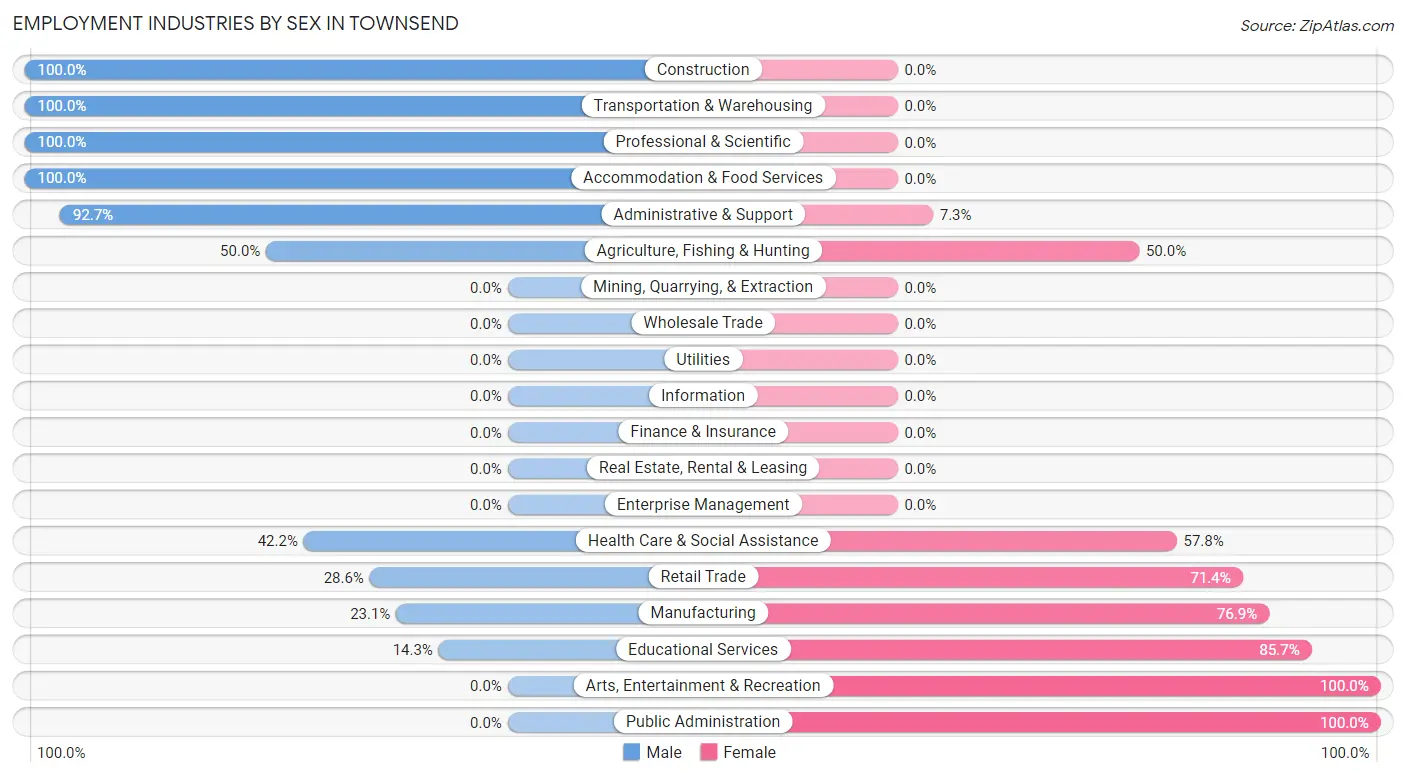
Employment Industries by Sex in Townsend
The Townsend industries that see more men than women are Construction (100.0%), Transportation & Warehousing (100.0%), and Professional & Scientific (100.0%), whereas the industries that tend to have a higher number of women are Arts, Entertainment & Recreation (100.0%), Public Administration (100.0%), and Educational Services (85.7%).
| Industry | Male | Female |
| Agriculture, Fishing & Hunting | 1 (50.0%) | 1 (50.0%) |
| Mining, Quarrying, & Extraction | 0 (0.0%) | 0 (0.0%) |
| Construction | 11 (100.0%) | 0 (0.0%) |
| Manufacturing | 3 (23.1%) | 10 (76.9%) |
| Wholesale Trade | 0 (0.0%) | 0 (0.0%) |
| Retail Trade | 6 (28.6%) | 15 (71.4%) |
| Transportation & Warehousing | 10 (100.0%) | 0 (0.0%) |
| Utilities | 0 (0.0%) | 0 (0.0%) |
| Information | 0 (0.0%) | 0 (0.0%) |
| Finance & Insurance | 0 (0.0%) | 0 (0.0%) |
| Real Estate, Rental & Leasing | 0 (0.0%) | 0 (0.0%) |
| Professional & Scientific | 2 (100.0%) | 0 (0.0%) |
| Enterprise Management | 0 (0.0%) | 0 (0.0%) |
| Administrative & Support | 38 (92.7%) | 3 (7.3%) |
| Educational Services | 1 (14.3%) | 6 (85.7%) |
| Health Care & Social Assistance | 19 (42.2%) | 26 (57.8%) |
| Arts, Entertainment & Recreation | 0 (0.0%) | 1 (100.0%) |
| Accommodation & Food Services | 14 (100.0%) | 0 (0.0%) |
| Public Administration | 0 (0.0%) | 1 (100.0%) |
| Total | 110 (62.9%) | 65 (37.1%) |
Education in Townsend
School Enrollment in Townsend
The most common levels of schooling among the 87 students in Townsend are elementary school (42 | 48.3%), high school (32 | 36.8%), and college / undergraduate (10 | 11.5%).
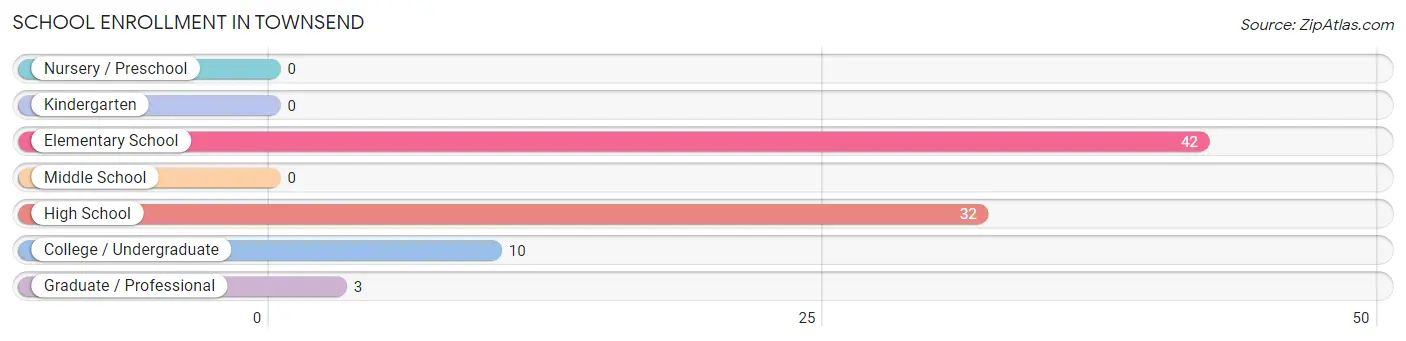
| School Level | # Students | % Students |
| Nursery / Preschool | 0 | 0.0% |
| Kindergarten | 0 | 0.0% |
| Elementary School | 42 | 48.3% |
| Middle School | 0 | 0.0% |
| High School | 32 | 36.8% |
| College / Undergraduate | 10 | 11.5% |
| Graduate / Professional | 3 | 3.5% |
| Total | 87 | 100.0% |
School Enrollment by Age by Funding Source in Townsend
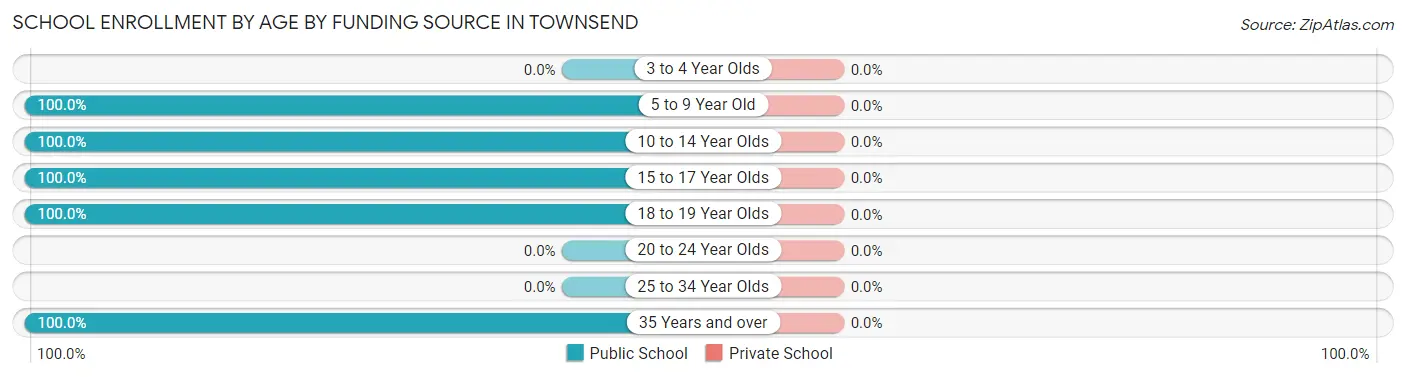
| Age Bracket | Public School | Private School |
| 3 to 4 Year Olds | 0 (0.0%) | 0 (0.0%) |
| 5 to 9 Year Old | 17 (100.0%) | 0 (0.0%) |
| 10 to 14 Year Olds | 35 (100.0%) | 0 (0.0%) |
| 15 to 17 Year Olds | 10 (100.0%) | 0 (0.0%) |
| 18 to 19 Year Olds | 20 (100.0%) | 0 (0.0%) |
| 20 to 24 Year Olds | 0 (0.0%) | 0 (0.0%) |
| 25 to 34 Year Olds | 0 (0.0%) | 0 (0.0%) |
| 35 Years and over | 5 (100.0%) | 0 (0.0%) |
| Total | 87 (100.0%) | 0 (0.0%) |
Educational Attainment by Field of Study in Townsend
Business (44 | 31.2%), education (34 | 24.1%), science & technology (17 | 12.1%), psychology (12 | 8.5%), and physical & health sciences (7 | 5.0%) are the most common fields of study among 141 individuals in Townsend who have obtained a bachelor's degree or higher.
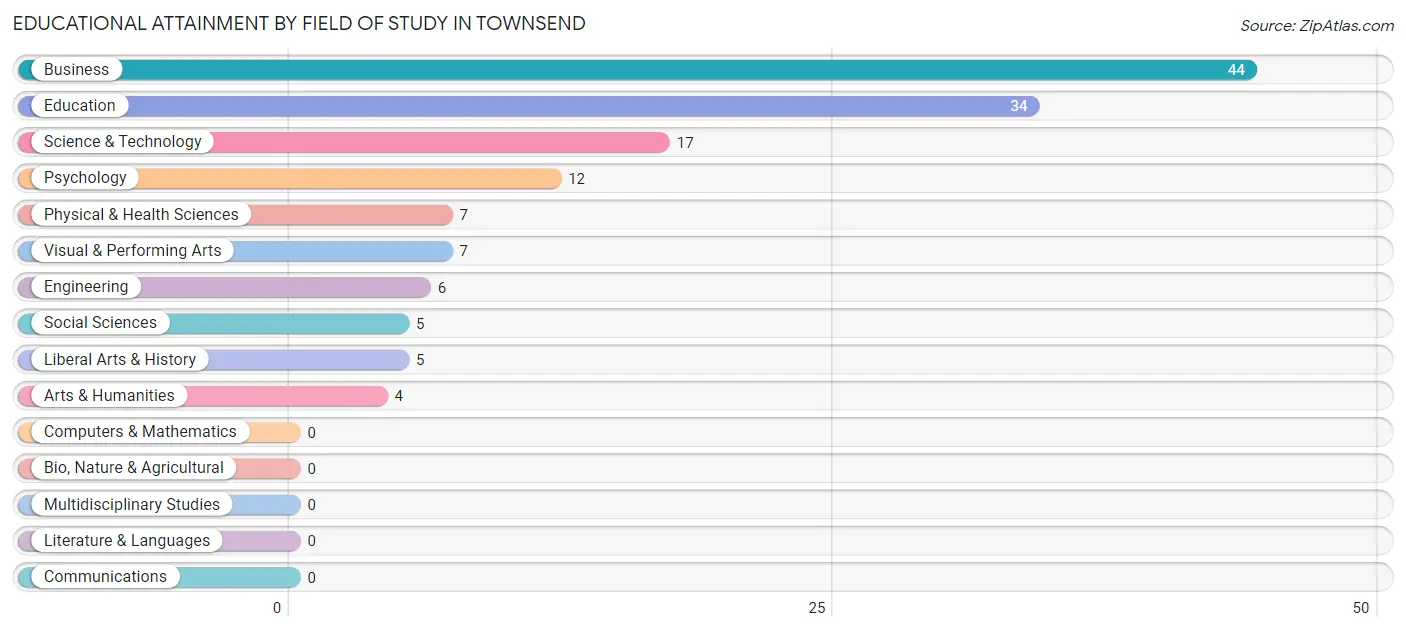
| Field of Study | # Graduates | % Graduates |
| Computers & Mathematics | 0 | 0.0% |
| Bio, Nature & Agricultural | 0 | 0.0% |
| Physical & Health Sciences | 7 | 5.0% |
| Psychology | 12 | 8.5% |
| Social Sciences | 5 | 3.5% |
| Engineering | 6 | 4.3% |
| Multidisciplinary Studies | 0 | 0.0% |
| Science & Technology | 17 | 12.1% |
| Business | 44 | 31.2% |
| Education | 34 | 24.1% |
| Literature & Languages | 0 | 0.0% |
| Liberal Arts & History | 5 | 3.5% |
| Visual & Performing Arts | 7 | 5.0% |
| Communications | 0 | 0.0% |
| Arts & Humanities | 4 | 2.8% |
| Total | 141 | 100.0% |
Transportation & Commute in Townsend
Vehicle Availability by Sex in Townsend
The most prevalent vehicle ownership categories in Townsend are males with 2 vehicles (64, accounting for 58.2%) and females with 2 vehicles (17, making up 98.5%).
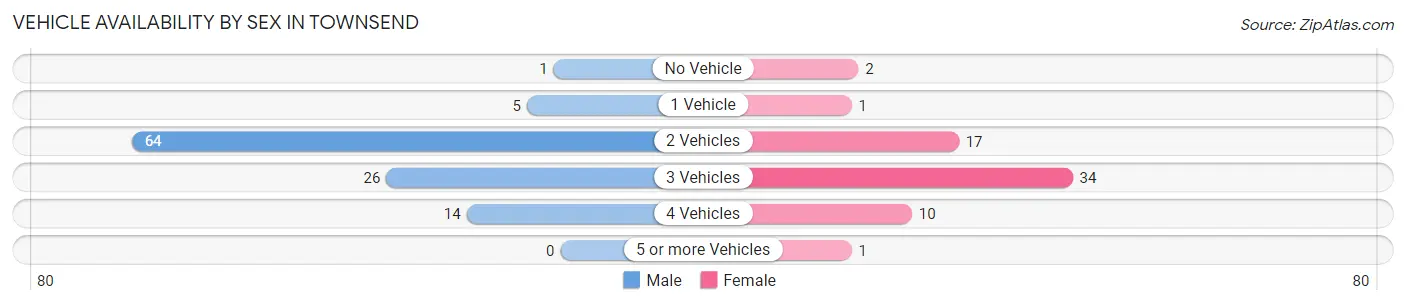
| Vehicles Available | Male | Female |
| No Vehicle | 1 (0.9%) | 2 (3.1%) |
| 1 Vehicle | 5 (4.5%) | 1 (1.5%) |
| 2 Vehicles | 64 (58.2%) | 17 (26.2%) |
| 3 Vehicles | 26 (23.6%) | 34 (52.3%) |
| 4 Vehicles | 14 (12.7%) | 10 (15.4%) |
| 5 or more Vehicles | 0 (0.0%) | 1 (1.5%) |
| Total | 110 (100.0%) | 65 (100.0%) |
Commute Time in Townsend
The most frequently occuring commute durations in Townsend are less than 5 minutes (44 commuters, 25.3%), 30 to 34 minutes (30 commuters, 17.2%), and 5 to 9 minutes (29 commuters, 16.7%).
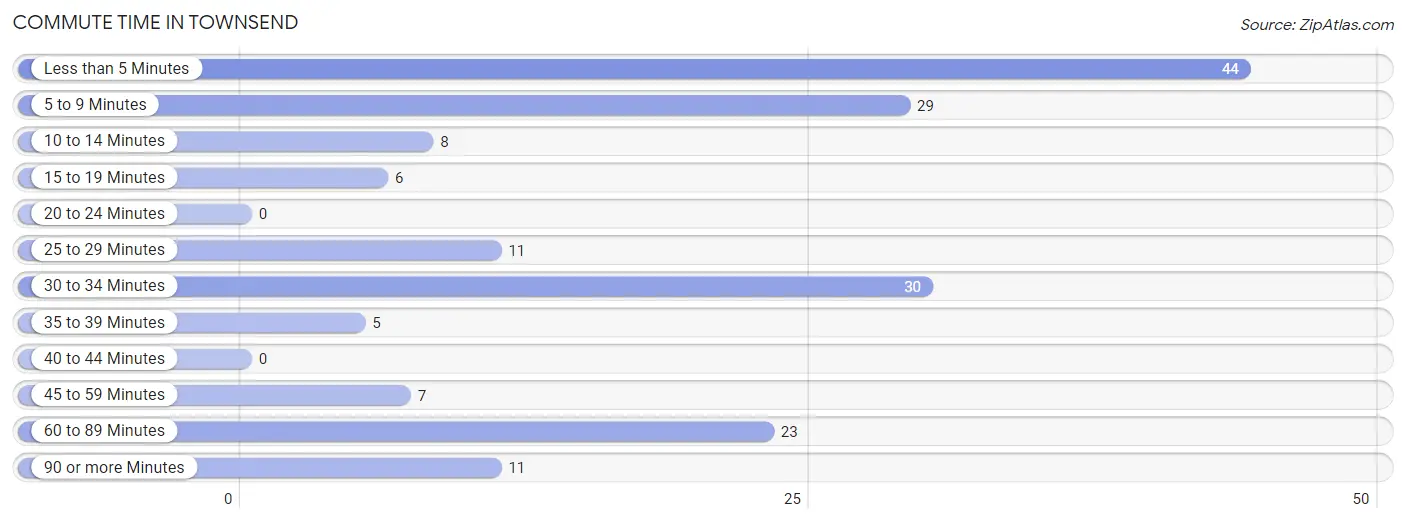
| Commute Time | # Commuters | % Commuters |
| Less than 5 Minutes | 44 | 25.3% |
| 5 to 9 Minutes | 29 | 16.7% |
| 10 to 14 Minutes | 8 | 4.6% |
| 15 to 19 Minutes | 6 | 3.5% |
| 20 to 24 Minutes | 0 | 0.0% |
| 25 to 29 Minutes | 11 | 6.3% |
| 30 to 34 Minutes | 30 | 17.2% |
| 35 to 39 Minutes | 5 | 2.9% |
| 40 to 44 Minutes | 0 | 0.0% |
| 45 to 59 Minutes | 7 | 4.0% |
| 60 to 89 Minutes | 23 | 13.2% |
| 90 or more Minutes | 11 | 6.3% |
Commute Time by Sex in Townsend
The most common commute times in Townsend are less than 5 minutes (42 commuters, 38.5%) for males and 60 to 89 minutes (23 commuters, 35.4%) for females.
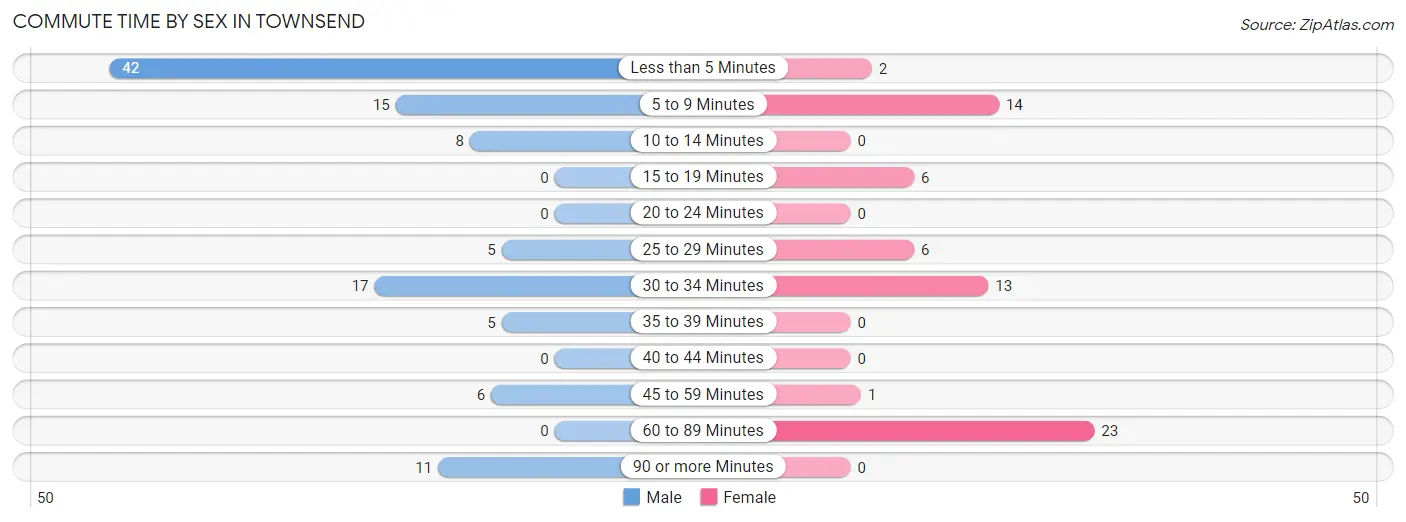
| Commute Time | Male | Female |
| Less than 5 Minutes | 42 (38.5%) | 2 (3.1%) |
| 5 to 9 Minutes | 15 (13.8%) | 14 (21.5%) |
| 10 to 14 Minutes | 8 (7.3%) | 0 (0.0%) |
| 15 to 19 Minutes | 0 (0.0%) | 6 (9.2%) |
| 20 to 24 Minutes | 0 (0.0%) | 0 (0.0%) |
| 25 to 29 Minutes | 5 (4.6%) | 6 (9.2%) |
| 30 to 34 Minutes | 17 (15.6%) | 13 (20.0%) |
| 35 to 39 Minutes | 5 (4.6%) | 0 (0.0%) |
| 40 to 44 Minutes | 0 (0.0%) | 0 (0.0%) |
| 45 to 59 Minutes | 6 (5.5%) | 1 (1.5%) |
| 60 to 89 Minutes | 0 (0.0%) | 23 (35.4%) |
| 90 or more Minutes | 11 (10.1%) | 0 (0.0%) |
Time of Departure to Work by Sex in Townsend
The most frequent times of departure to work in Townsend are 7:00 AM to 7:29 AM (45, 41.3%) for males and 4:00 PM to 11:59 PM (18, 27.7%) for females.
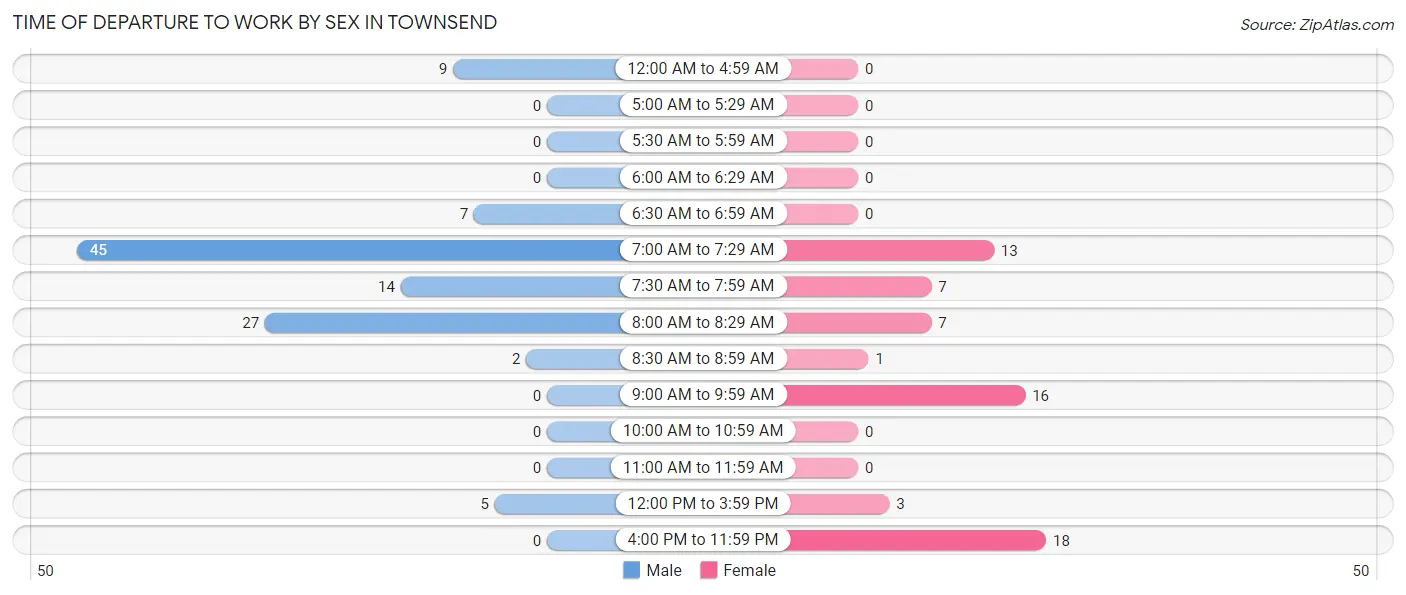
| Time of Departure | Male | Female |
| 12:00 AM to 4:59 AM | 9 (8.3%) | 0 (0.0%) |
| 5:00 AM to 5:29 AM | 0 (0.0%) | 0 (0.0%) |
| 5:30 AM to 5:59 AM | 0 (0.0%) | 0 (0.0%) |
| 6:00 AM to 6:29 AM | 0 (0.0%) | 0 (0.0%) |
| 6:30 AM to 6:59 AM | 7 (6.4%) | 0 (0.0%) |
| 7:00 AM to 7:29 AM | 45 (41.3%) | 13 (20.0%) |
| 7:30 AM to 7:59 AM | 14 (12.8%) | 7 (10.8%) |
| 8:00 AM to 8:29 AM | 27 (24.8%) | 7 (10.8%) |
| 8:30 AM to 8:59 AM | 2 (1.8%) | 1 (1.5%) |
| 9:00 AM to 9:59 AM | 0 (0.0%) | 16 (24.6%) |
| 10:00 AM to 10:59 AM | 0 (0.0%) | 0 (0.0%) |
| 11:00 AM to 11:59 AM | 0 (0.0%) | 0 (0.0%) |
| 12:00 PM to 3:59 PM | 5 (4.6%) | 3 (4.6%) |
| 4:00 PM to 11:59 PM | 0 (0.0%) | 18 (27.7%) |
| Total | 109 (100.0%) | 65 (100.0%) |
Housing Occupancy in Townsend
Occupancy by Ownership in Townsend
Of the total 250 dwellings in Townsend, owner-occupied units account for 231 (92.4%), while renter-occupied units make up 19 (7.6%).
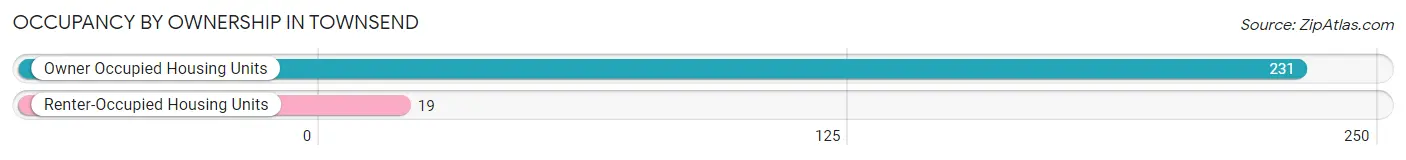
| Occupancy | # Housing Units | % Housing Units |
| Owner Occupied Housing Units | 231 | 92.4% |
| Renter-Occupied Housing Units | 19 | 7.6% |
| Total Occupied Housing Units | 250 | 100.0% |
Occupancy by Household Size in Townsend
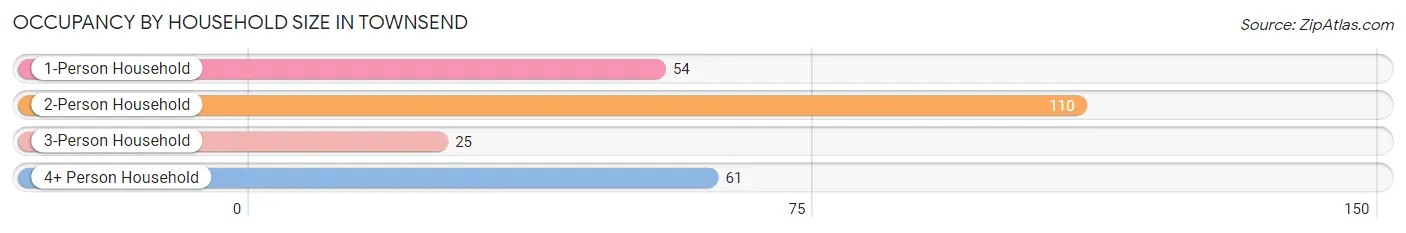
| Household Size | # Housing Units | % Housing Units |
| 1-Person Household | 54 | 21.6% |
| 2-Person Household | 110 | 44.0% |
| 3-Person Household | 25 | 10.0% |
| 4+ Person Household | 61 | 24.4% |
| Total Housing Units | 250 | 100.0% |
Occupancy by Ownership by Household Size in Townsend
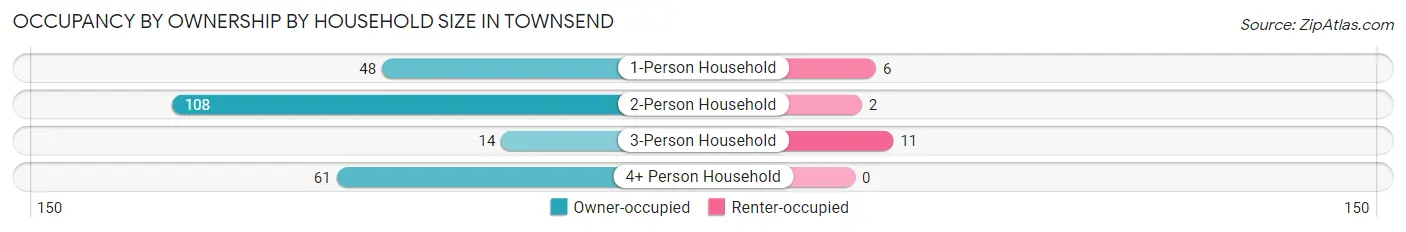
| Household Size | Owner-occupied | Renter-occupied |
| 1-Person Household | 48 (88.9%) | 6 (11.1%) |
| 2-Person Household | 108 (98.2%) | 2 (1.8%) |
| 3-Person Household | 14 (56.0%) | 11 (44.0%) |
| 4+ Person Household | 61 (100.0%) | 0 (0.0%) |
| Total Housing Units | 231 (92.4%) | 19 (7.6%) |
Occupancy by Educational Attainment in Townsend
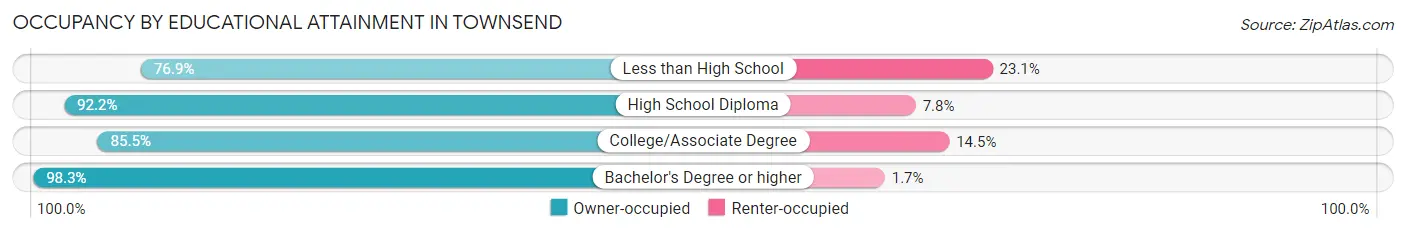
| Household Size | Owner-occupied | Renter-occupied |
| Less than High School | 10 (76.9%) | 3 (23.1%) |
| High School Diploma | 47 (92.2%) | 4 (7.8%) |
| College/Associate Degree | 59 (85.5%) | 10 (14.5%) |
| Bachelor's Degree or higher | 115 (98.3%) | 2 (1.7%) |
Occupancy by Age of Householder in Townsend
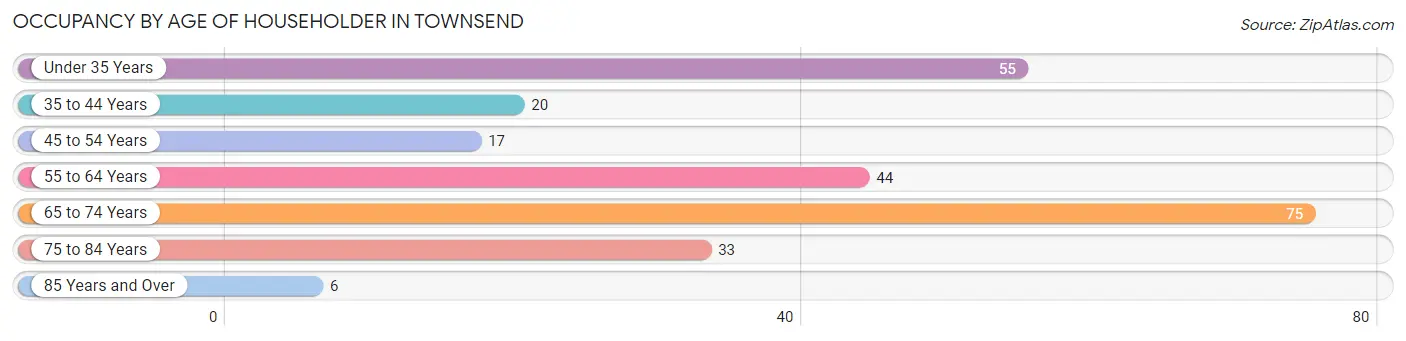
| Age Bracket | # Households | % Households |
| Under 35 Years | 55 | 22.0% |
| 35 to 44 Years | 20 | 8.0% |
| 45 to 54 Years | 17 | 6.8% |
| 55 to 64 Years | 44 | 17.6% |
| 65 to 74 Years | 75 | 30.0% |
| 75 to 84 Years | 33 | 13.2% |
| 85 Years and Over | 6 | 2.4% |
| Total | 250 | 100.0% |
Housing Finances in Townsend
Median Income by Occupancy in Townsend
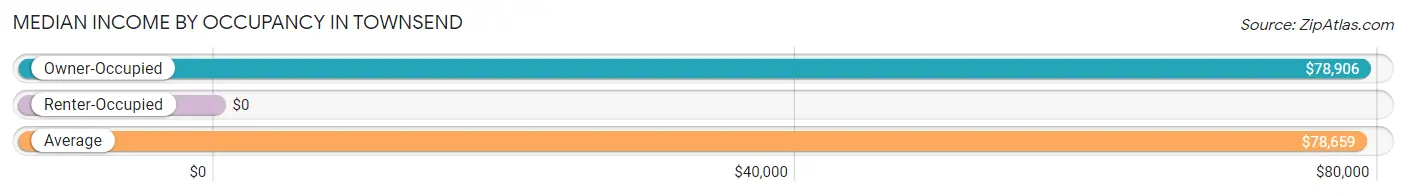
| Occupancy Type | # Households | Median Income |
| Owner-Occupied | 231 (92.4%) | $78,906 |
| Renter-Occupied | 19 (7.6%) | $0 |
| Average | 250 (100.0%) | $78,659 |
Occupancy by Householder Income Bracket in Townsend
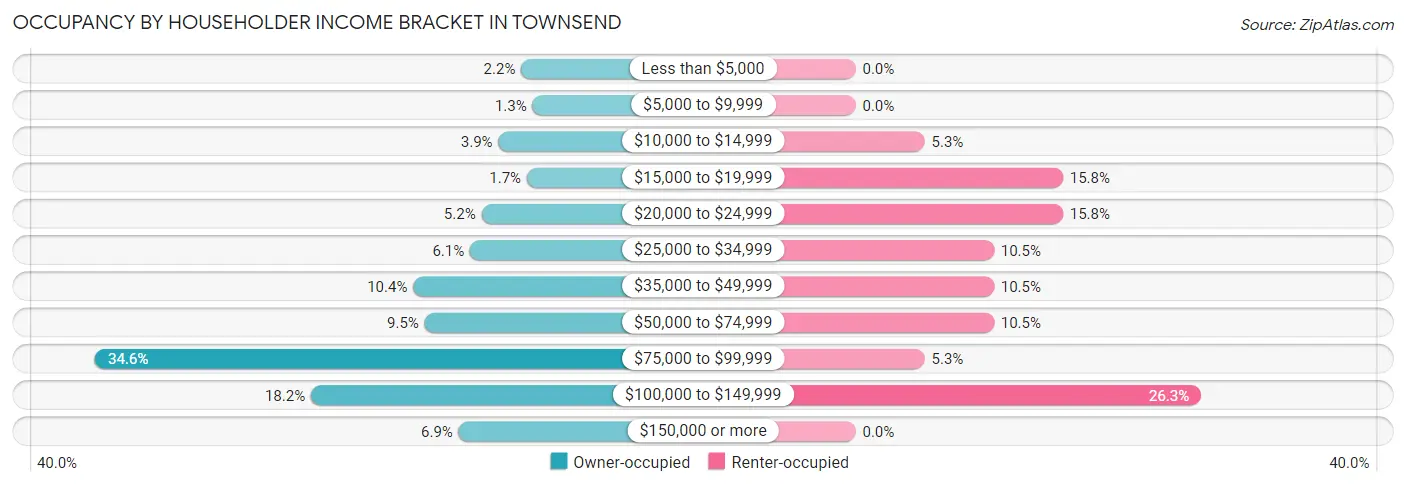
| Income Bracket | Owner-occupied | Renter-occupied |
| Less than $5,000 | 5 (2.2%) | 0 (0.0%) |
| $5,000 to $9,999 | 3 (1.3%) | 0 (0.0%) |
| $10,000 to $14,999 | 9 (3.9%) | 1 (5.3%) |
| $15,000 to $19,999 | 4 (1.7%) | 3 (15.8%) |
| $20,000 to $24,999 | 12 (5.2%) | 3 (15.8%) |
| $25,000 to $34,999 | 14 (6.1%) | 2 (10.5%) |
| $35,000 to $49,999 | 24 (10.4%) | 2 (10.5%) |
| $50,000 to $74,999 | 22 (9.5%) | 2 (10.5%) |
| $75,000 to $99,999 | 80 (34.6%) | 1 (5.3%) |
| $100,000 to $149,999 | 42 (18.2%) | 5 (26.3%) |
| $150,000 or more | 16 (6.9%) | 0 (0.0%) |
| Total | 231 (100.0%) | 19 (100.0%) |
Monthly Housing Cost Tiers in Townsend
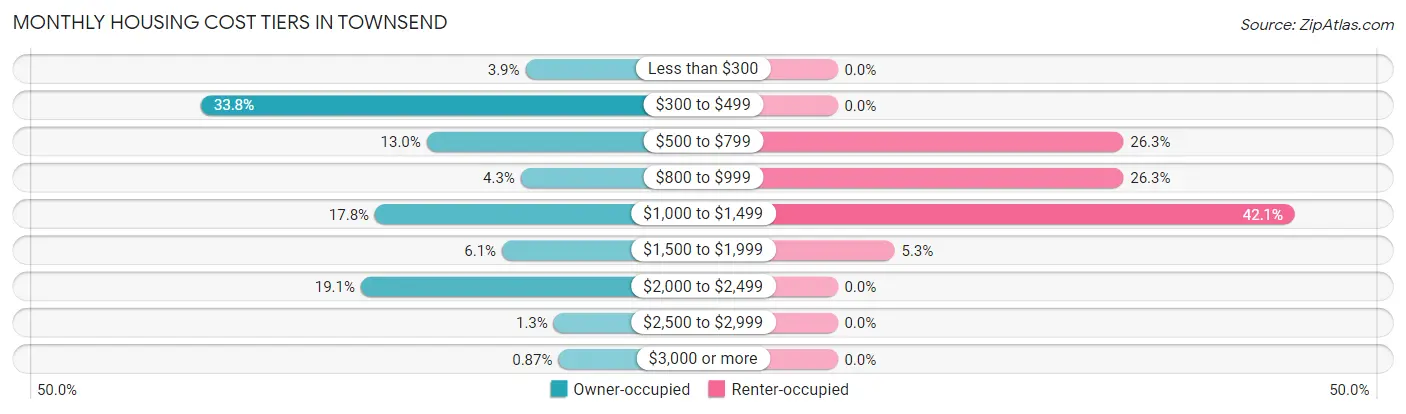
| Monthly Cost | Owner-occupied | Renter-occupied |
| Less than $300 | 9 (3.9%) | 0 (0.0%) |
| $300 to $499 | 78 (33.8%) | 0 (0.0%) |
| $500 to $799 | 30 (13.0%) | 5 (26.3%) |
| $800 to $999 | 10 (4.3%) | 5 (26.3%) |
| $1,000 to $1,499 | 41 (17.7%) | 8 (42.1%) |
| $1,500 to $1,999 | 14 (6.1%) | 1 (5.3%) |
| $2,000 to $2,499 | 44 (19.1%) | 0 (0.0%) |
| $2,500 to $2,999 | 3 (1.3%) | 0 (0.0%) |
| $3,000 or more | 2 (0.9%) | 0 (0.0%) |
| Total | 231 (100.0%) | 19 (100.0%) |
Physical Housing Characteristics in Townsend
Housing Structures in Townsend
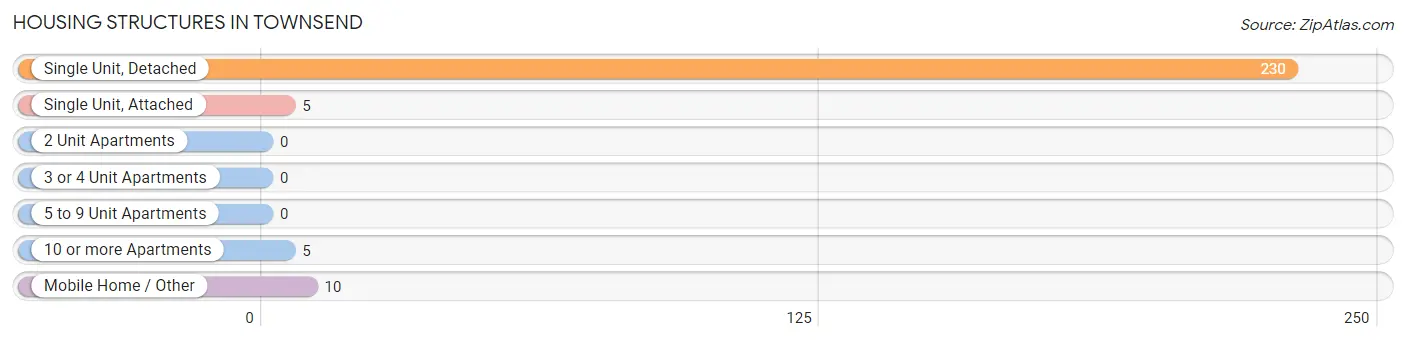
| Structure Type | # Housing Units | % Housing Units |
| Single Unit, Detached | 230 | 92.0% |
| Single Unit, Attached | 5 | 2.0% |
| 2 Unit Apartments | 0 | 0.0% |
| 3 or 4 Unit Apartments | 0 | 0.0% |
| 5 to 9 Unit Apartments | 0 | 0.0% |
| 10 or more Apartments | 5 | 2.0% |
| Mobile Home / Other | 10 | 4.0% |
| Total | 250 | 100.0% |
Housing Structures by Occupancy in Townsend
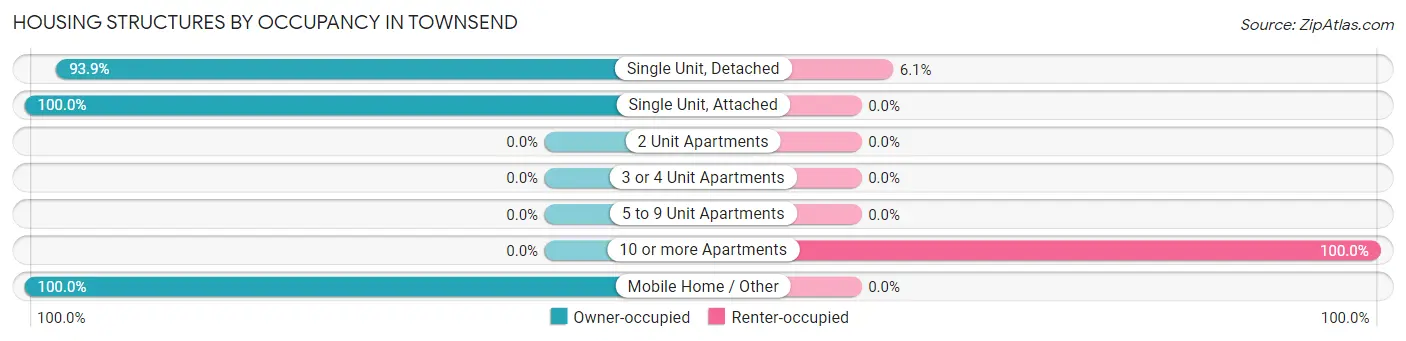
| Structure Type | Owner-occupied | Renter-occupied |
| Single Unit, Detached | 216 (93.9%) | 14 (6.1%) |
| Single Unit, Attached | 5 (100.0%) | 0 (0.0%) |
| 2 Unit Apartments | 0 (0.0%) | 0 (0.0%) |
| 3 or 4 Unit Apartments | 0 (0.0%) | 0 (0.0%) |
| 5 to 9 Unit Apartments | 0 (0.0%) | 0 (0.0%) |
| 10 or more Apartments | 0 (0.0%) | 5 (100.0%) |
| Mobile Home / Other | 10 (100.0%) | 0 (0.0%) |
| Total | 231 (92.4%) | 19 (7.6%) |
Housing Structures by Number of Rooms in Townsend
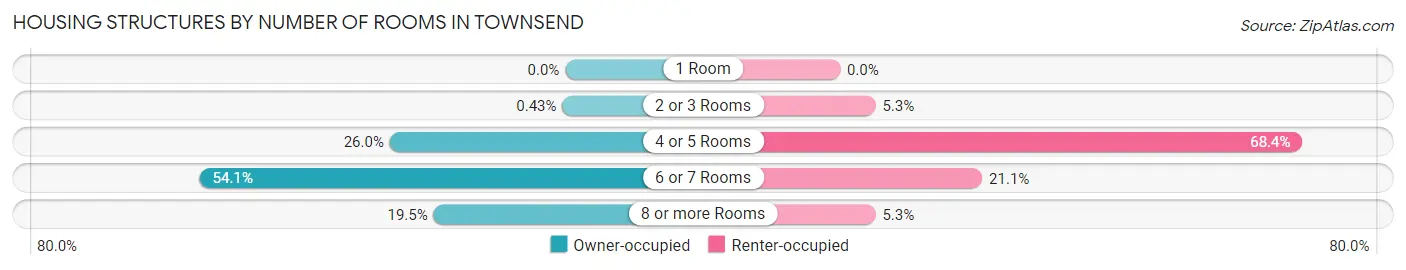
| Number of Rooms | Owner-occupied | Renter-occupied |
| 1 Room | 0 (0.0%) | 0 (0.0%) |
| 2 or 3 Rooms | 1 (0.4%) | 1 (5.3%) |
| 4 or 5 Rooms | 60 (26.0%) | 13 (68.4%) |
| 6 or 7 Rooms | 125 (54.1%) | 4 (21.0%) |
| 8 or more Rooms | 45 (19.5%) | 1 (5.3%) |
| Total | 231 (100.0%) | 19 (100.0%) |
Housing Structure by Heating Type in Townsend
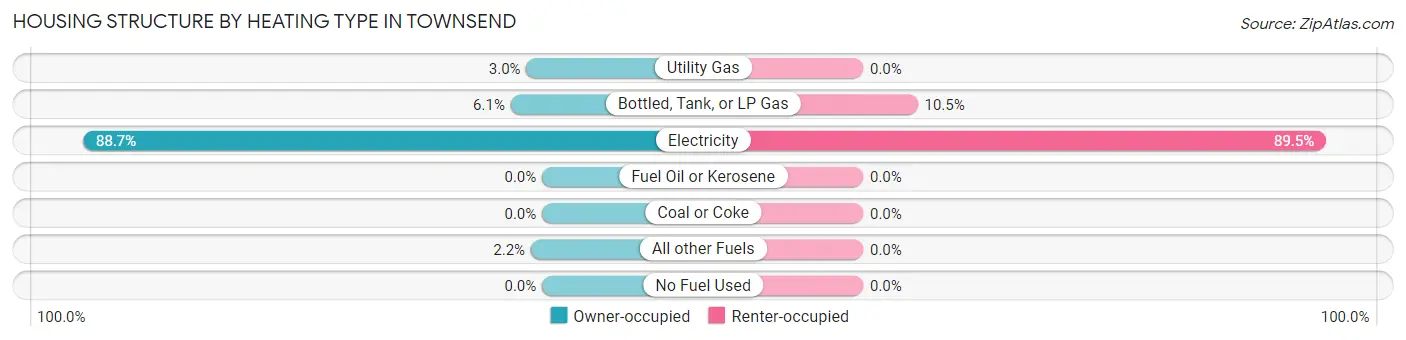
| Heating Type | Owner-occupied | Renter-occupied |
| Utility Gas | 7 (3.0%) | 0 (0.0%) |
| Bottled, Tank, or LP Gas | 14 (6.1%) | 2 (10.5%) |
| Electricity | 205 (88.7%) | 17 (89.5%) |
| Fuel Oil or Kerosene | 0 (0.0%) | 0 (0.0%) |
| Coal or Coke | 0 (0.0%) | 0 (0.0%) |
| All other Fuels | 5 (2.2%) | 0 (0.0%) |
| No Fuel Used | 0 (0.0%) | 0 (0.0%) |
| Total | 231 (100.0%) | 19 (100.0%) |
Household Vehicle Usage in Townsend
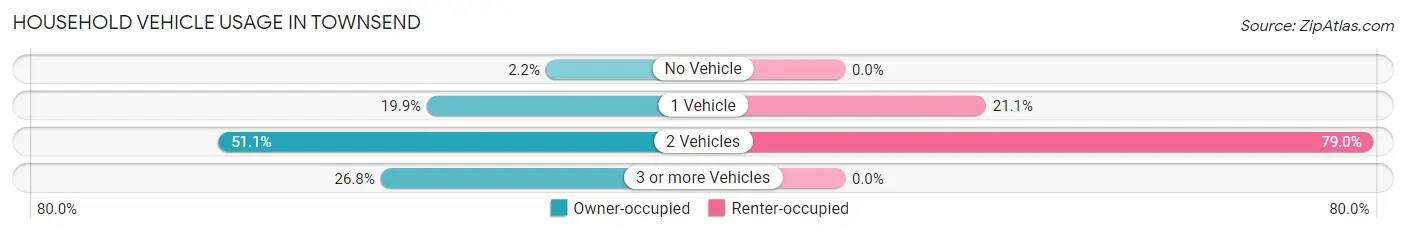
| Vehicles per Household | Owner-occupied | Renter-occupied |
| No Vehicle | 5 (2.2%) | 0 (0.0%) |
| 1 Vehicle | 46 (19.9%) | 4 (21.0%) |
| 2 Vehicles | 118 (51.1%) | 15 (78.9%) |
| 3 or more Vehicles | 62 (26.8%) | 0 (0.0%) |
| Total | 231 (100.0%) | 19 (100.0%) |
Real Estate & Mortgages in Townsend
Real Estate and Mortgage Overview in Townsend
| Characteristic | Without Mortgage | With Mortgage |
| Housing Units | 117 | 114 |
| Median Property Value | $281,000 | $315,300 |
| Median Household Income | - | - |
| Monthly Housing Costs | $434 | $2 |
| Real Estate Taxes | $1,342 | $0 |
Property Value by Mortgage Status in Townsend
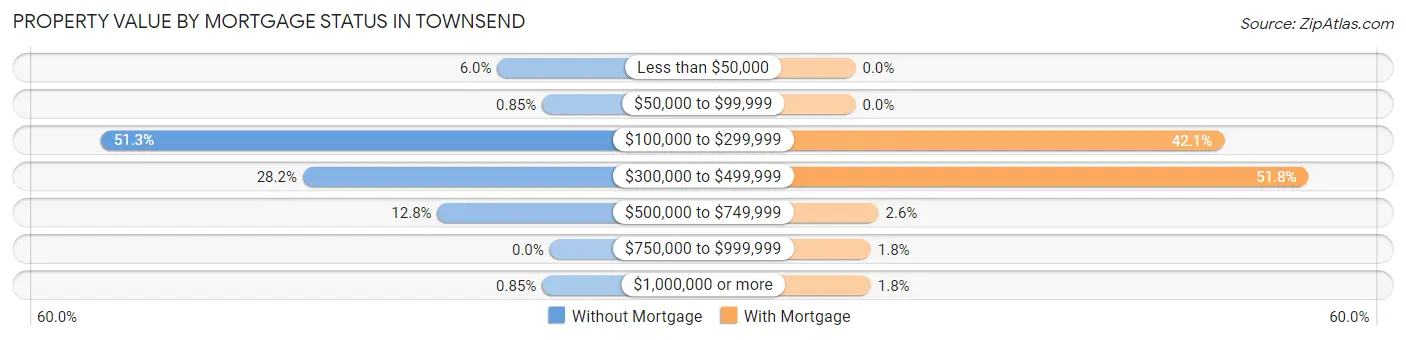
| Property Value | Without Mortgage | With Mortgage |
| Less than $50,000 | 7 (6.0%) | 0 (0.0%) |
| $50,000 to $99,999 | 1 (0.9%) | 0 (0.0%) |
| $100,000 to $299,999 | 60 (51.3%) | 48 (42.1%) |
| $300,000 to $499,999 | 33 (28.2%) | 59 (51.7%) |
| $500,000 to $749,999 | 15 (12.8%) | 3 (2.6%) |
| $750,000 to $999,999 | 0 (0.0%) | 2 (1.8%) |
| $1,000,000 or more | 1 (0.9%) | 2 (1.8%) |
| Total | 117 (100.0%) | 114 (100.0%) |
Household Income by Mortgage Status in Townsend
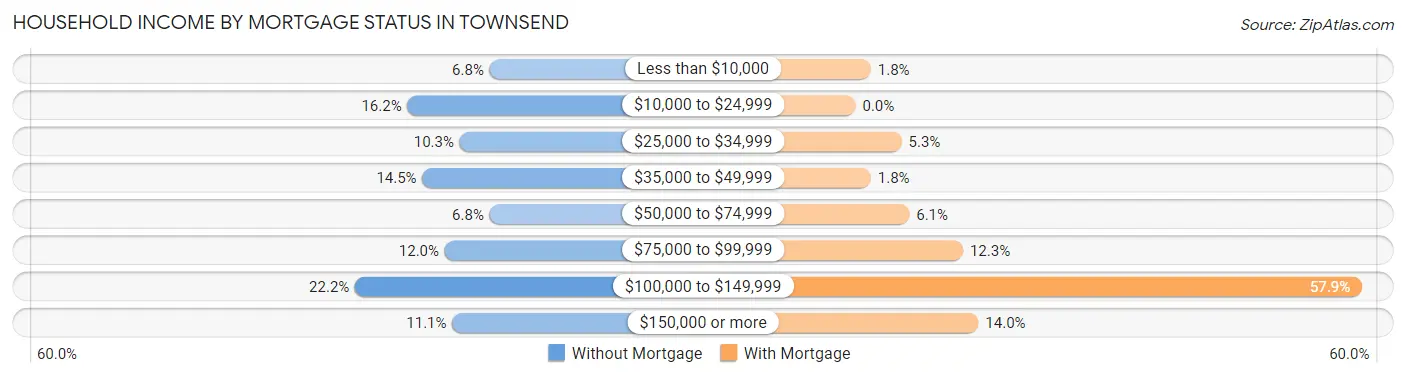
| Household Income | Without Mortgage | With Mortgage |
| Less than $10,000 | 8 (6.8%) | 2 (1.8%) |
| $10,000 to $24,999 | 19 (16.2%) | 0 (0.0%) |
| $25,000 to $34,999 | 12 (10.3%) | 6 (5.3%) |
| $35,000 to $49,999 | 17 (14.5%) | 2 (1.8%) |
| $50,000 to $74,999 | 8 (6.8%) | 7 (6.1%) |
| $75,000 to $99,999 | 14 (12.0%) | 14 (12.3%) |
| $100,000 to $149,999 | 26 (22.2%) | 66 (57.9%) |
| $150,000 or more | 13 (11.1%) | 16 (14.0%) |
| Total | 117 (100.0%) | 114 (100.0%) |
Property Value to Household Income Ratio in Townsend
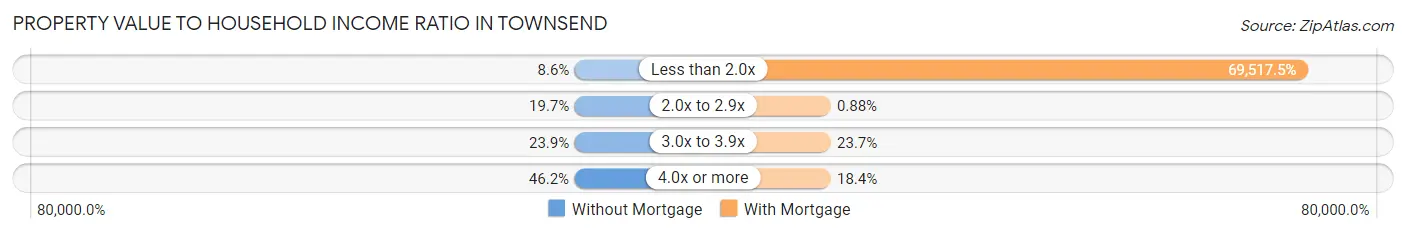
| Value-to-Income Ratio | Without Mortgage | With Mortgage |
| Less than 2.0x | 10 (8.6%) | 79,250 (69,517.5%) |
| 2.0x to 2.9x | 23 (19.7%) | 1 (0.9%) |
| 3.0x to 3.9x | 28 (23.9%) | 27 (23.7%) |
| 4.0x or more | 54 (46.2%) | 21 (18.4%) |
| Total | 117 (100.0%) | 114 (100.0%) |
Real Estate Taxes by Mortgage Status in Townsend
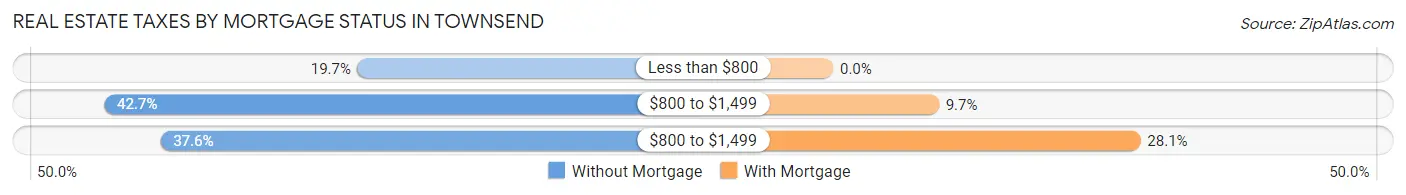
| Property Taxes | Without Mortgage | With Mortgage |
| Less than $800 | 23 (19.7%) | 0 (0.0%) |
| $800 to $1,499 | 50 (42.7%) | 11 (9.7%) |
| $800 to $1,499 | 44 (37.6%) | 32 (28.1%) |
| Total | 117 (100.0%) | 114 (100.0%) |
Health & Disability in Townsend
Health Insurance Coverage by Age in Townsend
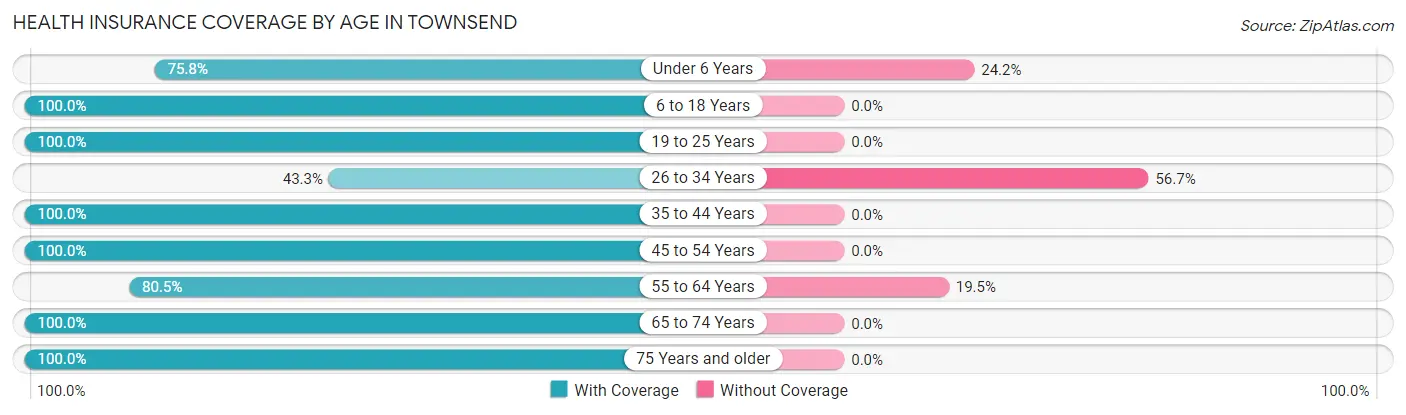
| Age Bracket | With Coverage | Without Coverage |
| Under 6 Years | 25 (75.8%) | 8 (24.2%) |
| 6 to 18 Years | 77 (100.0%) | 0 (0.0%) |
| 19 to 25 Years | 41 (100.0%) | 0 (0.0%) |
| 26 to 34 Years | 29 (43.3%) | 38 (56.7%) |
| 35 to 44 Years | 53 (100.0%) | 0 (0.0%) |
| 45 to 54 Years | 30 (100.0%) | 0 (0.0%) |
| 55 to 64 Years | 62 (80.5%) | 15 (19.5%) |
| 65 to 74 Years | 154 (100.0%) | 0 (0.0%) |
| 75 Years and older | 51 (100.0%) | 0 (0.0%) |
| Total | 522 (89.5%) | 61 (10.5%) |
Health Insurance Coverage by Citizenship Status in Townsend
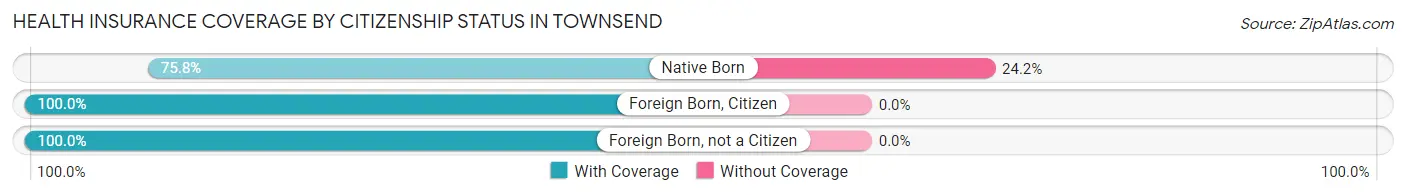
| Citizenship Status | With Coverage | Without Coverage |
| Native Born | 25 (75.8%) | 8 (24.2%) |
| Foreign Born, Citizen | 77 (100.0%) | 0 (0.0%) |
| Foreign Born, not a Citizen | 41 (100.0%) | 0 (0.0%) |
Health Insurance Coverage by Household Income in Townsend
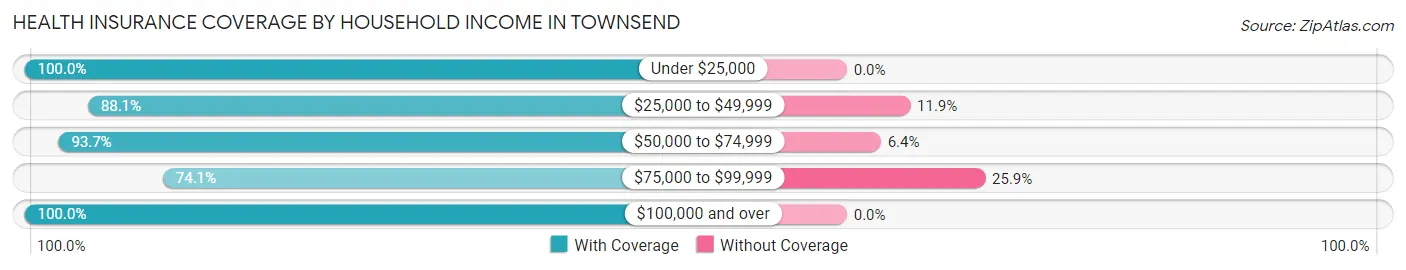
| Household Income | With Coverage | Without Coverage |
| Under $25,000 | 63 (100.0%) | 0 (0.0%) |
| $25,000 to $49,999 | 52 (88.1%) | 7 (11.9%) |
| $50,000 to $74,999 | 59 (93.6%) | 4 (6.4%) |
| $75,000 to $99,999 | 143 (74.1%) | 50 (25.9%) |
| $100,000 and over | 205 (100.0%) | 0 (0.0%) |
Public vs Private Health Insurance Coverage by Age in Townsend
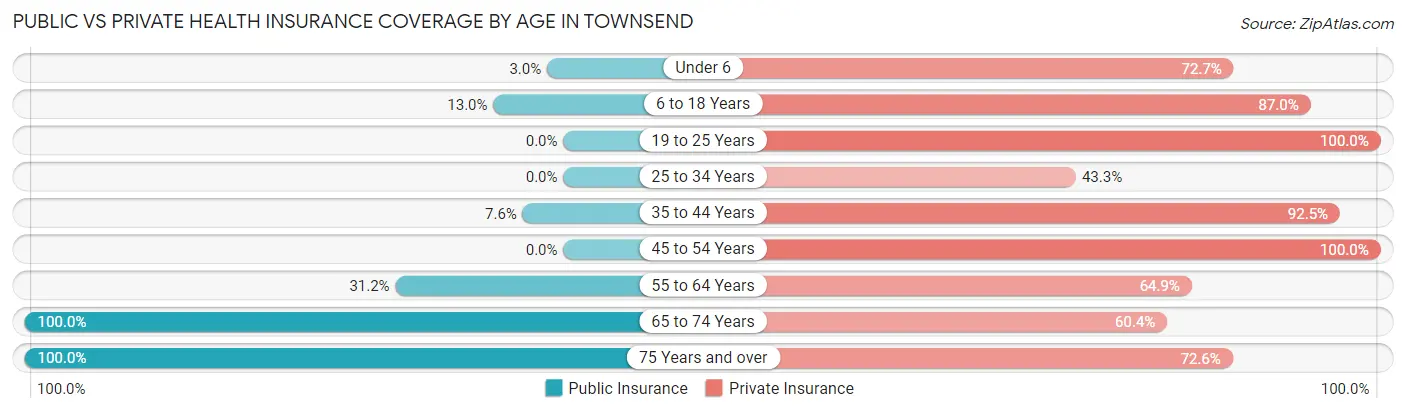
| Age Bracket | Public Insurance | Private Insurance |
| Under 6 | 1 (3.0%) | 24 (72.7%) |
| 6 to 18 Years | 10 (13.0%) | 67 (87.0%) |
| 19 to 25 Years | 0 (0.0%) | 41 (100.0%) |
| 25 to 34 Years | 0 (0.0%) | 29 (43.3%) |
| 35 to 44 Years | 4 (7.5%) | 49 (92.4%) |
| 45 to 54 Years | 0 (0.0%) | 30 (100.0%) |
| 55 to 64 Years | 24 (31.2%) | 50 (64.9%) |
| 65 to 74 Years | 154 (100.0%) | 93 (60.4%) |
| 75 Years and over | 51 (100.0%) | 37 (72.6%) |
| Total | 244 (41.8%) | 420 (72.0%) |
Disability Status by Sex by Age in Townsend
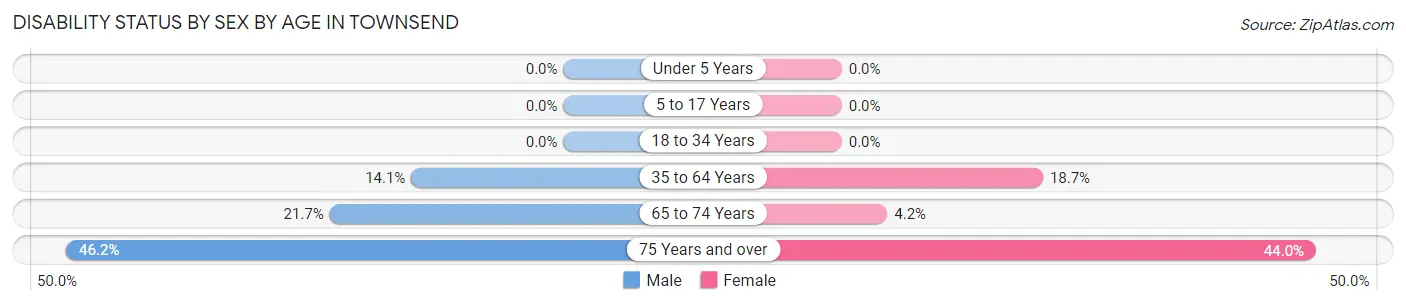
| Age Bracket | Male | Female |
| Under 5 Years | 0 (0.0%) | 0 (0.0%) |
| 5 to 17 Years | 0 (0.0%) | 0 (0.0%) |
| 18 to 34 Years | 0 (0.0%) | 0 (0.0%) |
| 35 to 64 Years | 12 (14.1%) | 14 (18.7%) |
| 65 to 74 Years | 18 (21.7%) | 3 (4.2%) |
| 75 Years and over | 12 (46.2%) | 11 (44.0%) |
Disability Class by Sex by Age in Townsend
Disability Class: Hearing Difficulty
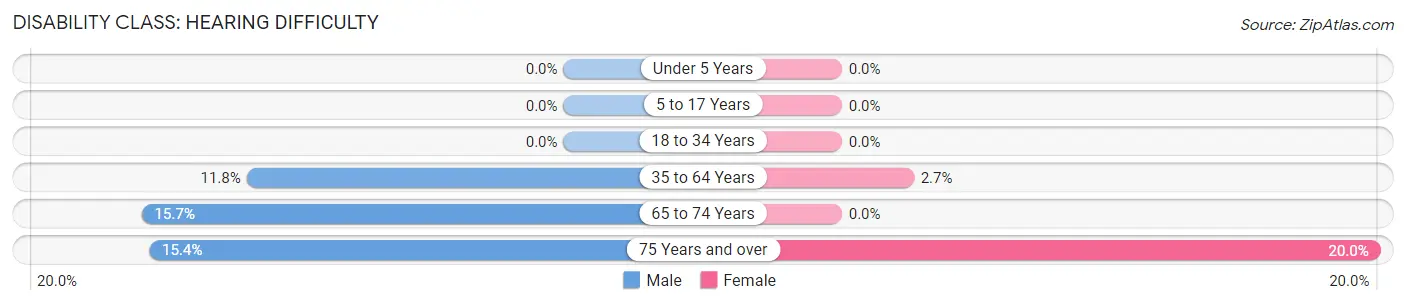
| Age Bracket | Male | Female |
| Under 5 Years | 0 (0.0%) | 0 (0.0%) |
| 5 to 17 Years | 0 (0.0%) | 0 (0.0%) |
| 18 to 34 Years | 0 (0.0%) | 0 (0.0%) |
| 35 to 64 Years | 10 (11.8%) | 2 (2.7%) |
| 65 to 74 Years | 13 (15.7%) | 0 (0.0%) |
| 75 Years and over | 4 (15.4%) | 5 (20.0%) |
Disability Class: Vision Difficulty
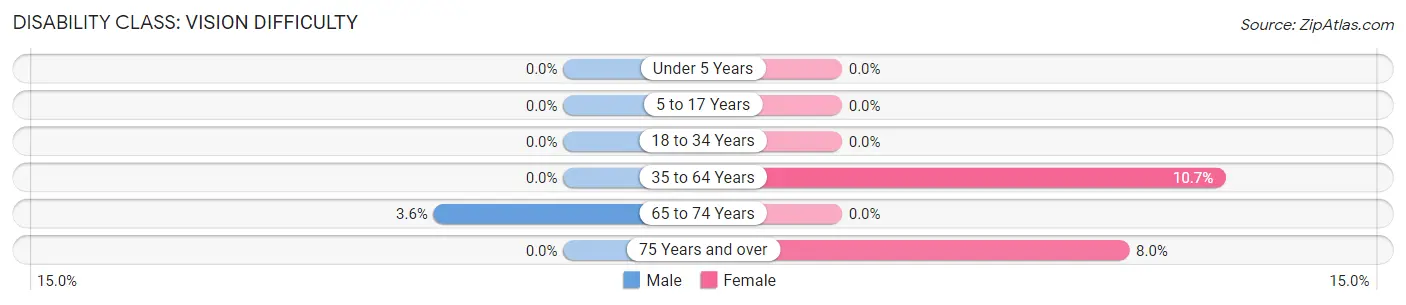
| Age Bracket | Male | Female |
| Under 5 Years | 0 (0.0%) | 0 (0.0%) |
| 5 to 17 Years | 0 (0.0%) | 0 (0.0%) |
| 18 to 34 Years | 0 (0.0%) | 0 (0.0%) |
| 35 to 64 Years | 0 (0.0%) | 8 (10.7%) |
| 65 to 74 Years | 3 (3.6%) | 0 (0.0%) |
| 75 Years and over | 0 (0.0%) | 2 (8.0%) |
Disability Class: Cognitive Difficulty
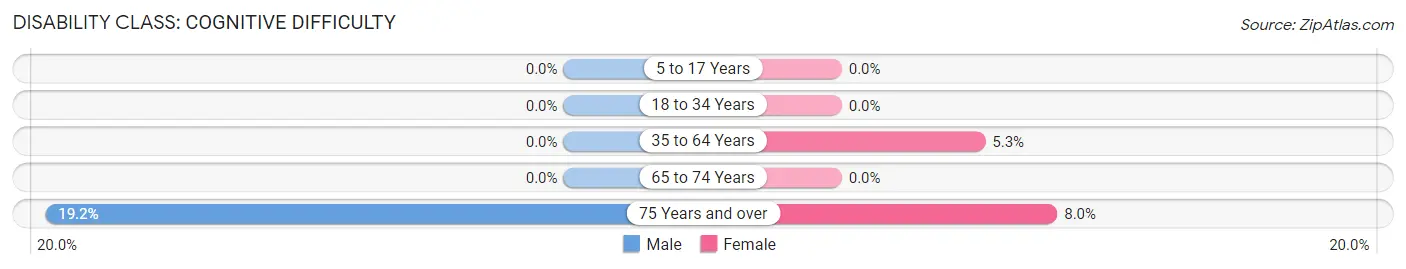
| Age Bracket | Male | Female |
| 5 to 17 Years | 0 (0.0%) | 0 (0.0%) |
| 18 to 34 Years | 0 (0.0%) | 0 (0.0%) |
| 35 to 64 Years | 0 (0.0%) | 4 (5.3%) |
| 65 to 74 Years | 0 (0.0%) | 0 (0.0%) |
| 75 Years and over | 5 (19.2%) | 2 (8.0%) |
Disability Class: Ambulatory Difficulty
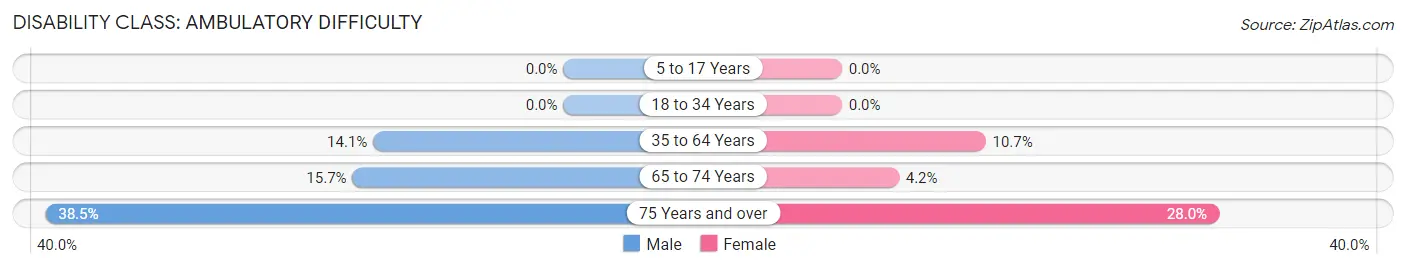
| Age Bracket | Male | Female |
| 5 to 17 Years | 0 (0.0%) | 0 (0.0%) |
| 18 to 34 Years | 0 (0.0%) | 0 (0.0%) |
| 35 to 64 Years | 12 (14.1%) | 8 (10.7%) |
| 65 to 74 Years | 13 (15.7%) | 3 (4.2%) |
| 75 Years and over | 10 (38.5%) | 7 (28.0%) |
Disability Class: Self-Care Difficulty
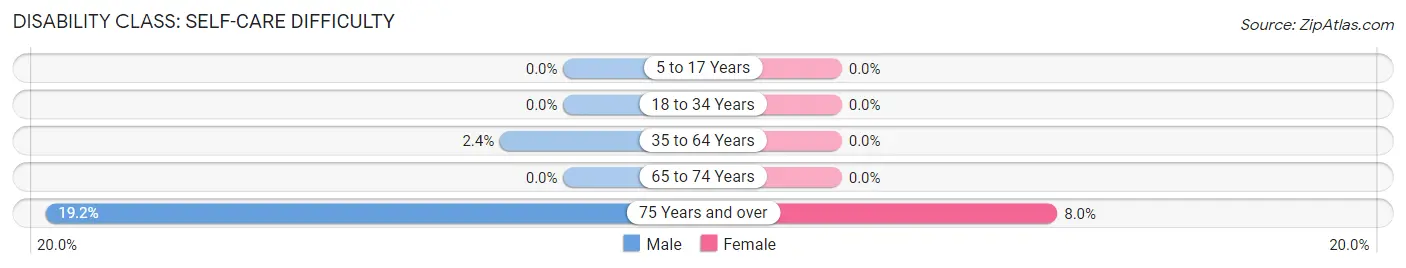
| Age Bracket | Male | Female |
| 5 to 17 Years | 0 (0.0%) | 0 (0.0%) |
| 18 to 34 Years | 0 (0.0%) | 0 (0.0%) |
| 35 to 64 Years | 2 (2.4%) | 0 (0.0%) |
| 65 to 74 Years | 0 (0.0%) | 0 (0.0%) |
| 75 Years and over | 5 (19.2%) | 2 (8.0%) |
Technology Access in Townsend
Computing Device Access in Townsend
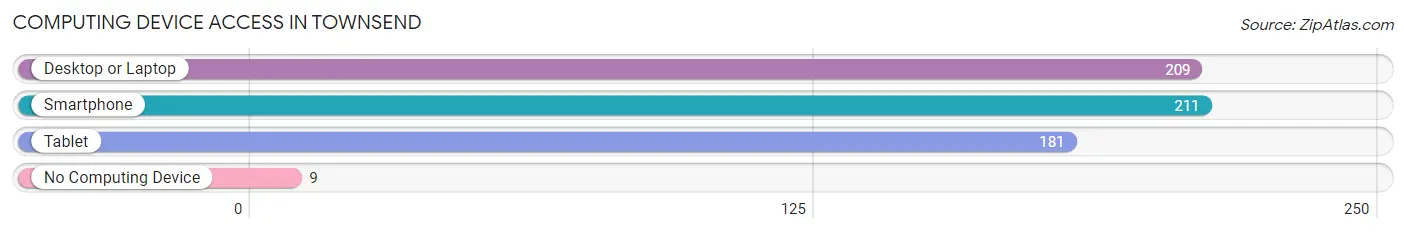
| Device Type | # Households | % Households |
| Desktop or Laptop | 209 | 83.6% |
| Smartphone | 211 | 84.4% |
| Tablet | 181 | 72.4% |
| No Computing Device | 9 | 3.6% |
| Total | 250 | 100.0% |
Internet Access in Townsend
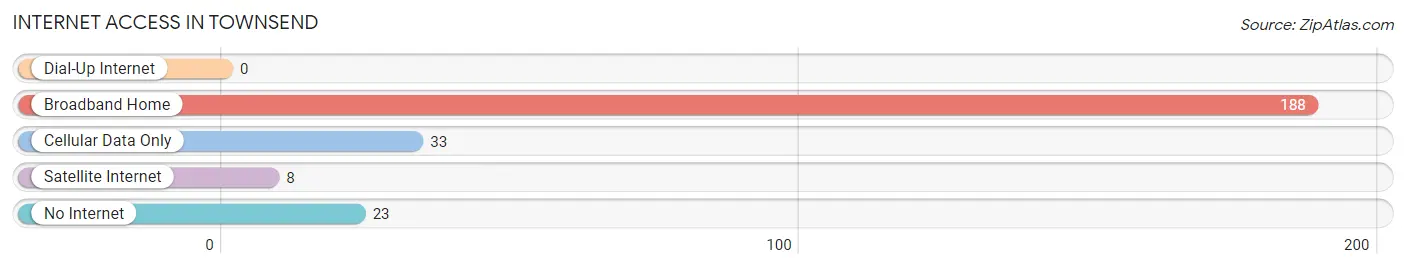
| Internet Type | # Households | % Households |
| Dial-Up Internet | 0 | 0.0% |
| Broadband Home | 188 | 75.2% |
| Cellular Data Only | 33 | 13.2% |
| Satellite Internet | 8 | 3.2% |
| No Internet | 23 | 9.2% |
| Total | 250 | 100.0% |
Townsend Summary
Townsend, Tennessee is a small town located in Blount County, Tennessee. It is situated in the foothills of the Great Smoky Mountains, and is part of the Knoxville metropolitan area. The town has a population of about 600 people, and is known for its rural charm and natural beauty.
History
The area that is now Townsend was first settled in the early 1800s by settlers from North Carolina. The town was originally known as "Tuckaleechee Cove," and was named after the Cherokee word for "peaceful valley." The town was officially incorporated in 1887, and was named after William Townsend, a prominent local businessman.
In the late 1800s, Townsend became a popular tourist destination due to its proximity to the Great Smoky Mountains National Park. The town was home to several resorts, including the Tuckaleechee Hotel, which was built in 1891. The hotel was a popular destination for visitors from all over the country, and was known for its luxurious accommodations and stunning views of the mountains.
In the early 1900s, Townsend began to experience a decline in tourism due to the rise of automobile travel. The town was also affected by the Great Depression, and many of the resorts and businesses closed. However, the town was able to survive and eventually began to experience a resurgence in the 1950s.
Geography
Townsend is located in the foothills of the Great Smoky Mountains, and is situated along the Little River. The town is surrounded by lush forests and rolling hills, and is known for its stunning views of the mountains. The town is located about 20 miles south of Knoxville, and is accessible via US Highway 321.
Economy
The economy of Townsend is largely based on tourism. The town is home to several resorts and campgrounds, as well as a variety of restaurants and shops. The town is also home to several small businesses, including a local winery and a craft brewery.
Demographics
As of the 2010 census, the population of Townsend was 579. The town is predominantly white, with about 95% of the population identifying as such. The median household income is $37,500, and the median age is 44.
Conclusion
Townsend, Tennessee is a small town located in the foothills of the Great Smoky Mountains. The town has a population of about 600 people, and is known for its rural charm and natural beauty. The economy of Townsend is largely based on tourism, and the town is home to several resorts and campgrounds, as well as a variety of restaurants and shops. The town is predominantly white, with about 95% of the population identifying as such. Townsend is a charming and picturesque town that is a popular destination for visitors from all over the country.
Common Questions
What is Per Capita Income in Townsend?
Per Capita income in Townsend is $33,246.
What is the Median Family Income in Townsend?
Median Family Income in Townsend is $79,848.
What is the Median Household income in Townsend?
Median Household Income in Townsend is $78,659.
What is Income or Wage Gap in Townsend?
Income or Wage Gap in Townsend is 42.0%.
Women in Townsend earn 58.0 cents for every dollar earned by a man.
What is Inequality or Gini Index in Townsend?
Inequality or Gini Index in Townsend is 0.33.
What is the Total Population of Townsend?
Total Population of Townsend is 583.
What is the Total Male Population of Townsend?
Total Male Population of Townsend is 306.
What is the Total Female Population of Townsend?
Total Female Population of Townsend is 277.
What is the Ratio of Males per 100 Females in Townsend?
There are 110.47 Males per 100 Females in Townsend.
What is the Ratio of Females per 100 Males in Townsend?
There are 90.52 Females per 100 Males in Townsend.
What is the Median Population Age in Townsend?
Median Population Age in Townsend is 52.1 Years.
What is the Average Family Size in Townsend
Average Family Size in Townsend is 2.7 People.
What is the Average Household Size in Townsend
Average Household Size in Townsend is 2.3 People.
How Large is the Labor Force in Townsend?
There are 184 People in the Labor Forcein in Townsend.
What is the Percentage of People in the Labor Force in Townsend?
36.9% of People are in the Labor Force in Townsend.
What is the Unemployment Rate in Townsend?
Unemployment Rate in Townsend is 4.9%.