Greenfield, TN Map & Demographics
Greenfield Map
Greenfield Overview
$21,021
PER CAPITA INCOME
$47,188
AVG FAMILY INCOME
$38,951
AVG HOUSEHOLD INCOME
30.0%
WAGE / INCOME GAP [ % ]
70.0¢/ $1
WAGE / INCOME GAP [ $ ]
0.47
INEQUALITY / GINI INDEX
2,297
TOTAL POPULATION
1,079
MALE POPULATION
1,218
FEMALE POPULATION
88.59
MALES / 100 FEMALES
112.88
FEMALES / 100 MALES
41.2
MEDIAN AGE
3.0
AVG FAMILY SIZE
2.4
AVG HOUSEHOLD SIZE
899
LABOR FORCE [ PEOPLE ]
50.2%
PERCENT IN LABOR FORCE
6.0%
UNEMPLOYMENT RATE
Greenfield Zip Codes
Greenfield Area Codes
Income in Greenfield
Income Overview in Greenfield
Per Capita Income in Greenfield is $21,021, while median incomes of families and households are $47,188 and $38,951 respectively.
| Characteristic | Number | Measure |
| Per Capita Income | 2,297 | $21,021 |
| Median Family Income | 567 | $47,188 |
| Mean Family Income | 567 | $62,285 |
| Median Household Income | 954 | $38,951 |
| Mean Household Income | 954 | $52,722 |
| Income Deficit | 567 | $0 |
| Wage / Income Gap (%) | 2,297 | 29.98% |
| Wage / Income Gap ($) | 2,297 | 70.02¢ per $1 |
| Gini / Inequality Index | 2,297 | 0.47 |
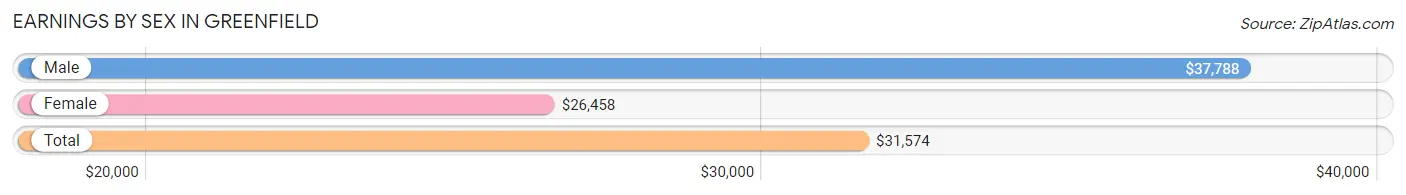
Earnings by Sex in Greenfield
Average Earnings in Greenfield are $31,574, $37,788 for men and $26,458 for women, a difference of 30.0%.
| Sex | Number | Average Earnings |
| Male | 461 (51.1%) | $37,788 |
| Female | 441 (48.9%) | $26,458 |
| Total | 902 (100.0%) | $31,574 |
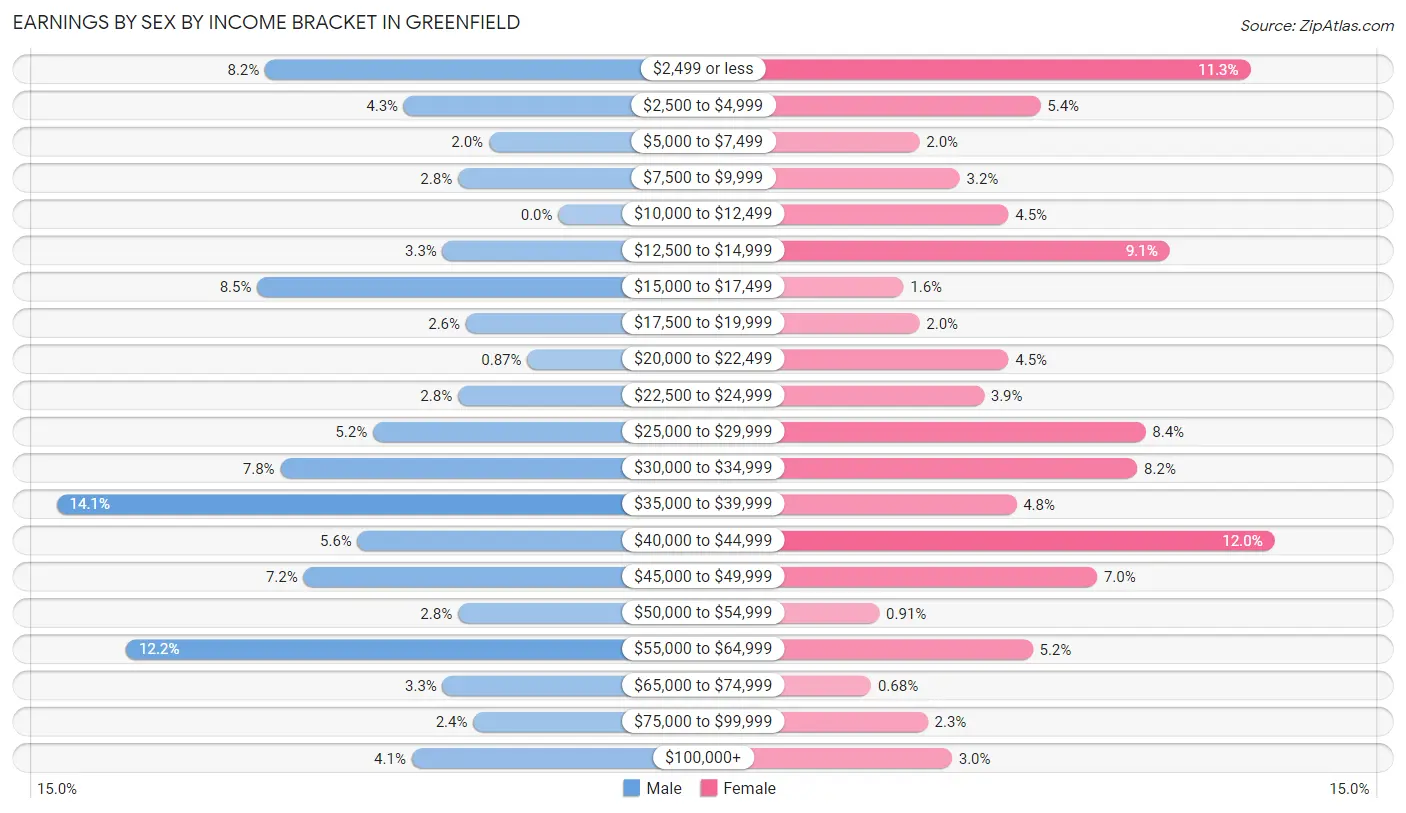
Earnings by Sex by Income Bracket in Greenfield
The most common earnings brackets in Greenfield are $35,000 to $39,999 for men (65 | 14.1%) and $40,000 to $44,999 for women (53 | 12.0%).
| Income | Male | Female |
| $2,499 or less | 38 (8.2%) | 50 (11.3%) |
| $2,500 to $4,999 | 20 (4.3%) | 24 (5.4%) |
| $5,000 to $7,499 | 9 (1.9%) | 9 (2.0%) |
| $7,500 to $9,999 | 13 (2.8%) | 14 (3.2%) |
| $10,000 to $12,499 | 0 (0.0%) | 20 (4.5%) |
| $12,500 to $14,999 | 15 (3.3%) | 40 (9.1%) |
| $15,000 to $17,499 | 39 (8.5%) | 7 (1.6%) |
| $17,500 to $19,999 | 12 (2.6%) | 9 (2.0%) |
| $20,000 to $22,499 | 4 (0.9%) | 20 (4.5%) |
| $22,500 to $24,999 | 13 (2.8%) | 17 (3.8%) |
| $25,000 to $29,999 | 24 (5.2%) | 37 (8.4%) |
| $30,000 to $34,999 | 36 (7.8%) | 36 (8.2%) |
| $35,000 to $39,999 | 65 (14.1%) | 21 (4.8%) |
| $40,000 to $44,999 | 26 (5.6%) | 53 (12.0%) |
| $45,000 to $49,999 | 33 (7.2%) | 31 (7.0%) |
| $50,000 to $54,999 | 13 (2.8%) | 4 (0.9%) |
| $55,000 to $64,999 | 56 (12.1%) | 23 (5.2%) |
| $65,000 to $74,999 | 15 (3.3%) | 3 (0.7%) |
| $75,000 to $99,999 | 11 (2.4%) | 10 (2.3%) |
| $100,000+ | 19 (4.1%) | 13 (2.9%) |
| Total | 461 (100.0%) | 441 (100.0%) |
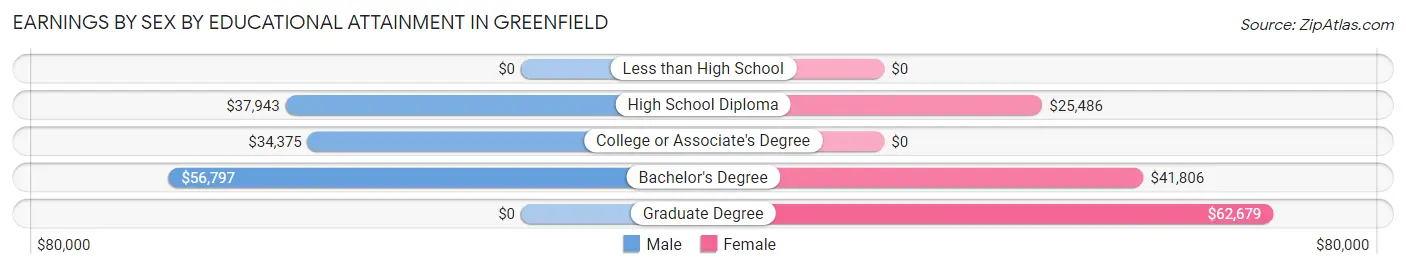
Earnings by Sex by Educational Attainment in Greenfield
Average earnings in Greenfield are $38,865 for men and $28,355 for women, a difference of 27.0%. Men with an educational attainment of bachelor's degree enjoy the highest average annual earnings of $56,797, while those with college or associate's degree education earn the least with $34,375. Women with an educational attainment of graduate degree earn the most with the average annual earnings of $62,679, while those with high school diploma education have the smallest earnings of $25,486.
| Educational Attainment | Male Income | Female Income |
| Less than High School | - | - |
| High School Diploma | $37,943 | $25,486 |
| College or Associate's Degree | $34,375 | $0 |
| Bachelor's Degree | $56,797 | $41,806 |
| Graduate Degree | - | - |
| Total | $38,865 | $28,355 |
Family Income in Greenfield
Family Income Brackets in Greenfield
According to the Greenfield family income data, there are 192 families falling into the $35,000 to $49,999 income range, which is the most common income bracket and makes up 33.9% of all families. Conversely, the $10,000 to $14,999 income bracket is the least frequent group with only 3 families (0.5%) belonging to this category.
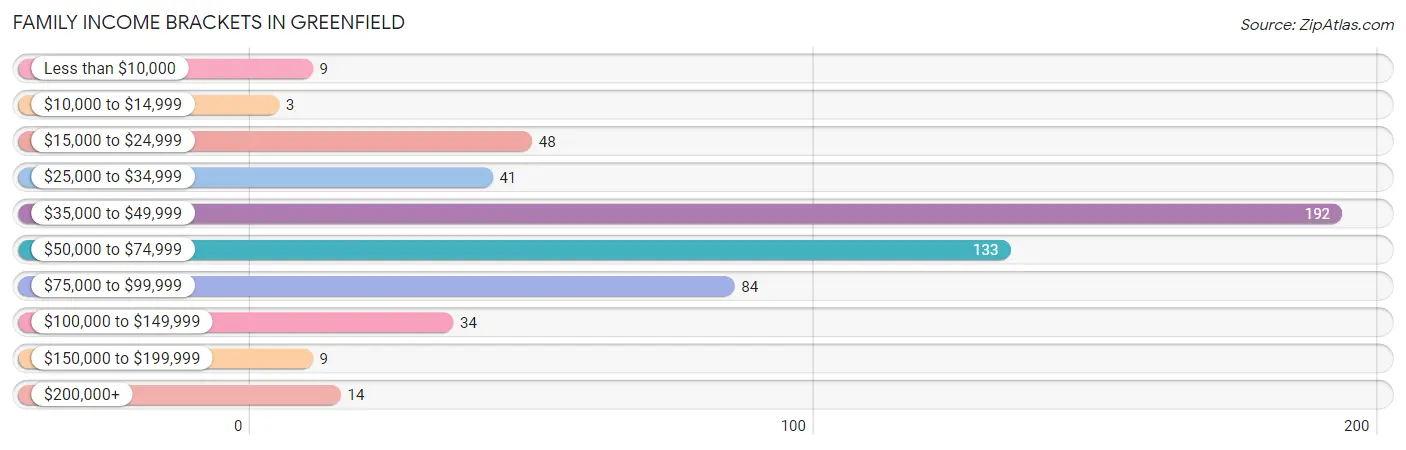
| Income Bracket | # Families | % Families |
| Less than $10,000 | 9 | 1.6% |
| $10,000 to $14,999 | 3 | 0.5% |
| $15,000 to $24,999 | 48 | 8.5% |
| $25,000 to $34,999 | 41 | 7.2% |
| $35,000 to $49,999 | 192 | 33.9% |
| $50,000 to $74,999 | 133 | 23.5% |
| $75,000 to $99,999 | 84 | 14.8% |
| $100,000 to $149,999 | 34 | 6.0% |
| $150,000 to $199,999 | 9 | 1.6% |
| $200,000+ | 14 | 2.5% |
Family Income by Famaliy Size in Greenfield
4-person families (92 | 16.2%) account for the highest median family income in Greenfield with $56,000 per family, while 2-person families (245 | 43.2%) have the highest median income of $22,438 per family member.
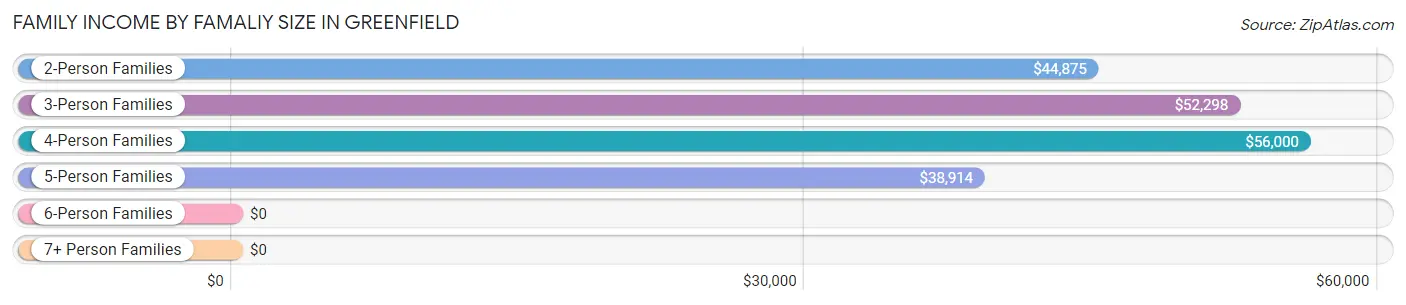
| Income Bracket | # Families | Median Income |
| 2-Person Families | 245 (43.2%) | $44,875 |
| 3-Person Families | 115 (20.3%) | $52,298 |
| 4-Person Families | 92 (16.2%) | $56,000 |
| 5-Person Families | 112 (19.8%) | $38,914 |
| 6-Person Families | 3 (0.5%) | $0 |
| 7+ Person Families | 0 (0.0%) | $0 |
| Total | 567 (100.0%) | $47,188 |
Family Income by Number of Earners in Greenfield
The median family income in Greenfield is $47,188, with families comprising 3+ earners (43) having the highest median family income of $75,625, while families with 1 earner (273) have the lowest median family income of $39,139, accounting for 7.6% and 48.1% of families, respectively.
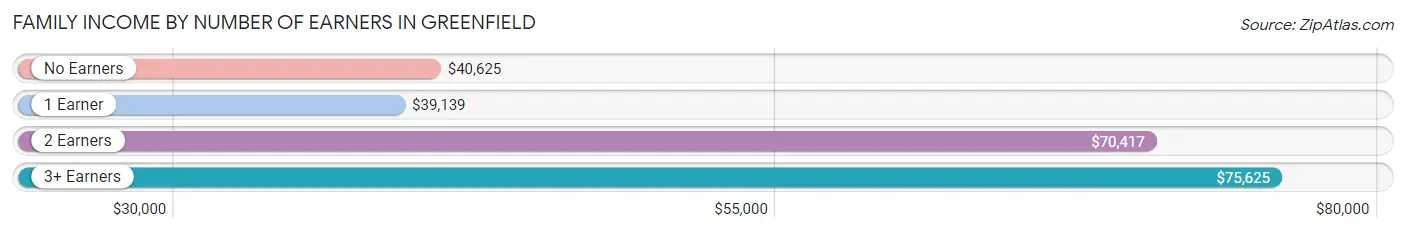
| Number of Earners | # Families | Median Income |
| No Earners | 75 (13.2%) | $40,625 |
| 1 Earner | 273 (48.1%) | $39,139 |
| 2 Earners | 176 (31.0%) | $70,417 |
| 3+ Earners | 43 (7.6%) | $75,625 |
| Total | 567 (100.0%) | $47,188 |
Household Income in Greenfield
Household Income Brackets in Greenfield
With 216 households falling in the category, the $35,000 to $49,999 income range is the most frequent in Greenfield, accounting for 22.6% of all households. In contrast, only 9 households (0.9%) fall into the $150,000 to $199,999 income bracket, making it the least populous group.
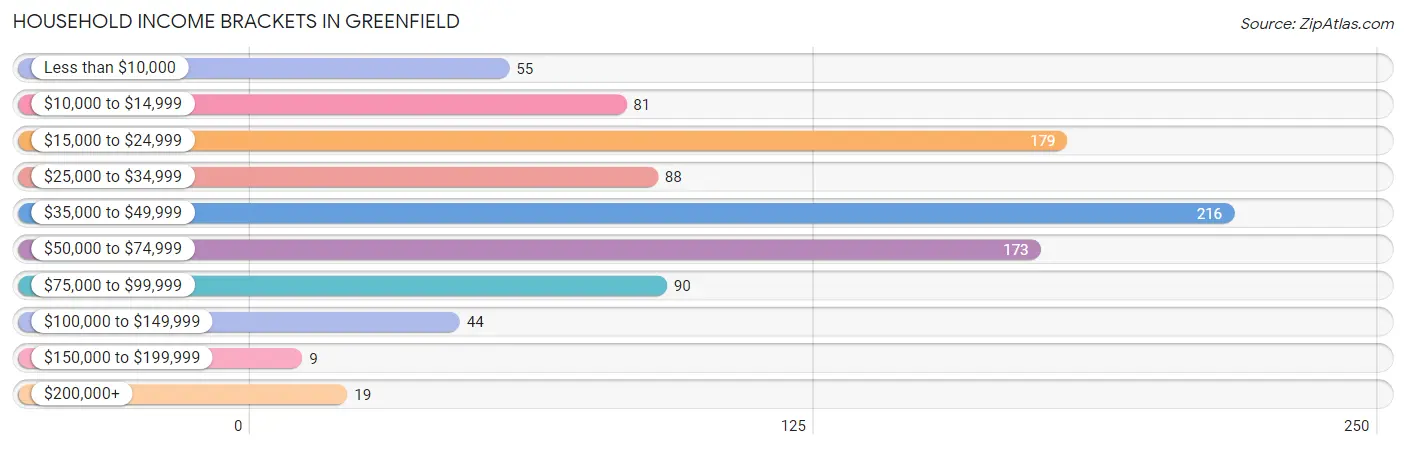
| Income Bracket | # Households | % Households |
| Less than $10,000 | 55 | 5.8% |
| $10,000 to $14,999 | 81 | 8.5% |
| $15,000 to $24,999 | 179 | 18.8% |
| $25,000 to $34,999 | 88 | 9.2% |
| $35,000 to $49,999 | 216 | 22.6% |
| $50,000 to $74,999 | 173 | 18.1% |
| $75,000 to $99,999 | 90 | 9.4% |
| $100,000 to $149,999 | 44 | 4.6% |
| $150,000 to $199,999 | 9 | 0.9% |
| $200,000+ | 19 | 2.0% |
Household Income by Householder Age in Greenfield
The median household income in Greenfield is $38,951, with the highest median household income of $42,708 found in the 45 to 64 years age bracket for the primary householder. A total of 325 households (34.1%) fall into this category. Meanwhile, the 15 to 24 years age bracket for the primary householder has the lowest median household income of $0, with 42 households (4.4%) in this group.
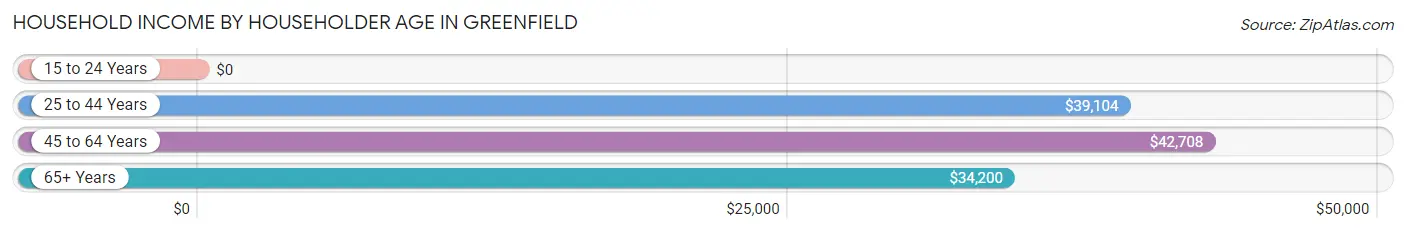
| Income Bracket | # Households | Median Income |
| 15 to 24 Years | 42 (4.4%) | $0 |
| 25 to 44 Years | 297 (31.1%) | $39,104 |
| 45 to 64 Years | 325 (34.1%) | $42,708 |
| 65+ Years | 290 (30.4%) | $34,200 |
| Total | 954 (100.0%) | $38,951 |
Poverty in Greenfield
Income Below Poverty by Sex and Age in Greenfield
With 24.9% poverty level for males and 15.5% for females among the residents of Greenfield, 16 and 17 year old males and 45 to 54 year old females are the most vulnerable to poverty, with 15 males (57.7%) and 48 females (39.0%) in their respective age groups living below the poverty level.
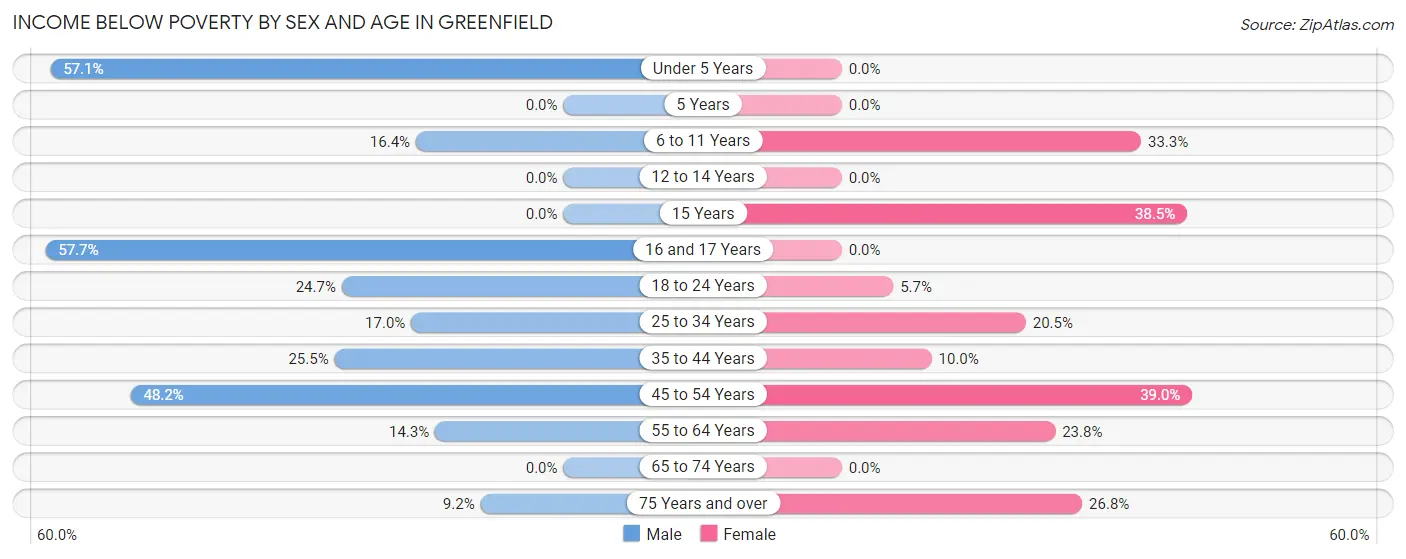
| Age Bracket | Male | Female |
| Under 5 Years | 48 (57.1%) | 0 (0.0%) |
| 5 Years | 0 (0.0%) | 0 (0.0%) |
| 6 to 11 Years | 33 (16.4%) | 14 (33.3%) |
| 12 to 14 Years | 0 (0.0%) | 0 (0.0%) |
| 15 Years | 0 (0.0%) | 5 (38.5%) |
| 16 and 17 Years | 15 (57.7%) | 0 (0.0%) |
| 18 to 24 Years | 19 (24.7%) | 11 (5.7%) |
| 25 to 34 Years | 20 (17.0%) | 25 (20.5%) |
| 35 to 44 Years | 26 (25.5%) | 18 (10.0%) |
| 45 to 54 Years | 81 (48.2%) | 48 (39.0%) |
| 55 to 64 Years | 11 (14.3%) | 29 (23.8%) |
| 65 to 74 Years | 0 (0.0%) | 0 (0.0%) |
| 75 Years and over | 6 (9.2%) | 34 (26.8%) |
| Total | 259 (24.9%) | 184 (15.5%) |
Income Above Poverty by Sex and Age in Greenfield
According to the poverty statistics in Greenfield, males aged 12 to 14 years and females aged under 5 years are the age groups that are most secure financially, with 100.0% of males and 100.0% of females in these age groups living above the poverty line.
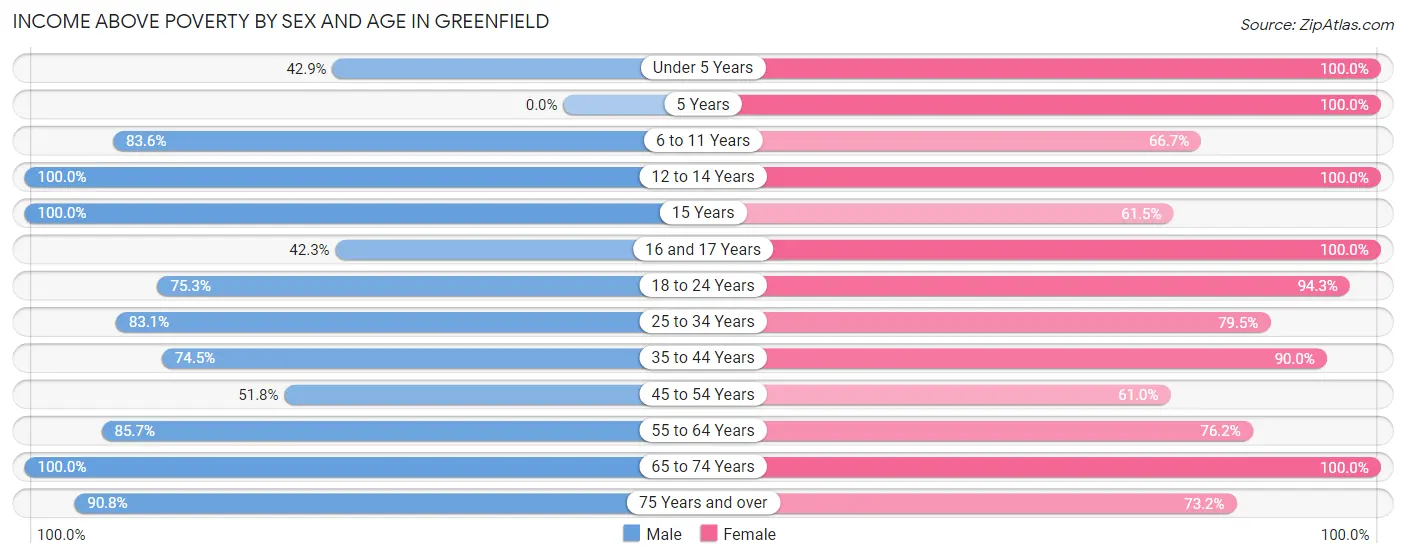
| Age Bracket | Male | Female |
| Under 5 Years | 36 (42.9%) | 38 (100.0%) |
| 5 Years | 0 (0.0%) | 17 (100.0%) |
| 6 to 11 Years | 168 (83.6%) | 28 (66.7%) |
| 12 to 14 Years | 31 (100.0%) | 6 (100.0%) |
| 15 Years | 2 (100.0%) | 8 (61.5%) |
| 16 and 17 Years | 11 (42.3%) | 23 (100.0%) |
| 18 to 24 Years | 58 (75.3%) | 181 (94.3%) |
| 25 to 34 Years | 98 (83.1%) | 97 (79.5%) |
| 35 to 44 Years | 76 (74.5%) | 162 (90.0%) |
| 45 to 54 Years | 87 (51.8%) | 75 (61.0%) |
| 55 to 64 Years | 66 (85.7%) | 93 (76.2%) |
| 65 to 74 Years | 90 (100.0%) | 178 (100.0%) |
| 75 Years and over | 59 (90.8%) | 93 (73.2%) |
| Total | 782 (75.1%) | 999 (84.5%) |
Income Below Poverty Among Married-Couple Families in Greenfield
The poverty statistics for married-couple families in Greenfield show that 2.6% or 12 of the total 456 families live below the poverty line. Families with no children have the highest poverty rate of 4.7%, comprising of 12 families. On the other hand, families with 1 or 2 children have the lowest poverty rate of 0.0%, which includes 0 families.
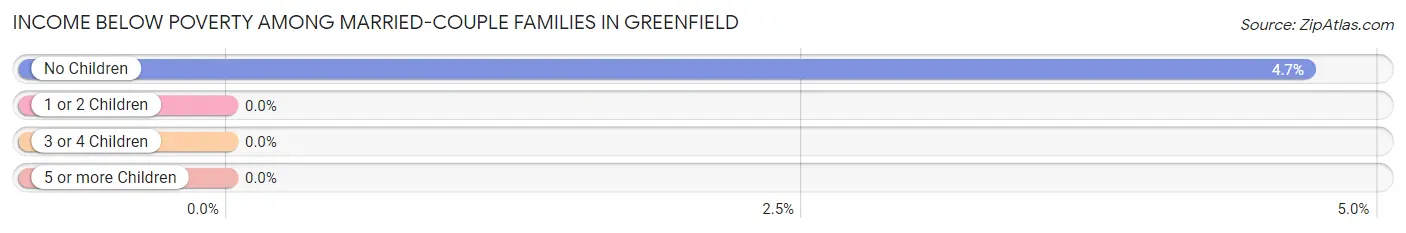
| Children | Above Poverty | Below Poverty |
| No Children | 244 (95.3%) | 12 (4.7%) |
| 1 or 2 Children | 193 (100.0%) | 0 (0.0%) |
| 3 or 4 Children | 7 (100.0%) | 0 (0.0%) |
| 5 or more Children | 0 (0.0%) | 0 (0.0%) |
| Total | 444 (97.4%) | 12 (2.6%) |
Income Below Poverty Among Single-Parent Households in Greenfield
According to the poverty data in Greenfield, 67.5% or 27 single-father households and 31.0% or 22 single-mother households are living below the poverty line. Among single-father households, those with 1 or 2 children have the highest poverty rate, with 11 households (78.6%) experiencing poverty. Likewise, among single-mother households, those with 3 or 4 children have the highest poverty rate, with 5 households (100.0%) falling below the poverty line.
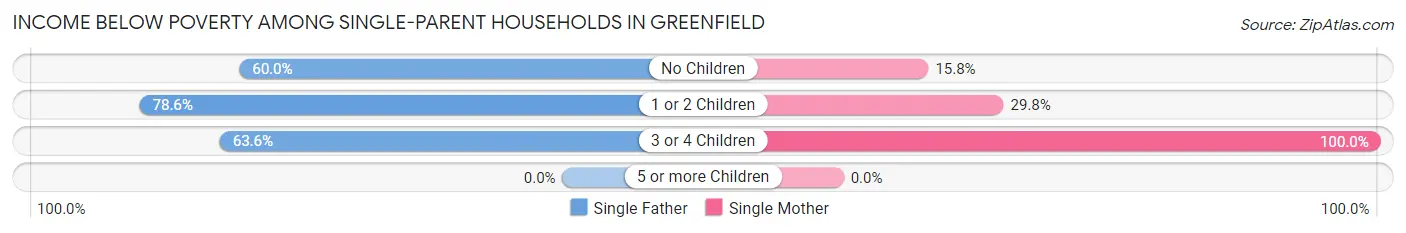
| Children | Single Father | Single Mother |
| No Children | 9 (60.0%) | 3 (15.8%) |
| 1 or 2 Children | 11 (78.6%) | 14 (29.8%) |
| 3 or 4 Children | 7 (63.6%) | 5 (100.0%) |
| 5 or more Children | 0 (0.0%) | 0 (0.0%) |
| Total | 27 (67.5%) | 22 (31.0%) |
Income Below Poverty Among Married-Couple vs Single-Parent Households in Greenfield
The poverty data for Greenfield shows that 12 of the married-couple family households (2.6%) and 49 of the single-parent households (44.1%) are living below the poverty level. Within the married-couple family households, those with no children have the highest poverty rate, with 12 households (4.7%) falling below the poverty line. Among the single-parent households, those with 3 or 4 children have the highest poverty rate, with 12 household (75.0%) living below poverty.
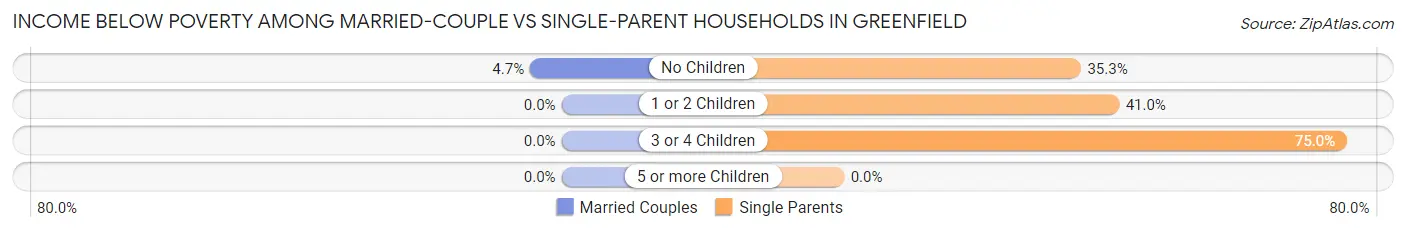
| Children | Married-Couple Families | Single-Parent Households |
| No Children | 12 (4.7%) | 12 (35.3%) |
| 1 or 2 Children | 0 (0.0%) | 25 (41.0%) |
| 3 or 4 Children | 0 (0.0%) | 12 (75.0%) |
| 5 or more Children | 0 (0.0%) | 0 (0.0%) |
| Total | 12 (2.6%) | 49 (44.1%) |
Race in Greenfield
The most populous races in Greenfield are White / Caucasian (1,985 | 86.4%), Black / African American (182 | 7.9%), and Hispanic or Latino (65 | 2.8%).
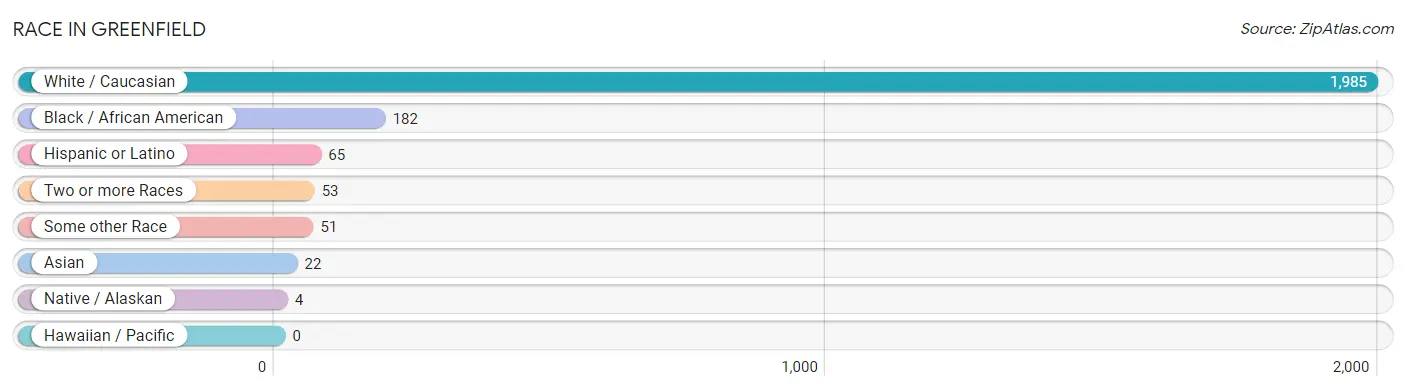
| Race | # Population | % Population |
| Asian | 22 | 1.0% |
| Black / African American | 182 | 7.9% |
| Hawaiian / Pacific | 0 | 0.0% |
| Hispanic or Latino | 65 | 2.8% |
| Native / Alaskan | 4 | 0.2% |
| White / Caucasian | 1,985 | 86.4% |
| Two or more Races | 53 | 2.3% |
| Some other Race | 51 | 2.2% |
| Total | 2,297 | 100.0% |
Ancestry in Greenfield
The most populous ancestries reported in Greenfield are American (1,107 | 48.2%), English (255 | 11.1%), Irish (101 | 4.4%), German (79 | 3.4%), and French (61 | 2.7%), together accounting for 69.8% of all Greenfield residents.
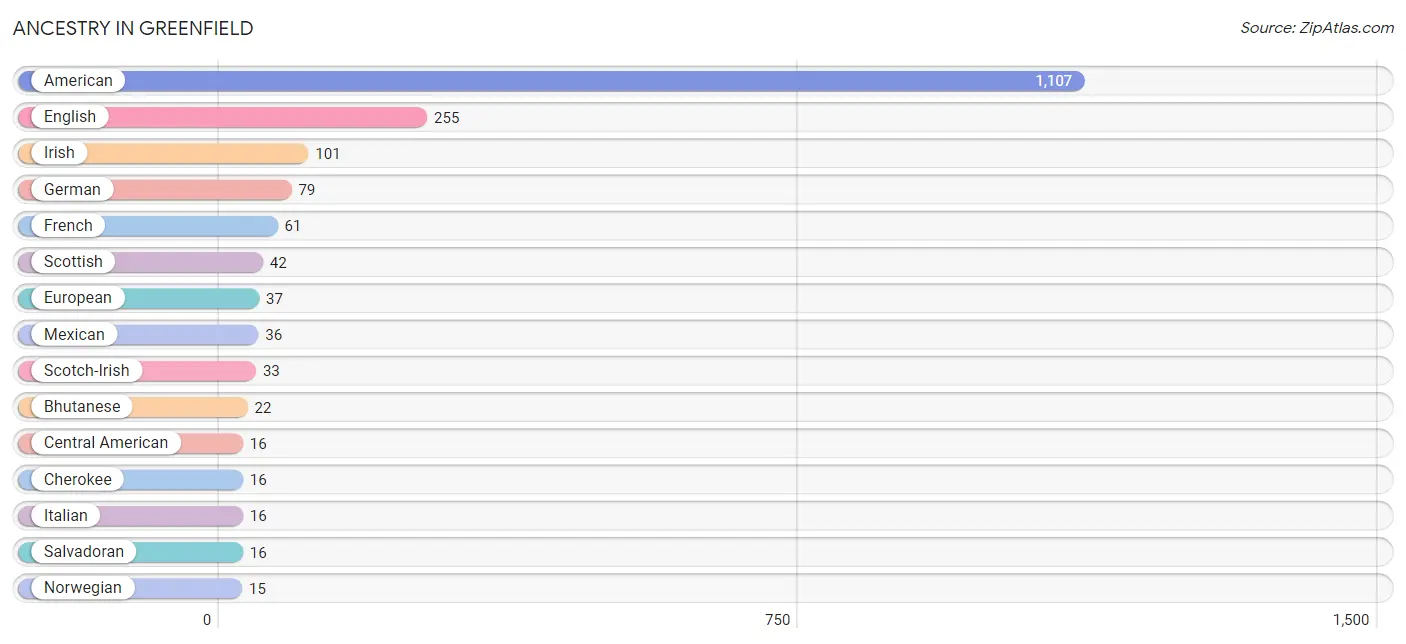
| Ancestry | # Population | % Population |
| American | 1,107 | 48.2% |
| Bhutanese | 22 | 1.0% |
| British | 11 | 0.5% |
| Cajun | 4 | 0.2% |
| Central American | 16 | 0.7% |
| Central American Indian | 4 | 0.2% |
| Cherokee | 16 | 0.7% |
| Cuban | 13 | 0.6% |
| Czech | 5 | 0.2% |
| Dutch | 4 | 0.2% |
| English | 255 | 11.1% |
| European | 37 | 1.6% |
| French | 61 | 2.7% |
| German | 79 | 3.4% |
| Greek | 7 | 0.3% |
| Irish | 101 | 4.4% |
| Italian | 16 | 0.7% |
| Mexican | 36 | 1.6% |
| Northern European | 7 | 0.3% |
| Norwegian | 15 | 0.6% |
| Polish | 9 | 0.4% |
| Salvadoran | 16 | 0.7% |
| Scotch-Irish | 33 | 1.4% |
| Scottish | 42 | 1.8% |
| Ukrainian | 4 | 0.2% |
| Welsh | 4 | 0.2% | View All 26 Rows |
Immigrants in Greenfield
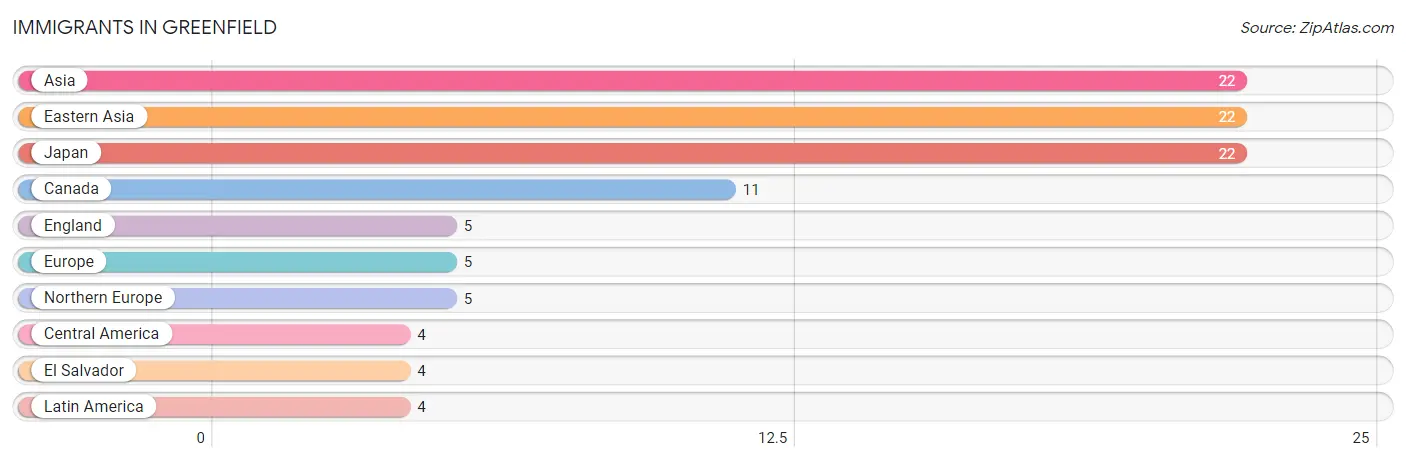
The most numerous immigrant groups reported in Greenfield came from Asia (22 | 1.0%), Eastern Asia (22 | 1.0%), Japan (22 | 1.0%), Canada (11 | 0.5%), and England (5 | 0.2%), together accounting for 3.6% of all Greenfield residents.
| Immigration Origin | # Population | % Population |
| Asia | 22 | 1.0% |
| Canada | 11 | 0.5% |
| Central America | 4 | 0.2% |
| Eastern Asia | 22 | 1.0% |
| El Salvador | 4 | 0.2% |
| England | 5 | 0.2% |
| Europe | 5 | 0.2% |
| Japan | 22 | 1.0% |
| Latin America | 4 | 0.2% |
| Northern Europe | 5 | 0.2% | View All 10 Rows |
Sex and Age in Greenfield
Sex and Age in Greenfield
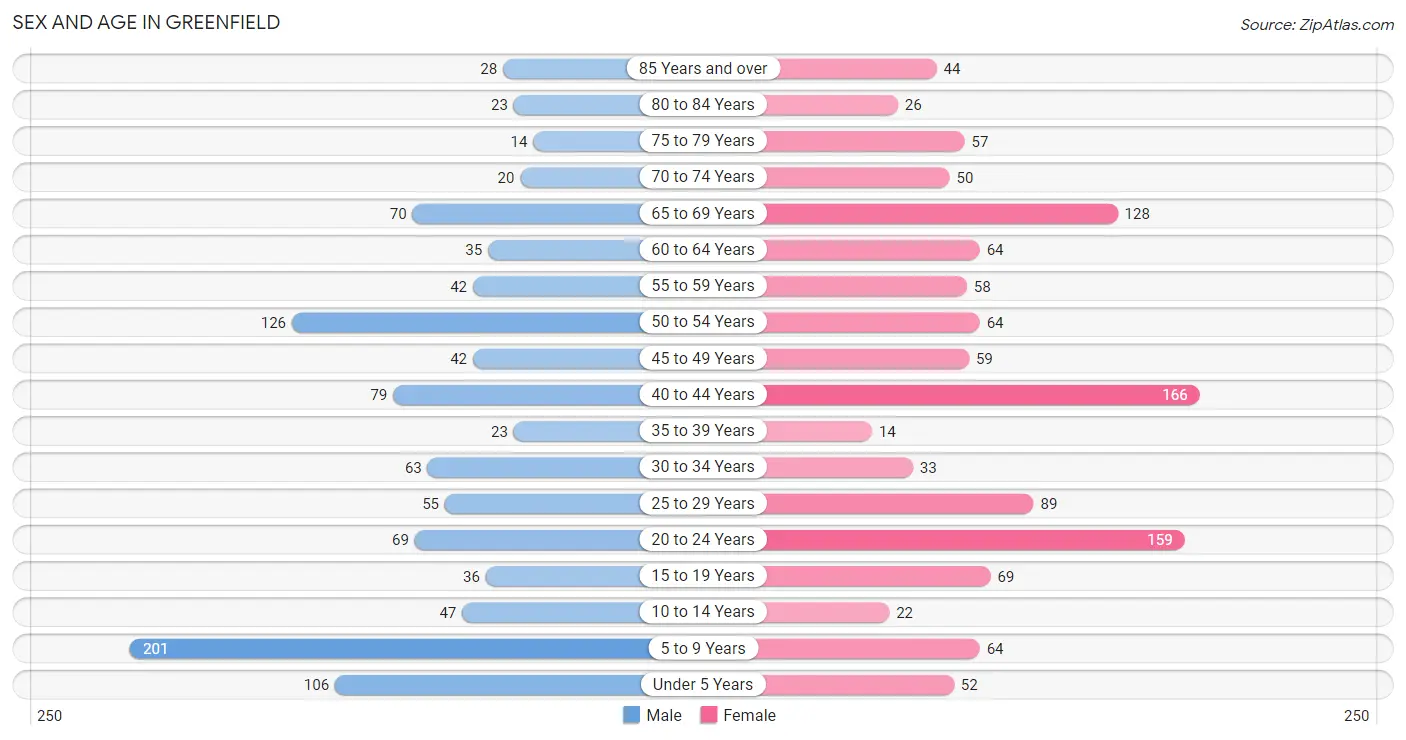
The most populous age groups in Greenfield are 5 to 9 Years (201 | 18.6%) for men and 40 to 44 Years (166 | 13.6%) for women.
| Age Bracket | Male | Female |
| Under 5 Years | 106 (9.8%) | 52 (4.3%) |
| 5 to 9 Years | 201 (18.6%) | 64 (5.2%) |
| 10 to 14 Years | 47 (4.4%) | 22 (1.8%) |
| 15 to 19 Years | 36 (3.3%) | 69 (5.7%) |
| 20 to 24 Years | 69 (6.4%) | 159 (13.1%) |
| 25 to 29 Years | 55 (5.1%) | 89 (7.3%) |
| 30 to 34 Years | 63 (5.8%) | 33 (2.7%) |
| 35 to 39 Years | 23 (2.1%) | 14 (1.1%) |
| 40 to 44 Years | 79 (7.3%) | 166 (13.6%) |
| 45 to 49 Years | 42 (3.9%) | 59 (4.8%) |
| 50 to 54 Years | 126 (11.7%) | 64 (5.2%) |
| 55 to 59 Years | 42 (3.9%) | 58 (4.8%) |
| 60 to 64 Years | 35 (3.2%) | 64 (5.2%) |
| 65 to 69 Years | 70 (6.5%) | 128 (10.5%) |
| 70 to 74 Years | 20 (1.8%) | 50 (4.1%) |
| 75 to 79 Years | 14 (1.3%) | 57 (4.7%) |
| 80 to 84 Years | 23 (2.1%) | 26 (2.1%) |
| 85 Years and over | 28 (2.6%) | 44 (3.6%) |
| Total | 1,079 (100.0%) | 1,218 (100.0%) |
Families and Households in Greenfield
Median Family Size in Greenfield
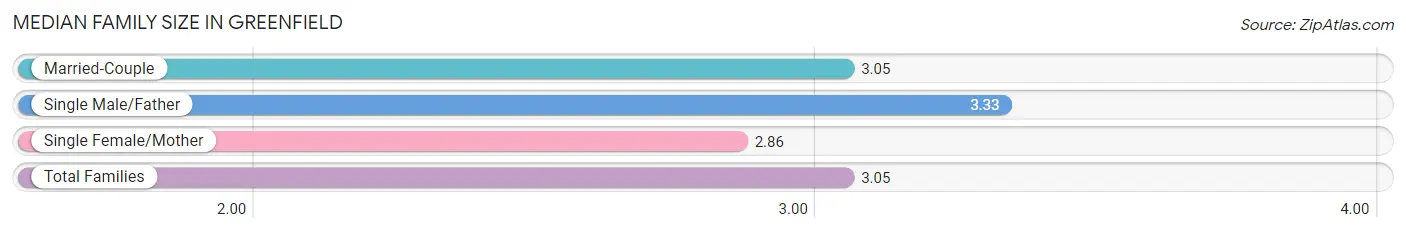
The median family size in Greenfield is 3.05 persons per family, with single male/father families (40 | 7.0%) accounting for the largest median family size of 3.33 persons per family. On the other hand, single female/mother families (71 | 12.5%) represent the smallest median family size with 2.86 persons per family.
| Family Type | # Families | Family Size |
| Married-Couple | 456 (80.4%) | 3.05 |
| Single Male/Father | 40 (7.0%) | 3.33 |
| Single Female/Mother | 71 (12.5%) | 2.86 |
| Total Families | 567 (100.0%) | 3.05 |
Median Household Size in Greenfield
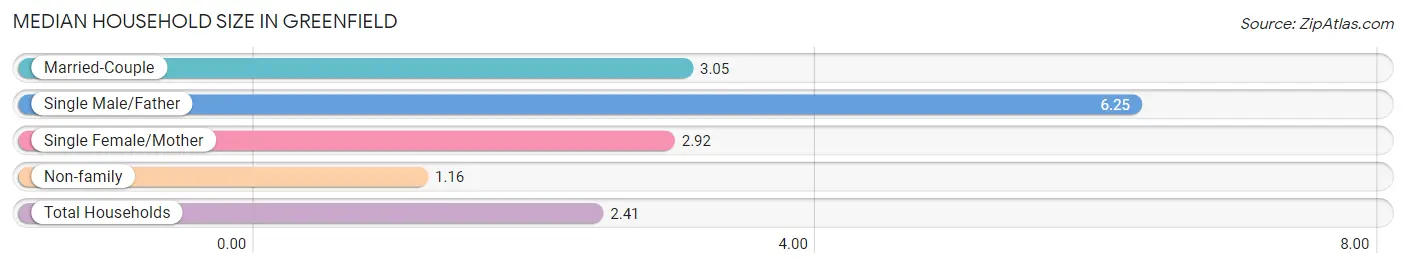
The median household size in Greenfield is 2.41 persons per household, with single male/father households (40 | 4.2%) accounting for the largest median household size of 6.25 persons per household. non-family households (387 | 40.6%) represent the smallest median household size with 1.16 persons per household.
| Household Type | # Households | Household Size |
| Married-Couple | 456 (47.8%) | 3.05 |
| Single Male/Father | 40 (4.2%) | 6.25 |
| Single Female/Mother | 71 (7.4%) | 2.92 |
| Non-family | 387 (40.6%) | 1.16 |
| Total Households | 954 (100.0%) | 2.41 |
Household Size by Marriage Status in Greenfield
Out of a total of 954 households in Greenfield, 567 (59.4%) are family households, while 387 (40.6%) are nonfamily households. The most numerous type of family households are 2-person households, comprising 216, and the most common type of nonfamily households are 1-person households, comprising 341.
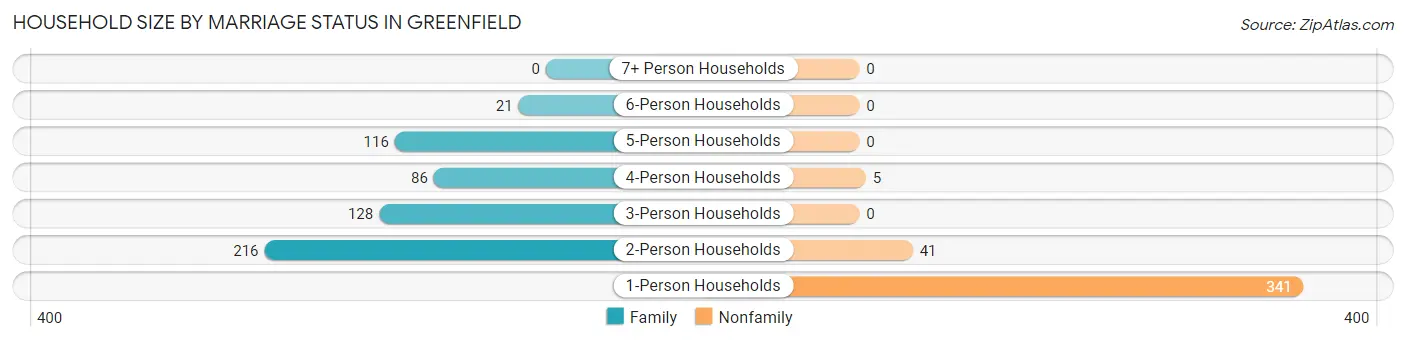
| Household Size | Family Households | Nonfamily Households |
| 1-Person Households | - | 341 (35.7%) |
| 2-Person Households | 216 (22.6%) | 41 (4.3%) |
| 3-Person Households | 128 (13.4%) | 0 (0.0%) |
| 4-Person Households | 86 (9.0%) | 5 (0.5%) |
| 5-Person Households | 116 (12.2%) | 0 (0.0%) |
| 6-Person Households | 21 (2.2%) | 0 (0.0%) |
| 7+ Person Households | 0 (0.0%) | 0 (0.0%) |
| Total | 567 (59.4%) | 387 (40.6%) |
Female Fertility in Greenfield
Fertility by Age in Greenfield
Average fertility rate in Greenfield is 30.0 births per 1,000 women. Women in the age bracket of 20 to 34 years have the highest fertility rate with 64.0 births per 1,000 women. Women in the age bracket of 20 to 34 years acount for 100.0% of all women with births.
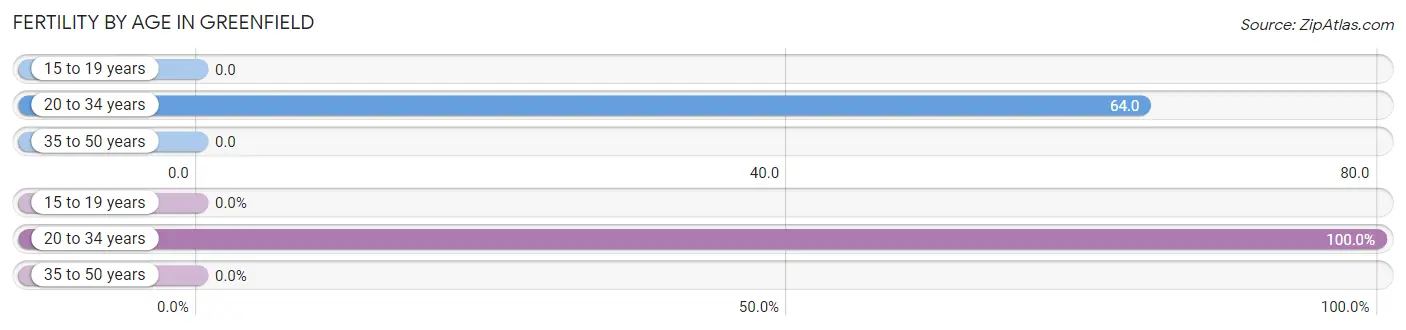
| Age Bracket | Women with Births | Births / 1,000 Women |
| 15 to 19 years | 0 (0.0%) | 0.0 |
| 20 to 34 years | 18 (100.0%) | 64.0 |
| 35 to 50 years | 0 (0.0%) | 0.0 |
| Total | 18 (100.0%) | 30.0 |
Fertility by Age by Marriage Status in Greenfield
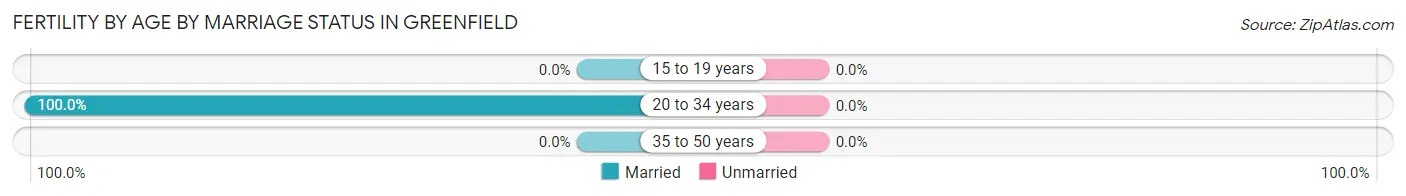
| Age Bracket | Married | Unmarried |
| 15 to 19 years | 0 (0.0%) | 0 (0.0%) |
| 20 to 34 years | 18 (100.0%) | 0 (0.0%) |
| 35 to 50 years | 0 (0.0%) | 0 (0.0%) |
| Total | 18 (100.0%) | 0 (0.0%) |
Fertility by Education in Greenfield
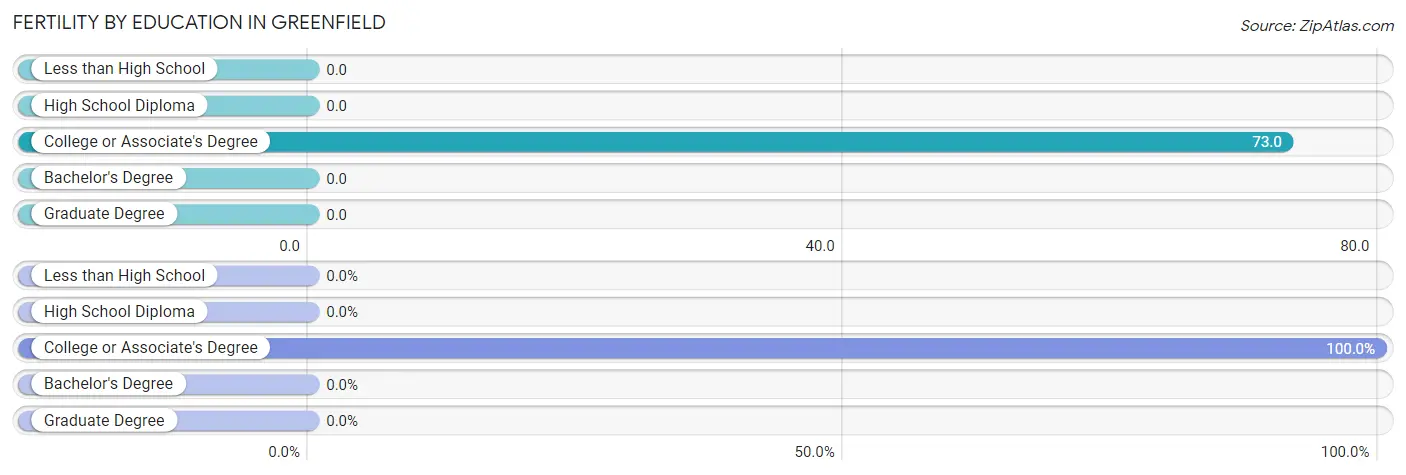
| Educational Attainment | Women with Births | Births / 1,000 Women |
| Less than High School | 0 (0.0%) | 0.0 |
| High School Diploma | 0 (0.0%) | 0.0 |
| College or Associate's Degree | 18 (100.0%) | 73.0 |
| Bachelor's Degree | 0 (0.0%) | 0.0 |
| Graduate Degree | 0 (0.0%) | 0.0 |
| Total | 18 (100.0%) | 30.0 |
Fertility by Education by Marriage Status in Greenfield
| Educational Attainment | Married | Unmarried |
| Less than High School | 0 (0.0%) | 0 (0.0%) |
| High School Diploma | 0 (0.0%) | 0 (0.0%) |
| College or Associate's Degree | 18 (100.0%) | 0 (0.0%) |
| Bachelor's Degree | 0 (0.0%) | 0 (0.0%) |
| Graduate Degree | 0 (0.0%) | 0 (0.0%) |
| Total | 18 (100.0%) | 0 (0.0%) |
Employment Characteristics in Greenfield
Employment by Class of Employer in Greenfield
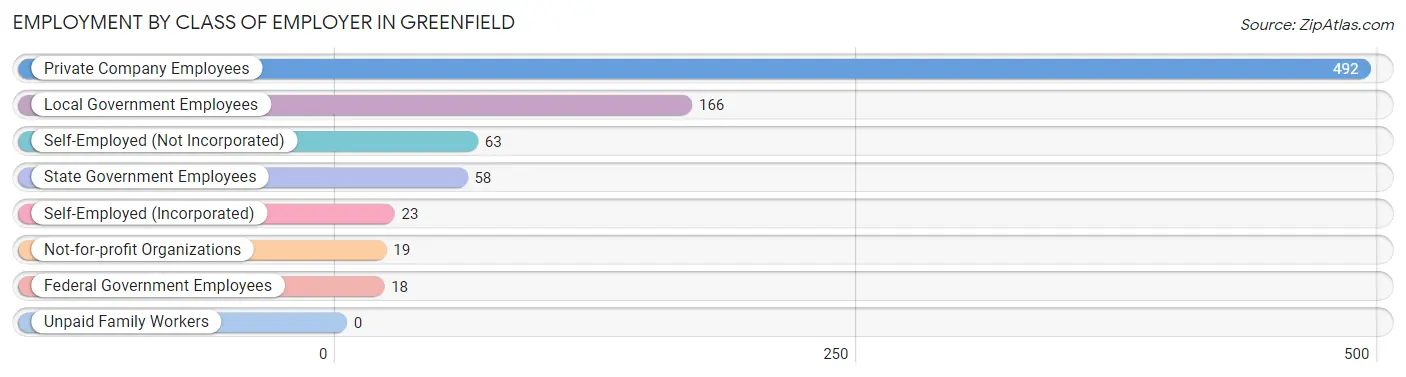
Among the 839 employed individuals in Greenfield, private company employees (492 | 58.6%), local government employees (166 | 19.8%), and self-employed (not incorporated) (63 | 7.5%) make up the most common classes of employment.
| Employer Class | # Employees | % Employees |
| Private Company Employees | 492 | 58.6% |
| Self-Employed (Incorporated) | 23 | 2.7% |
| Self-Employed (Not Incorporated) | 63 | 7.5% |
| Not-for-profit Organizations | 19 | 2.3% |
| Local Government Employees | 166 | 19.8% |
| State Government Employees | 58 | 6.9% |
| Federal Government Employees | 18 | 2.1% |
| Unpaid Family Workers | 0 | 0.0% |
| Total | 839 | 100.0% |
Employment Status by Age in Greenfield
According to the labor force statistics for Greenfield, out of the total population over 16 years of age (1,790), 50.2% or 899 individuals are in the labor force, with 6.0% or 54 of them unemployed. The age group with the highest labor force participation rate is 30 to 34 years, with 100.0% or 96 individuals in the labor force. Within the labor force, the 16 to 19 years age range has the highest percentage of unemployed individuals, with 20.9% or 9 of them being unemployed.
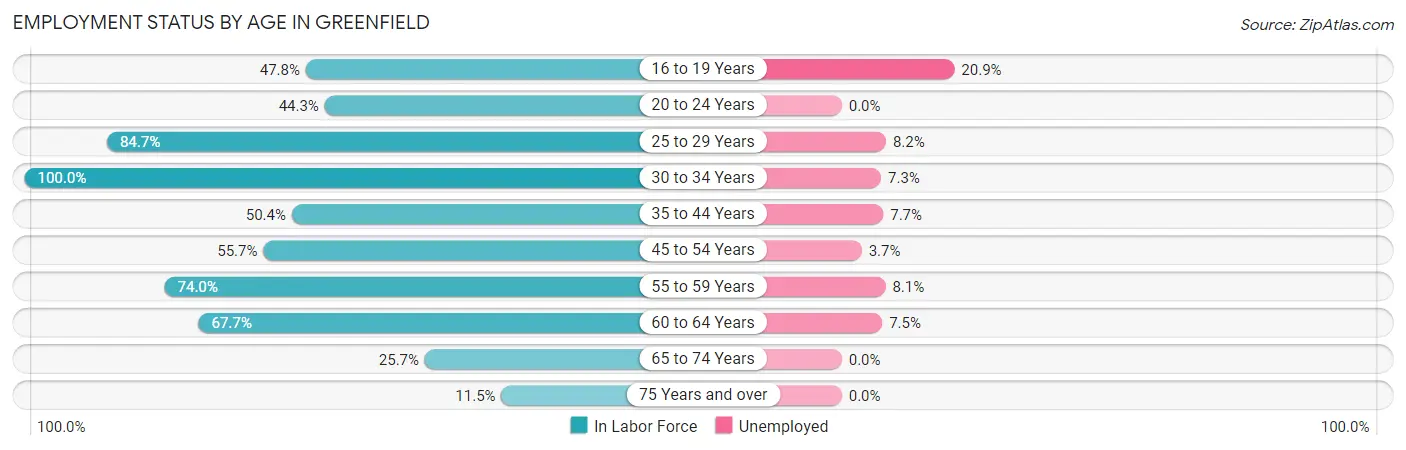
| Age Bracket | In Labor Force | Unemployed |
| 16 to 19 Years | 43 (47.8%) | 9 (20.9%) |
| 20 to 24 Years | 101 (44.3%) | 0 (0.0%) |
| 25 to 29 Years | 122 (84.7%) | 10 (8.2%) |
| 30 to 34 Years | 96 (100.0%) | 7 (7.3%) |
| 35 to 44 Years | 142 (50.4%) | 11 (7.7%) |
| 45 to 54 Years | 162 (55.7%) | 6 (3.7%) |
| 55 to 59 Years | 74 (74.0%) | 6 (8.1%) |
| 60 to 64 Years | 67 (67.7%) | 5 (7.5%) |
| 65 to 74 Years | 69 (25.7%) | 0 (0.0%) |
| 75 Years and over | 22 (11.5%) | 0 (0.0%) |
| Total | 899 (50.2%) | 54 (6.0%) |
Employment Status by Educational Attainment in Greenfield
According to labor force statistics for Greenfield, 65.5% of individuals (663) out of the total population between 25 and 64 years of age (1,012) are in the labor force, with 6.8% or 45 of them being unemployed. The group with the highest labor force participation rate are those with the educational attainment of bachelor's degree or higher, with 91.4% or 170 individuals in the labor force. Within the labor force, individuals with less than high school education have the highest percentage of unemployment, with 15.8% or 3 of them being unemployed.
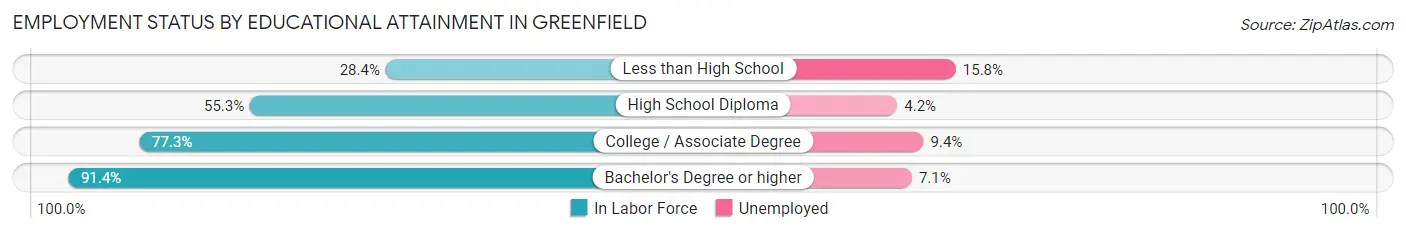
| Educational Attainment | In Labor Force | Unemployed |
| Less than High School | 19 (28.4%) | 11 (15.8%) |
| High School Diploma | 283 (55.3%) | 22 (4.2%) |
| College / Associate Degree | 191 (77.3%) | 23 (9.4%) |
| Bachelor's Degree or higher | 170 (91.4%) | 13 (7.1%) |
| Total | 663 (65.5%) | 69 (6.8%) |
Employment Occupations by Sex in Greenfield
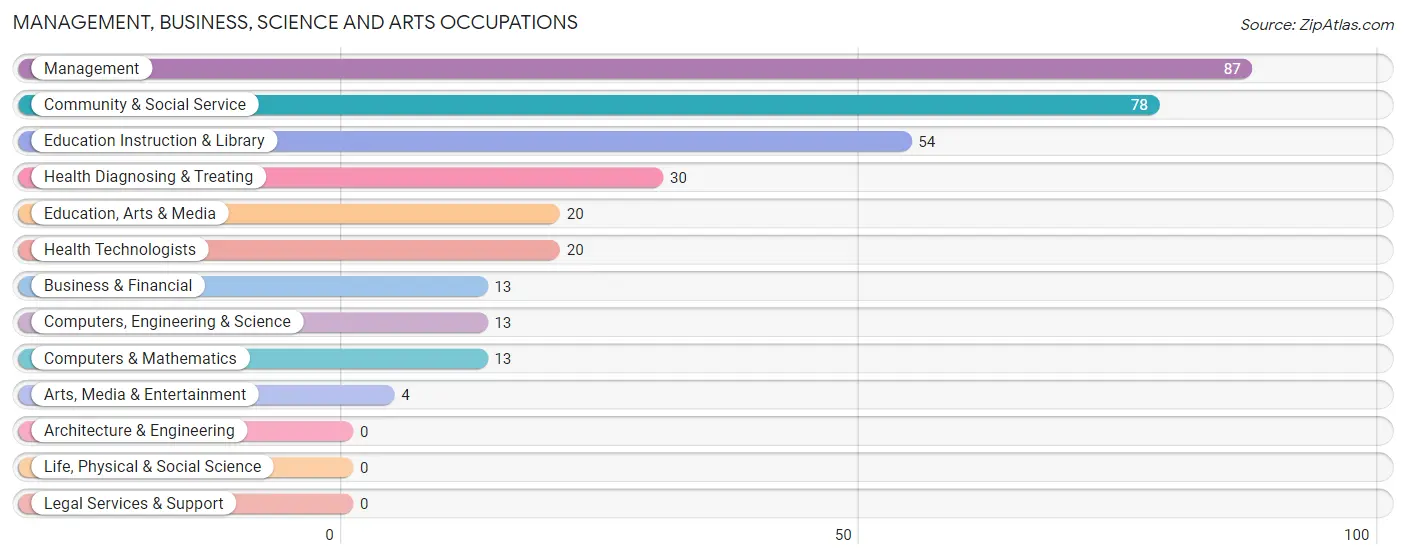
Management, Business, Science and Arts Occupations
The most common Management, Business, Science and Arts occupations in Greenfield are Management (87 | 10.3%), Community & Social Service (78 | 9.2%), Education Instruction & Library (54 | 6.4%), Health Diagnosing & Treating (30 | 3.5%), and Education, Arts & Media (20 | 2.4%).
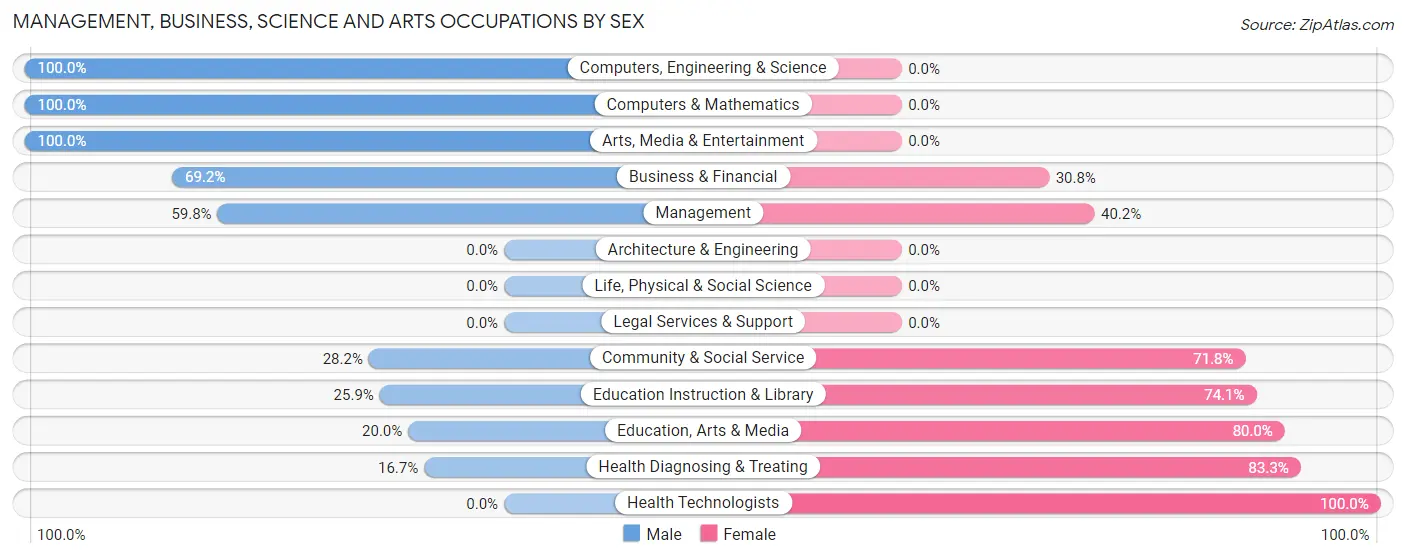
Management, Business, Science and Arts Occupations by Sex
Within the Management, Business, Science and Arts occupations in Greenfield, the most male-oriented occupations are Computers, Engineering & Science (100.0%), Computers & Mathematics (100.0%), and Arts, Media & Entertainment (100.0%), while the most female-oriented occupations are Health Technologists (100.0%), Health Diagnosing & Treating (83.3%), and Education, Arts & Media (80.0%).
| Occupation | Male | Female |
| Management | 52 (59.8%) | 35 (40.2%) |
| Business & Financial | 9 (69.2%) | 4 (30.8%) |
| Computers, Engineering & Science | 13 (100.0%) | 0 (0.0%) |
| Computers & Mathematics | 13 (100.0%) | 0 (0.0%) |
| Architecture & Engineering | 0 (0.0%) | 0 (0.0%) |
| Life, Physical & Social Science | 0 (0.0%) | 0 (0.0%) |
| Community & Social Service | 22 (28.2%) | 56 (71.8%) |
| Education, Arts & Media | 4 (20.0%) | 16 (80.0%) |
| Legal Services & Support | 0 (0.0%) | 0 (0.0%) |
| Education Instruction & Library | 14 (25.9%) | 40 (74.1%) |
| Arts, Media & Entertainment | 4 (100.0%) | 0 (0.0%) |
| Health Diagnosing & Treating | 5 (16.7%) | 25 (83.3%) |
| Health Technologists | 0 (0.0%) | 20 (100.0%) |
| Total (Category) | 101 (45.7%) | 120 (54.3%) |
| Total (Overall) | 425 (50.4%) | 419 (49.6%) |
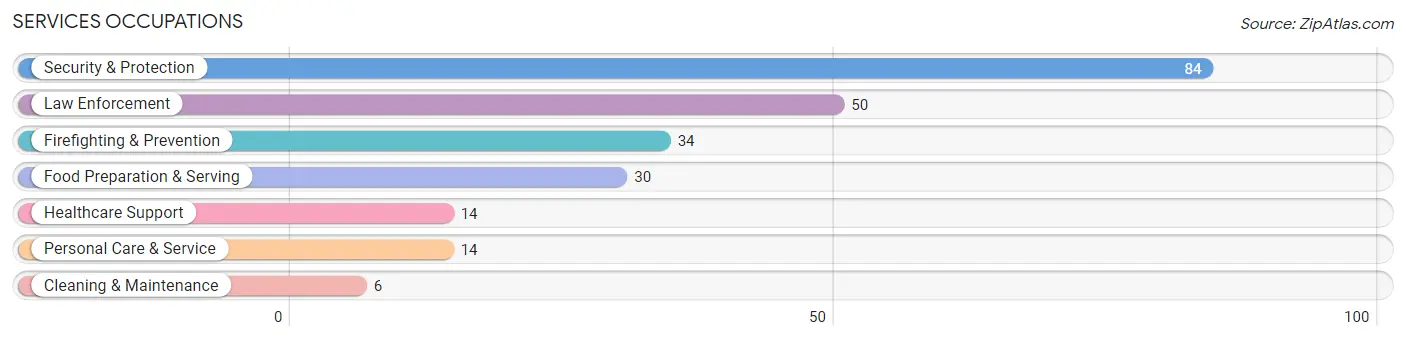
Services Occupations
The most common Services occupations in Greenfield are Security & Protection (84 | 10.0%), Law Enforcement (50 | 5.9%), Firefighting & Prevention (34 | 4.0%), Food Preparation & Serving (30 | 3.5%), and Healthcare Support (14 | 1.7%).
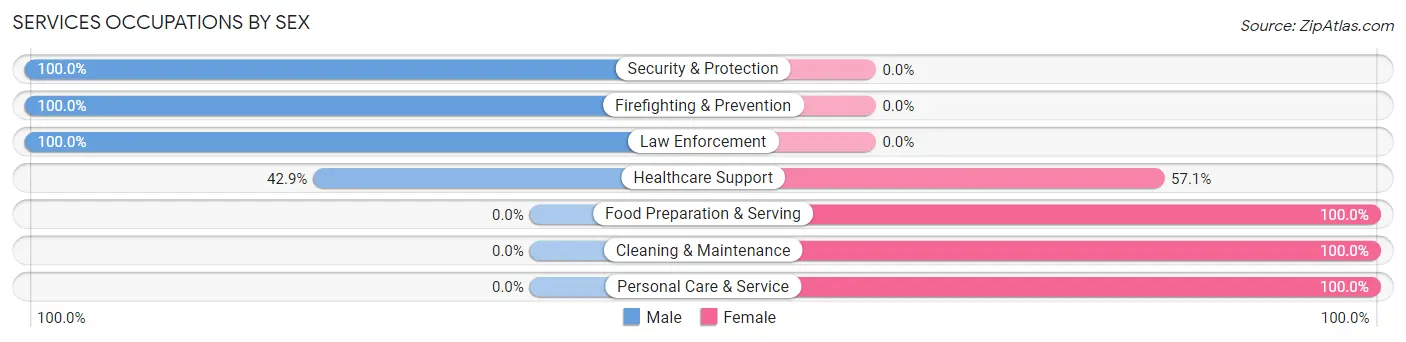
Services Occupations by Sex
Within the Services occupations in Greenfield, the most male-oriented occupations are Security & Protection (100.0%), Firefighting & Prevention (100.0%), and Law Enforcement (100.0%), while the most female-oriented occupations are Food Preparation & Serving (100.0%), Cleaning & Maintenance (100.0%), and Personal Care & Service (100.0%).
| Occupation | Male | Female |
| Healthcare Support | 6 (42.9%) | 8 (57.1%) |
| Security & Protection | 84 (100.0%) | 0 (0.0%) |
| Firefighting & Prevention | 34 (100.0%) | 0 (0.0%) |
| Law Enforcement | 50 (100.0%) | 0 (0.0%) |
| Food Preparation & Serving | 0 (0.0%) | 30 (100.0%) |
| Cleaning & Maintenance | 0 (0.0%) | 6 (100.0%) |
| Personal Care & Service | 0 (0.0%) | 14 (100.0%) |
| Total (Category) | 90 (60.8%) | 58 (39.2%) |
| Total (Overall) | 425 (50.4%) | 419 (49.6%) |
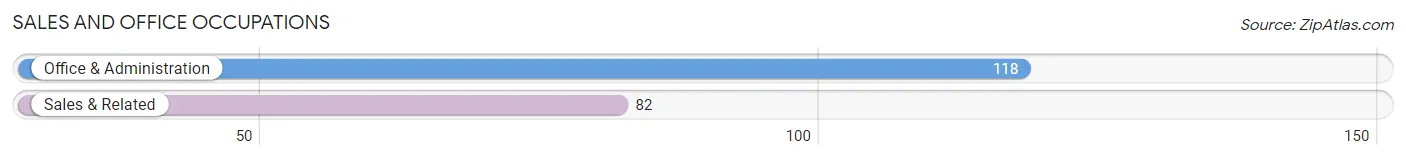
Sales and Office Occupations
The most common Sales and Office occupations in Greenfield are Office & Administration (118 | 14.0%), and Sales & Related (82 | 9.7%).
Sales and Office Occupations by Sex
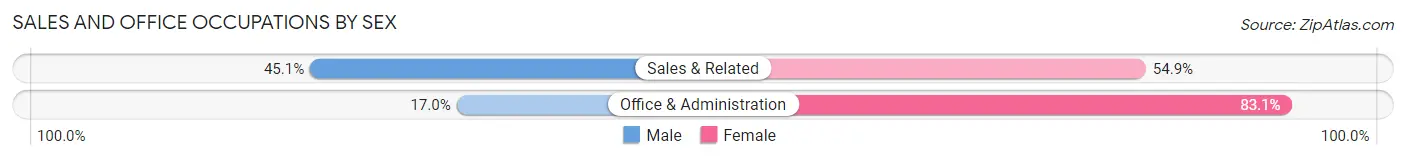
| Occupation | Male | Female |
| Sales & Related | 37 (45.1%) | 45 (54.9%) |
| Office & Administration | 20 (17.0%) | 98 (83.1%) |
| Total (Category) | 57 (28.5%) | 143 (71.5%) |
| Total (Overall) | 425 (50.4%) | 419 (49.6%) |
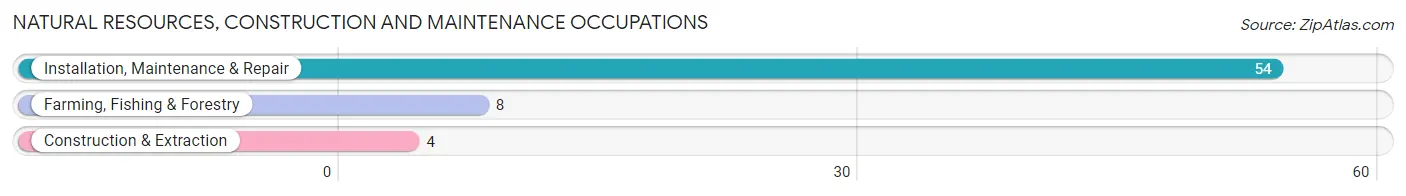
Natural Resources, Construction and Maintenance Occupations
The most common Natural Resources, Construction and Maintenance occupations in Greenfield are Installation, Maintenance & Repair (54 | 6.4%), Farming, Fishing & Forestry (8 | 0.9%), and Construction & Extraction (4 | 0.5%).
Natural Resources, Construction and Maintenance Occupations by Sex
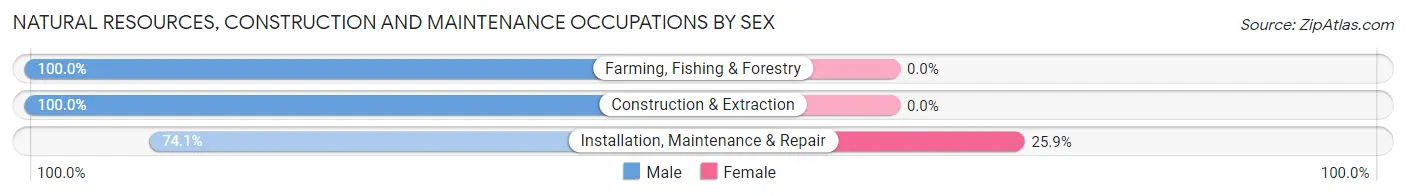
| Occupation | Male | Female |
| Farming, Fishing & Forestry | 8 (100.0%) | 0 (0.0%) |
| Construction & Extraction | 4 (100.0%) | 0 (0.0%) |
| Installation, Maintenance & Repair | 40 (74.1%) | 14 (25.9%) |
| Total (Category) | 52 (78.8%) | 14 (21.2%) |
| Total (Overall) | 425 (50.4%) | 419 (49.6%) |
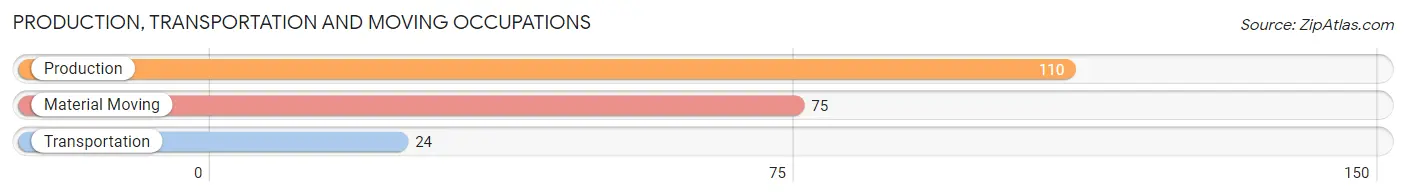
Production, Transportation and Moving Occupations
The most common Production, Transportation and Moving occupations in Greenfield are Production (110 | 13.0%), Material Moving (75 | 8.9%), and Transportation (24 | 2.8%).
Production, Transportation and Moving Occupations by Sex
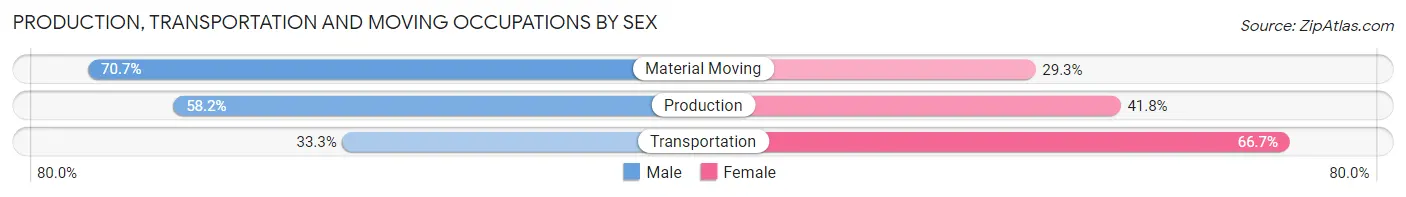
| Occupation | Male | Female |
| Production | 64 (58.2%) | 46 (41.8%) |
| Transportation | 8 (33.3%) | 16 (66.7%) |
| Material Moving | 53 (70.7%) | 22 (29.3%) |
| Total (Category) | 125 (59.8%) | 84 (40.2%) |
| Total (Overall) | 425 (50.4%) | 419 (49.6%) |
Employment Industries by Sex in Greenfield
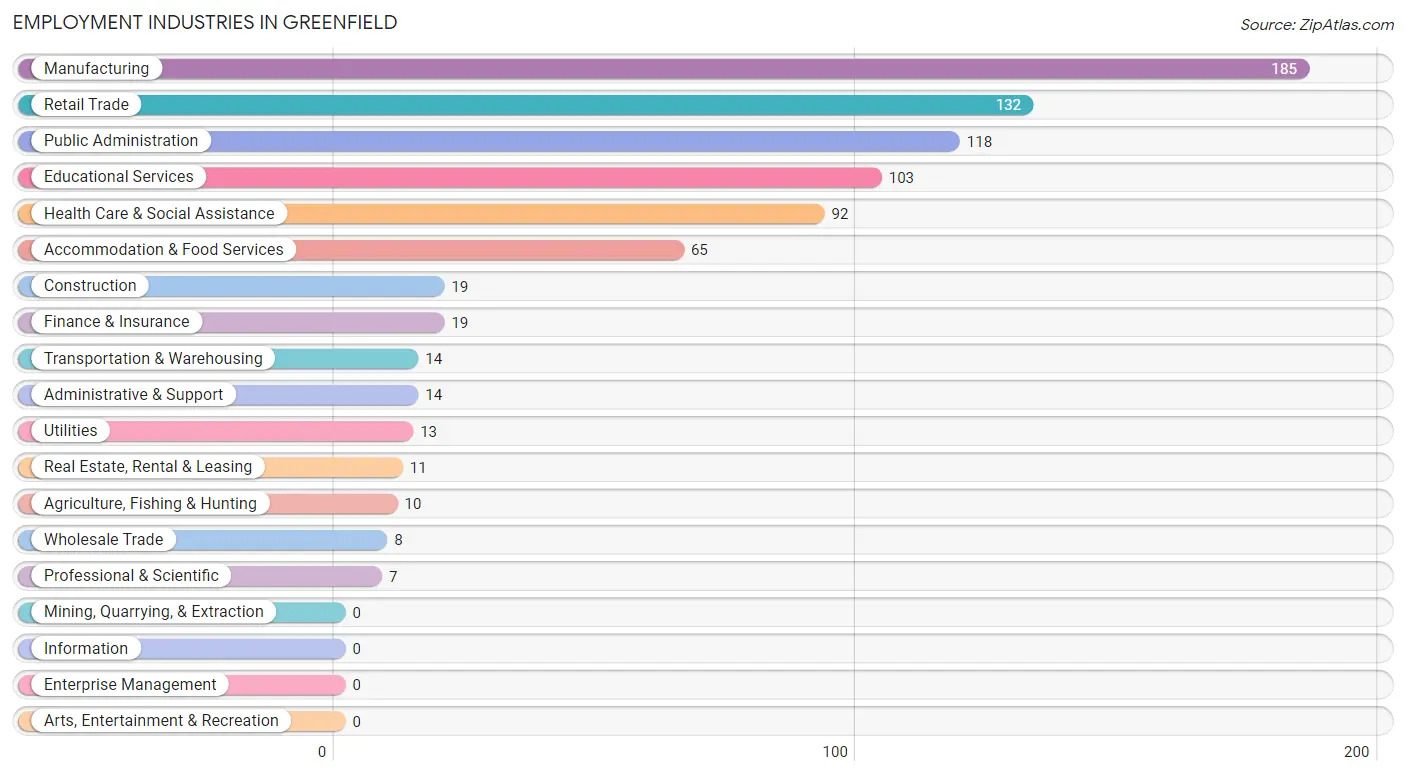
Employment Industries in Greenfield
The major employment industries in Greenfield include Manufacturing (185 | 21.9%), Retail Trade (132 | 15.6%), Public Administration (118 | 14.0%), Educational Services (103 | 12.2%), and Health Care & Social Assistance (92 | 10.9%).
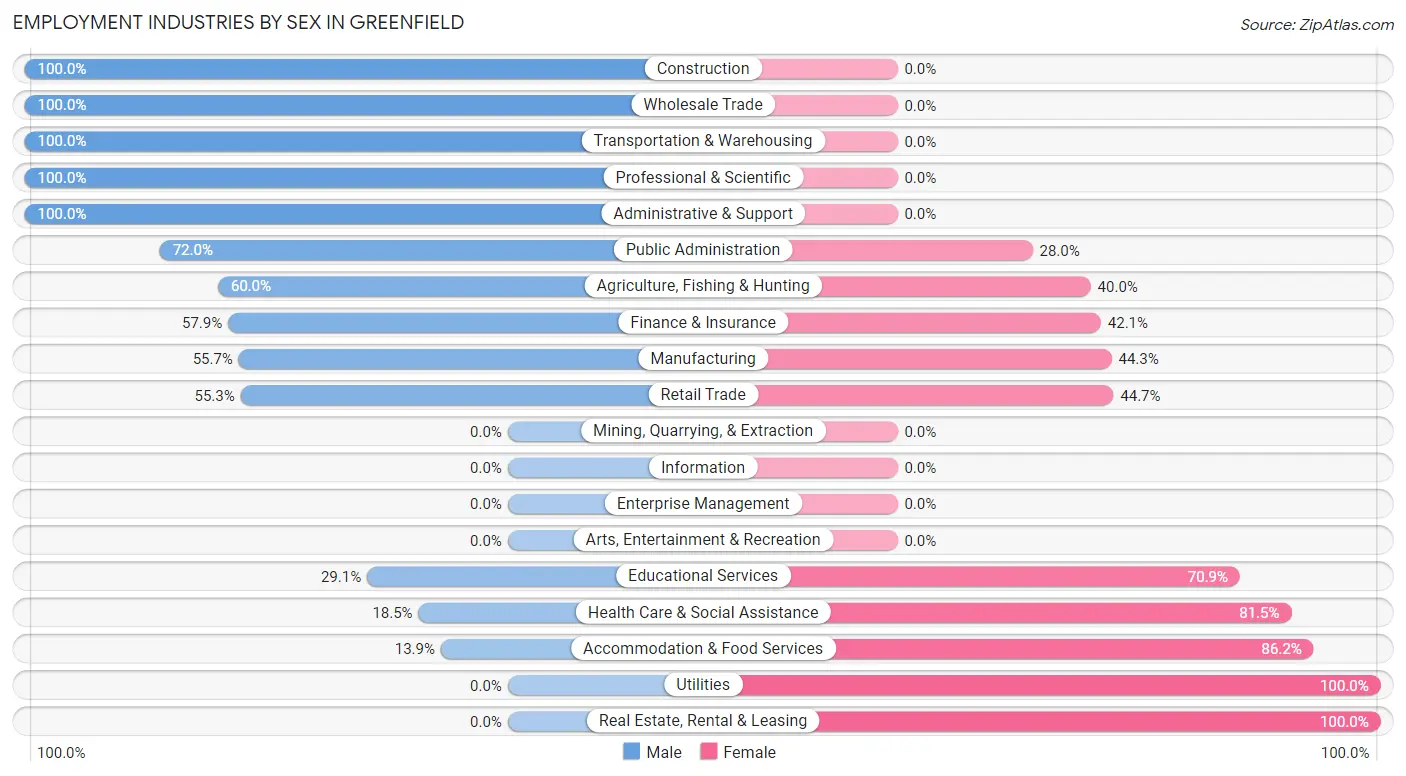
Employment Industries by Sex in Greenfield
The Greenfield industries that see more men than women are Construction (100.0%), Wholesale Trade (100.0%), and Transportation & Warehousing (100.0%), whereas the industries that tend to have a higher number of women are Utilities (100.0%), Real Estate, Rental & Leasing (100.0%), and Accommodation & Food Services (86.2%).
| Industry | Male | Female |
| Agriculture, Fishing & Hunting | 6 (60.0%) | 4 (40.0%) |
| Mining, Quarrying, & Extraction | 0 (0.0%) | 0 (0.0%) |
| Construction | 19 (100.0%) | 0 (0.0%) |
| Manufacturing | 103 (55.7%) | 82 (44.3%) |
| Wholesale Trade | 8 (100.0%) | 0 (0.0%) |
| Retail Trade | 73 (55.3%) | 59 (44.7%) |
| Transportation & Warehousing | 14 (100.0%) | 0 (0.0%) |
| Utilities | 0 (0.0%) | 13 (100.0%) |
| Information | 0 (0.0%) | 0 (0.0%) |
| Finance & Insurance | 11 (57.9%) | 8 (42.1%) |
| Real Estate, Rental & Leasing | 0 (0.0%) | 11 (100.0%) |
| Professional & Scientific | 7 (100.0%) | 0 (0.0%) |
| Enterprise Management | 0 (0.0%) | 0 (0.0%) |
| Administrative & Support | 14 (100.0%) | 0 (0.0%) |
| Educational Services | 30 (29.1%) | 73 (70.9%) |
| Health Care & Social Assistance | 17 (18.5%) | 75 (81.5%) |
| Arts, Entertainment & Recreation | 0 (0.0%) | 0 (0.0%) |
| Accommodation & Food Services | 9 (13.9%) | 56 (86.2%) |
| Public Administration | 85 (72.0%) | 33 (28.0%) |
| Total | 425 (50.4%) | 419 (49.6%) |
Education in Greenfield
School Enrollment in Greenfield
The most common levels of schooling among the 425 students in Greenfield are elementary school (93 | 21.9%), nursery / preschool (75 | 17.6%), and college / undergraduate (75 | 17.6%).
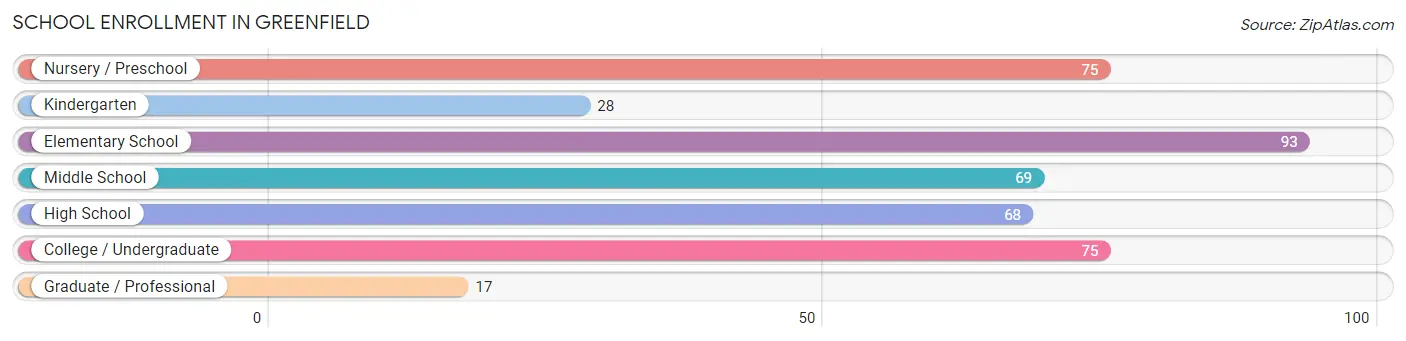
| School Level | # Students | % Students |
| Nursery / Preschool | 75 | 17.6% |
| Kindergarten | 28 | 6.6% |
| Elementary School | 93 | 21.9% |
| Middle School | 69 | 16.2% |
| High School | 68 | 16.0% |
| College / Undergraduate | 75 | 17.6% |
| Graduate / Professional | 17 | 4.0% |
| Total | 425 | 100.0% |
School Enrollment by Age by Funding Source in Greenfield
Out of a total of 425 students who are enrolled in schools in Greenfield, 57 (13.4%) attend a private institution, while the remaining 368 (86.6%) are enrolled in public schools. The age group of 18 to 19 year olds has the highest likelihood of being enrolled in private schools, with 13 (59.1% in the age bracket) enrolled. Conversely, the age group of 5 to 9 year old has the lowest likelihood of being enrolled in a private school, with 126 (100.0% in the age bracket) attending a public institution.
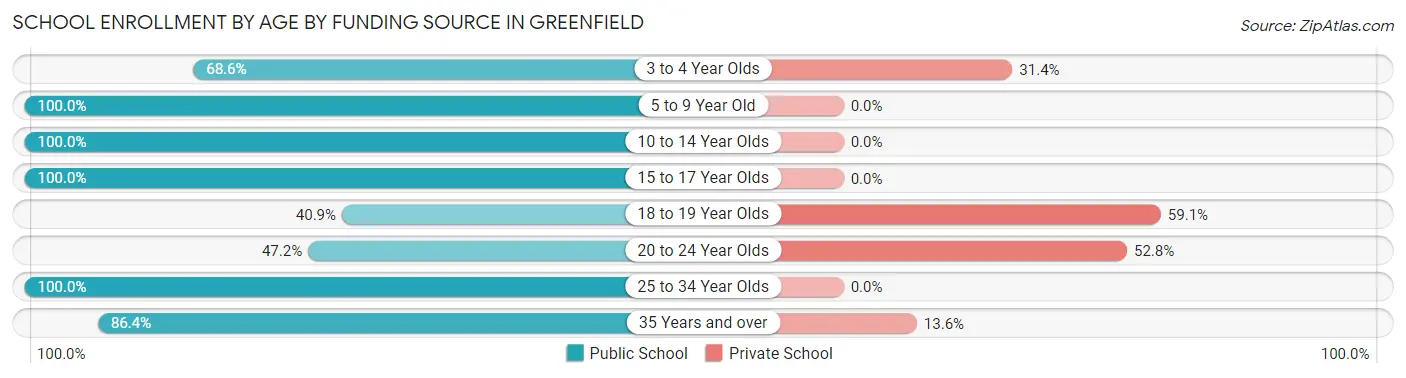
| Age Bracket | Public School | Private School |
| 3 to 4 Year Olds | 48 (68.6%) | 22 (31.4%) |
| 5 to 9 Year Old | 126 (100.0%) | 0 (0.0%) |
| 10 to 14 Year Olds | 69 (100.0%) | 0 (0.0%) |
| 15 to 17 Year Olds | 64 (100.0%) | 0 (0.0%) |
| 18 to 19 Year Olds | 9 (40.9%) | 13 (59.1%) |
| 20 to 24 Year Olds | 17 (47.2%) | 19 (52.8%) |
| 25 to 34 Year Olds | 16 (100.0%) | 0 (0.0%) |
| 35 Years and over | 19 (86.4%) | 3 (13.6%) |
| Total | 368 (86.6%) | 57 (13.4%) |
Educational Attainment by Field of Study in Greenfield
Education (53 | 20.9%), business (52 | 20.5%), arts & humanities (33 | 13.0%), science & technology (28 | 11.1%), and bio, nature & agricultural (27 | 10.7%) are the most common fields of study among 253 individuals in Greenfield who have obtained a bachelor's degree or higher.
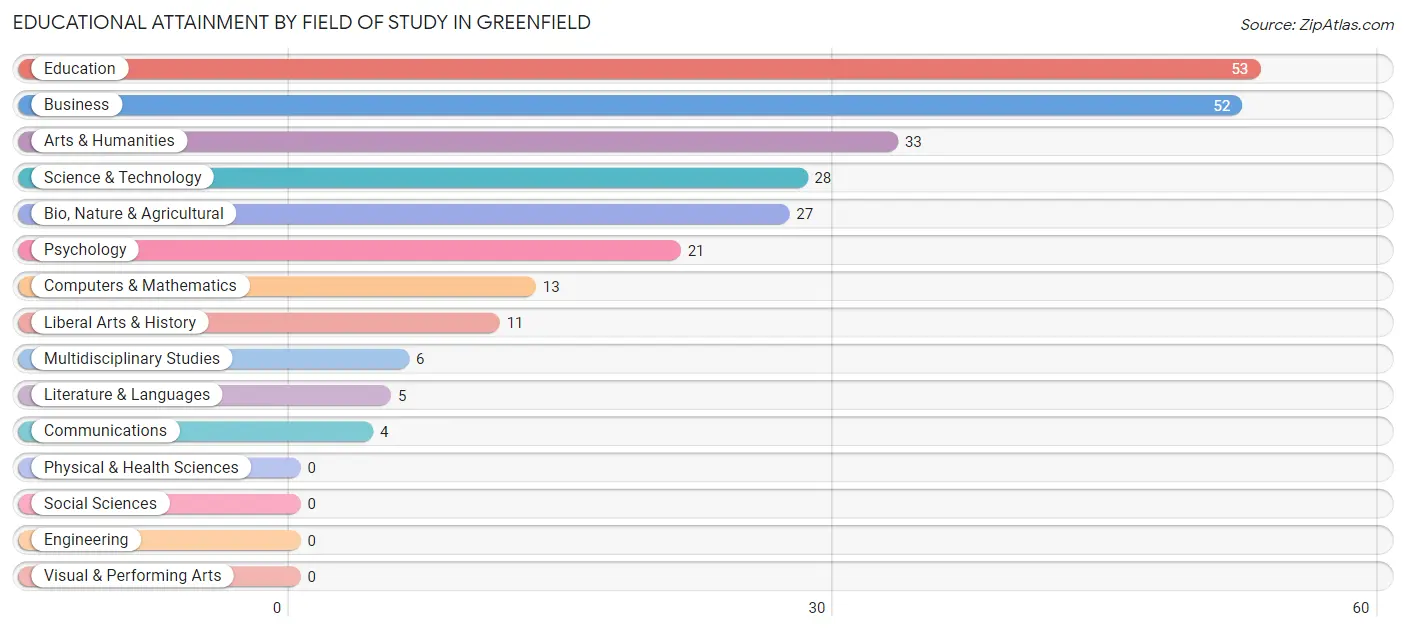
| Field of Study | # Graduates | % Graduates |
| Computers & Mathematics | 13 | 5.1% |
| Bio, Nature & Agricultural | 27 | 10.7% |
| Physical & Health Sciences | 0 | 0.0% |
| Psychology | 21 | 8.3% |
| Social Sciences | 0 | 0.0% |
| Engineering | 0 | 0.0% |
| Multidisciplinary Studies | 6 | 2.4% |
| Science & Technology | 28 | 11.1% |
| Business | 52 | 20.5% |
| Education | 53 | 20.9% |
| Literature & Languages | 5 | 2.0% |
| Liberal Arts & History | 11 | 4.3% |
| Visual & Performing Arts | 0 | 0.0% |
| Communications | 4 | 1.6% |
| Arts & Humanities | 33 | 13.0% |
| Total | 253 | 100.0% |
Transportation & Commute in Greenfield
Vehicle Availability by Sex in Greenfield
The most prevalent vehicle ownership categories in Greenfield are males with 2 vehicles (191, accounting for 44.9%) and females with 2 vehicles (156, making up 46.1%).
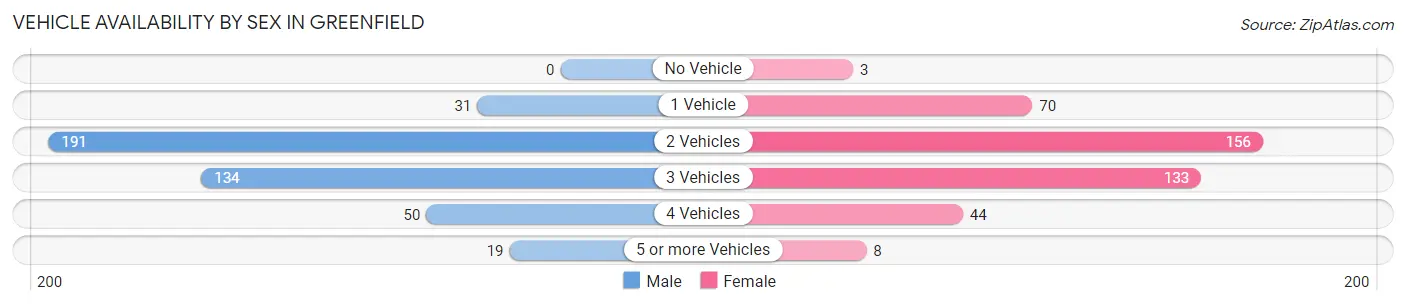
| Vehicles Available | Male | Female |
| No Vehicle | 0 (0.0%) | 3 (0.7%) |
| 1 Vehicle | 31 (7.3%) | 70 (16.9%) |
| 2 Vehicles | 191 (44.9%) | 156 (37.7%) |
| 3 Vehicles | 134 (31.5%) | 133 (32.1%) |
| 4 Vehicles | 50 (11.8%) | 44 (10.6%) |
| 5 or more Vehicles | 19 (4.5%) | 8 (1.9%) |
| Total | 425 (100.0%) | 414 (100.0%) |
Commute Time in Greenfield
The most frequently occuring commute durations in Greenfield are 30 to 34 minutes (133 commuters, 16.4%), 20 to 24 minutes (122 commuters, 15.1%), and 5 to 9 minutes (94 commuters, 11.6%).
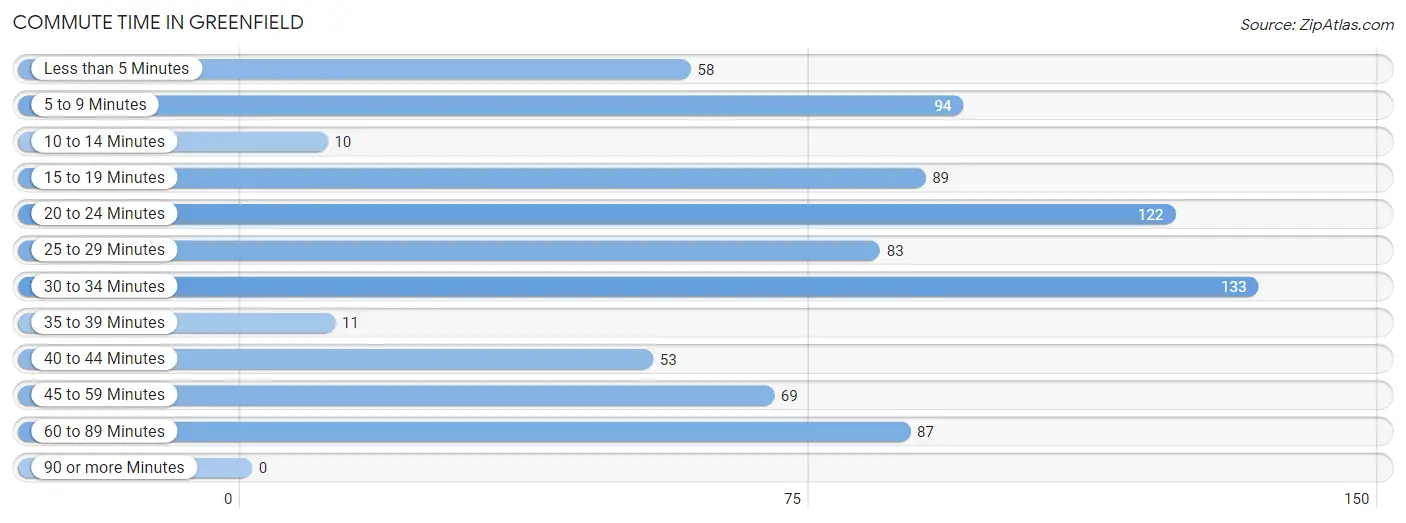
| Commute Time | # Commuters | % Commuters |
| Less than 5 Minutes | 58 | 7.2% |
| 5 to 9 Minutes | 94 | 11.6% |
| 10 to 14 Minutes | 10 | 1.2% |
| 15 to 19 Minutes | 89 | 11.0% |
| 20 to 24 Minutes | 122 | 15.1% |
| 25 to 29 Minutes | 83 | 10.3% |
| 30 to 34 Minutes | 133 | 16.4% |
| 35 to 39 Minutes | 11 | 1.4% |
| 40 to 44 Minutes | 53 | 6.6% |
| 45 to 59 Minutes | 69 | 8.5% |
| 60 to 89 Minutes | 87 | 10.7% |
| 90 or more Minutes | 0 | 0.0% |
Commute Time by Sex in Greenfield
The most common commute times in Greenfield are 30 to 34 minutes (77 commuters, 19.0%) for males and 20 to 24 minutes (80 commuters, 19.9%) for females.
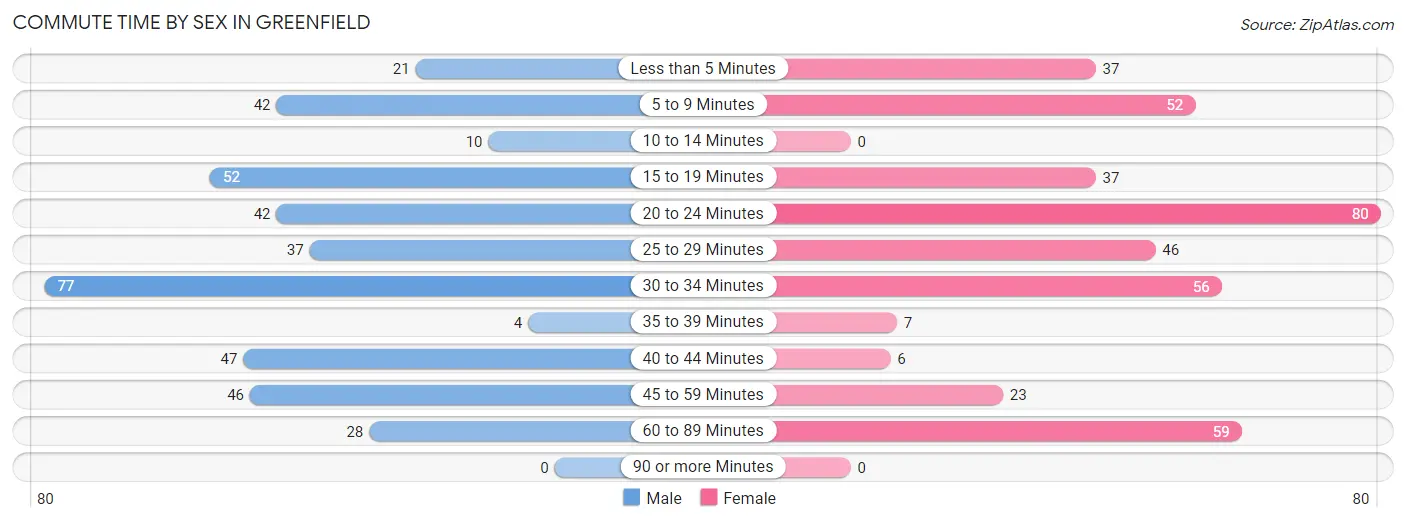
| Commute Time | Male | Female |
| Less than 5 Minutes | 21 (5.2%) | 37 (9.2%) |
| 5 to 9 Minutes | 42 (10.3%) | 52 (12.9%) |
| 10 to 14 Minutes | 10 (2.5%) | 0 (0.0%) |
| 15 to 19 Minutes | 52 (12.8%) | 37 (9.2%) |
| 20 to 24 Minutes | 42 (10.3%) | 80 (19.9%) |
| 25 to 29 Minutes | 37 (9.1%) | 46 (11.4%) |
| 30 to 34 Minutes | 77 (19.0%) | 56 (13.9%) |
| 35 to 39 Minutes | 4 (1.0%) | 7 (1.7%) |
| 40 to 44 Minutes | 47 (11.6%) | 6 (1.5%) |
| 45 to 59 Minutes | 46 (11.3%) | 23 (5.7%) |
| 60 to 89 Minutes | 28 (6.9%) | 59 (14.6%) |
| 90 or more Minutes | 0 (0.0%) | 0 (0.0%) |
Time of Departure to Work by Sex in Greenfield
The most frequent times of departure to work in Greenfield are 6:00 AM to 6:29 AM (91, 22.4%) for males and 7:30 AM to 7:59 AM (118, 29.3%) for females.
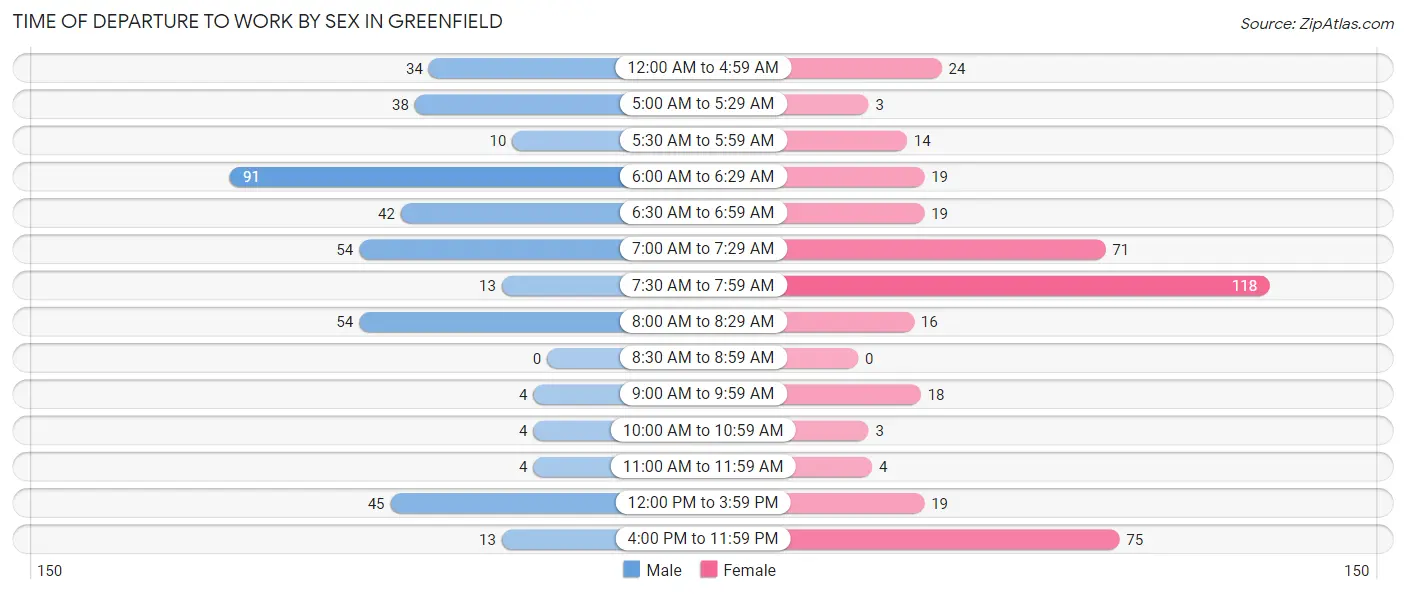
| Time of Departure | Male | Female |
| 12:00 AM to 4:59 AM | 34 (8.4%) | 24 (6.0%) |
| 5:00 AM to 5:29 AM | 38 (9.4%) | 3 (0.7%) |
| 5:30 AM to 5:59 AM | 10 (2.5%) | 14 (3.5%) |
| 6:00 AM to 6:29 AM | 91 (22.4%) | 19 (4.7%) |
| 6:30 AM to 6:59 AM | 42 (10.3%) | 19 (4.7%) |
| 7:00 AM to 7:29 AM | 54 (13.3%) | 71 (17.6%) |
| 7:30 AM to 7:59 AM | 13 (3.2%) | 118 (29.3%) |
| 8:00 AM to 8:29 AM | 54 (13.3%) | 16 (4.0%) |
| 8:30 AM to 8:59 AM | 0 (0.0%) | 0 (0.0%) |
| 9:00 AM to 9:59 AM | 4 (1.0%) | 18 (4.5%) |
| 10:00 AM to 10:59 AM | 4 (1.0%) | 3 (0.7%) |
| 11:00 AM to 11:59 AM | 4 (1.0%) | 4 (1.0%) |
| 12:00 PM to 3:59 PM | 45 (11.1%) | 19 (4.7%) |
| 4:00 PM to 11:59 PM | 13 (3.2%) | 75 (18.6%) |
| Total | 406 (100.0%) | 403 (100.0%) |
Housing Occupancy in Greenfield
Occupancy by Ownership in Greenfield
Of the total 954 dwellings in Greenfield, owner-occupied units account for 714 (74.8%), while renter-occupied units make up 240 (25.2%).
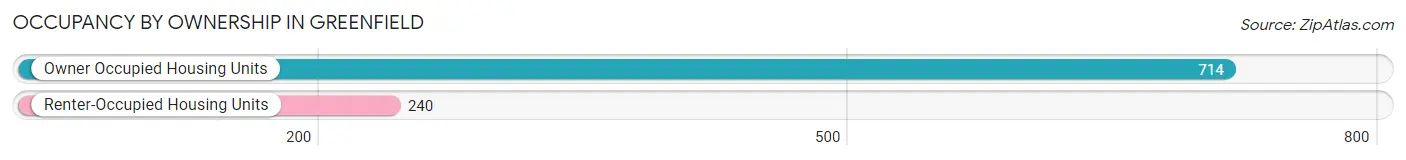
| Occupancy | # Housing Units | % Housing Units |
| Owner Occupied Housing Units | 714 | 74.8% |
| Renter-Occupied Housing Units | 240 | 25.2% |
| Total Occupied Housing Units | 954 | 100.0% |
Occupancy by Household Size in Greenfield
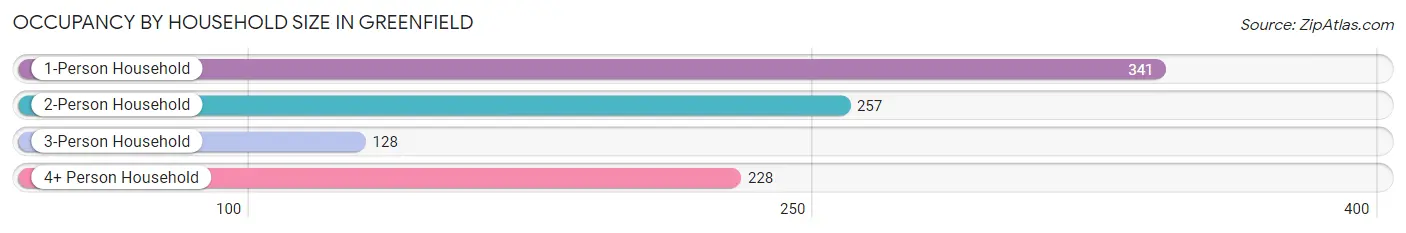
| Household Size | # Housing Units | % Housing Units |
| 1-Person Household | 341 | 35.7% |
| 2-Person Household | 257 | 26.9% |
| 3-Person Household | 128 | 13.4% |
| 4+ Person Household | 228 | 23.9% |
| Total Housing Units | 954 | 100.0% |
Occupancy by Ownership by Household Size in Greenfield
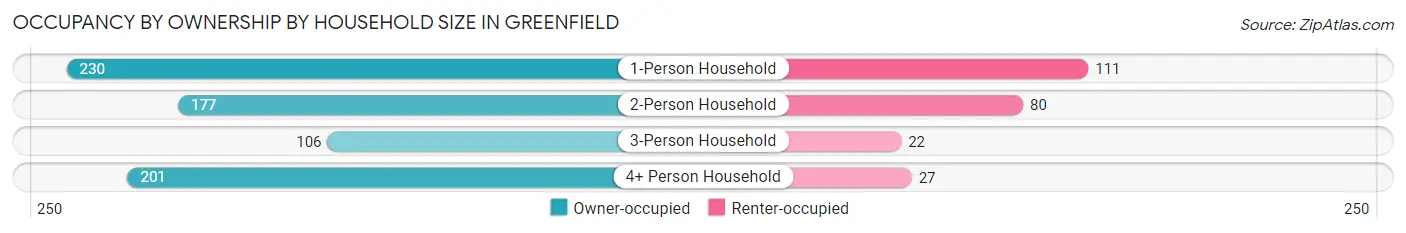
| Household Size | Owner-occupied | Renter-occupied |
| 1-Person Household | 230 (67.4%) | 111 (32.6%) |
| 2-Person Household | 177 (68.9%) | 80 (31.1%) |
| 3-Person Household | 106 (82.8%) | 22 (17.2%) |
| 4+ Person Household | 201 (88.2%) | 27 (11.8%) |
| Total Housing Units | 714 (74.8%) | 240 (25.2%) |
Occupancy by Educational Attainment in Greenfield
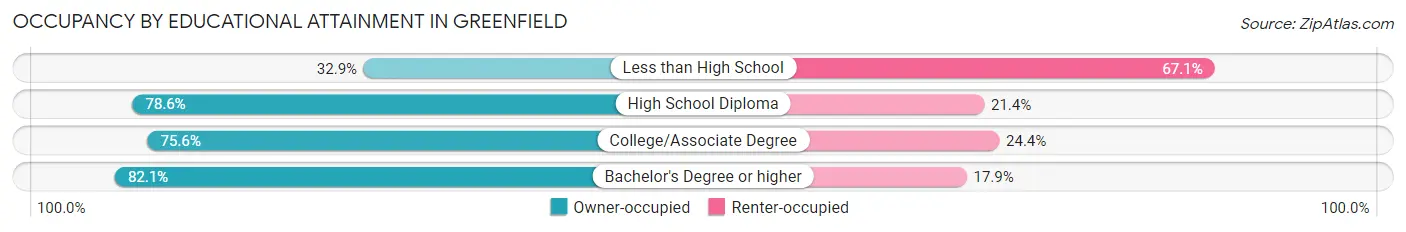
| Household Size | Owner-occupied | Renter-occupied |
| Less than High School | 27 (32.9%) | 55 (67.1%) |
| High School Diploma | 364 (78.6%) | 99 (21.4%) |
| College/Associate Degree | 149 (75.6%) | 48 (24.4%) |
| Bachelor's Degree or higher | 174 (82.1%) | 38 (17.9%) |
Occupancy by Age of Householder in Greenfield
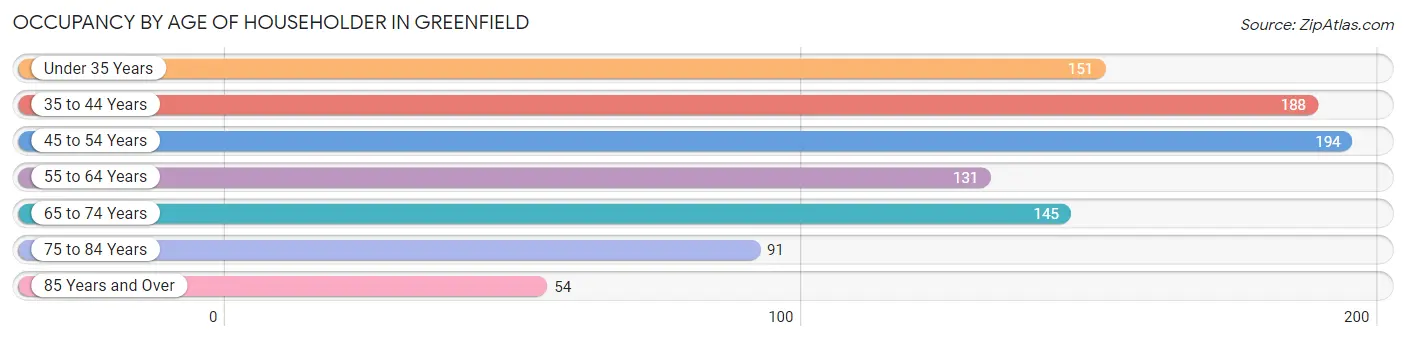
| Age Bracket | # Households | % Households |
| Under 35 Years | 151 | 15.8% |
| 35 to 44 Years | 188 | 19.7% |
| 45 to 54 Years | 194 | 20.3% |
| 55 to 64 Years | 131 | 13.7% |
| 65 to 74 Years | 145 | 15.2% |
| 75 to 84 Years | 91 | 9.5% |
| 85 Years and Over | 54 | 5.7% |
| Total | 954 | 100.0% |
Housing Finances in Greenfield
Median Income by Occupancy in Greenfield
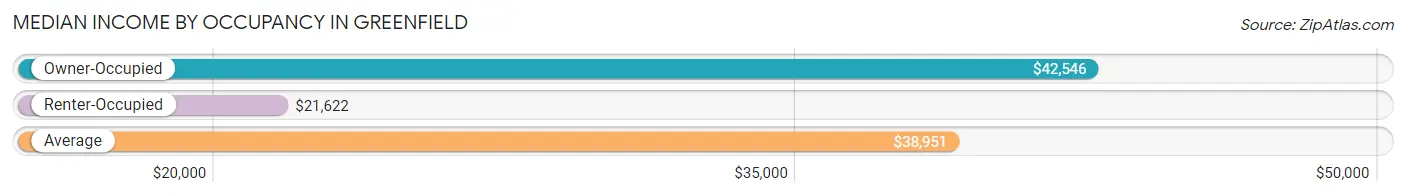
| Occupancy Type | # Households | Median Income |
| Owner-Occupied | 714 (74.8%) | $42,546 |
| Renter-Occupied | 240 (25.2%) | $21,622 |
| Average | 954 (100.0%) | $38,951 |
Occupancy by Householder Income Bracket in Greenfield
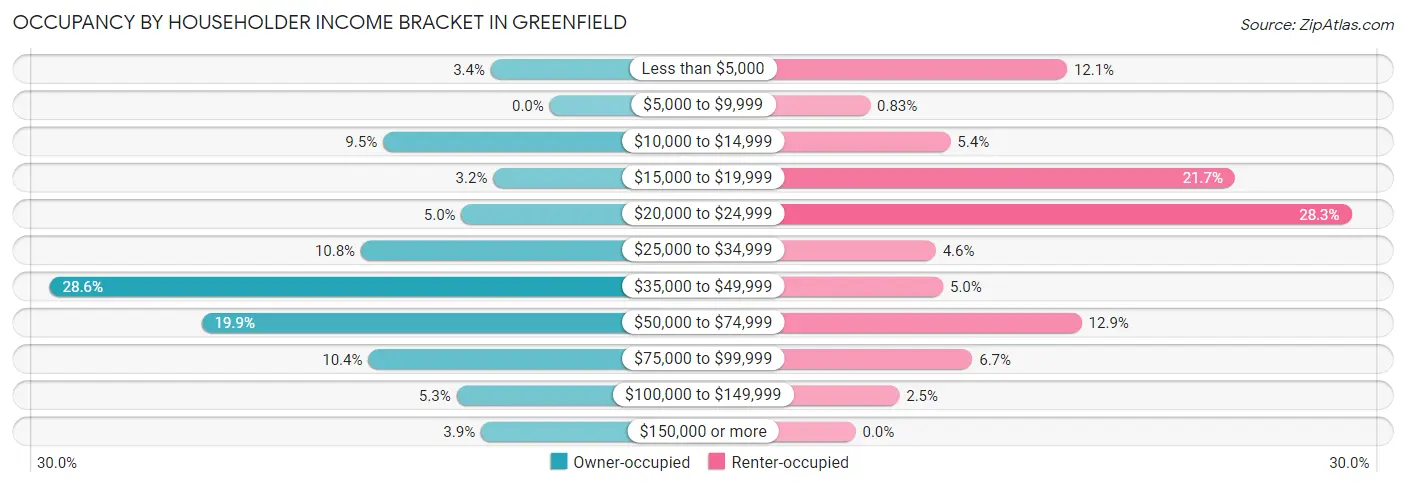
| Income Bracket | Owner-occupied | Renter-occupied |
| Less than $5,000 | 24 (3.4%) | 29 (12.1%) |
| $5,000 to $9,999 | 0 (0.0%) | 2 (0.8%) |
| $10,000 to $14,999 | 68 (9.5%) | 13 (5.4%) |
| $15,000 to $19,999 | 23 (3.2%) | 52 (21.7%) |
| $20,000 to $24,999 | 36 (5.0%) | 68 (28.3%) |
| $25,000 to $34,999 | 77 (10.8%) | 11 (4.6%) |
| $35,000 to $49,999 | 204 (28.6%) | 12 (5.0%) |
| $50,000 to $74,999 | 142 (19.9%) | 31 (12.9%) |
| $75,000 to $99,999 | 74 (10.4%) | 16 (6.7%) |
| $100,000 to $149,999 | 38 (5.3%) | 6 (2.5%) |
| $150,000 or more | 28 (3.9%) | 0 (0.0%) |
| Total | 714 (100.0%) | 240 (100.0%) |
Monthly Housing Cost Tiers in Greenfield
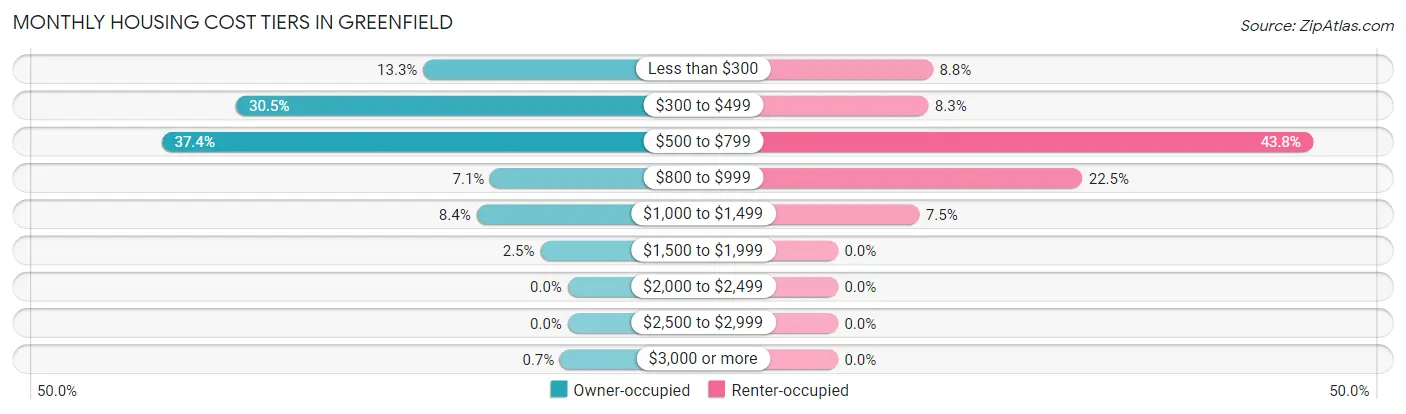
| Monthly Cost | Owner-occupied | Renter-occupied |
| Less than $300 | 95 (13.3%) | 21 (8.7%) |
| $300 to $499 | 218 (30.5%) | 20 (8.3%) |
| $500 to $799 | 267 (37.4%) | 105 (43.8%) |
| $800 to $999 | 51 (7.1%) | 54 (22.5%) |
| $1,000 to $1,499 | 60 (8.4%) | 18 (7.5%) |
| $1,500 to $1,999 | 18 (2.5%) | 0 (0.0%) |
| $2,000 to $2,499 | 0 (0.0%) | 0 (0.0%) |
| $2,500 to $2,999 | 0 (0.0%) | 0 (0.0%) |
| $3,000 or more | 5 (0.7%) | 0 (0.0%) |
| Total | 714 (100.0%) | 240 (100.0%) |
Physical Housing Characteristics in Greenfield
Housing Structures in Greenfield
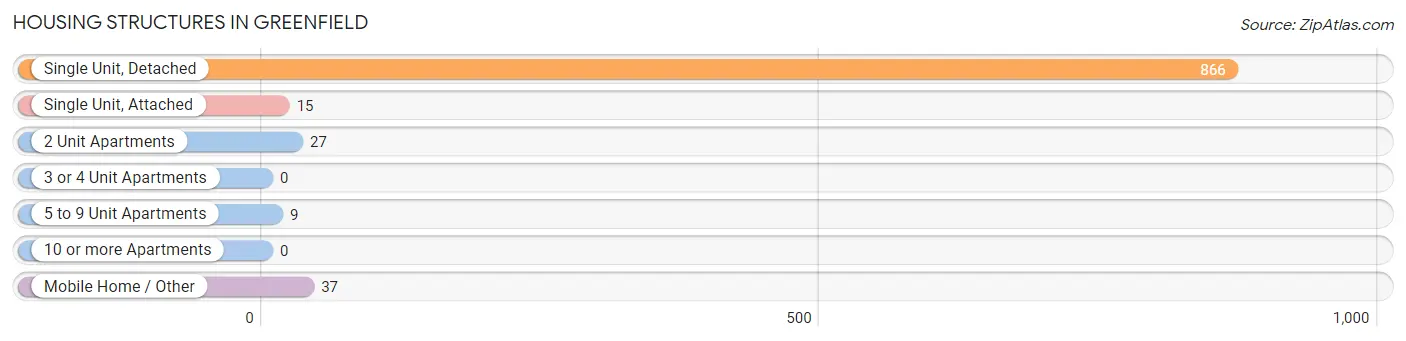
| Structure Type | # Housing Units | % Housing Units |
| Single Unit, Detached | 866 | 90.8% |
| Single Unit, Attached | 15 | 1.6% |
| 2 Unit Apartments | 27 | 2.8% |
| 3 or 4 Unit Apartments | 0 | 0.0% |
| 5 to 9 Unit Apartments | 9 | 0.9% |
| 10 or more Apartments | 0 | 0.0% |
| Mobile Home / Other | 37 | 3.9% |
| Total | 954 | 100.0% |
Housing Structures by Occupancy in Greenfield
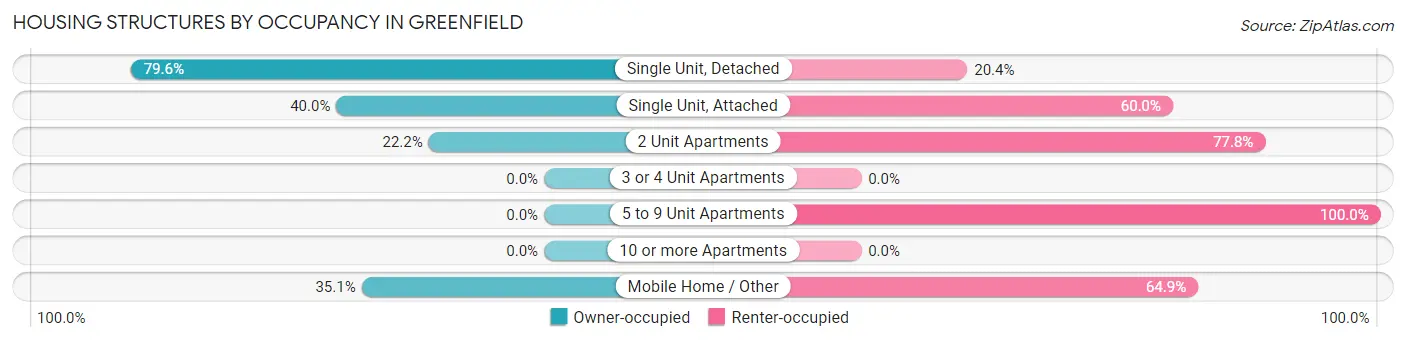
| Structure Type | Owner-occupied | Renter-occupied |
| Single Unit, Detached | 689 (79.6%) | 177 (20.4%) |
| Single Unit, Attached | 6 (40.0%) | 9 (60.0%) |
| 2 Unit Apartments | 6 (22.2%) | 21 (77.8%) |
| 3 or 4 Unit Apartments | 0 (0.0%) | 0 (0.0%) |
| 5 to 9 Unit Apartments | 0 (0.0%) | 9 (100.0%) |
| 10 or more Apartments | 0 (0.0%) | 0 (0.0%) |
| Mobile Home / Other | 13 (35.1%) | 24 (64.9%) |
| Total | 714 (74.8%) | 240 (25.2%) |
Housing Structures by Number of Rooms in Greenfield
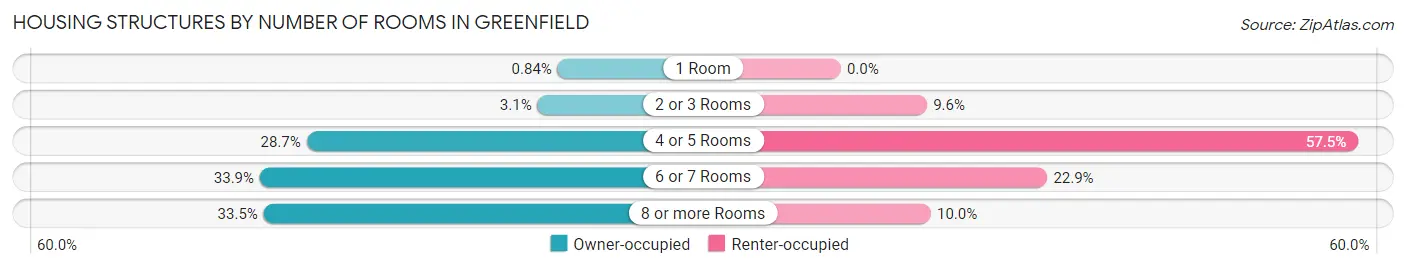
| Number of Rooms | Owner-occupied | Renter-occupied |
| 1 Room | 6 (0.8%) | 0 (0.0%) |
| 2 or 3 Rooms | 22 (3.1%) | 23 (9.6%) |
| 4 or 5 Rooms | 205 (28.7%) | 138 (57.5%) |
| 6 or 7 Rooms | 242 (33.9%) | 55 (22.9%) |
| 8 or more Rooms | 239 (33.5%) | 24 (10.0%) |
| Total | 714 (100.0%) | 240 (100.0%) |
Housing Structure by Heating Type in Greenfield
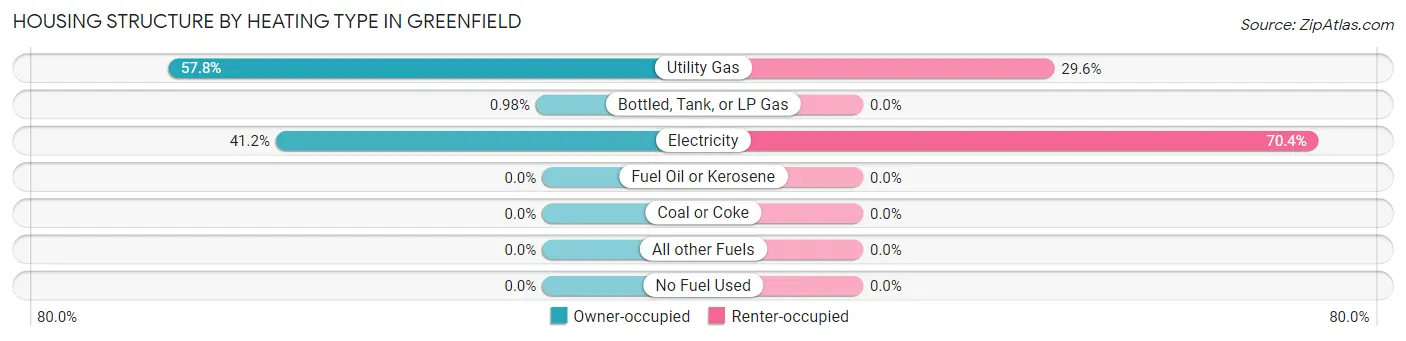
| Heating Type | Owner-occupied | Renter-occupied |
| Utility Gas | 413 (57.8%) | 71 (29.6%) |
| Bottled, Tank, or LP Gas | 7 (1.0%) | 0 (0.0%) |
| Electricity | 294 (41.2%) | 169 (70.4%) |
| Fuel Oil or Kerosene | 0 (0.0%) | 0 (0.0%) |
| Coal or Coke | 0 (0.0%) | 0 (0.0%) |
| All other Fuels | 0 (0.0%) | 0 (0.0%) |
| No Fuel Used | 0 (0.0%) | 0 (0.0%) |
| Total | 714 (100.0%) | 240 (100.0%) |
Household Vehicle Usage in Greenfield
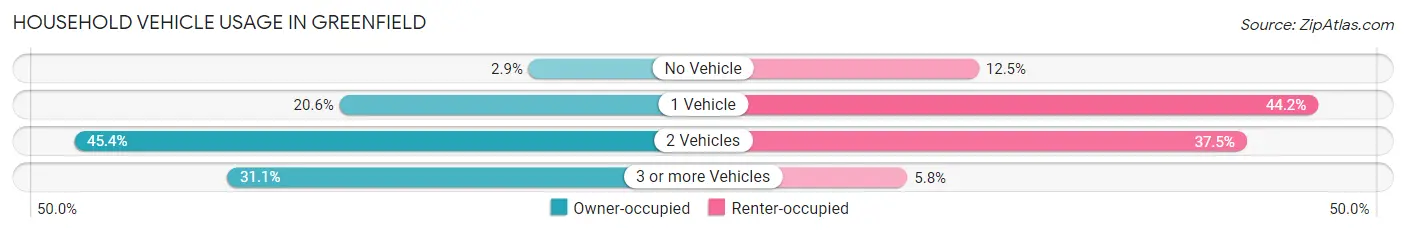
| Vehicles per Household | Owner-occupied | Renter-occupied |
| No Vehicle | 21 (2.9%) | 30 (12.5%) |
| 1 Vehicle | 147 (20.6%) | 106 (44.2%) |
| 2 Vehicles | 324 (45.4%) | 90 (37.5%) |
| 3 or more Vehicles | 222 (31.1%) | 14 (5.8%) |
| Total | 714 (100.0%) | 240 (100.0%) |
Real Estate & Mortgages in Greenfield
Real Estate and Mortgage Overview in Greenfield
| Characteristic | Without Mortgage | With Mortgage |
| Housing Units | 354 | 360 |
| Median Property Value | $86,900 | $76,700 |
| Median Household Income | $41,974 | $9 |
| Monthly Housing Costs | $347 | $0 |
| Real Estate Taxes | $619 | $15 |
Property Value by Mortgage Status in Greenfield
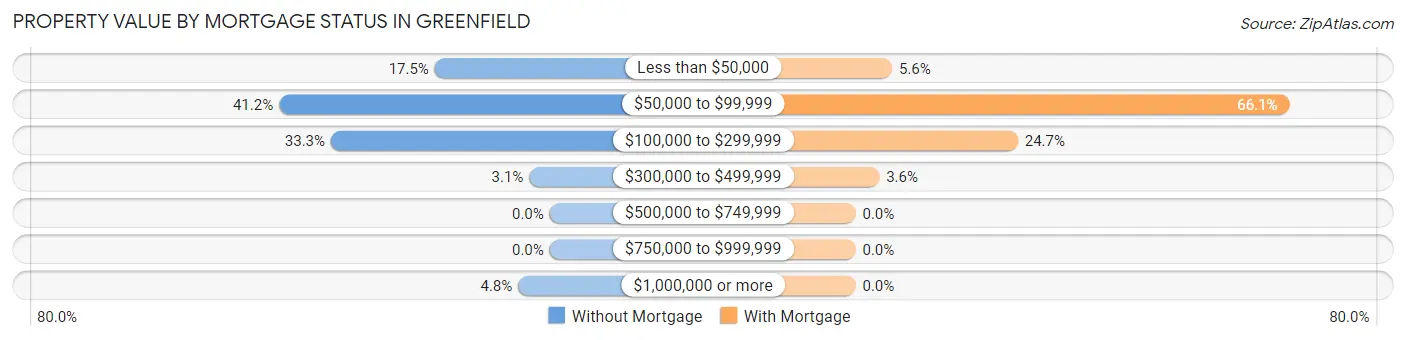
| Property Value | Without Mortgage | With Mortgage |
| Less than $50,000 | 62 (17.5%) | 20 (5.6%) |
| $50,000 to $99,999 | 146 (41.2%) | 238 (66.1%) |
| $100,000 to $299,999 | 118 (33.3%) | 89 (24.7%) |
| $300,000 to $499,999 | 11 (3.1%) | 13 (3.6%) |
| $500,000 to $749,999 | 0 (0.0%) | 0 (0.0%) |
| $750,000 to $999,999 | 0 (0.0%) | 0 (0.0%) |
| $1,000,000 or more | 17 (4.8%) | 0 (0.0%) |
| Total | 354 (100.0%) | 360 (100.0%) |
Household Income by Mortgage Status in Greenfield
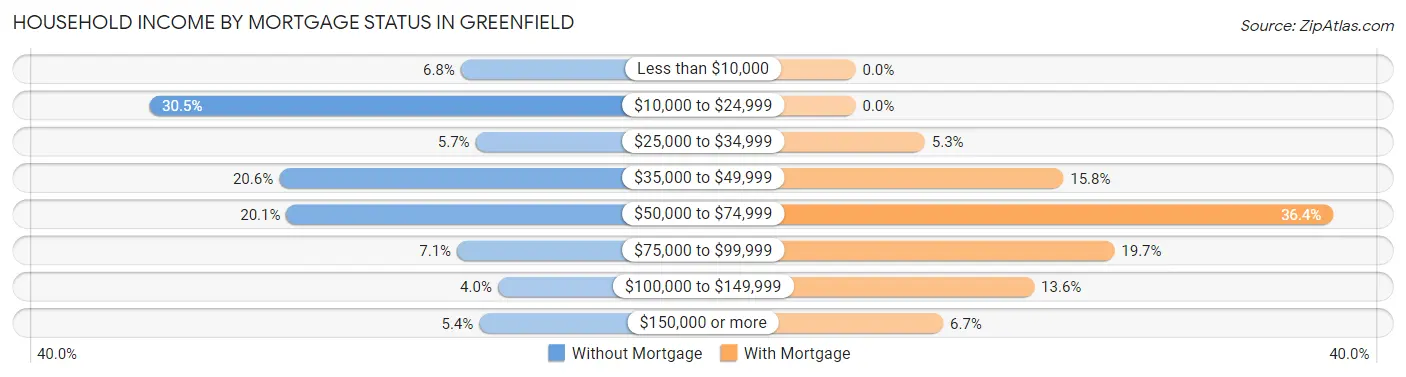
| Household Income | Without Mortgage | With Mortgage |
| Less than $10,000 | 24 (6.8%) | 0 (0.0%) |
| $10,000 to $24,999 | 108 (30.5%) | 0 (0.0%) |
| $25,000 to $34,999 | 20 (5.7%) | 19 (5.3%) |
| $35,000 to $49,999 | 73 (20.6%) | 57 (15.8%) |
| $50,000 to $74,999 | 71 (20.1%) | 131 (36.4%) |
| $75,000 to $99,999 | 25 (7.1%) | 71 (19.7%) |
| $100,000 to $149,999 | 14 (4.0%) | 49 (13.6%) |
| $150,000 or more | 19 (5.4%) | 24 (6.7%) |
| Total | 354 (100.0%) | 360 (100.0%) |
Property Value to Household Income Ratio in Greenfield
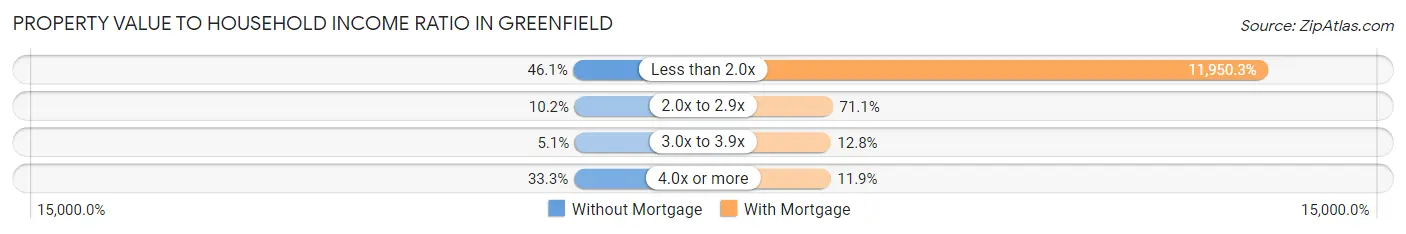
| Value-to-Income Ratio | Without Mortgage | With Mortgage |
| Less than 2.0x | 163 (46.1%) | 43,021 (11,950.3%) |
| 2.0x to 2.9x | 36 (10.2%) | 256 (71.1%) |
| 3.0x to 3.9x | 18 (5.1%) | 46 (12.8%) |
| 4.0x or more | 118 (33.3%) | 43 (11.9%) |
| Total | 354 (100.0%) | 360 (100.0%) |
Real Estate Taxes by Mortgage Status in Greenfield
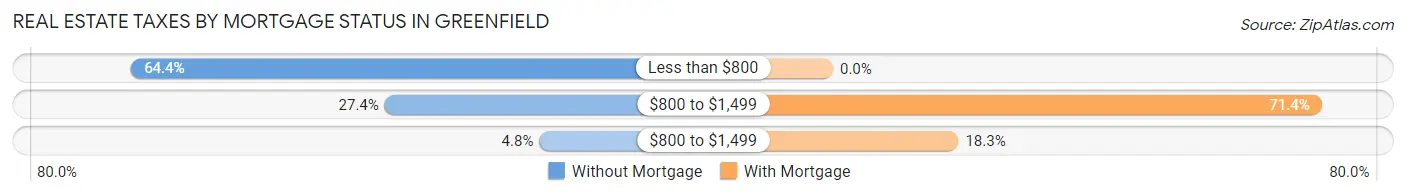
| Property Taxes | Without Mortgage | With Mortgage |
| Less than $800 | 228 (64.4%) | 0 (0.0%) |
| $800 to $1,499 | 97 (27.4%) | 257 (71.4%) |
| $800 to $1,499 | 17 (4.8%) | 66 (18.3%) |
| Total | 354 (100.0%) | 360 (100.0%) |
Health & Disability in Greenfield
Health Insurance Coverage by Age in Greenfield
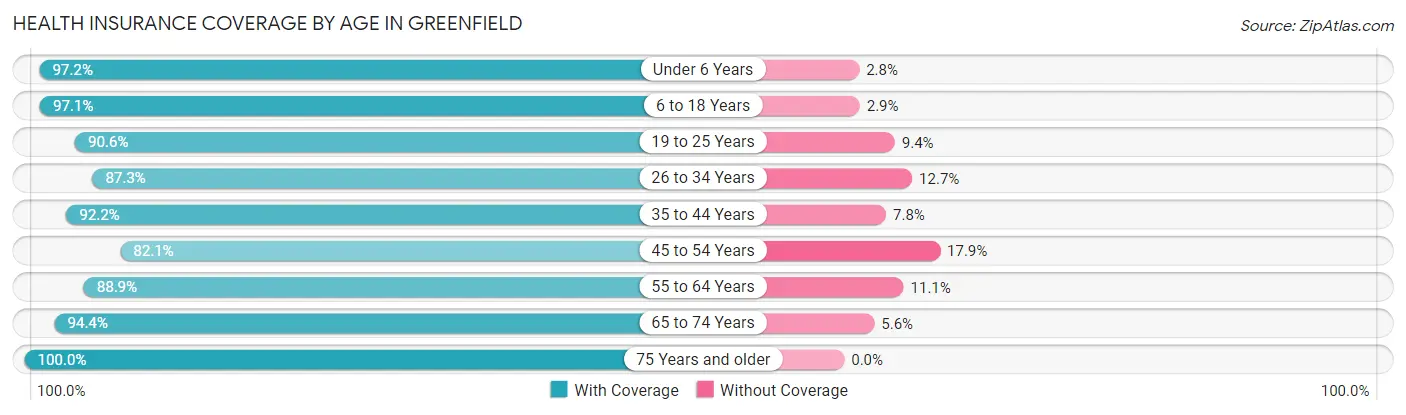
| Age Bracket | With Coverage | Without Coverage |
| Under 6 Years | 175 (97.2%) | 5 (2.8%) |
| 6 to 18 Years | 369 (97.1%) | 11 (2.9%) |
| 19 to 25 Years | 250 (90.6%) | 26 (9.4%) |
| 26 to 34 Years | 200 (87.3%) | 29 (12.7%) |
| 35 to 44 Years | 260 (92.2%) | 22 (7.8%) |
| 45 to 54 Years | 239 (82.1%) | 52 (17.9%) |
| 55 to 64 Years | 177 (88.9%) | 22 (11.1%) |
| 65 to 74 Years | 253 (94.4%) | 15 (5.6%) |
| 75 Years and older | 192 (100.0%) | 0 (0.0%) |
| Total | 2,115 (92.1%) | 182 (7.9%) |
Health Insurance Coverage by Citizenship Status in Greenfield
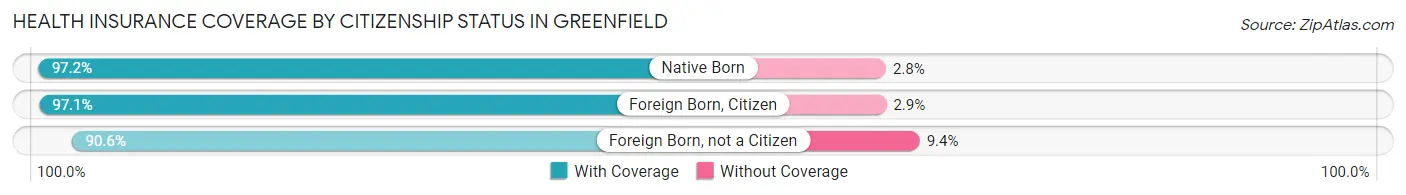
| Citizenship Status | With Coverage | Without Coverage |
| Native Born | 175 (97.2%) | 5 (2.8%) |
| Foreign Born, Citizen | 369 (97.1%) | 11 (2.9%) |
| Foreign Born, not a Citizen | 250 (90.6%) | 26 (9.4%) |
Health Insurance Coverage by Household Income in Greenfield
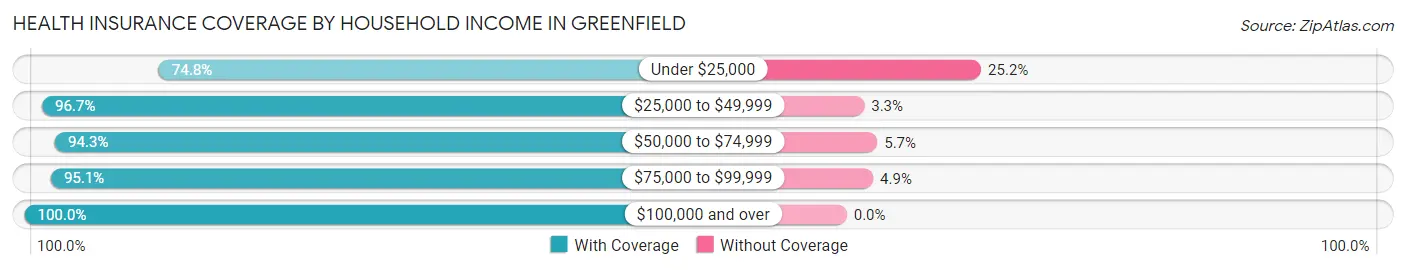
| Household Income | With Coverage | Without Coverage |
| Under $25,000 | 330 (74.8%) | 111 (25.2%) |
| $25,000 to $49,999 | 886 (96.7%) | 30 (3.3%) |
| $50,000 to $74,999 | 479 (94.3%) | 29 (5.7%) |
| $75,000 to $99,999 | 231 (95.1%) | 12 (4.9%) |
| $100,000 and over | 189 (100.0%) | 0 (0.0%) |
Public vs Private Health Insurance Coverage by Age in Greenfield
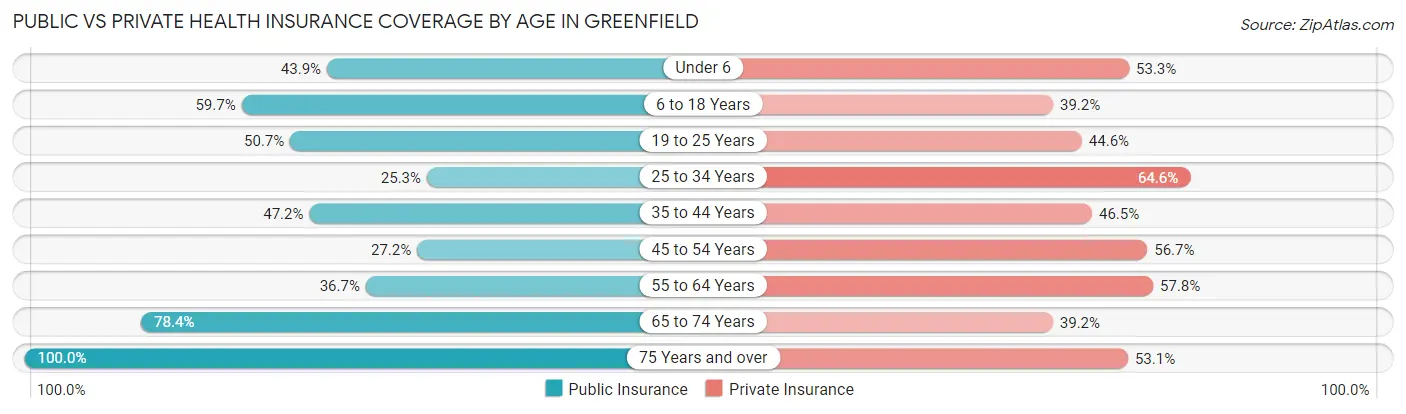
| Age Bracket | Public Insurance | Private Insurance |
| Under 6 | 79 (43.9%) | 96 (53.3%) |
| 6 to 18 Years | 227 (59.7%) | 149 (39.2%) |
| 19 to 25 Years | 140 (50.7%) | 123 (44.6%) |
| 25 to 34 Years | 58 (25.3%) | 148 (64.6%) |
| 35 to 44 Years | 133 (47.2%) | 131 (46.5%) |
| 45 to 54 Years | 79 (27.2%) | 165 (56.7%) |
| 55 to 64 Years | 73 (36.7%) | 115 (57.8%) |
| 65 to 74 Years | 210 (78.4%) | 105 (39.2%) |
| 75 Years and over | 192 (100.0%) | 102 (53.1%) |
| Total | 1,191 (51.8%) | 1,134 (49.4%) |
Disability Status by Sex by Age in Greenfield
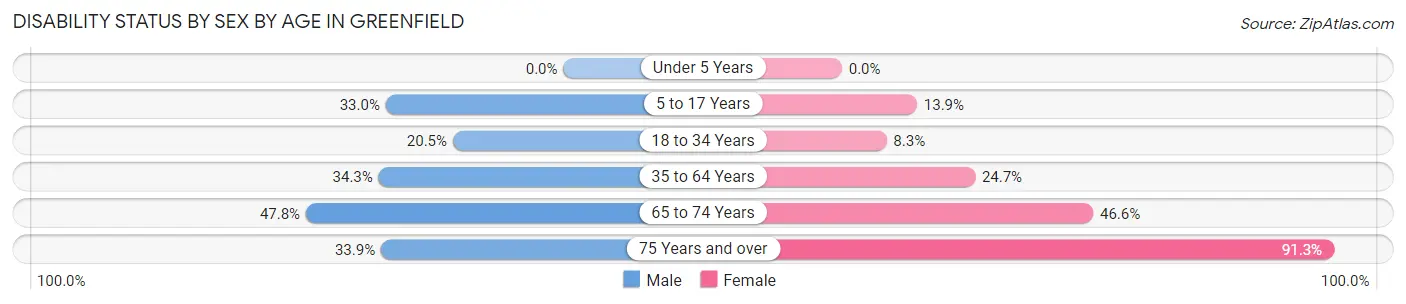
| Age Bracket | Male | Female |
| Under 5 Years | 0 (0.0%) | 0 (0.0%) |
| 5 to 17 Years | 91 (33.0%) | 17 (13.9%) |
| 18 to 34 Years | 40 (20.5%) | 26 (8.3%) |
| 35 to 64 Years | 119 (34.3%) | 105 (24.7%) |
| 65 to 74 Years | 43 (47.8%) | 83 (46.6%) |
| 75 Years and over | 22 (33.9%) | 116 (91.3%) |
Disability Class by Sex by Age in Greenfield
Disability Class: Hearing Difficulty
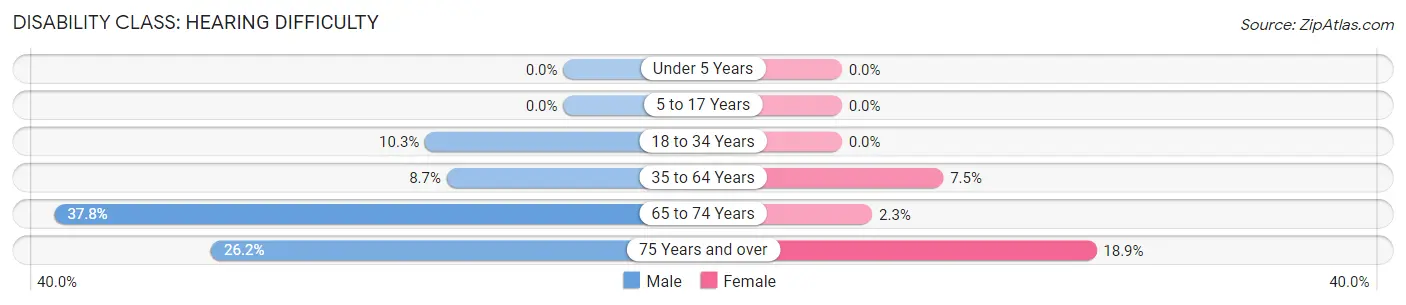
| Age Bracket | Male | Female |
| Under 5 Years | 0 (0.0%) | 0 (0.0%) |
| 5 to 17 Years | 0 (0.0%) | 0 (0.0%) |
| 18 to 34 Years | 20 (10.3%) | 0 (0.0%) |
| 35 to 64 Years | 30 (8.6%) | 32 (7.5%) |
| 65 to 74 Years | 34 (37.8%) | 4 (2.2%) |
| 75 Years and over | 17 (26.2%) | 24 (18.9%) |
Disability Class: Vision Difficulty
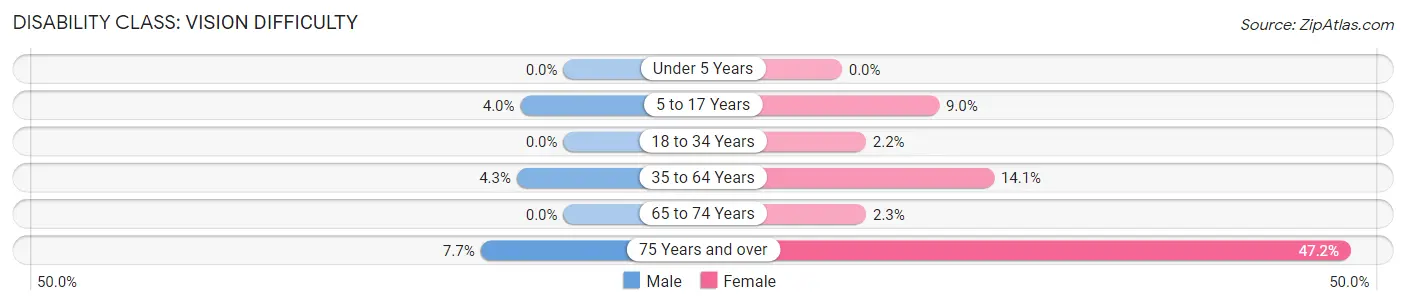
| Age Bracket | Male | Female |
| Under 5 Years | 0 (0.0%) | 0 (0.0%) |
| 5 to 17 Years | 11 (4.0%) | 11 (9.0%) |
| 18 to 34 Years | 0 (0.0%) | 7 (2.2%) |
| 35 to 64 Years | 15 (4.3%) | 60 (14.1%) |
| 65 to 74 Years | 0 (0.0%) | 4 (2.2%) |
| 75 Years and over | 5 (7.7%) | 60 (47.2%) |
Disability Class: Cognitive Difficulty
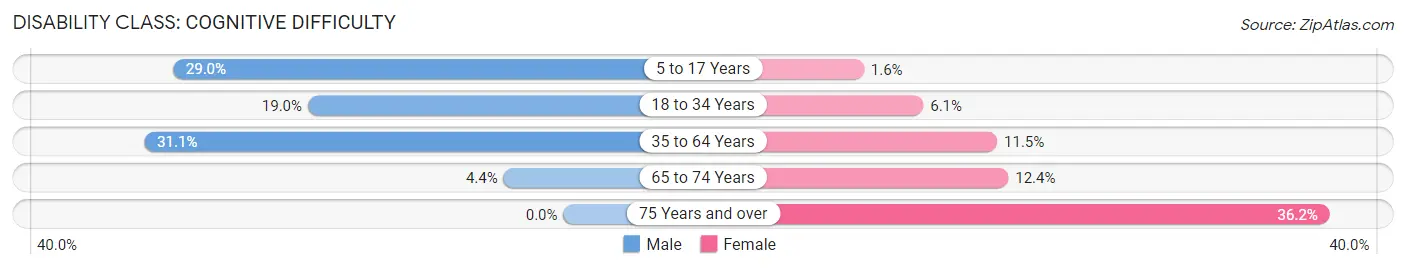
| Age Bracket | Male | Female |
| 5 to 17 Years | 80 (29.0%) | 2 (1.6%) |
| 18 to 34 Years | 37 (19.0%) | 19 (6.0%) |
| 35 to 64 Years | 108 (31.1%) | 49 (11.5%) |
| 65 to 74 Years | 4 (4.4%) | 22 (12.4%) |
| 75 Years and over | 0 (0.0%) | 46 (36.2%) |
Disability Class: Ambulatory Difficulty
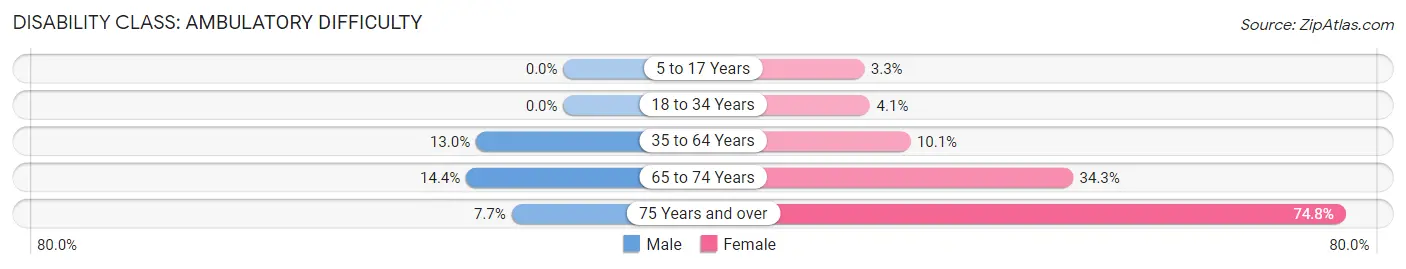
| Age Bracket | Male | Female |
| 5 to 17 Years | 0 (0.0%) | 4 (3.3%) |
| 18 to 34 Years | 0 (0.0%) | 13 (4.1%) |
| 35 to 64 Years | 45 (13.0%) | 43 (10.1%) |
| 65 to 74 Years | 13 (14.4%) | 61 (34.3%) |
| 75 Years and over | 5 (7.7%) | 95 (74.8%) |
Disability Class: Self-Care Difficulty
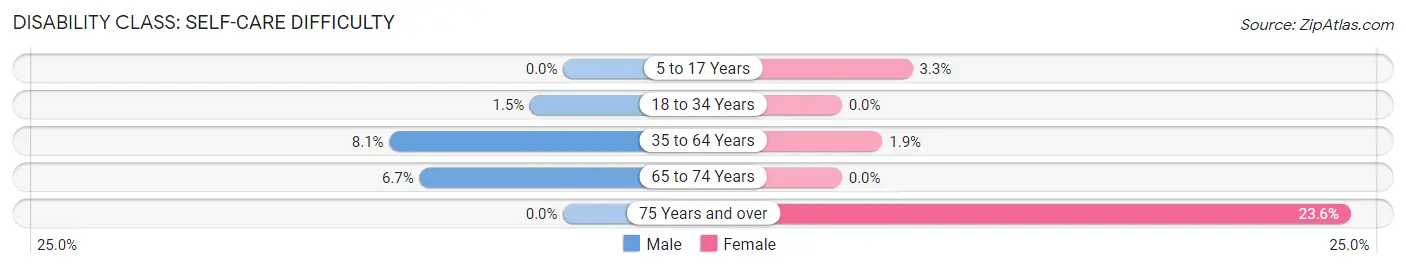
| Age Bracket | Male | Female |
| 5 to 17 Years | 0 (0.0%) | 4 (3.3%) |
| 18 to 34 Years | 3 (1.5%) | 0 (0.0%) |
| 35 to 64 Years | 28 (8.1%) | 8 (1.9%) |
| 65 to 74 Years | 6 (6.7%) | 0 (0.0%) |
| 75 Years and over | 0 (0.0%) | 30 (23.6%) |
Technology Access in Greenfield
Computing Device Access in Greenfield
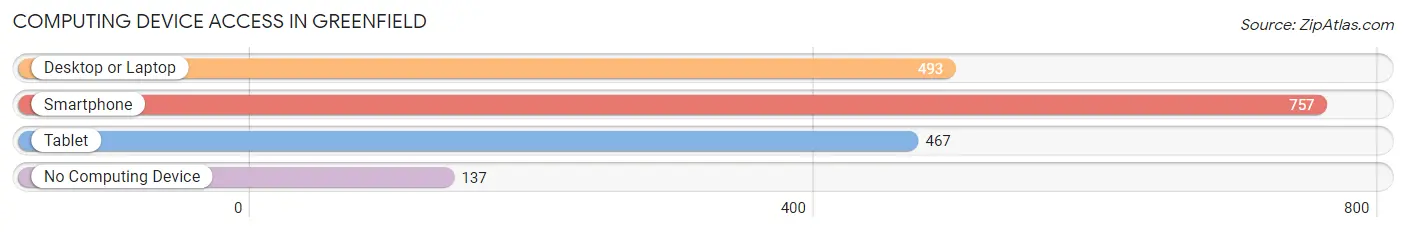
| Device Type | # Households | % Households |
| Desktop or Laptop | 493 | 51.7% |
| Smartphone | 757 | 79.3% |
| Tablet | 467 | 48.9% |
| No Computing Device | 137 | 14.4% |
| Total | 954 | 100.0% |
Internet Access in Greenfield
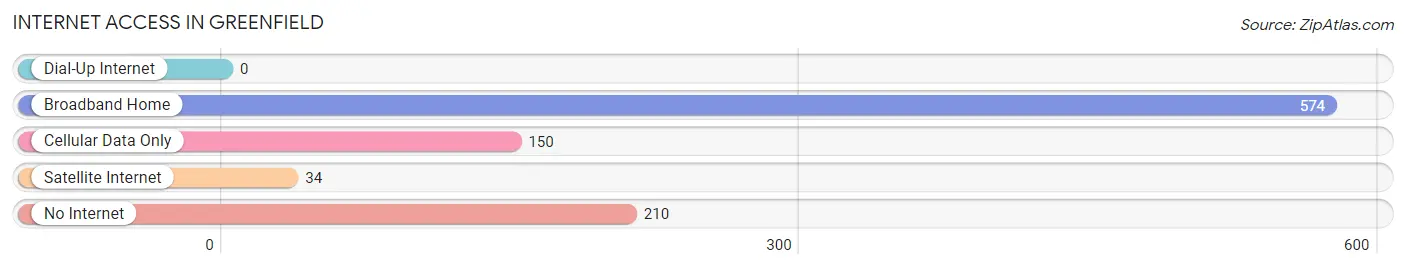
| Internet Type | # Households | % Households |
| Dial-Up Internet | 0 | 0.0% |
| Broadband Home | 574 | 60.2% |
| Cellular Data Only | 150 | 15.7% |
| Satellite Internet | 34 | 3.6% |
| No Internet | 210 | 22.0% |
| Total | 954 | 100.0% |
Greenfield Summary
Greenfield, Tennessee is a small town located in Weakley County in the northwest corner of the state. It is situated on the banks of the Obion River, and is home to a population of approximately 1,500 people. The town was founded in 1820 and has a rich history of agriculture, industry, and commerce.
Geography
Greenfield is located in the northwest corner of Weakley County, Tennessee, and is situated on the banks of the Obion River. The town is located approximately 20 miles east of the Mississippi River and is bordered by the towns of Martin, Dresden, and Sharon. The town is situated on a flat plain, with the Obion River providing a natural boundary to the east. The town is surrounded by rolling hills and farmland, and is home to a variety of wildlife.
Economy
Greenfield’s economy is largely based on agriculture and industry. The town is home to a variety of farms, including cattle, poultry, and hog farms. The town is also home to a number of manufacturing plants, including a paper mill, a furniture factory, and a plastics plant. In addition, the town is home to a variety of small businesses, including restaurants, retail stores, and service providers.
Demographics
As of the 2010 census, Greenfield had a population of 1,500 people. The town is predominantly white, with approximately 90% of the population identifying as Caucasian. The town is also home to a small African American population, as well as a small Hispanic population. The median household income in Greenfield is approximately $35,000, and the median home value is approximately $90,000.
History
Greenfield was founded in 1820 by a group of settlers from North Carolina. The town was originally known as “Greenfield Station”, and was a stop on the stagecoach line between Nashville and Memphis. The town was officially incorporated in 1837, and was named after the green fields that surrounded the town.
In the late 19th century, Greenfield was a thriving agricultural center, with a variety of crops being grown in the area. The town was also home to a number of manufacturing plants, including a paper mill, a furniture factory, and a plastics plant. In the early 20th century, the town was home to a variety of businesses, including restaurants, retail stores, and service providers.
Today, Greenfield is a small town with a rich history and a vibrant economy. The town is home to a variety of farms, manufacturing plants, and small businesses, and is a popular destination for tourists and outdoor enthusiasts. The town is also home to a variety of cultural and recreational activities, including festivals, concerts, and sporting events.
Common Questions
What is Per Capita Income in Greenfield?
Per Capita income in Greenfield is $21,021.
What is the Median Family Income in Greenfield?
Median Family Income in Greenfield is $47,188.
What is the Median Household income in Greenfield?
Median Household Income in Greenfield is $38,951.
What is Income or Wage Gap in Greenfield?
Income or Wage Gap in Greenfield is 30.0%.
Women in Greenfield earn 70.0 cents for every dollar earned by a man.
What is Inequality or Gini Index in Greenfield?
Inequality or Gini Index in Greenfield is 0.47.
What is the Total Population of Greenfield?
Total Population of Greenfield is 2,297.
What is the Total Male Population of Greenfield?
Total Male Population of Greenfield is 1,079.
What is the Total Female Population of Greenfield?
Total Female Population of Greenfield is 1,218.
What is the Ratio of Males per 100 Females in Greenfield?
There are 88.59 Males per 100 Females in Greenfield.
What is the Ratio of Females per 100 Males in Greenfield?
There are 112.88 Females per 100 Males in Greenfield.
What is the Median Population Age in Greenfield?
Median Population Age in Greenfield is 41.2 Years.
What is the Average Family Size in Greenfield
Average Family Size in Greenfield is 3.0 People.
What is the Average Household Size in Greenfield
Average Household Size in Greenfield is 2.4 People.
How Large is the Labor Force in Greenfield?
There are 899 People in the Labor Forcein in Greenfield.
What is the Percentage of People in the Labor Force in Greenfield?
50.2% of People are in the Labor Force in Greenfield.
What is the Unemployment Rate in Greenfield?
Unemployment Rate in Greenfield is 6.0%.