Mount Carmel, TN Map & Demographics
Mount Carmel Map
Mount Carmel Overview
$36,460
PER CAPITA INCOME
$70,409
AVG FAMILY INCOME
$64,971
AVG HOUSEHOLD INCOME
39.6%
WAGE / INCOME GAP [ % ]
60.4¢/ $1
WAGE / INCOME GAP [ $ ]
0.48
INEQUALITY / GINI INDEX
5,486
TOTAL POPULATION
2,714
MALE POPULATION
2,772
FEMALE POPULATION
97.91
MALES / 100 FEMALES
102.14
FEMALES / 100 MALES
42.2
MEDIAN AGE
3.2
AVG FAMILY SIZE
2.6
AVG HOUSEHOLD SIZE
2,482
LABOR FORCE [ PEOPLE ]
54.3%
PERCENT IN LABOR FORCE
5.8%
UNEMPLOYMENT RATE
Mount Carmel Zip Codes
Mount Carmel Area Codes
Income in Mount Carmel
Income Overview in Mount Carmel
Per Capita Income in Mount Carmel is $36,460, while median incomes of families and households are $70,409 and $64,971 respectively.
| Characteristic | Number | Measure |
| Per Capita Income | 5,486 | $36,460 |
| Median Family Income | 1,491 | $70,409 |
| Mean Family Income | 1,491 | $91,468 |
| Median Household Income | 2,119 | $64,971 |
| Mean Household Income | 2,119 | $90,141 |
| Income Deficit | 1,491 | $0 |
| Wage / Income Gap (%) | 5,486 | 39.62% |
| Wage / Income Gap ($) | 5,486 | 60.38¢ per $1 |
| Gini / Inequality Index | 5,486 | 0.48 |
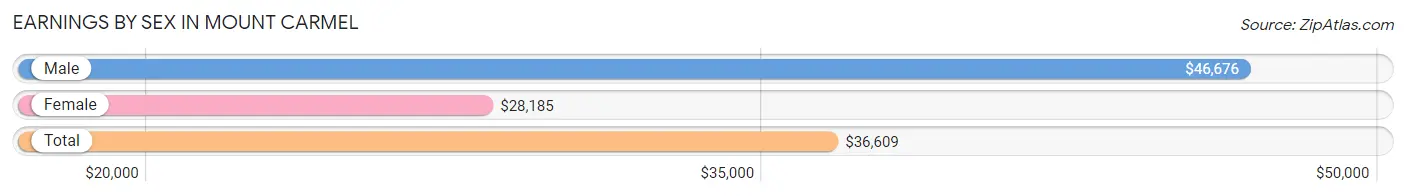
Earnings by Sex in Mount Carmel
Average Earnings in Mount Carmel are $36,609, $46,676 for men and $28,185 for women, a difference of 39.6%.
| Sex | Number | Average Earnings |
| Male | 1,568 (60.4%) | $46,676 |
| Female | 1,030 (39.7%) | $28,185 |
| Total | 2,598 (100.0%) | $36,609 |
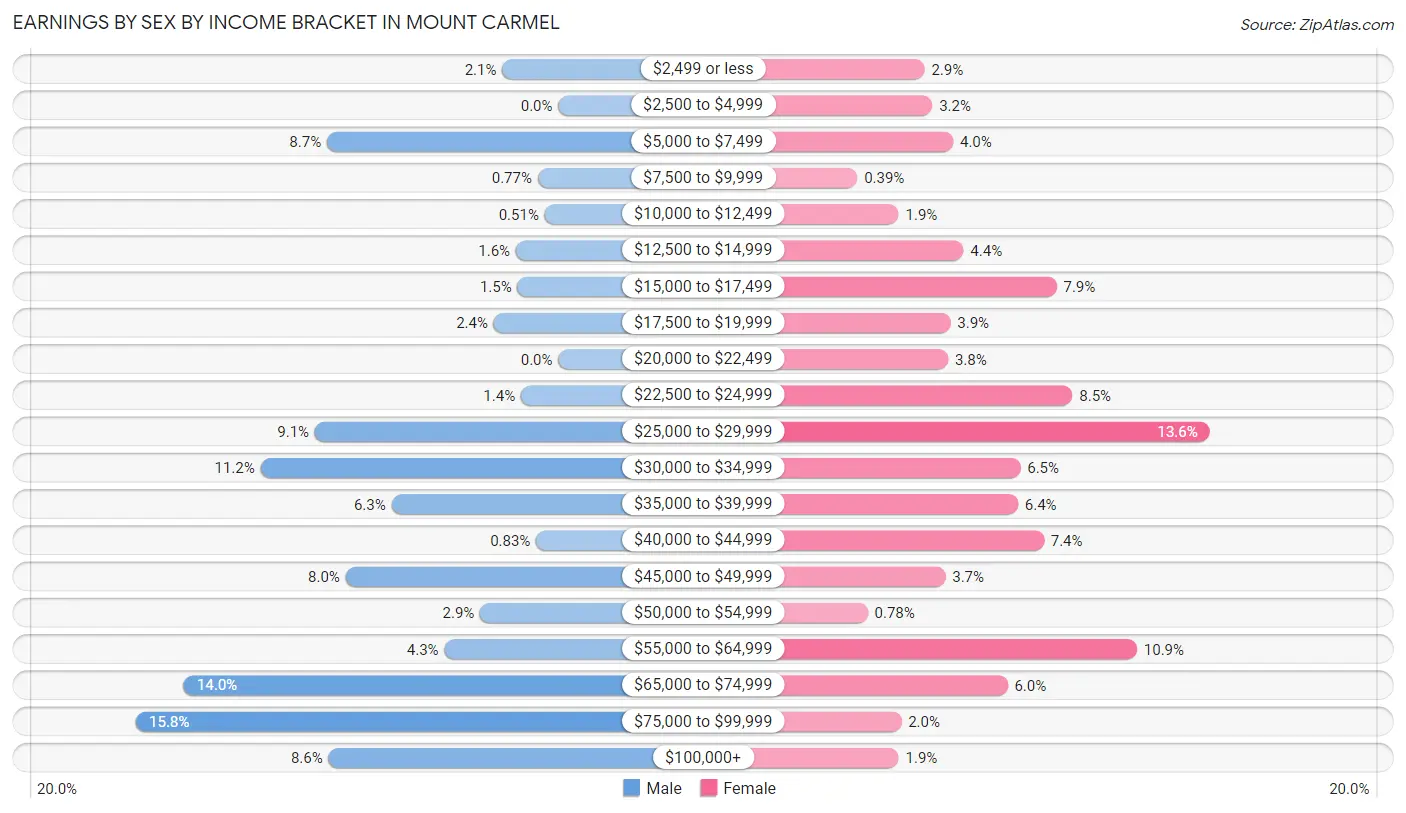
Earnings by Sex by Income Bracket in Mount Carmel
The most common earnings brackets in Mount Carmel are $75,000 to $99,999 for men (248 | 15.8%) and $25,000 to $29,999 for women (140 | 13.6%).
| Income | Male | Female |
| $2,499 or less | 33 (2.1%) | 30 (2.9%) |
| $2,500 to $4,999 | 0 (0.0%) | 33 (3.2%) |
| $5,000 to $7,499 | 136 (8.7%) | 41 (4.0%) |
| $7,500 to $9,999 | 12 (0.8%) | 4 (0.4%) |
| $10,000 to $12,499 | 8 (0.5%) | 20 (1.9%) |
| $12,500 to $14,999 | 25 (1.6%) | 45 (4.4%) |
| $15,000 to $17,499 | 24 (1.5%) | 81 (7.9%) |
| $17,500 to $19,999 | 38 (2.4%) | 40 (3.9%) |
| $20,000 to $22,499 | 0 (0.0%) | 39 (3.8%) |
| $22,500 to $24,999 | 22 (1.4%) | 87 (8.5%) |
| $25,000 to $29,999 | 143 (9.1%) | 140 (13.6%) |
| $30,000 to $34,999 | 175 (11.2%) | 67 (6.5%) |
| $35,000 to $39,999 | 98 (6.2%) | 66 (6.4%) |
| $40,000 to $44,999 | 13 (0.8%) | 76 (7.4%) |
| $45,000 to $49,999 | 125 (8.0%) | 38 (3.7%) |
| $50,000 to $54,999 | 46 (2.9%) | 8 (0.8%) |
| $55,000 to $64,999 | 67 (4.3%) | 112 (10.9%) |
| $65,000 to $74,999 | 220 (14.0%) | 62 (6.0%) |
| $75,000 to $99,999 | 248 (15.8%) | 21 (2.0%) |
| $100,000+ | 135 (8.6%) | 20 (1.9%) |
| Total | 1,568 (100.0%) | 1,030 (100.0%) |
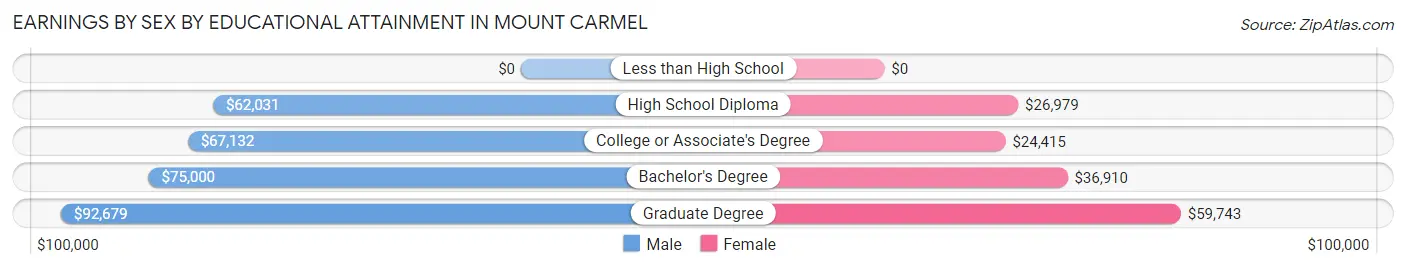
Earnings by Sex by Educational Attainment in Mount Carmel
Average earnings in Mount Carmel are $63,194 for men and $29,415 for women, a difference of 53.4%. Men with an educational attainment of graduate degree enjoy the highest average annual earnings of $92,679, while those with high school diploma education earn the least with $62,031. Women with an educational attainment of graduate degree earn the most with the average annual earnings of $59,743, while those with college or associate's degree education have the smallest earnings of $24,415.
| Educational Attainment | Male Income | Female Income |
| Less than High School | - | - |
| High School Diploma | $62,031 | $26,979 |
| College or Associate's Degree | $67,132 | $24,415 |
| Bachelor's Degree | $75,000 | $36,910 |
| Graduate Degree | $92,679 | $59,743 |
| Total | $63,194 | $29,415 |
Family Income in Mount Carmel
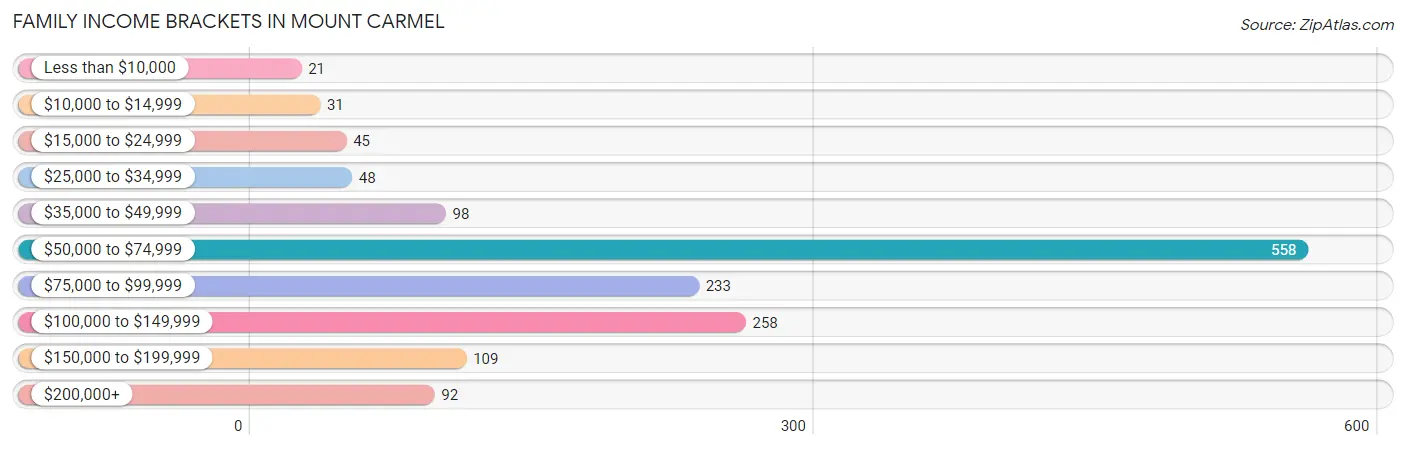
Family Income Brackets in Mount Carmel
According to the Mount Carmel family income data, there are 558 families falling into the $50,000 to $74,999 income range, which is the most common income bracket and makes up 37.4% of all families. Conversely, the less than $10,000 income bracket is the least frequent group with only 21 families (1.4%) belonging to this category.
| Income Bracket | # Families | % Families |
| Less than $10,000 | 21 | 1.4% |
| $10,000 to $14,999 | 31 | 2.1% |
| $15,000 to $24,999 | 45 | 3.0% |
| $25,000 to $34,999 | 48 | 3.2% |
| $35,000 to $49,999 | 98 | 6.6% |
| $50,000 to $74,999 | 558 | 37.4% |
| $75,000 to $99,999 | 233 | 15.6% |
| $100,000 to $149,999 | 258 | 17.3% |
| $150,000 to $199,999 | 109 | 7.3% |
| $200,000+ | 92 | 6.2% |
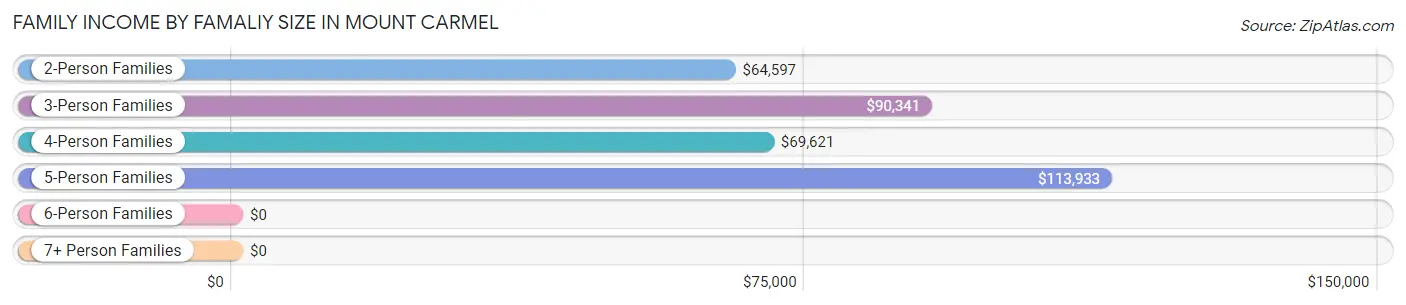
Family Income by Famaliy Size in Mount Carmel
5-person families (145 | 9.7%) account for the highest median family income in Mount Carmel with $113,933 per family, while 2-person families (774 | 51.9%) have the highest median income of $32,298 per family member.
| Income Bracket | # Families | Median Income |
| 2-Person Families | 774 (51.9%) | $64,597 |
| 3-Person Families | 299 (20.1%) | $90,341 |
| 4-Person Families | 201 (13.5%) | $69,621 |
| 5-Person Families | 145 (9.7%) | $113,933 |
| 6-Person Families | 7 (0.5%) | $0 |
| 7+ Person Families | 65 (4.4%) | $0 |
| Total | 1,491 (100.0%) | $70,409 |
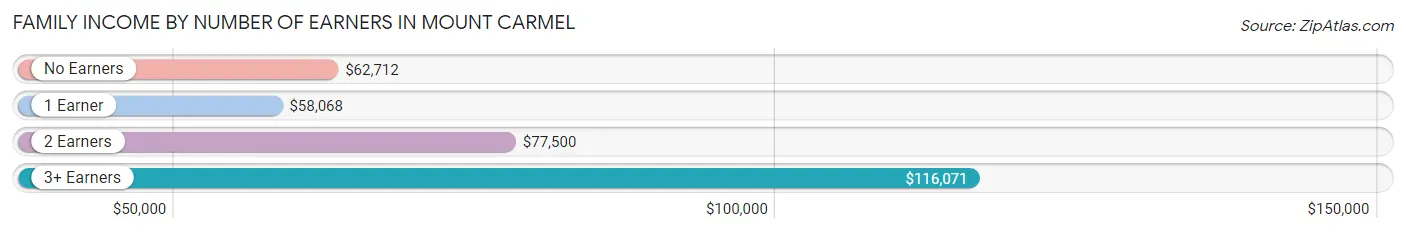
Family Income by Number of Earners in Mount Carmel
The median family income in Mount Carmel is $70,409, with families comprising 3+ earners (266) having the highest median family income of $116,071, while families with 1 earner (229) have the lowest median family income of $58,068, accounting for 17.8% and 15.4% of families, respectively.
| Number of Earners | # Families | Median Income |
| No Earners | 394 (26.4%) | $62,712 |
| 1 Earner | 229 (15.4%) | $58,068 |
| 2 Earners | 602 (40.4%) | $77,500 |
| 3+ Earners | 266 (17.8%) | $116,071 |
| Total | 1,491 (100.0%) | $70,409 |
Household Income in Mount Carmel
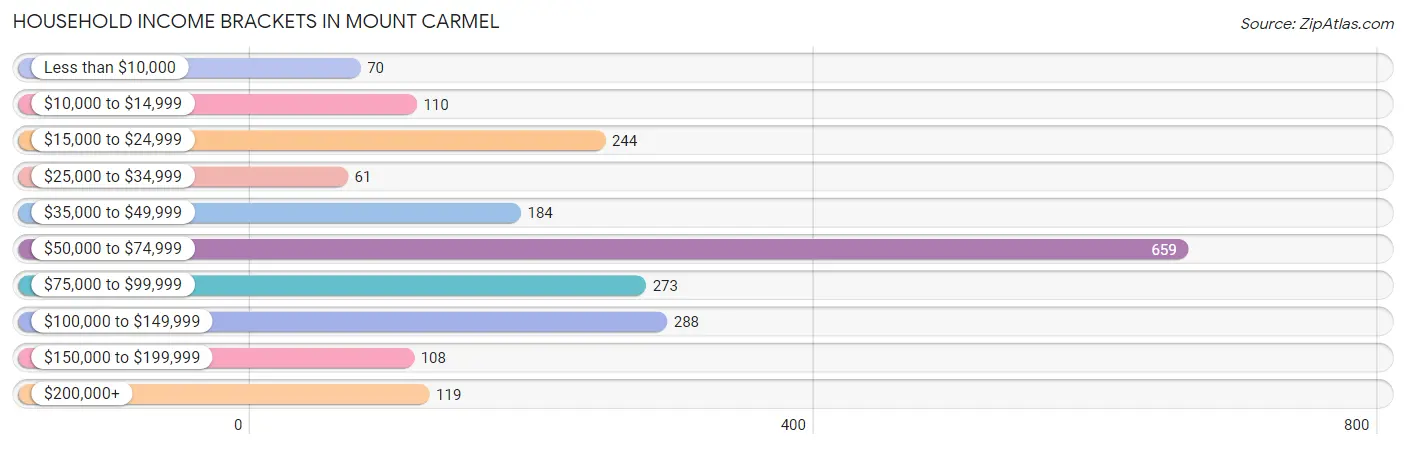
Household Income Brackets in Mount Carmel
With 659 households falling in the category, the $50,000 to $74,999 income range is the most frequent in Mount Carmel, accounting for 31.1% of all households. In contrast, only 61 households (2.9%) fall into the $25,000 to $34,999 income bracket, making it the least populous group.
| Income Bracket | # Households | % Households |
| Less than $10,000 | 70 | 3.3% |
| $10,000 to $14,999 | 110 | 5.2% |
| $15,000 to $24,999 | 244 | 11.5% |
| $25,000 to $34,999 | 61 | 2.9% |
| $35,000 to $49,999 | 184 | 8.7% |
| $50,000 to $74,999 | 659 | 31.1% |
| $75,000 to $99,999 | 273 | 12.9% |
| $100,000 to $149,999 | 288 | 13.6% |
| $150,000 to $199,999 | 108 | 5.1% |
| $200,000+ | 119 | 5.6% |
Household Income by Householder Age in Mount Carmel
The median household income in Mount Carmel is $64,971, with the highest median household income of $85,556 found in the 45 to 64 years age bracket for the primary householder. A total of 844 households (39.8%) fall into this category. Meanwhile, the 15 to 24 years age bracket for the primary householder has the lowest median household income of $0, with 19 households (0.9%) in this group.
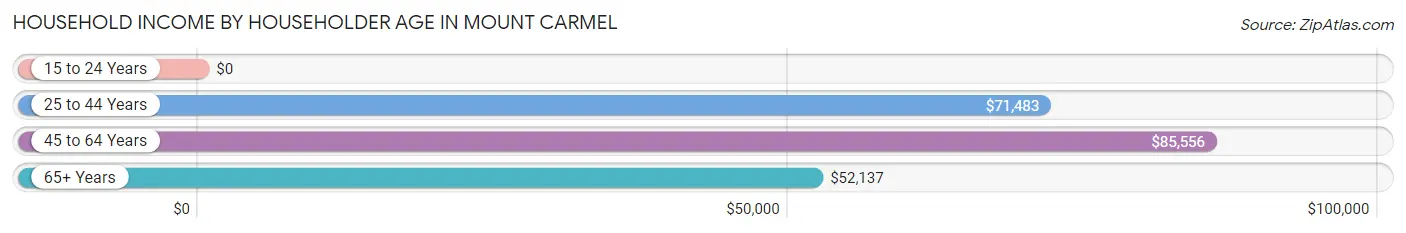
| Income Bracket | # Households | Median Income |
| 15 to 24 Years | 19 (0.9%) | $0 |
| 25 to 44 Years | 503 (23.7%) | $71,483 |
| 45 to 64 Years | 844 (39.8%) | $85,556 |
| 65+ Years | 753 (35.5%) | $52,137 |
| Total | 2,119 (100.0%) | $64,971 |
Poverty in Mount Carmel
Income Below Poverty by Sex and Age in Mount Carmel
With 4.7% poverty level for males and 7.9% for females among the residents of Mount Carmel, 15 year old males and 6 to 11 year old females are the most vulnerable to poverty, with 12 males (46.2%) and 38 females (27.7%) in their respective age groups living below the poverty level.
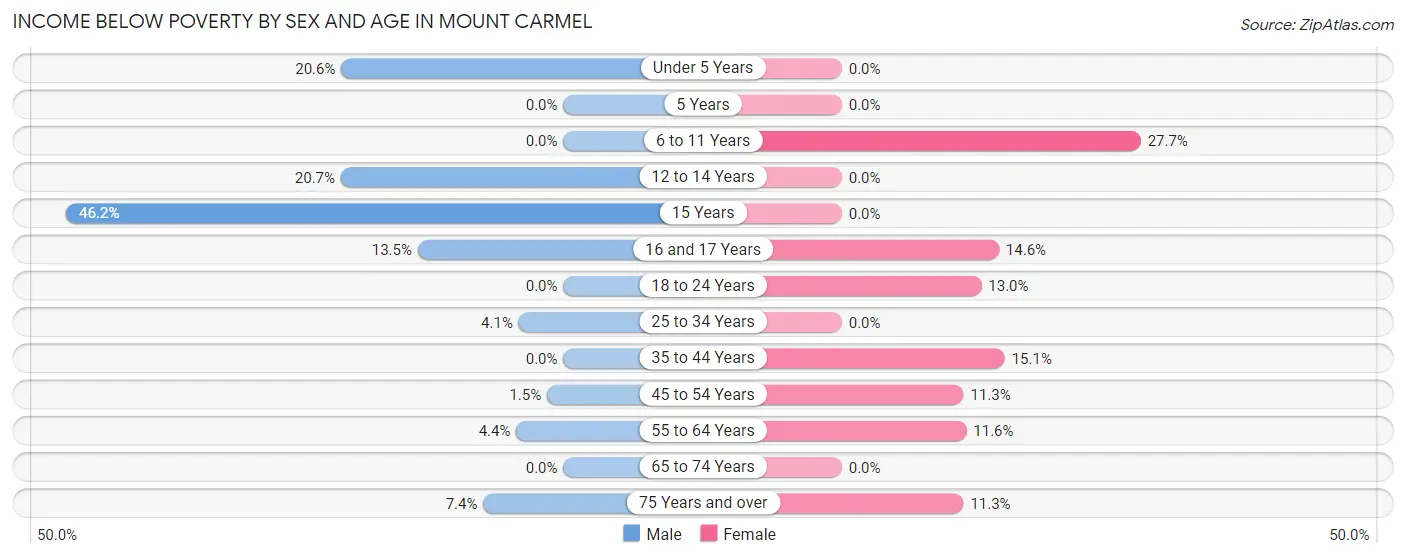
| Age Bracket | Male | Female |
| Under 5 Years | 27 (20.6%) | 0 (0.0%) |
| 5 Years | 0 (0.0%) | 0 (0.0%) |
| 6 to 11 Years | 0 (0.0%) | 38 (27.7%) |
| 12 to 14 Years | 19 (20.6%) | 0 (0.0%) |
| 15 Years | 12 (46.2%) | 0 (0.0%) |
| 16 and 17 Years | 15 (13.5%) | 7 (14.6%) |
| 18 to 24 Years | 0 (0.0%) | 18 (13.0%) |
| 25 to 34 Years | 15 (4.1%) | 0 (0.0%) |
| 35 to 44 Years | 0 (0.0%) | 31 (15.1%) |
| 45 to 54 Years | 8 (1.5%) | 39 (11.3%) |
| 55 to 64 Years | 11 (4.4%) | 49 (11.6%) |
| 65 to 74 Years | 0 (0.0%) | 0 (0.0%) |
| 75 Years and over | 20 (7.4%) | 36 (11.3%) |
| Total | 127 (4.7%) | 218 (7.9%) |
Income Above Poverty by Sex and Age in Mount Carmel
According to the poverty statistics in Mount Carmel, males aged 6 to 11 years and females aged under 5 years are the age groups that are most secure financially, with 100.0% of males and 100.0% of females in these age groups living above the poverty line.
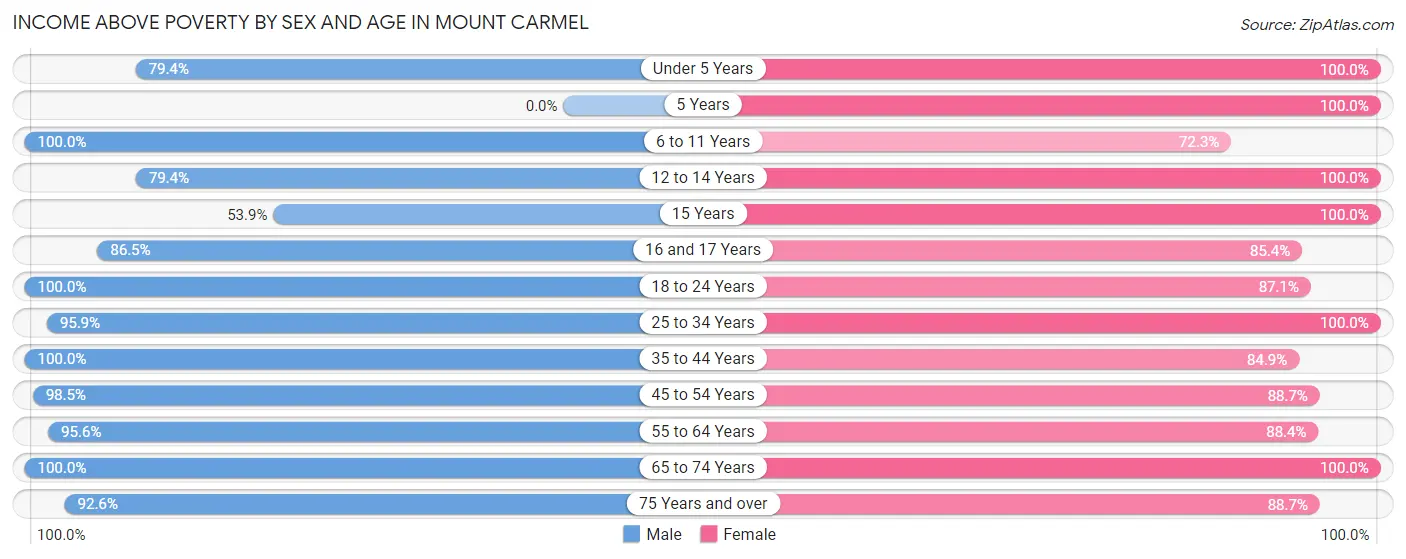
| Age Bracket | Male | Female |
| Under 5 Years | 104 (79.4%) | 156 (100.0%) |
| 5 Years | 0 (0.0%) | 65 (100.0%) |
| 6 to 11 Years | 107 (100.0%) | 99 (72.3%) |
| 12 to 14 Years | 73 (79.3%) | 176 (100.0%) |
| 15 Years | 14 (53.8%) | 25 (100.0%) |
| 16 and 17 Years | 96 (86.5%) | 41 (85.4%) |
| 18 to 24 Years | 294 (100.0%) | 121 (87.1%) |
| 25 to 34 Years | 347 (95.9%) | 498 (100.0%) |
| 35 to 44 Years | 311 (100.0%) | 174 (84.9%) |
| 45 to 54 Years | 523 (98.5%) | 306 (88.7%) |
| 55 to 64 Years | 241 (95.6%) | 375 (88.4%) |
| 65 to 74 Years | 218 (100.0%) | 235 (100.0%) |
| 75 Years and over | 249 (92.6%) | 283 (88.7%) |
| Total | 2,577 (95.3%) | 2,554 (92.1%) |
Income Below Poverty Among Married-Couple Families in Mount Carmel
The poverty statistics for married-couple families in Mount Carmel show that 1.3% or 16 of the total 1,219 families live below the poverty line. Families with 1 or 2 children have the highest poverty rate of 2.1%, comprising of 9 families. On the other hand, families with 3 or 4 children have the lowest poverty rate of 0.0%, which includes 0 families.
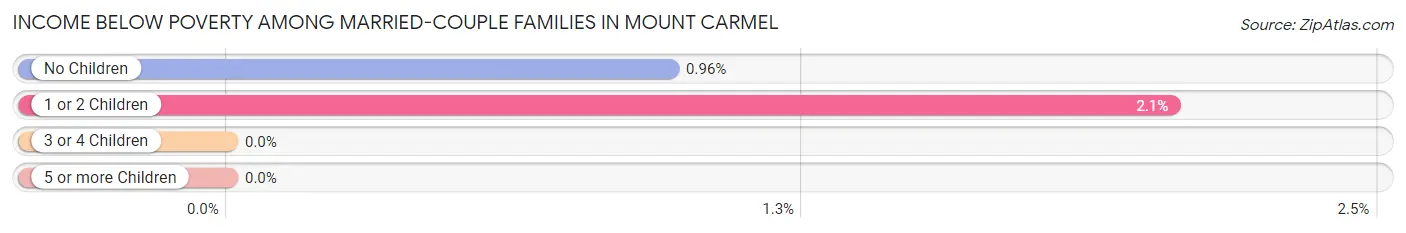
| Children | Above Poverty | Below Poverty |
| No Children | 720 (99.0%) | 7 (1.0%) |
| 1 or 2 Children | 431 (98.0%) | 9 (2.1%) |
| 3 or 4 Children | 13 (100.0%) | 0 (0.0%) |
| 5 or more Children | 39 (100.0%) | 0 (0.0%) |
| Total | 1,203 (98.7%) | 16 (1.3%) |
Income Below Poverty Among Single-Parent Households in Mount Carmel
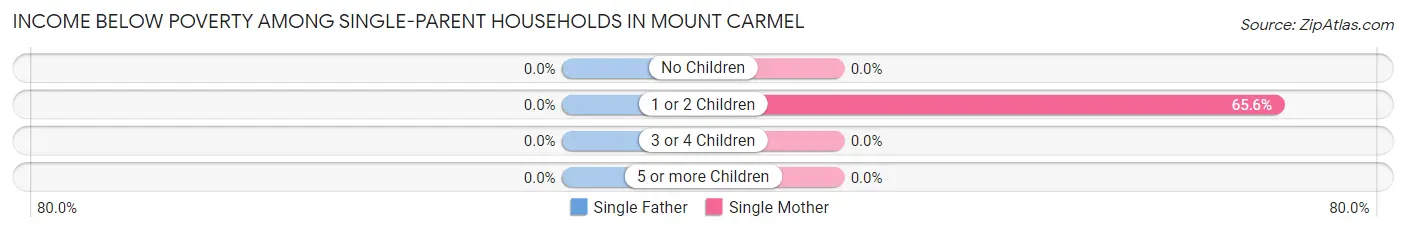
| Children | Single Father | Single Mother |
| No Children | 0 (0.0%) | 0 (0.0%) |
| 1 or 2 Children | 0 (0.0%) | 61 (65.6%) |
| 3 or 4 Children | 0 (0.0%) | 0 (0.0%) |
| 5 or more Children | 0 (0.0%) | 0 (0.0%) |
| Total | 0 (0.0%) | 61 (32.8%) |
Income Below Poverty Among Married-Couple vs Single-Parent Households in Mount Carmel
The poverty data for Mount Carmel shows that 16 of the married-couple family households (1.3%) and 61 of the single-parent households (22.4%) are living below the poverty level. Within the married-couple family households, those with 1 or 2 children have the highest poverty rate, with 9 households (2.1%) falling below the poverty line. Among the single-parent households, those with 1 or 2 children have the highest poverty rate, with 61 household (48.0%) living below poverty.
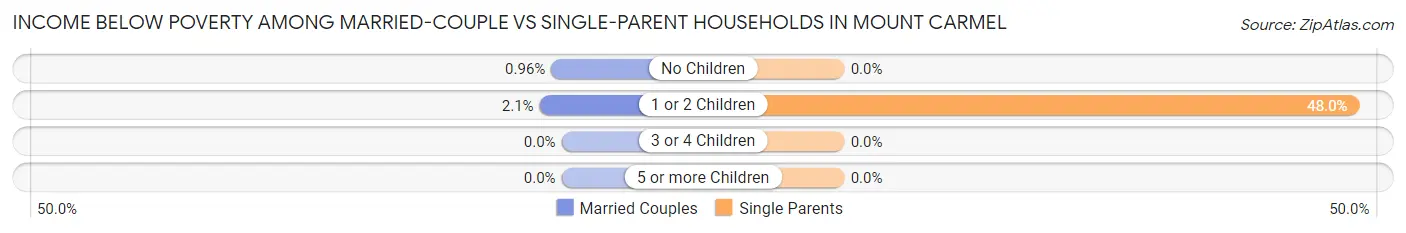
| Children | Married-Couple Families | Single-Parent Households |
| No Children | 7 (1.0%) | 0 (0.0%) |
| 1 or 2 Children | 9 (2.1%) | 61 (48.0%) |
| 3 or 4 Children | 0 (0.0%) | 0 (0.0%) |
| 5 or more Children | 0 (0.0%) | 0 (0.0%) |
| Total | 16 (1.3%) | 61 (22.4%) |
Race in Mount Carmel
The most populous races in Mount Carmel are White / Caucasian (5,345 | 97.4%), Two or more Races (71 | 1.3%), and Asian (49 | 0.9%).
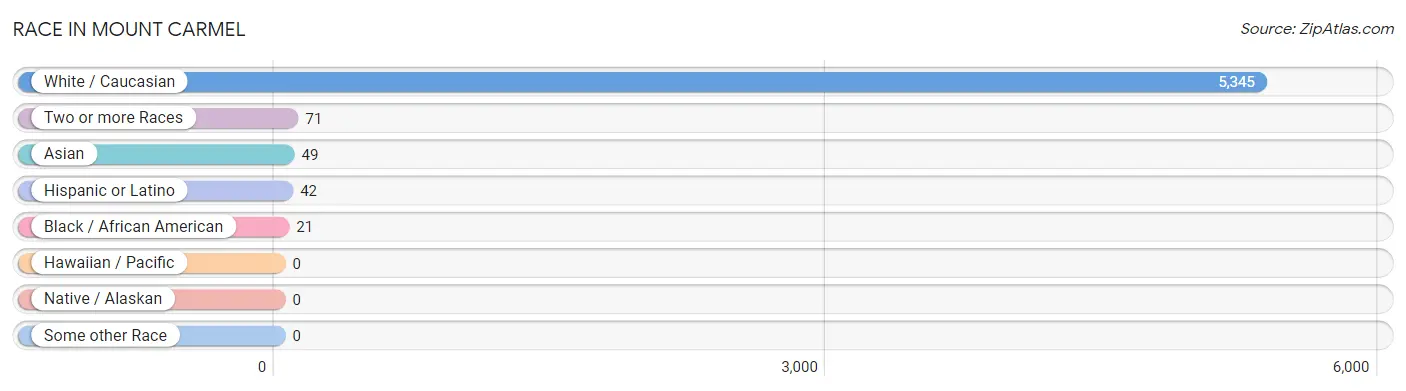
| Race | # Population | % Population |
| Asian | 49 | 0.9% |
| Black / African American | 21 | 0.4% |
| Hawaiian / Pacific | 0 | 0.0% |
| Hispanic or Latino | 42 | 0.8% |
| Native / Alaskan | 0 | 0.0% |
| White / Caucasian | 5,345 | 97.4% |
| Two or more Races | 71 | 1.3% |
| Some other Race | 0 | 0.0% |
| Total | 5,486 | 100.0% |
Ancestry in Mount Carmel
The most populous ancestries reported in Mount Carmel are English (913 | 16.6%), American (813 | 14.8%), German (702 | 12.8%), British (444 | 8.1%), and Irish (422 | 7.7%), together accounting for 60.0% of all Mount Carmel residents.
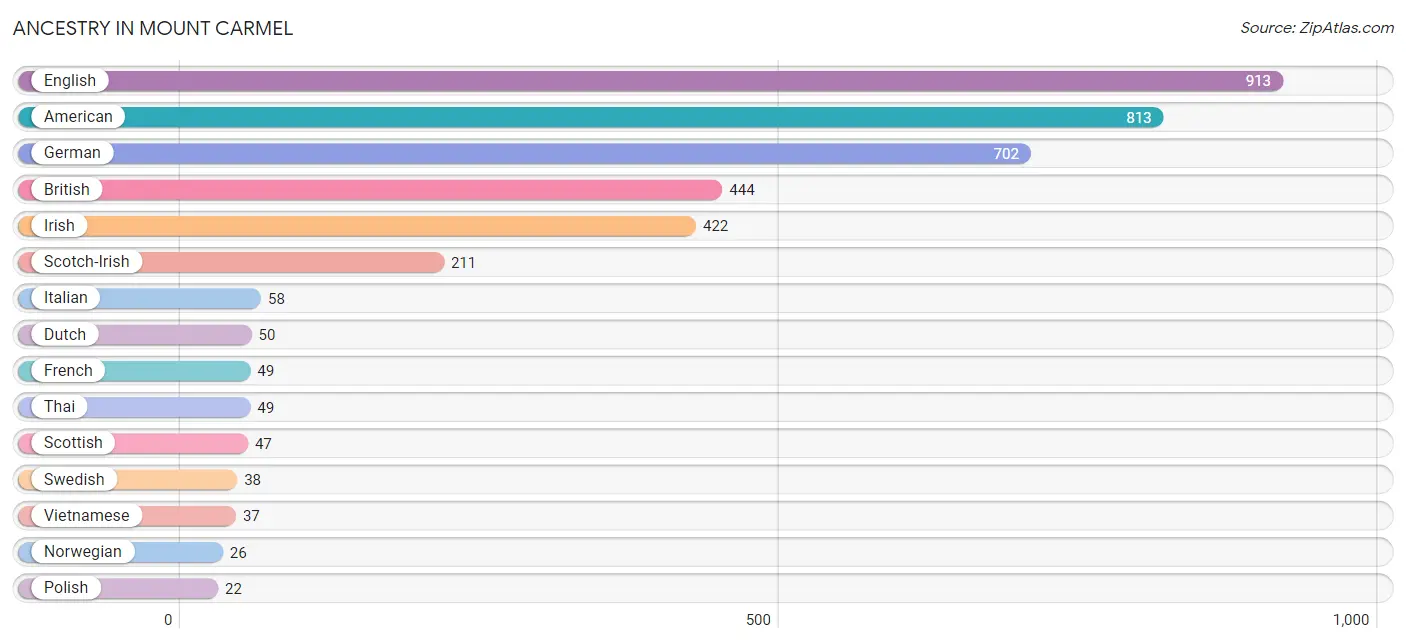
| Ancestry | # Population | % Population |
| American | 813 | 14.8% |
| Bhutanese | 9 | 0.2% |
| British | 444 | 8.1% |
| Cherokee | 7 | 0.1% |
| Dutch | 50 | 0.9% |
| English | 913 | 16.6% |
| French | 49 | 0.9% |
| German | 702 | 12.8% |
| Greek | 19 | 0.4% |
| Irish | 422 | 7.7% |
| Italian | 58 | 1.1% |
| Norwegian | 26 | 0.5% |
| Polish | 22 | 0.4% |
| Puerto Rican | 13 | 0.2% |
| Scandinavian | 9 | 0.2% |
| Scotch-Irish | 211 | 3.8% |
| Scottish | 47 | 0.9% |
| Spaniard | 11 | 0.2% |
| Swedish | 38 | 0.7% |
| Thai | 49 | 0.9% |
| Vietnamese | 37 | 0.7% |
| Welsh | 14 | 0.3% |
| West Indian | 5 | 0.1% | View All 23 Rows |
Immigrants in Mount Carmel
The most numerous immigrant groups reported in Mount Carmel came from Europe (15 | 0.3%), Eastern Europe (9 | 0.2%), Poland (9 | 0.2%), England (6 | 0.1%), and Northern Europe (6 | 0.1%), together accounting for 0.8% of all Mount Carmel residents.
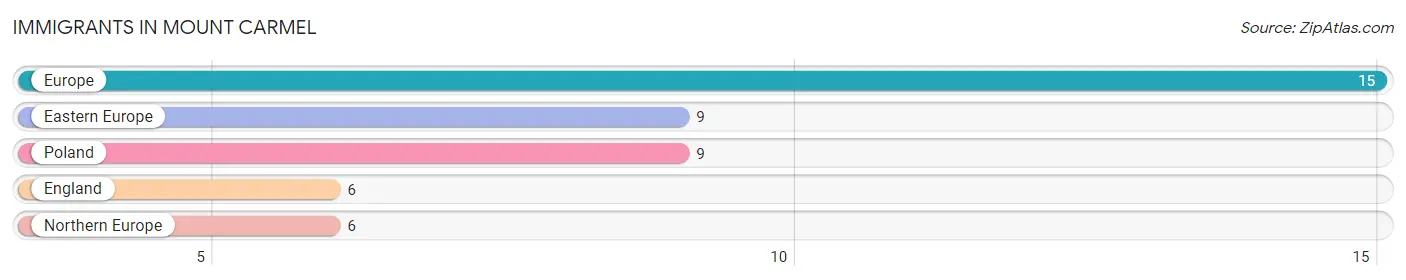
| Immigration Origin | # Population | % Population |
| Eastern Europe | 9 | 0.2% |
| England | 6 | 0.1% |
| Europe | 15 | 0.3% |
| Northern Europe | 6 | 0.1% |
| Poland | 9 | 0.2% | View All 5 Rows |
Sex and Age in Mount Carmel
Sex and Age in Mount Carmel
The most populous age groups in Mount Carmel are 50 to 54 Years (387 | 14.3%) for men and 25 to 29 Years (257 | 9.3%) for women.
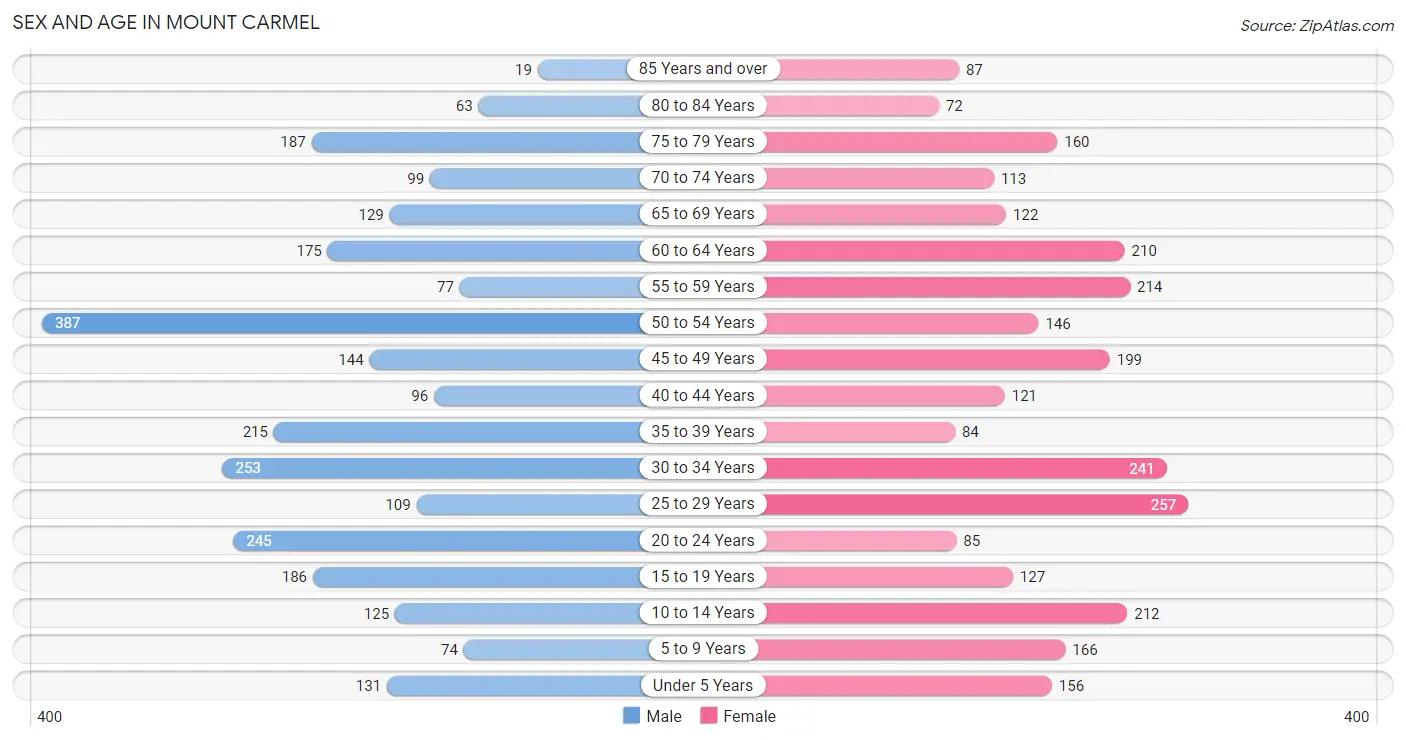
| Age Bracket | Male | Female |
| Under 5 Years | 131 (4.8%) | 156 (5.6%) |
| 5 to 9 Years | 74 (2.7%) | 166 (6.0%) |
| 10 to 14 Years | 125 (4.6%) | 212 (7.6%) |
| 15 to 19 Years | 186 (6.9%) | 127 (4.6%) |
| 20 to 24 Years | 245 (9.0%) | 85 (3.1%) |
| 25 to 29 Years | 109 (4.0%) | 257 (9.3%) |
| 30 to 34 Years | 253 (9.3%) | 241 (8.7%) |
| 35 to 39 Years | 215 (7.9%) | 84 (3.0%) |
| 40 to 44 Years | 96 (3.5%) | 121 (4.4%) |
| 45 to 49 Years | 144 (5.3%) | 199 (7.2%) |
| 50 to 54 Years | 387 (14.3%) | 146 (5.3%) |
| 55 to 59 Years | 77 (2.8%) | 214 (7.7%) |
| 60 to 64 Years | 175 (6.5%) | 210 (7.6%) |
| 65 to 69 Years | 129 (4.8%) | 122 (4.4%) |
| 70 to 74 Years | 99 (3.6%) | 113 (4.1%) |
| 75 to 79 Years | 187 (6.9%) | 160 (5.8%) |
| 80 to 84 Years | 63 (2.3%) | 72 (2.6%) |
| 85 Years and over | 19 (0.7%) | 87 (3.1%) |
| Total | 2,714 (100.0%) | 2,772 (100.0%) |
Families and Households in Mount Carmel
Median Family Size in Mount Carmel
The median family size in Mount Carmel is 3.17 persons per family, with single male/father families (86 | 5.8%) accounting for the largest median family size of 3.38 persons per family. On the other hand, single female/mother families (186 | 12.5%) represent the smallest median family size with 2.59 persons per family.
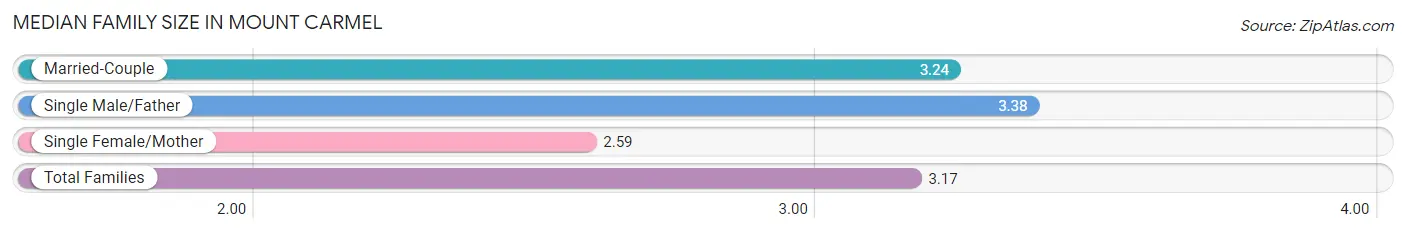
| Family Type | # Families | Family Size |
| Married-Couple | 1,219 (81.8%) | 3.24 |
| Single Male/Father | 86 (5.8%) | 3.38 |
| Single Female/Mother | 186 (12.5%) | 2.59 |
| Total Families | 1,491 (100.0%) | 3.17 |
Median Household Size in Mount Carmel
The median household size in Mount Carmel is 2.58 persons per household, with single male/father households (86 | 4.1%) accounting for the largest median household size of 3.49 persons per household. non-family households (628 | 29.6%) represent the smallest median household size with 1.11 persons per household.
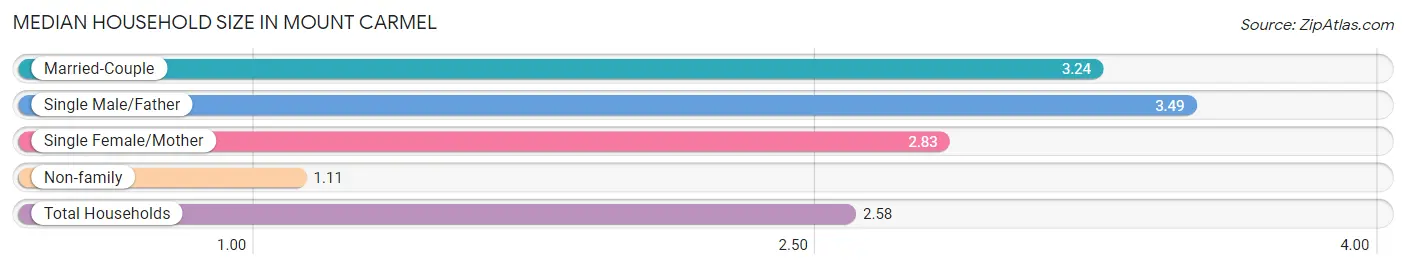
| Household Type | # Households | Household Size |
| Married-Couple | 1,219 (57.5%) | 3.24 |
| Single Male/Father | 86 (4.1%) | 3.49 |
| Single Female/Mother | 186 (8.8%) | 2.83 |
| Non-family | 628 (29.6%) | 1.11 |
| Total Households | 2,119 (100.0%) | 2.58 |
Household Size by Marriage Status in Mount Carmel
Out of a total of 2,119 households in Mount Carmel, 1,491 (70.4%) are family households, while 628 (29.6%) are nonfamily households. The most numerous type of family households are 2-person households, comprising 758, and the most common type of nonfamily households are 1-person households, comprising 555.
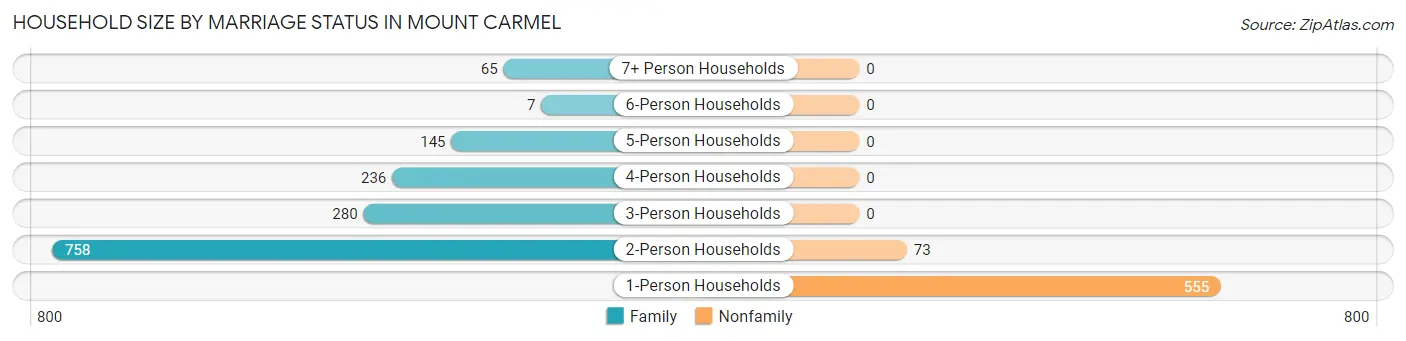
| Household Size | Family Households | Nonfamily Households |
| 1-Person Households | - | 555 (26.2%) |
| 2-Person Households | 758 (35.8%) | 73 (3.5%) |
| 3-Person Households | 280 (13.2%) | 0 (0.0%) |
| 4-Person Households | 236 (11.1%) | 0 (0.0%) |
| 5-Person Households | 145 (6.8%) | 0 (0.0%) |
| 6-Person Households | 7 (0.3%) | 0 (0.0%) |
| 7+ Person Households | 65 (3.1%) | 0 (0.0%) |
| Total | 1,491 (70.4%) | 628 (29.6%) |
Female Fertility in Mount Carmel
Fertility by Age in Mount Carmel
Average fertility rate in Mount Carmel is 37.0 births per 1,000 women. Women in the age bracket of 20 to 34 years have the highest fertility rate with 74.0 births per 1,000 women. Women in the age bracket of 20 to 34 years acount for 100.0% of all women with births.
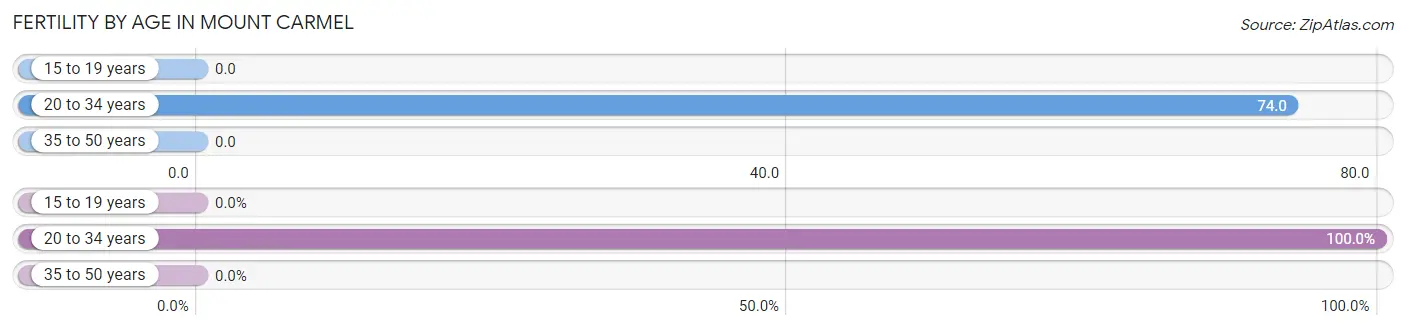
| Age Bracket | Women with Births | Births / 1,000 Women |
| 15 to 19 years | 0 (0.0%) | 0.0 |
| 20 to 34 years | 43 (100.0%) | 74.0 |
| 35 to 50 years | 0 (0.0%) | 0.0 |
| Total | 43 (100.0%) | 37.0 |
Fertility by Age by Marriage Status in Mount Carmel
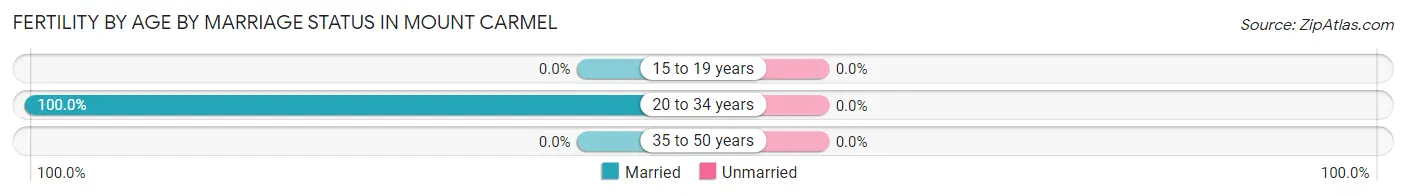
| Age Bracket | Married | Unmarried |
| 15 to 19 years | 0 (0.0%) | 0 (0.0%) |
| 20 to 34 years | 43 (100.0%) | 0 (0.0%) |
| 35 to 50 years | 0 (0.0%) | 0 (0.0%) |
| Total | 43 (100.0%) | 0 (0.0%) |
Fertility by Education in Mount Carmel
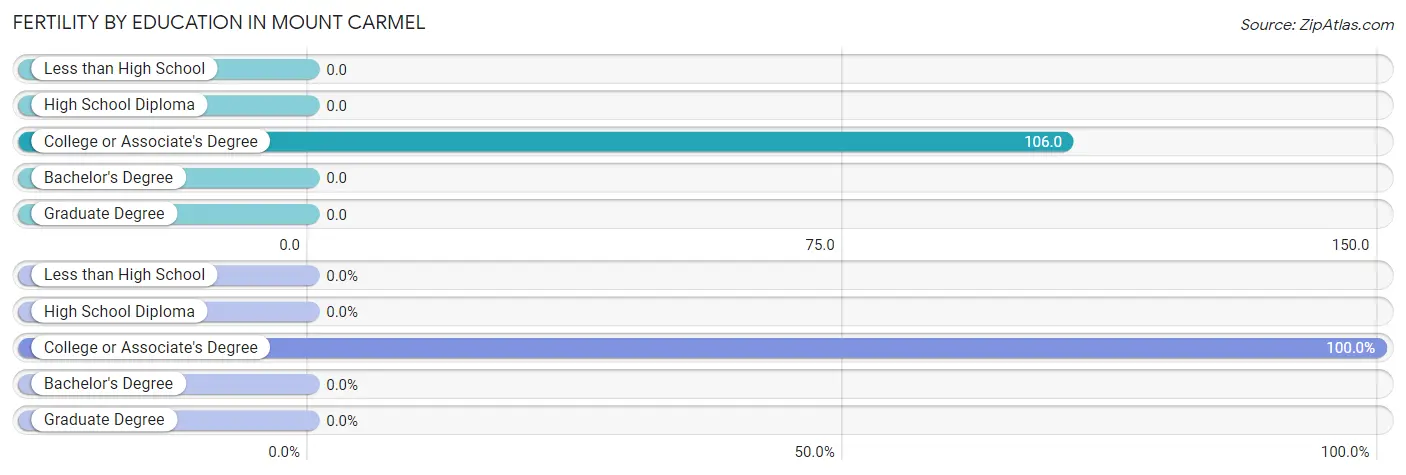
| Educational Attainment | Women with Births | Births / 1,000 Women |
| Less than High School | 0 (0.0%) | 0.0 |
| High School Diploma | 0 (0.0%) | 0.0 |
| College or Associate's Degree | 43 (100.0%) | 106.0 |
| Bachelor's Degree | 0 (0.0%) | 0.0 |
| Graduate Degree | 0 (0.0%) | 0.0 |
| Total | 43 (100.0%) | 37.0 |
Fertility by Education by Marriage Status in Mount Carmel
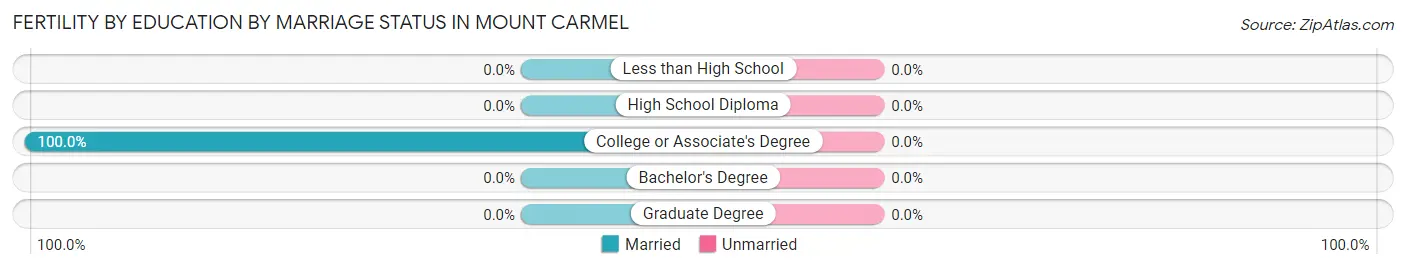
| Educational Attainment | Married | Unmarried |
| Less than High School | 0 (0.0%) | 0 (0.0%) |
| High School Diploma | 0 (0.0%) | 0 (0.0%) |
| College or Associate's Degree | 43 (100.0%) | 0 (0.0%) |
| Bachelor's Degree | 0 (0.0%) | 0 (0.0%) |
| Graduate Degree | 0 (0.0%) | 0 (0.0%) |
| Total | 43 (100.0%) | 0 (0.0%) |
Employment Characteristics in Mount Carmel
Employment by Class of Employer in Mount Carmel
Among the 2,337 employed individuals in Mount Carmel, private company employees (1,756 | 75.1%), local government employees (170 | 7.3%), and not-for-profit organizations (166 | 7.1%) make up the most common classes of employment.
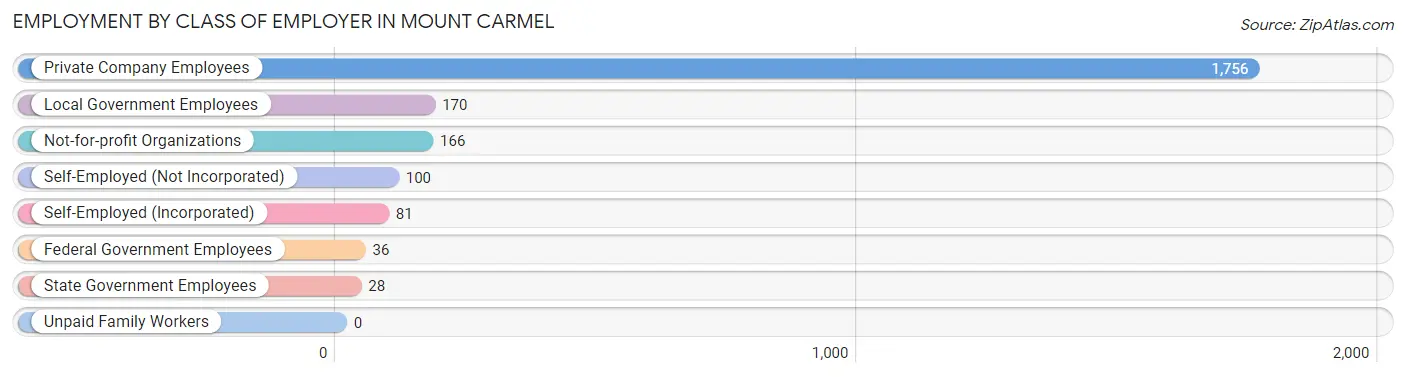
| Employer Class | # Employees | % Employees |
| Private Company Employees | 1,756 | 75.1% |
| Self-Employed (Incorporated) | 81 | 3.5% |
| Self-Employed (Not Incorporated) | 100 | 4.3% |
| Not-for-profit Organizations | 166 | 7.1% |
| Local Government Employees | 170 | 7.3% |
| State Government Employees | 28 | 1.2% |
| Federal Government Employees | 36 | 1.5% |
| Unpaid Family Workers | 0 | 0.0% |
| Total | 2,337 | 100.0% |
Employment Status by Age in Mount Carmel
According to the labor force statistics for Mount Carmel, out of the total population over 16 years of age (4,571), 54.3% or 2,482 individuals are in the labor force, with 5.8% or 144 of them unemployed. The age group with the highest labor force participation rate is 25 to 29 years, with 85.0% or 311 individuals in the labor force. Within the labor force, the 20 to 24 years age range has the highest percentage of unemployed individuals, with 55.0% or 143 of them being unemployed.
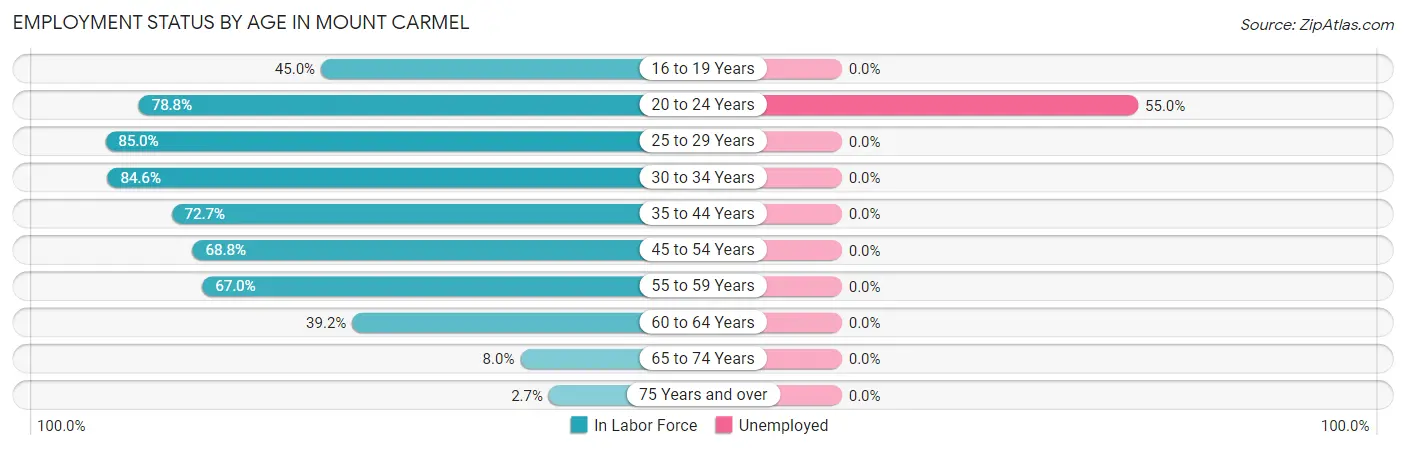
| Age Bracket | In Labor Force | Unemployed |
| 16 to 19 Years | 118 (45.0%) | 0 (0.0%) |
| 20 to 24 Years | 260 (78.8%) | 143 (55.0%) |
| 25 to 29 Years | 311 (85.0%) | 0 (0.0%) |
| 30 to 34 Years | 418 (84.6%) | 0 (0.0%) |
| 35 to 44 Years | 375 (72.7%) | 0 (0.0%) |
| 45 to 54 Years | 603 (68.8%) | 0 (0.0%) |
| 55 to 59 Years | 195 (67.0%) | 0 (0.0%) |
| 60 to 64 Years | 151 (39.2%) | 0 (0.0%) |
| 65 to 74 Years | 37 (8.0%) | 0 (0.0%) |
| 75 Years and over | 16 (2.7%) | 0 (0.0%) |
| Total | 2,482 (54.3%) | 144 (5.8%) |
Employment Status by Educational Attainment in Mount Carmel
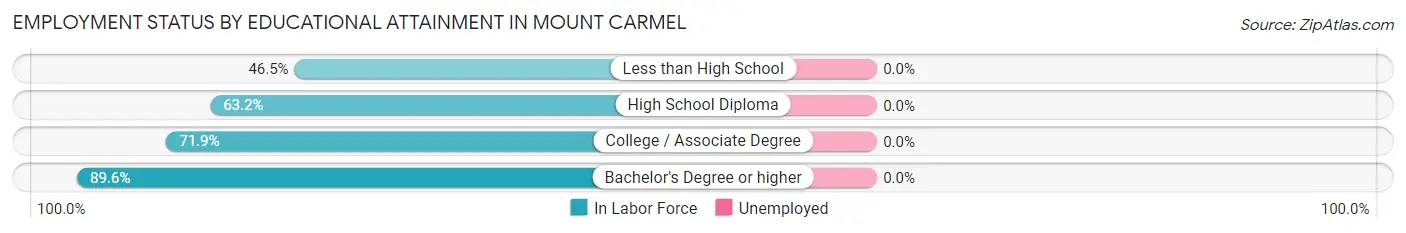
| Educational Attainment | In Labor Force | Unemployed |
| Less than High School | 93 (46.5%) | 0 (0.0%) |
| High School Diploma | 670 (63.2%) | 0 (0.0%) |
| College / Associate Degree | 833 (71.9%) | 0 (0.0%) |
| Bachelor's Degree or higher | 457 (89.6%) | 0 (0.0%) |
| Total | 2,053 (70.1%) | 0 (0.0%) |
Employment Occupations by Sex in Mount Carmel
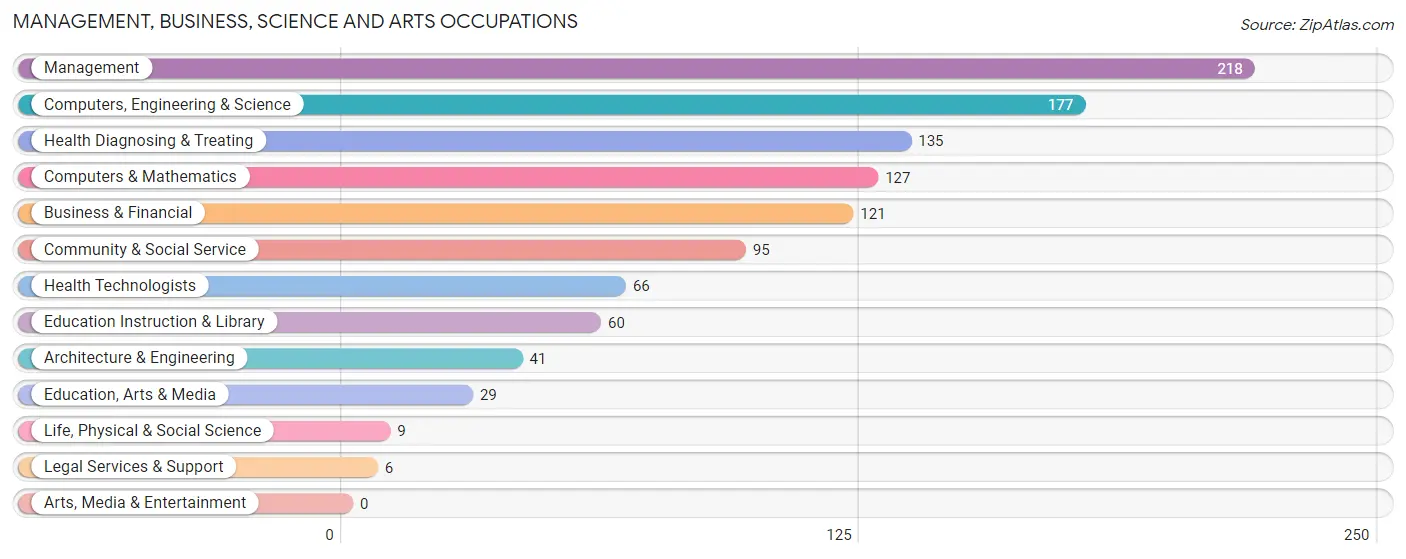
Management, Business, Science and Arts Occupations
The most common Management, Business, Science and Arts occupations in Mount Carmel are Management (218 | 9.3%), Computers, Engineering & Science (177 | 7.6%), Health Diagnosing & Treating (135 | 5.8%), Computers & Mathematics (127 | 5.4%), and Business & Financial (121 | 5.2%).
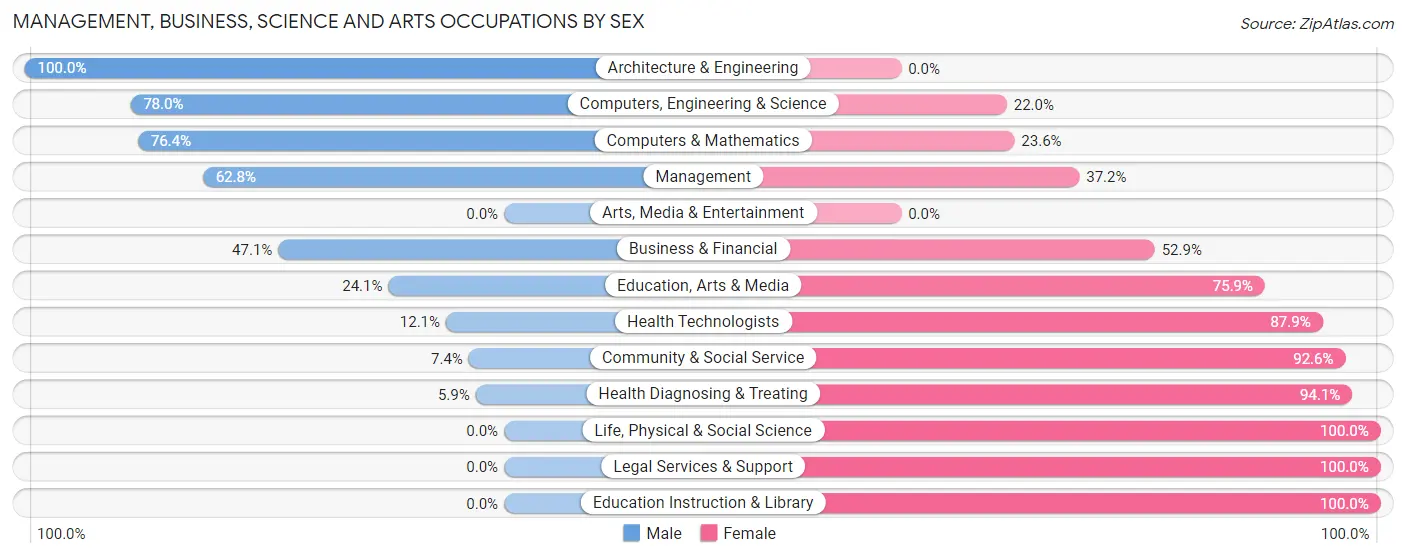
Management, Business, Science and Arts Occupations by Sex
Within the Management, Business, Science and Arts occupations in Mount Carmel, the most male-oriented occupations are Architecture & Engineering (100.0%), Computers, Engineering & Science (78.0%), and Computers & Mathematics (76.4%), while the most female-oriented occupations are Life, Physical & Social Science (100.0%), Legal Services & Support (100.0%), and Education Instruction & Library (100.0%).
| Occupation | Male | Female |
| Management | 137 (62.8%) | 81 (37.2%) |
| Business & Financial | 57 (47.1%) | 64 (52.9%) |
| Computers, Engineering & Science | 138 (78.0%) | 39 (22.0%) |
| Computers & Mathematics | 97 (76.4%) | 30 (23.6%) |
| Architecture & Engineering | 41 (100.0%) | 0 (0.0%) |
| Life, Physical & Social Science | 0 (0.0%) | 9 (100.0%) |
| Community & Social Service | 7 (7.4%) | 88 (92.6%) |
| Education, Arts & Media | 7 (24.1%) | 22 (75.9%) |
| Legal Services & Support | 0 (0.0%) | 6 (100.0%) |
| Education Instruction & Library | 0 (0.0%) | 60 (100.0%) |
| Arts, Media & Entertainment | 0 (0.0%) | 0 (0.0%) |
| Health Diagnosing & Treating | 8 (5.9%) | 127 (94.1%) |
| Health Technologists | 8 (12.1%) | 58 (87.9%) |
| Total (Category) | 347 (46.5%) | 399 (53.5%) |
| Total (Overall) | 1,379 (58.9%) | 962 (41.1%) |
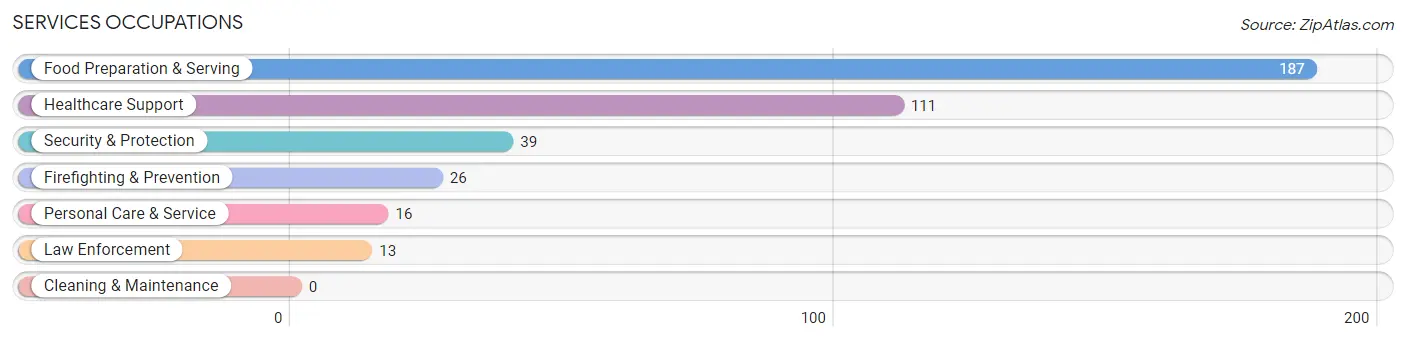
Services Occupations
The most common Services occupations in Mount Carmel are Food Preparation & Serving (187 | 8.0%), Healthcare Support (111 | 4.7%), Security & Protection (39 | 1.7%), Firefighting & Prevention (26 | 1.1%), and Personal Care & Service (16 | 0.7%).
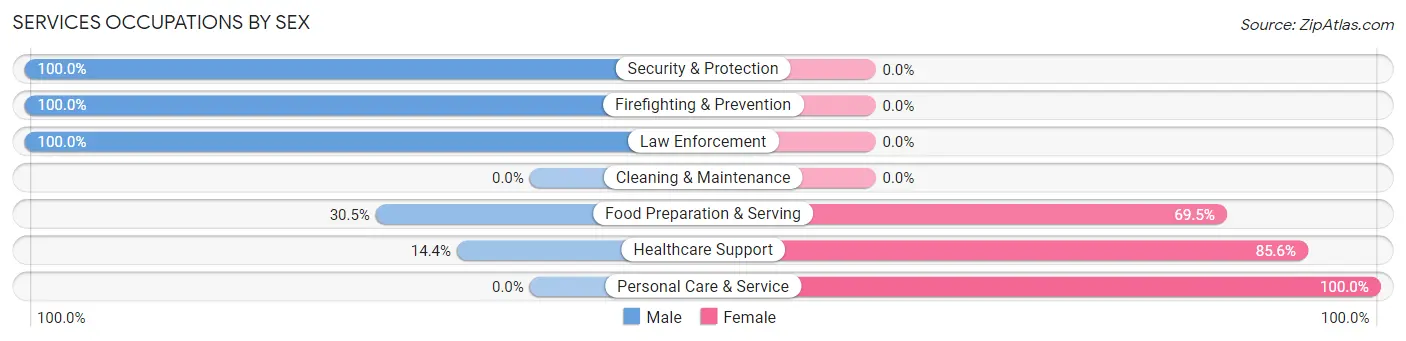
Services Occupations by Sex
Within the Services occupations in Mount Carmel, the most male-oriented occupations are Security & Protection (100.0%), Firefighting & Prevention (100.0%), and Law Enforcement (100.0%), while the most female-oriented occupations are Personal Care & Service (100.0%), Healthcare Support (85.6%), and Food Preparation & Serving (69.5%).
| Occupation | Male | Female |
| Healthcare Support | 16 (14.4%) | 95 (85.6%) |
| Security & Protection | 39 (100.0%) | 0 (0.0%) |
| Firefighting & Prevention | 26 (100.0%) | 0 (0.0%) |
| Law Enforcement | 13 (100.0%) | 0 (0.0%) |
| Food Preparation & Serving | 57 (30.5%) | 130 (69.5%) |
| Cleaning & Maintenance | 0 (0.0%) | 0 (0.0%) |
| Personal Care & Service | 0 (0.0%) | 16 (100.0%) |
| Total (Category) | 112 (31.7%) | 241 (68.3%) |
| Total (Overall) | 1,379 (58.9%) | 962 (41.1%) |
Sales and Office Occupations
The most common Sales and Office occupations in Mount Carmel are Office & Administration (280 | 12.0%), and Sales & Related (143 | 6.1%).
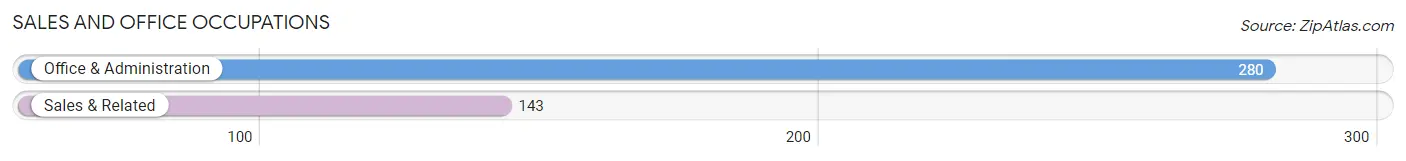
Sales and Office Occupations by Sex
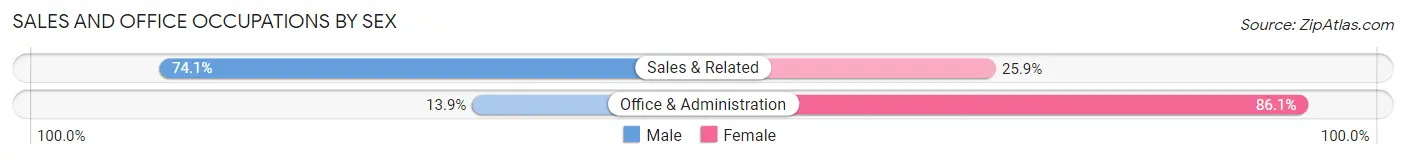
| Occupation | Male | Female |
| Sales & Related | 106 (74.1%) | 37 (25.9%) |
| Office & Administration | 39 (13.9%) | 241 (86.1%) |
| Total (Category) | 145 (34.3%) | 278 (65.7%) |
| Total (Overall) | 1,379 (58.9%) | 962 (41.1%) |
Natural Resources, Construction and Maintenance Occupations
The most common Natural Resources, Construction and Maintenance occupations in Mount Carmel are Installation, Maintenance & Repair (221 | 9.4%), and Construction & Extraction (90 | 3.8%).
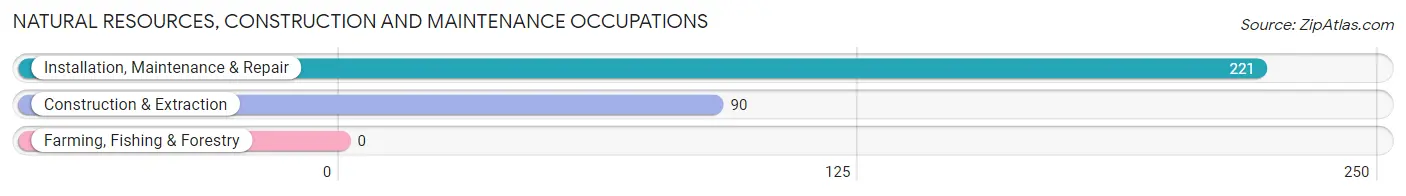
Natural Resources, Construction and Maintenance Occupations by Sex
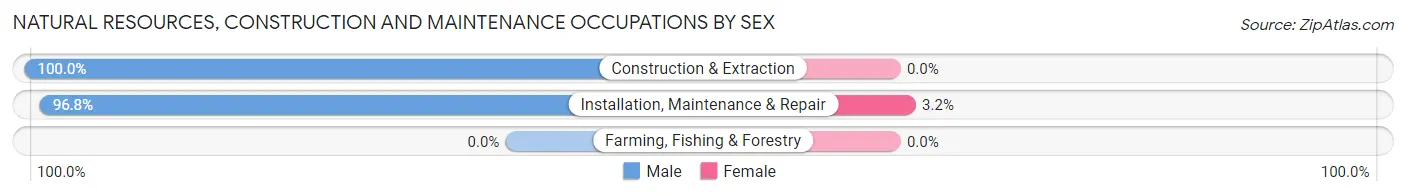
| Occupation | Male | Female |
| Farming, Fishing & Forestry | 0 (0.0%) | 0 (0.0%) |
| Construction & Extraction | 90 (100.0%) | 0 (0.0%) |
| Installation, Maintenance & Repair | 214 (96.8%) | 7 (3.2%) |
| Total (Category) | 304 (97.8%) | 7 (2.2%) |
| Total (Overall) | 1,379 (58.9%) | 962 (41.1%) |
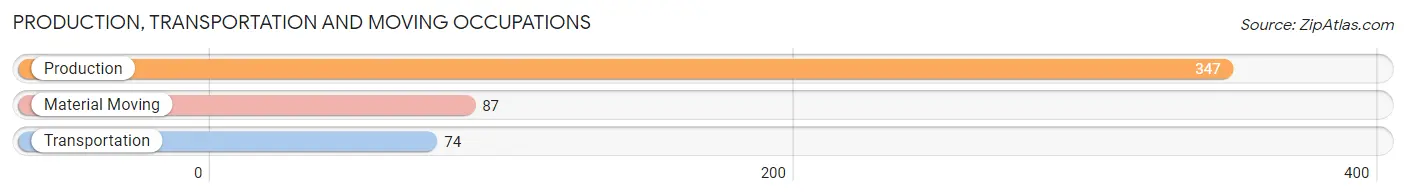
Production, Transportation and Moving Occupations
The most common Production, Transportation and Moving occupations in Mount Carmel are Production (347 | 14.8%), Material Moving (87 | 3.7%), and Transportation (74 | 3.2%).
Production, Transportation and Moving Occupations by Sex
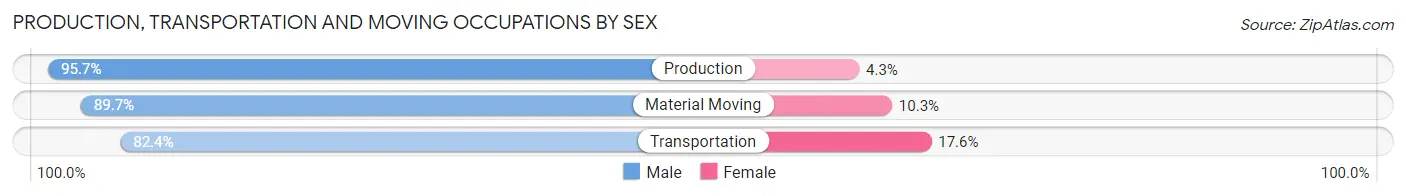
| Occupation | Male | Female |
| Production | 332 (95.7%) | 15 (4.3%) |
| Transportation | 61 (82.4%) | 13 (17.6%) |
| Material Moving | 78 (89.7%) | 9 (10.3%) |
| Total (Category) | 471 (92.7%) | 37 (7.3%) |
| Total (Overall) | 1,379 (58.9%) | 962 (41.1%) |
Employment Industries by Sex in Mount Carmel
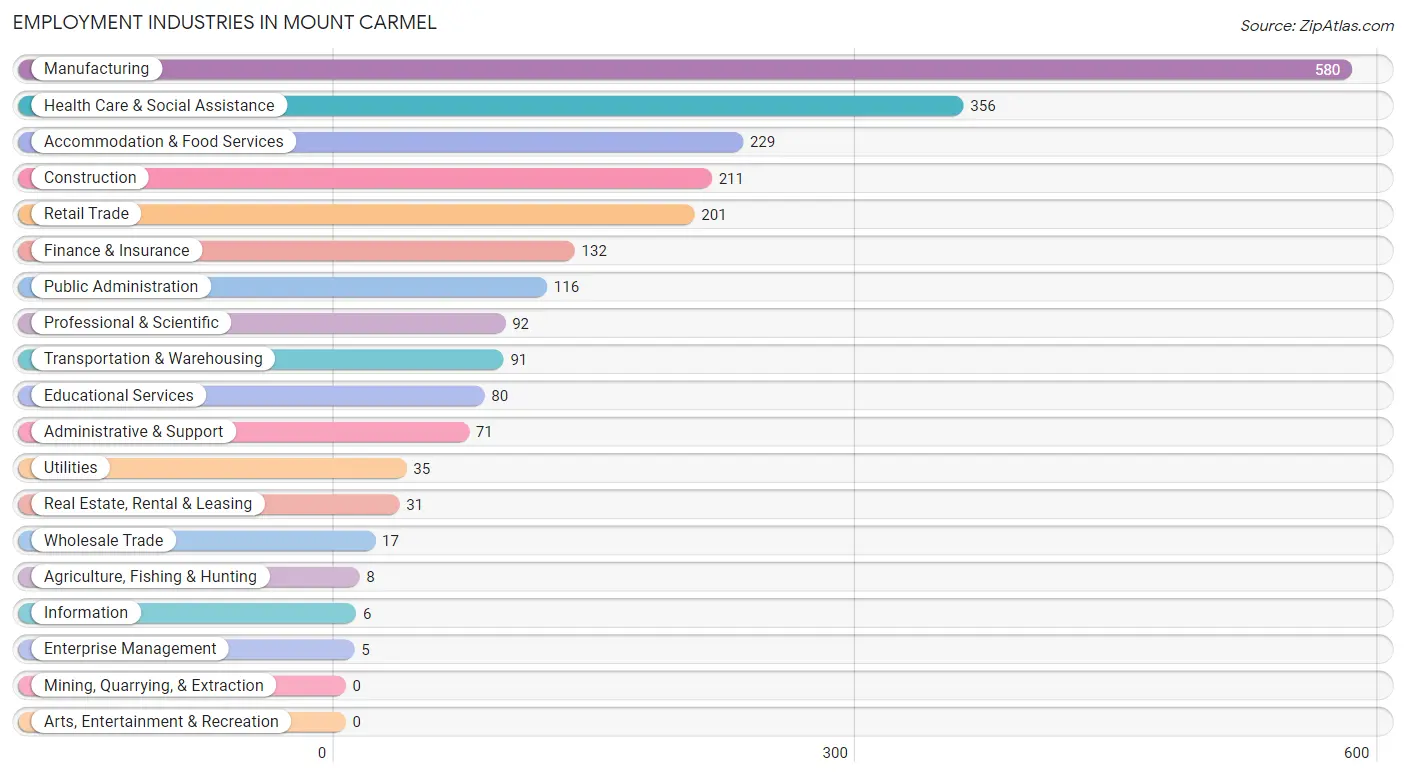
Employment Industries in Mount Carmel
The major employment industries in Mount Carmel include Manufacturing (580 | 24.8%), Health Care & Social Assistance (356 | 15.2%), Accommodation & Food Services (229 | 9.8%), Construction (211 | 9.0%), and Retail Trade (201 | 8.6%).
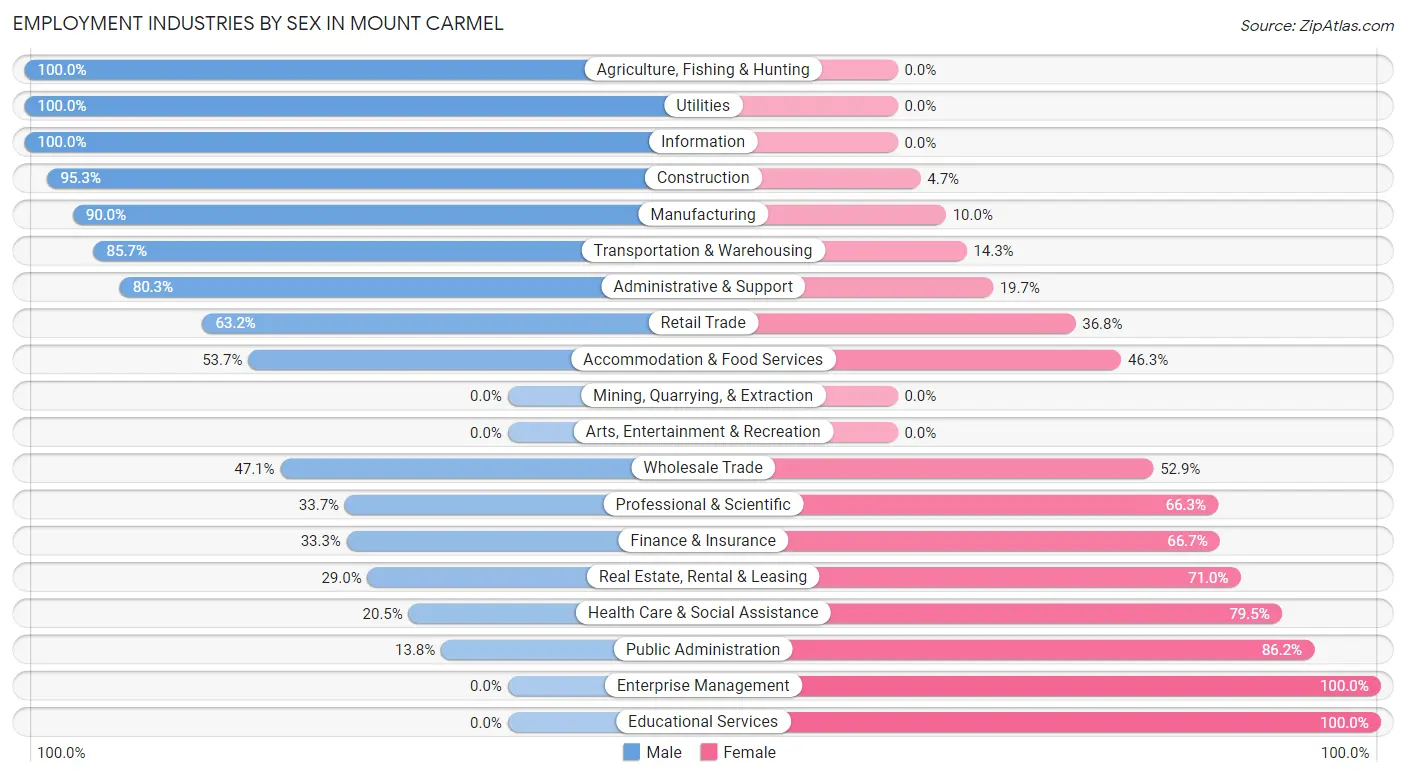
Employment Industries by Sex in Mount Carmel
The Mount Carmel industries that see more men than women are Agriculture, Fishing & Hunting (100.0%), Utilities (100.0%), and Information (100.0%), whereas the industries that tend to have a higher number of women are Enterprise Management (100.0%), Educational Services (100.0%), and Public Administration (86.2%).
| Industry | Male | Female |
| Agriculture, Fishing & Hunting | 8 (100.0%) | 0 (0.0%) |
| Mining, Quarrying, & Extraction | 0 (0.0%) | 0 (0.0%) |
| Construction | 201 (95.3%) | 10 (4.7%) |
| Manufacturing | 522 (90.0%) | 58 (10.0%) |
| Wholesale Trade | 8 (47.1%) | 9 (52.9%) |
| Retail Trade | 127 (63.2%) | 74 (36.8%) |
| Transportation & Warehousing | 78 (85.7%) | 13 (14.3%) |
| Utilities | 35 (100.0%) | 0 (0.0%) |
| Information | 6 (100.0%) | 0 (0.0%) |
| Finance & Insurance | 44 (33.3%) | 88 (66.7%) |
| Real Estate, Rental & Leasing | 9 (29.0%) | 22 (71.0%) |
| Professional & Scientific | 31 (33.7%) | 61 (66.3%) |
| Enterprise Management | 0 (0.0%) | 5 (100.0%) |
| Administrative & Support | 57 (80.3%) | 14 (19.7%) |
| Educational Services | 0 (0.0%) | 80 (100.0%) |
| Health Care & Social Assistance | 73 (20.5%) | 283 (79.5%) |
| Arts, Entertainment & Recreation | 0 (0.0%) | 0 (0.0%) |
| Accommodation & Food Services | 123 (53.7%) | 106 (46.3%) |
| Public Administration | 16 (13.8%) | 100 (86.2%) |
| Total | 1,379 (58.9%) | 962 (41.1%) |
Education in Mount Carmel
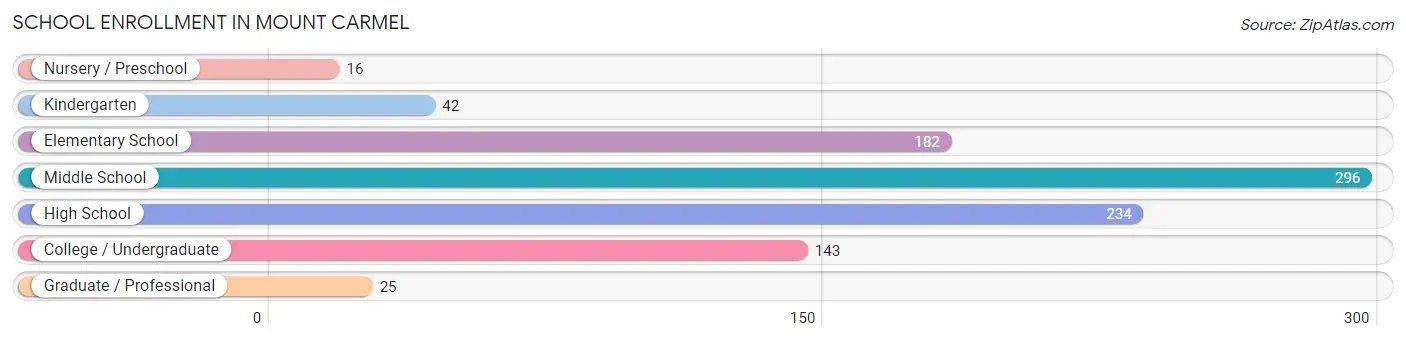
School Enrollment in Mount Carmel
The most common levels of schooling among the 938 students in Mount Carmel are middle school (296 | 31.6%), high school (234 | 24.9%), and elementary school (182 | 19.4%).
| School Level | # Students | % Students |
| Nursery / Preschool | 16 | 1.7% |
| Kindergarten | 42 | 4.5% |
| Elementary School | 182 | 19.4% |
| Middle School | 296 | 31.6% |
| High School | 234 | 24.9% |
| College / Undergraduate | 143 | 15.2% |
| Graduate / Professional | 25 | 2.7% |
| Total | 938 | 100.0% |
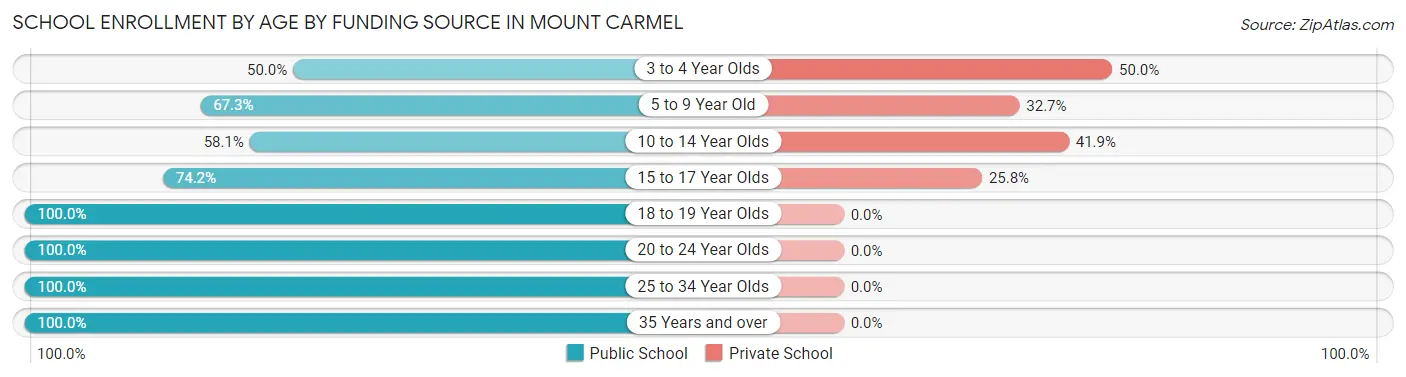
School Enrollment by Age by Funding Source in Mount Carmel
Out of a total of 938 students who are enrolled in schools in Mount Carmel, 265 (28.3%) attend a private institution, while the remaining 673 (71.7%) are enrolled in public schools. The age group of 3 to 4 year olds has the highest likelihood of being enrolled in private schools, with 8 (50.0% in the age bracket) enrolled. Conversely, the age group of 18 to 19 year olds has the lowest likelihood of being enrolled in a private school, with 75 (100.0% in the age bracket) attending a public institution.
| Age Bracket | Public School | Private School |
| 3 to 4 Year Olds | 8 (50.0%) | 8 (50.0%) |
| 5 to 9 Year Old | 146 (67.3%) | 71 (32.7%) |
| 10 to 14 Year Olds | 187 (58.1%) | 135 (41.9%) |
| 15 to 17 Year Olds | 147 (74.2%) | 51 (25.8%) |
| 18 to 19 Year Olds | 75 (100.0%) | 0 (0.0%) |
| 20 to 24 Year Olds | 91 (100.0%) | 0 (0.0%) |
| 25 to 34 Year Olds | 9 (100.0%) | 0 (0.0%) |
| 35 Years and over | 10 (100.0%) | 0 (0.0%) |
| Total | 673 (71.7%) | 265 (28.3%) |
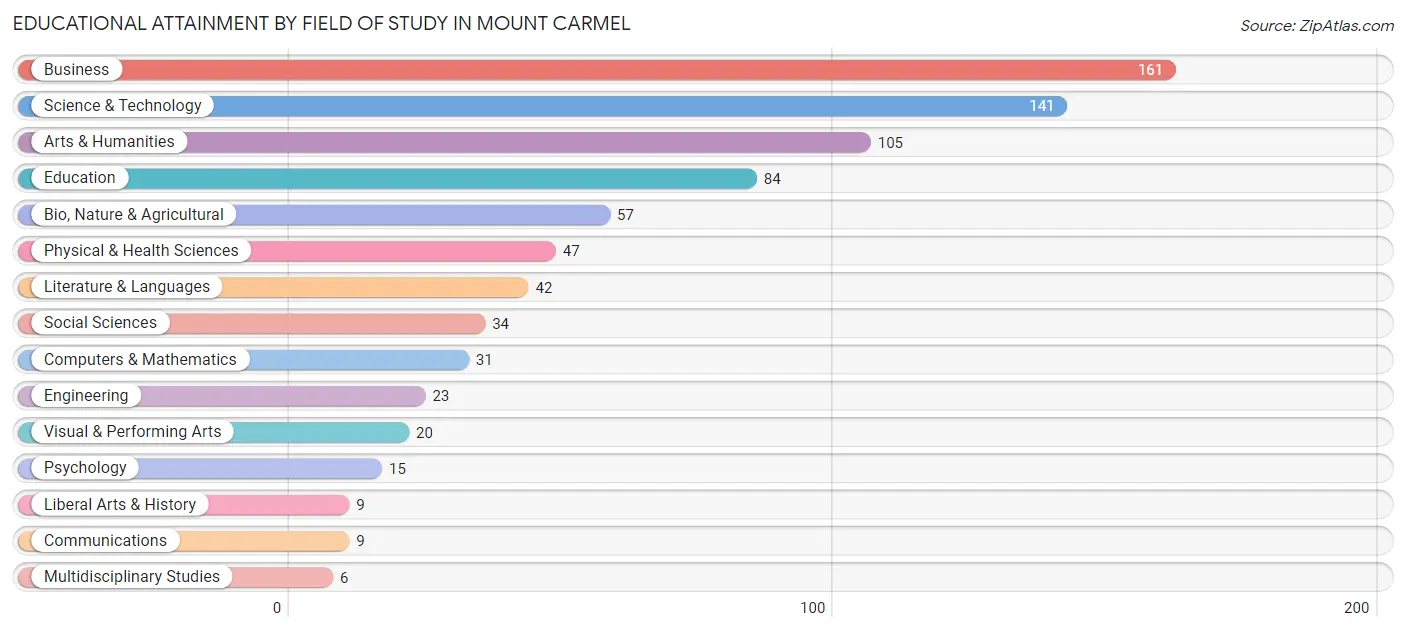
Educational Attainment by Field of Study in Mount Carmel
Business (161 | 20.5%), science & technology (141 | 18.0%), arts & humanities (105 | 13.4%), education (84 | 10.7%), and bio, nature & agricultural (57 | 7.3%) are the most common fields of study among 784 individuals in Mount Carmel who have obtained a bachelor's degree or higher.
| Field of Study | # Graduates | % Graduates |
| Computers & Mathematics | 31 | 4.0% |
| Bio, Nature & Agricultural | 57 | 7.3% |
| Physical & Health Sciences | 47 | 6.0% |
| Psychology | 15 | 1.9% |
| Social Sciences | 34 | 4.3% |
| Engineering | 23 | 2.9% |
| Multidisciplinary Studies | 6 | 0.8% |
| Science & Technology | 141 | 18.0% |
| Business | 161 | 20.5% |
| Education | 84 | 10.7% |
| Literature & Languages | 42 | 5.4% |
| Liberal Arts & History | 9 | 1.1% |
| Visual & Performing Arts | 20 | 2.5% |
| Communications | 9 | 1.1% |
| Arts & Humanities | 105 | 13.4% |
| Total | 784 | 100.0% |
Transportation & Commute in Mount Carmel
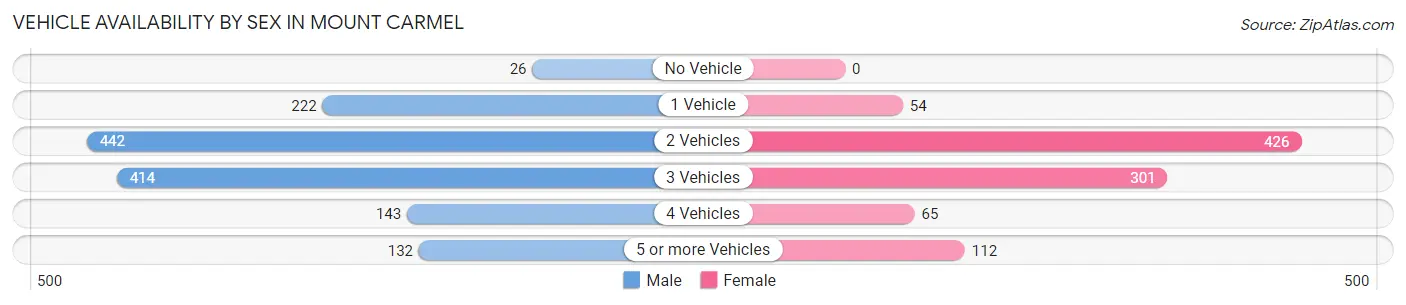
Vehicle Availability by Sex in Mount Carmel
The most prevalent vehicle ownership categories in Mount Carmel are males with 2 vehicles (442, accounting for 32.1%) and females with 2 vehicles (426, making up 46.1%).
| Vehicles Available | Male | Female |
| No Vehicle | 26 (1.9%) | 0 (0.0%) |
| 1 Vehicle | 222 (16.1%) | 54 (5.6%) |
| 2 Vehicles | 442 (32.1%) | 426 (44.5%) |
| 3 Vehicles | 414 (30.0%) | 301 (31.4%) |
| 4 Vehicles | 143 (10.4%) | 65 (6.8%) |
| 5 or more Vehicles | 132 (9.6%) | 112 (11.7%) |
| Total | 1,379 (100.0%) | 958 (100.0%) |
Commute Time in Mount Carmel
The most frequently occuring commute durations in Mount Carmel are 20 to 24 minutes (511 commuters, 24.4%), 25 to 29 minutes (336 commuters, 16.0%), and 15 to 19 minutes (272 commuters, 13.0%).
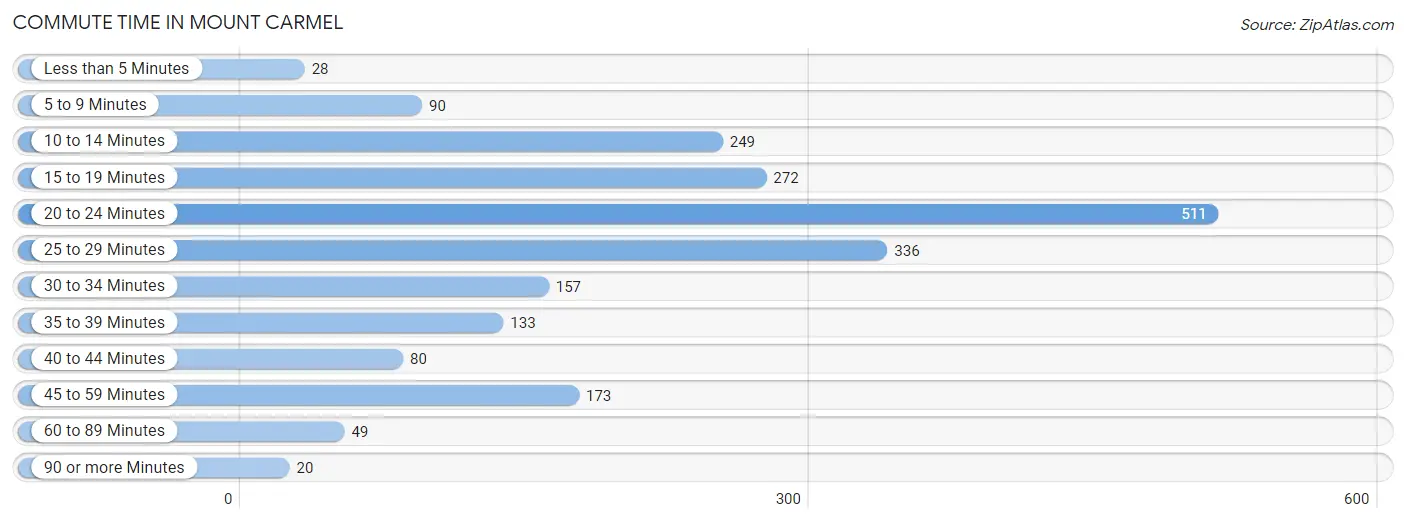
| Commute Time | # Commuters | % Commuters |
| Less than 5 Minutes | 28 | 1.3% |
| 5 to 9 Minutes | 90 | 4.3% |
| 10 to 14 Minutes | 249 | 11.9% |
| 15 to 19 Minutes | 272 | 13.0% |
| 20 to 24 Minutes | 511 | 24.4% |
| 25 to 29 Minutes | 336 | 16.0% |
| 30 to 34 Minutes | 157 | 7.5% |
| 35 to 39 Minutes | 133 | 6.3% |
| 40 to 44 Minutes | 80 | 3.8% |
| 45 to 59 Minutes | 173 | 8.3% |
| 60 to 89 Minutes | 49 | 2.3% |
| 90 or more Minutes | 20 | 0.9% |
Commute Time by Sex in Mount Carmel
The most common commute times in Mount Carmel are 25 to 29 minutes (243 commuters, 20.4%) for males and 20 to 24 minutes (293 commuters, 32.3%) for females.
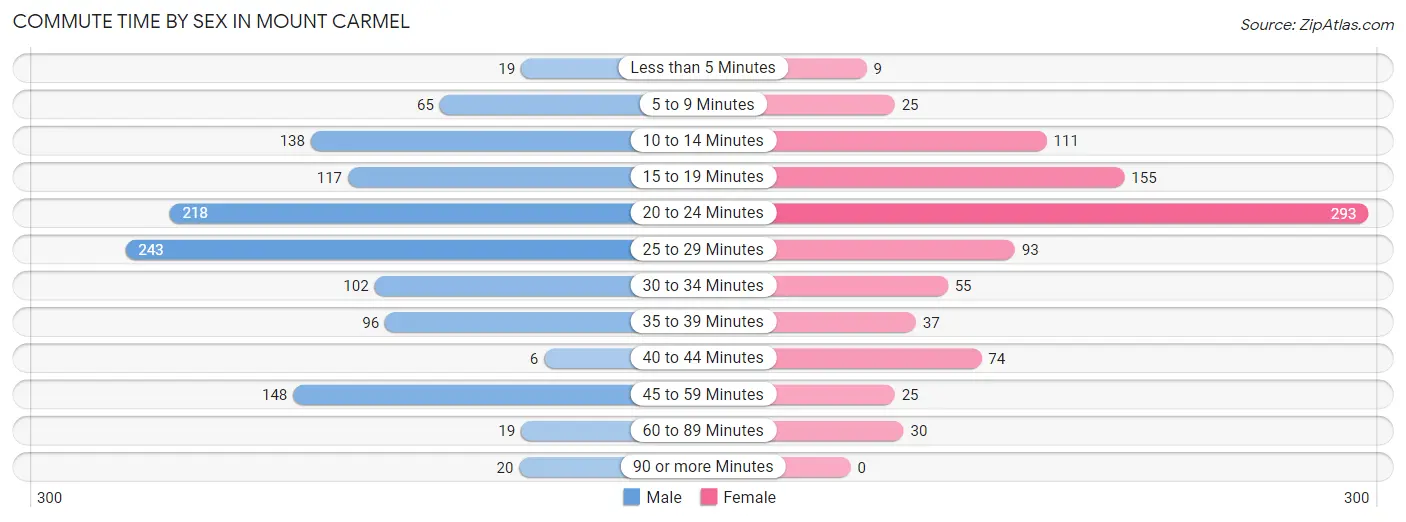
| Commute Time | Male | Female |
| Less than 5 Minutes | 19 (1.6%) | 9 (1.0%) |
| 5 to 9 Minutes | 65 (5.5%) | 25 (2.8%) |
| 10 to 14 Minutes | 138 (11.6%) | 111 (12.2%) |
| 15 to 19 Minutes | 117 (9.8%) | 155 (17.1%) |
| 20 to 24 Minutes | 218 (18.3%) | 293 (32.3%) |
| 25 to 29 Minutes | 243 (20.4%) | 93 (10.2%) |
| 30 to 34 Minutes | 102 (8.6%) | 55 (6.1%) |
| 35 to 39 Minutes | 96 (8.1%) | 37 (4.1%) |
| 40 to 44 Minutes | 6 (0.5%) | 74 (8.2%) |
| 45 to 59 Minutes | 148 (12.4%) | 25 (2.8%) |
| 60 to 89 Minutes | 19 (1.6%) | 30 (3.3%) |
| 90 or more Minutes | 20 (1.7%) | 0 (0.0%) |
Time of Departure to Work by Sex in Mount Carmel
The most frequent times of departure to work in Mount Carmel are 12:00 PM to 3:59 PM (196, 16.5%) for males and 7:00 AM to 7:29 AM (153, 16.9%) for females.
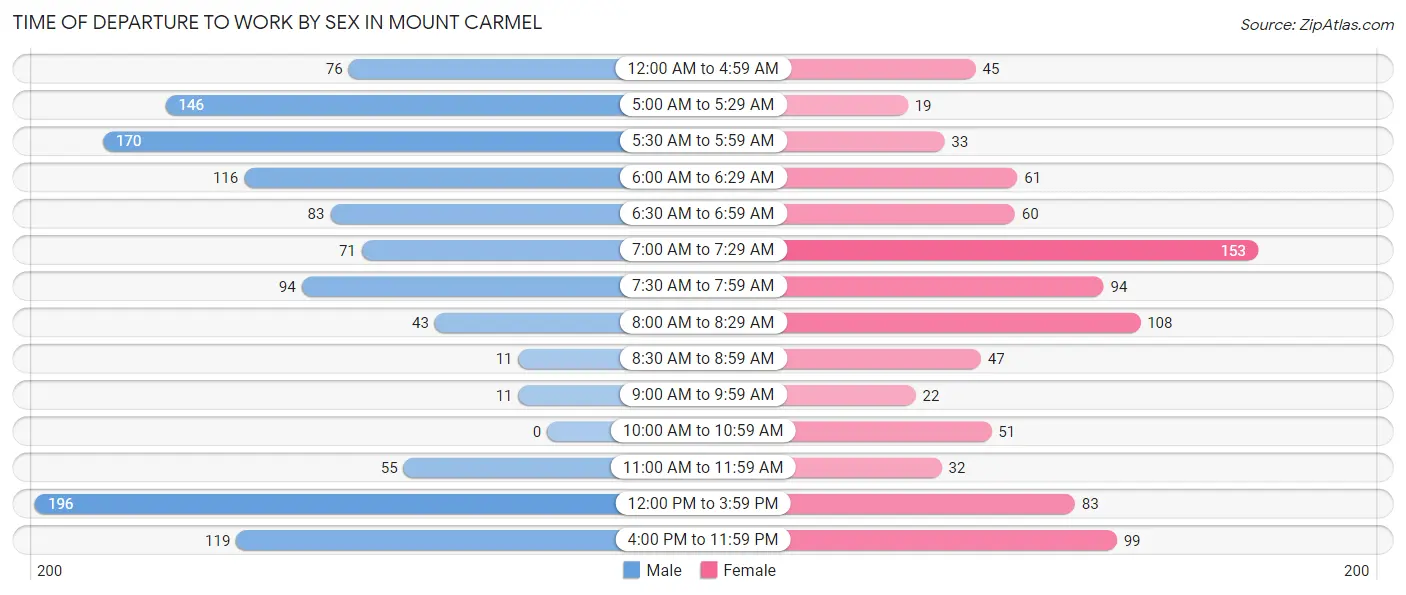
| Time of Departure | Male | Female |
| 12:00 AM to 4:59 AM | 76 (6.4%) | 45 (5.0%) |
| 5:00 AM to 5:29 AM | 146 (12.3%) | 19 (2.1%) |
| 5:30 AM to 5:59 AM | 170 (14.3%) | 33 (3.6%) |
| 6:00 AM to 6:29 AM | 116 (9.7%) | 61 (6.7%) |
| 6:30 AM to 6:59 AM | 83 (7.0%) | 60 (6.6%) |
| 7:00 AM to 7:29 AM | 71 (6.0%) | 153 (16.9%) |
| 7:30 AM to 7:59 AM | 94 (7.9%) | 94 (10.4%) |
| 8:00 AM to 8:29 AM | 43 (3.6%) | 108 (11.9%) |
| 8:30 AM to 8:59 AM | 11 (0.9%) | 47 (5.2%) |
| 9:00 AM to 9:59 AM | 11 (0.9%) | 22 (2.4%) |
| 10:00 AM to 10:59 AM | 0 (0.0%) | 51 (5.6%) |
| 11:00 AM to 11:59 AM | 55 (4.6%) | 32 (3.5%) |
| 12:00 PM to 3:59 PM | 196 (16.5%) | 83 (9.1%) |
| 4:00 PM to 11:59 PM | 119 (10.0%) | 99 (10.9%) |
| Total | 1,191 (100.0%) | 907 (100.0%) |
Housing Occupancy in Mount Carmel
Occupancy by Ownership in Mount Carmel
Of the total 2,119 dwellings in Mount Carmel, owner-occupied units account for 1,829 (86.3%), while renter-occupied units make up 290 (13.7%).
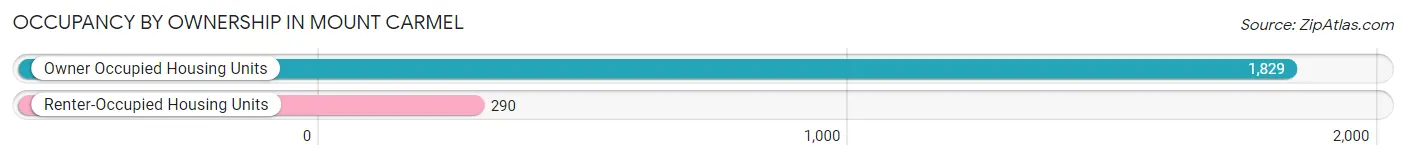
| Occupancy | # Housing Units | % Housing Units |
| Owner Occupied Housing Units | 1,829 | 86.3% |
| Renter-Occupied Housing Units | 290 | 13.7% |
| Total Occupied Housing Units | 2,119 | 100.0% |
Occupancy by Household Size in Mount Carmel
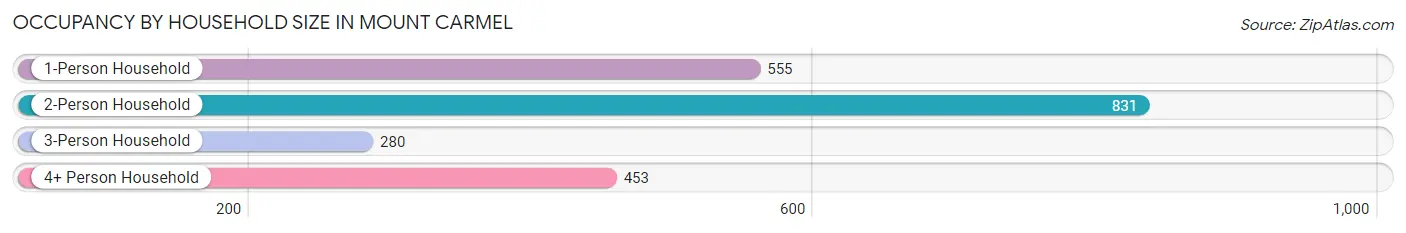
| Household Size | # Housing Units | % Housing Units |
| 1-Person Household | 555 | 26.2% |
| 2-Person Household | 831 | 39.2% |
| 3-Person Household | 280 | 13.2% |
| 4+ Person Household | 453 | 21.4% |
| Total Housing Units | 2,119 | 100.0% |
Occupancy by Ownership by Household Size in Mount Carmel
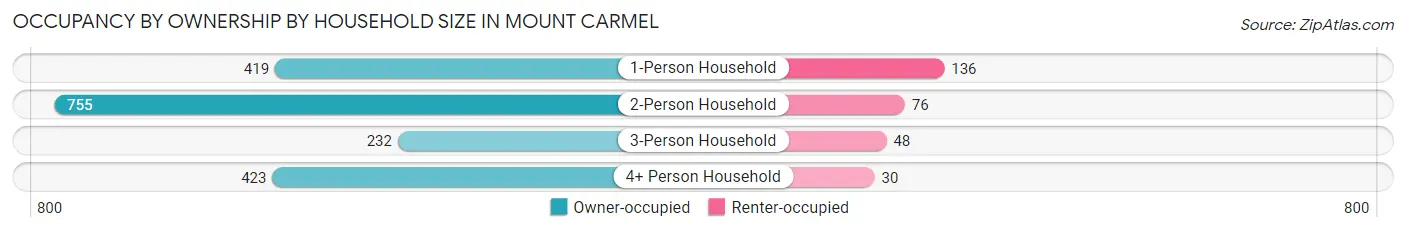
| Household Size | Owner-occupied | Renter-occupied |
| 1-Person Household | 419 (75.5%) | 136 (24.5%) |
| 2-Person Household | 755 (90.8%) | 76 (9.1%) |
| 3-Person Household | 232 (82.9%) | 48 (17.1%) |
| 4+ Person Household | 423 (93.4%) | 30 (6.6%) |
| Total Housing Units | 1,829 (86.3%) | 290 (13.7%) |
Occupancy by Educational Attainment in Mount Carmel
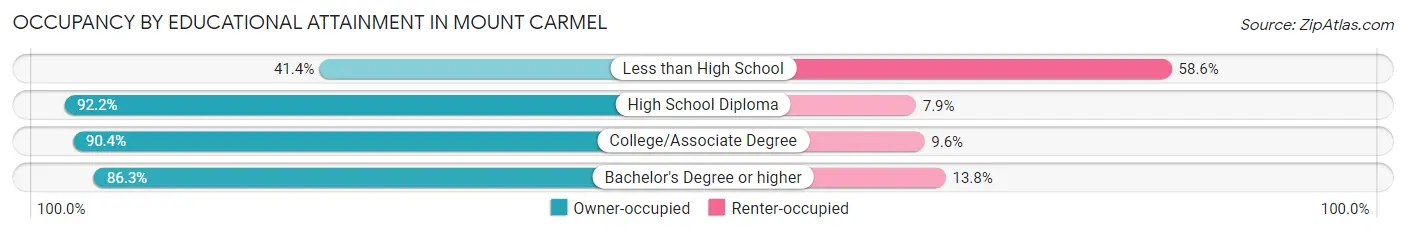
| Household Size | Owner-occupied | Renter-occupied |
| Less than High School | 70 (41.4%) | 99 (58.6%) |
| High School Diploma | 657 (92.1%) | 56 (7.9%) |
| College/Associate Degree | 757 (90.4%) | 80 (9.6%) |
| Bachelor's Degree or higher | 345 (86.3%) | 55 (13.8%) |
Occupancy by Age of Householder in Mount Carmel
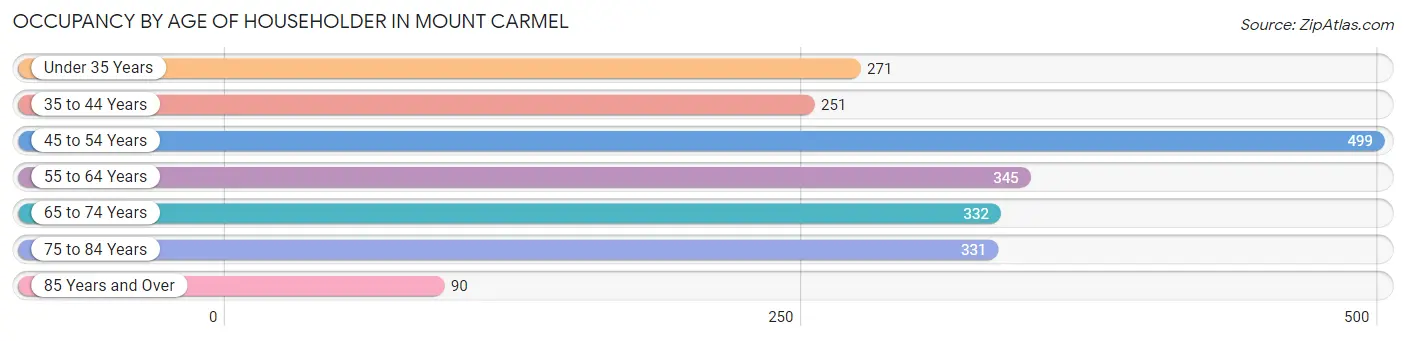
| Age Bracket | # Households | % Households |
| Under 35 Years | 271 | 12.8% |
| 35 to 44 Years | 251 | 11.8% |
| 45 to 54 Years | 499 | 23.5% |
| 55 to 64 Years | 345 | 16.3% |
| 65 to 74 Years | 332 | 15.7% |
| 75 to 84 Years | 331 | 15.6% |
| 85 Years and Over | 90 | 4.3% |
| Total | 2,119 | 100.0% |
Housing Finances in Mount Carmel
Median Income by Occupancy in Mount Carmel
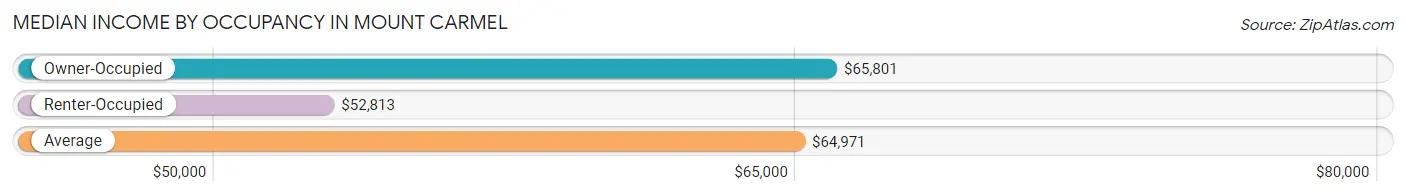
| Occupancy Type | # Households | Median Income |
| Owner-Occupied | 1,829 (86.3%) | $65,801 |
| Renter-Occupied | 290 (13.7%) | $52,813 |
| Average | 2,119 (100.0%) | $64,971 |
Occupancy by Householder Income Bracket in Mount Carmel
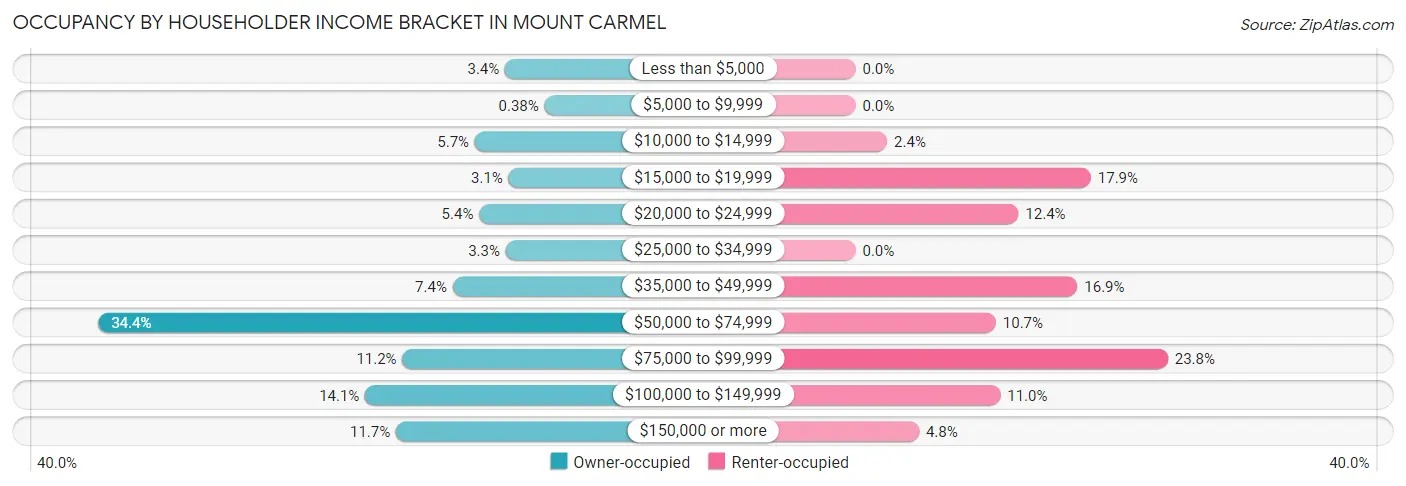
| Income Bracket | Owner-occupied | Renter-occupied |
| Less than $5,000 | 62 (3.4%) | 0 (0.0%) |
| $5,000 to $9,999 | 7 (0.4%) | 0 (0.0%) |
| $10,000 to $14,999 | 104 (5.7%) | 7 (2.4%) |
| $15,000 to $19,999 | 57 (3.1%) | 52 (17.9%) |
| $20,000 to $24,999 | 98 (5.4%) | 36 (12.4%) |
| $25,000 to $34,999 | 61 (3.3%) | 0 (0.0%) |
| $35,000 to $49,999 | 135 (7.4%) | 49 (16.9%) |
| $50,000 to $74,999 | 629 (34.4%) | 31 (10.7%) |
| $75,000 to $99,999 | 205 (11.2%) | 69 (23.8%) |
| $100,000 to $149,999 | 257 (14.1%) | 32 (11.0%) |
| $150,000 or more | 214 (11.7%) | 14 (4.8%) |
| Total | 1,829 (100.0%) | 290 (100.0%) |
Monthly Housing Cost Tiers in Mount Carmel
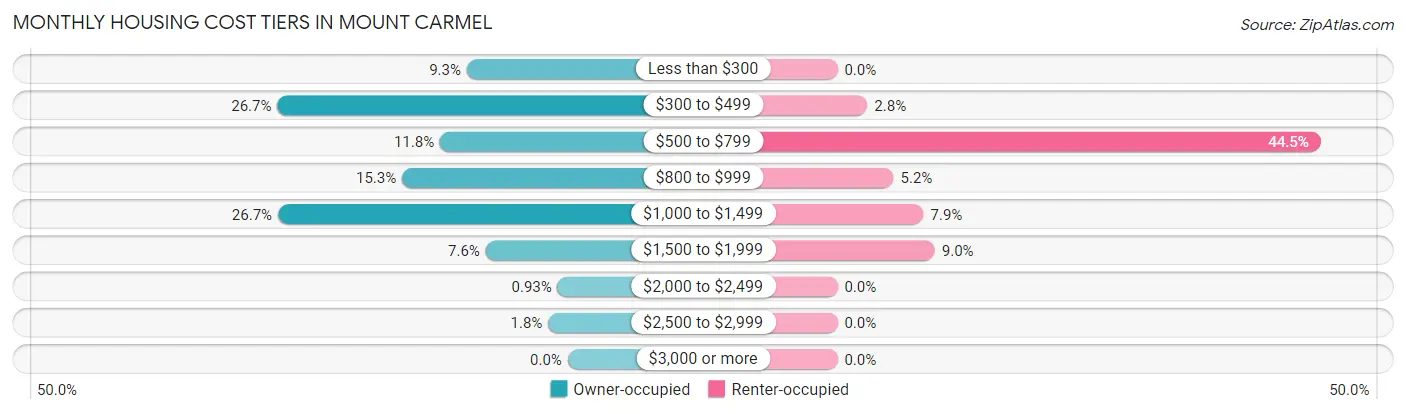
| Monthly Cost | Owner-occupied | Renter-occupied |
| Less than $300 | 170 (9.3%) | 0 (0.0%) |
| $300 to $499 | 489 (26.7%) | 8 (2.8%) |
| $500 to $799 | 215 (11.8%) | 129 (44.5%) |
| $800 to $999 | 279 (15.2%) | 15 (5.2%) |
| $1,000 to $1,499 | 488 (26.7%) | 23 (7.9%) |
| $1,500 to $1,999 | 138 (7.5%) | 26 (9.0%) |
| $2,000 to $2,499 | 17 (0.9%) | 0 (0.0%) |
| $2,500 to $2,999 | 33 (1.8%) | 0 (0.0%) |
| $3,000 or more | 0 (0.0%) | 0 (0.0%) |
| Total | 1,829 (100.0%) | 290 (100.0%) |
Physical Housing Characteristics in Mount Carmel
Housing Structures in Mount Carmel
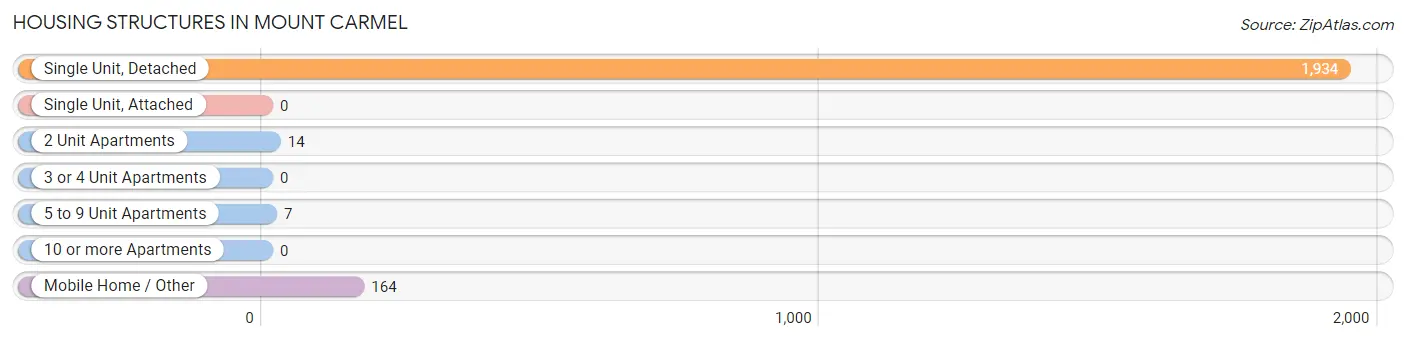
| Structure Type | # Housing Units | % Housing Units |
| Single Unit, Detached | 1,934 | 91.3% |
| Single Unit, Attached | 0 | 0.0% |
| 2 Unit Apartments | 14 | 0.7% |
| 3 or 4 Unit Apartments | 0 | 0.0% |
| 5 to 9 Unit Apartments | 7 | 0.3% |
| 10 or more Apartments | 0 | 0.0% |
| Mobile Home / Other | 164 | 7.7% |
| Total | 2,119 | 100.0% |
Housing Structures by Occupancy in Mount Carmel
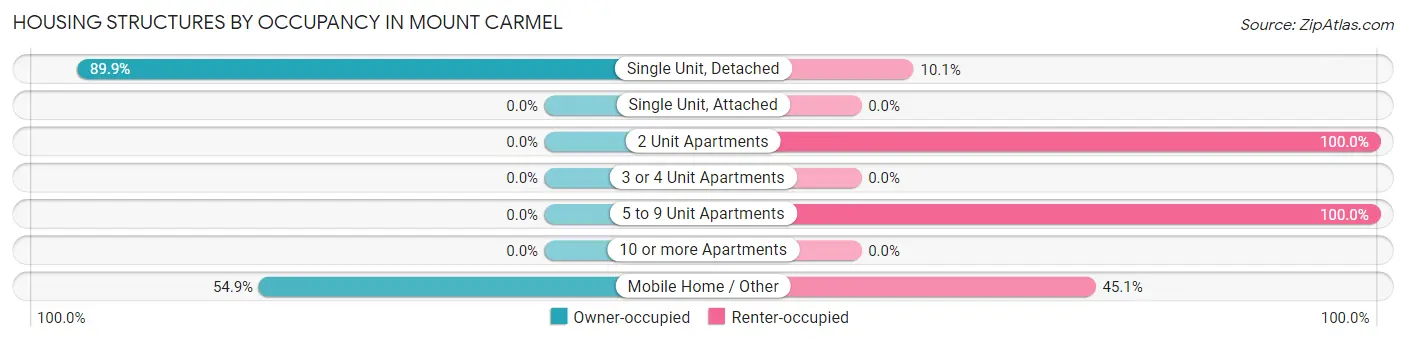
| Structure Type | Owner-occupied | Renter-occupied |
| Single Unit, Detached | 1,739 (89.9%) | 195 (10.1%) |
| Single Unit, Attached | 0 (0.0%) | 0 (0.0%) |
| 2 Unit Apartments | 0 (0.0%) | 14 (100.0%) |
| 3 or 4 Unit Apartments | 0 (0.0%) | 0 (0.0%) |
| 5 to 9 Unit Apartments | 0 (0.0%) | 7 (100.0%) |
| 10 or more Apartments | 0 (0.0%) | 0 (0.0%) |
| Mobile Home / Other | 90 (54.9%) | 74 (45.1%) |
| Total | 1,829 (86.3%) | 290 (13.7%) |
Housing Structures by Number of Rooms in Mount Carmel
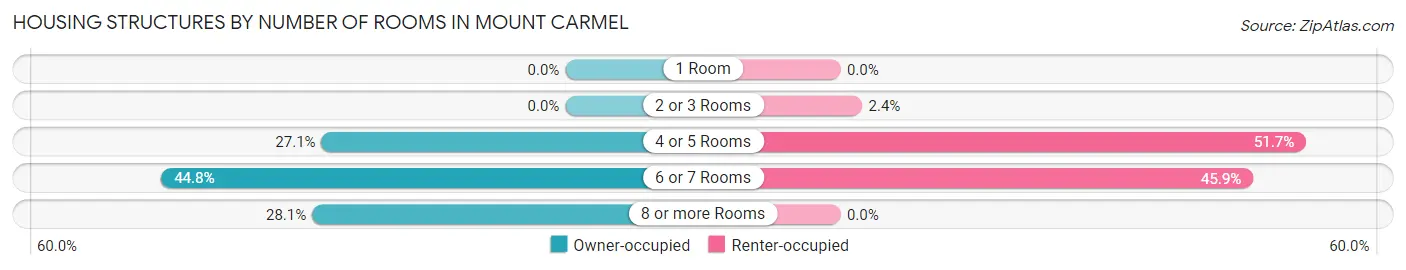
| Number of Rooms | Owner-occupied | Renter-occupied |
| 1 Room | 0 (0.0%) | 0 (0.0%) |
| 2 or 3 Rooms | 0 (0.0%) | 7 (2.4%) |
| 4 or 5 Rooms | 495 (27.1%) | 150 (51.7%) |
| 6 or 7 Rooms | 820 (44.8%) | 133 (45.9%) |
| 8 or more Rooms | 514 (28.1%) | 0 (0.0%) |
| Total | 1,829 (100.0%) | 290 (100.0%) |
Housing Structure by Heating Type in Mount Carmel
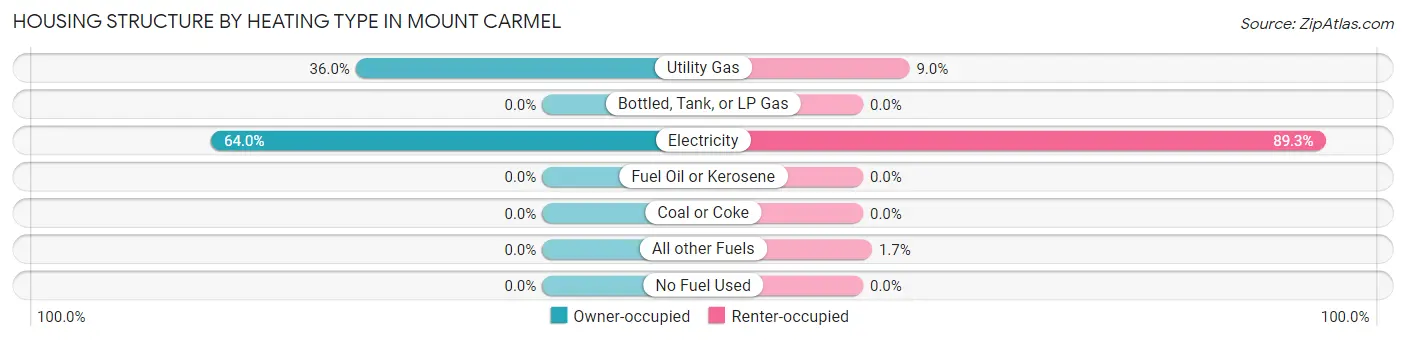
| Heating Type | Owner-occupied | Renter-occupied |
| Utility Gas | 659 (36.0%) | 26 (9.0%) |
| Bottled, Tank, or LP Gas | 0 (0.0%) | 0 (0.0%) |
| Electricity | 1,170 (64.0%) | 259 (89.3%) |
| Fuel Oil or Kerosene | 0 (0.0%) | 0 (0.0%) |
| Coal or Coke | 0 (0.0%) | 0 (0.0%) |
| All other Fuels | 0 (0.0%) | 5 (1.7%) |
| No Fuel Used | 0 (0.0%) | 0 (0.0%) |
| Total | 1,829 (100.0%) | 290 (100.0%) |
Household Vehicle Usage in Mount Carmel
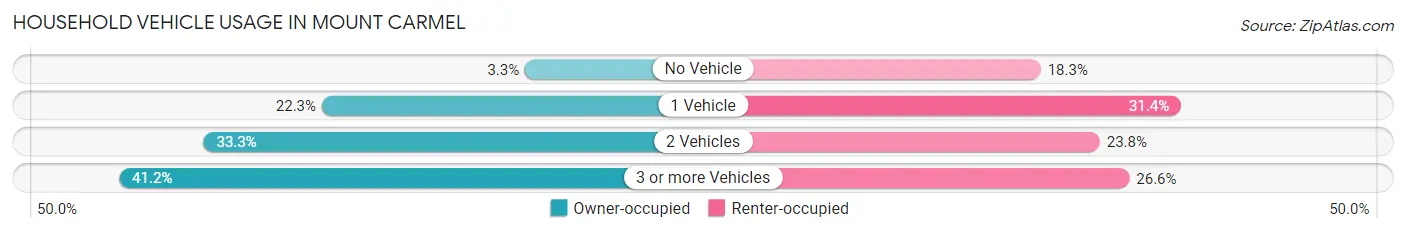
| Vehicles per Household | Owner-occupied | Renter-occupied |
| No Vehicle | 60 (3.3%) | 53 (18.3%) |
| 1 Vehicle | 407 (22.3%) | 91 (31.4%) |
| 2 Vehicles | 609 (33.3%) | 69 (23.8%) |
| 3 or more Vehicles | 753 (41.2%) | 77 (26.6%) |
| Total | 1,829 (100.0%) | 290 (100.0%) |
Real Estate & Mortgages in Mount Carmel
Real Estate and Mortgage Overview in Mount Carmel
| Characteristic | Without Mortgage | With Mortgage |
| Housing Units | 775 | 1,054 |
| Median Property Value | $165,200 | $177,100 |
| Median Household Income | $58,750 | $159 |
| Monthly Housing Costs | $405 | $0 |
| Real Estate Taxes | $1,433 | $0 |
Property Value by Mortgage Status in Mount Carmel
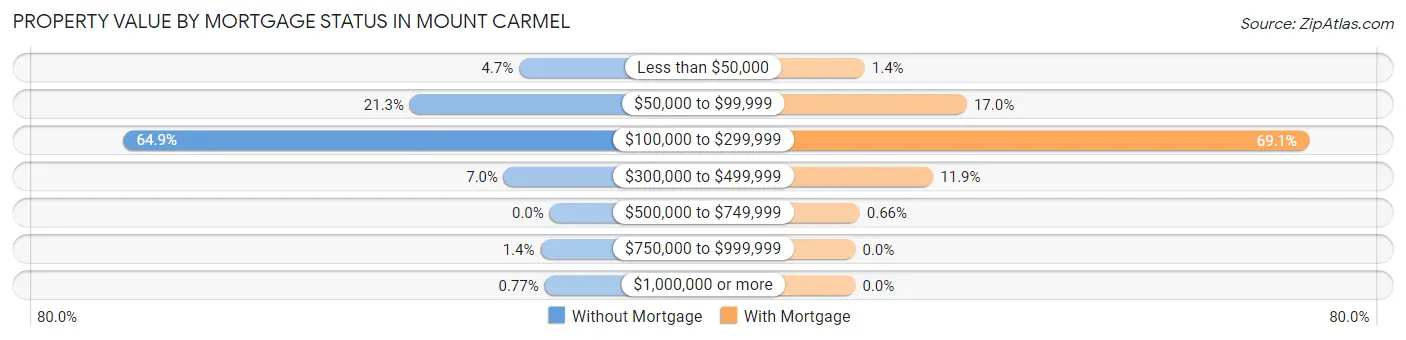
| Property Value | Without Mortgage | With Mortgage |
| Less than $50,000 | 36 (4.6%) | 15 (1.4%) |
| $50,000 to $99,999 | 165 (21.3%) | 179 (17.0%) |
| $100,000 to $299,999 | 503 (64.9%) | 728 (69.1%) |
| $300,000 to $499,999 | 54 (7.0%) | 125 (11.9%) |
| $500,000 to $749,999 | 0 (0.0%) | 7 (0.7%) |
| $750,000 to $999,999 | 11 (1.4%) | 0 (0.0%) |
| $1,000,000 or more | 6 (0.8%) | 0 (0.0%) |
| Total | 775 (100.0%) | 1,054 (100.0%) |
Household Income by Mortgage Status in Mount Carmel
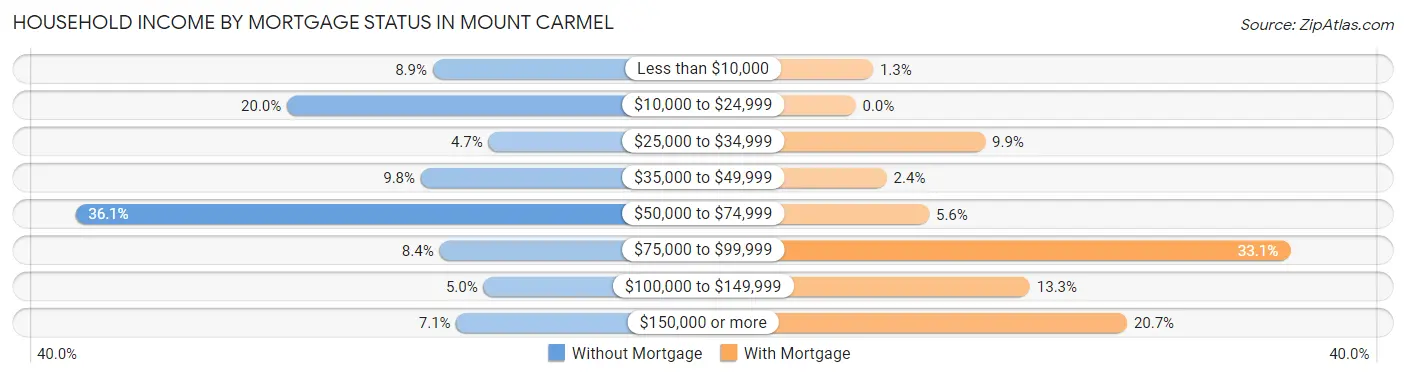
| Household Income | Without Mortgage | With Mortgage |
| Less than $10,000 | 69 (8.9%) | 14 (1.3%) |
| $10,000 to $24,999 | 155 (20.0%) | 0 (0.0%) |
| $25,000 to $34,999 | 36 (4.6%) | 104 (9.9%) |
| $35,000 to $49,999 | 76 (9.8%) | 25 (2.4%) |
| $50,000 to $74,999 | 280 (36.1%) | 59 (5.6%) |
| $75,000 to $99,999 | 65 (8.4%) | 349 (33.1%) |
| $100,000 to $149,999 | 39 (5.0%) | 140 (13.3%) |
| $150,000 or more | 55 (7.1%) | 218 (20.7%) |
| Total | 775 (100.0%) | 1,054 (100.0%) |
Property Value to Household Income Ratio in Mount Carmel
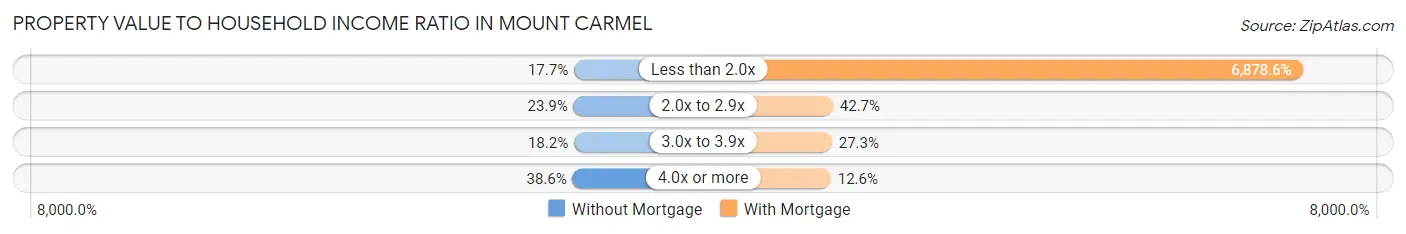
| Value-to-Income Ratio | Without Mortgage | With Mortgage |
| Less than 2.0x | 137 (17.7%) | 72,500 (6,878.6%) |
| 2.0x to 2.9x | 185 (23.9%) | 450 (42.7%) |
| 3.0x to 3.9x | 141 (18.2%) | 288 (27.3%) |
| 4.0x or more | 299 (38.6%) | 133 (12.6%) |
| Total | 775 (100.0%) | 1,054 (100.0%) |
Real Estate Taxes by Mortgage Status in Mount Carmel
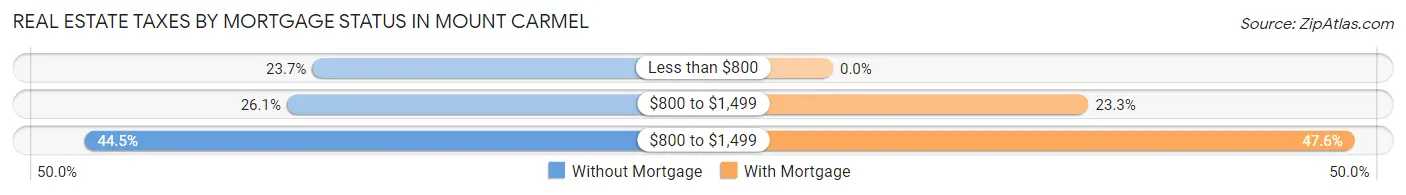
| Property Taxes | Without Mortgage | With Mortgage |
| Less than $800 | 184 (23.7%) | 0 (0.0%) |
| $800 to $1,499 | 202 (26.1%) | 246 (23.3%) |
| $800 to $1,499 | 345 (44.5%) | 502 (47.6%) |
| Total | 775 (100.0%) | 1,054 (100.0%) |
Health & Disability in Mount Carmel
Health Insurance Coverage by Age in Mount Carmel
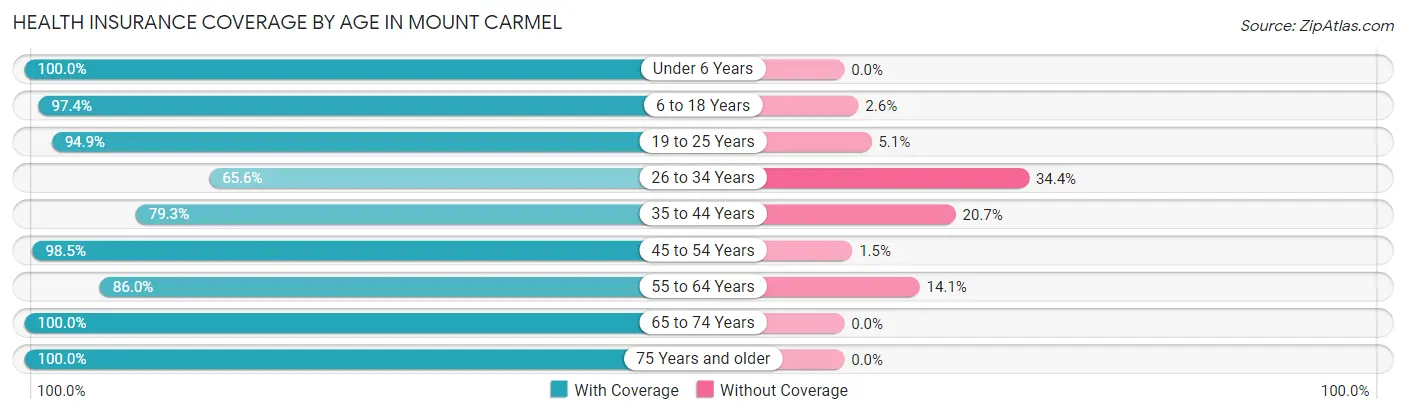
| Age Bracket | With Coverage | Without Coverage |
| Under 6 Years | 352 (100.0%) | 0 (0.0%) |
| 6 to 18 Years | 740 (97.4%) | 20 (2.6%) |
| 19 to 25 Years | 469 (94.9%) | 25 (5.1%) |
| 26 to 34 Years | 499 (65.6%) | 262 (34.4%) |
| 35 to 44 Years | 409 (79.3%) | 107 (20.7%) |
| 45 to 54 Years | 863 (98.5%) | 13 (1.5%) |
| 55 to 64 Years | 581 (86.0%) | 95 (14.1%) |
| 65 to 74 Years | 453 (100.0%) | 0 (0.0%) |
| 75 Years and older | 588 (100.0%) | 0 (0.0%) |
| Total | 4,954 (90.5%) | 522 (9.5%) |
Health Insurance Coverage by Citizenship Status in Mount Carmel
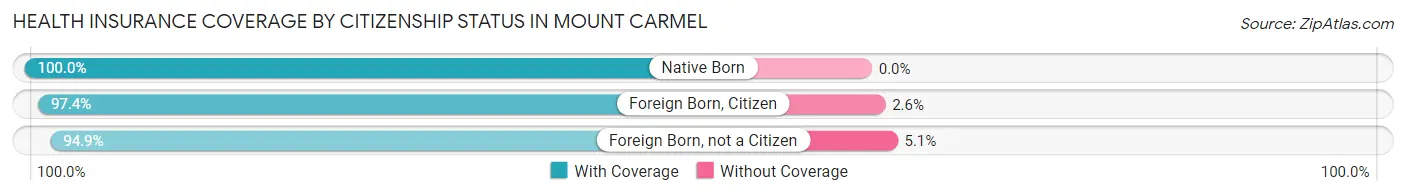
| Citizenship Status | With Coverage | Without Coverage |
| Native Born | 352 (100.0%) | 0 (0.0%) |
| Foreign Born, Citizen | 740 (97.4%) | 20 (2.6%) |
| Foreign Born, not a Citizen | 469 (94.9%) | 25 (5.1%) |
Health Insurance Coverage by Household Income in Mount Carmel
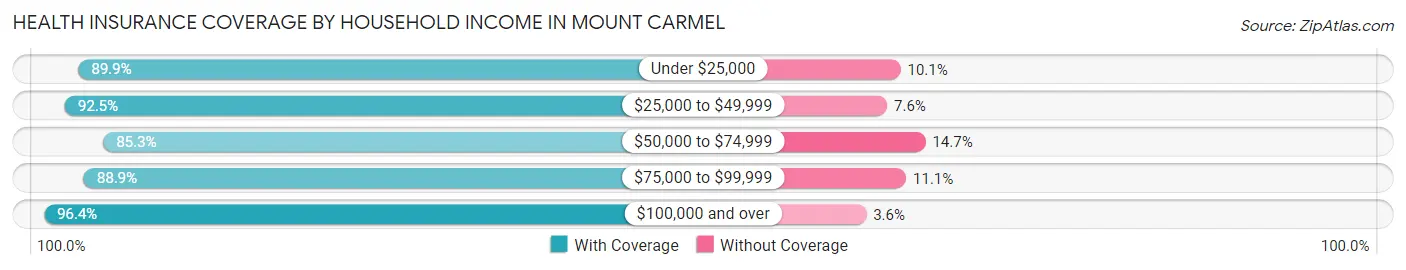
| Household Income | With Coverage | Without Coverage |
| Under $25,000 | 491 (89.9%) | 55 (10.1%) |
| $25,000 to $49,999 | 453 (92.4%) | 37 (7.5%) |
| $50,000 to $74,999 | 1,706 (85.3%) | 295 (14.7%) |
| $75,000 to $99,999 | 552 (88.9%) | 69 (11.1%) |
| $100,000 and over | 1,751 (96.4%) | 66 (3.6%) |
Public vs Private Health Insurance Coverage by Age in Mount Carmel
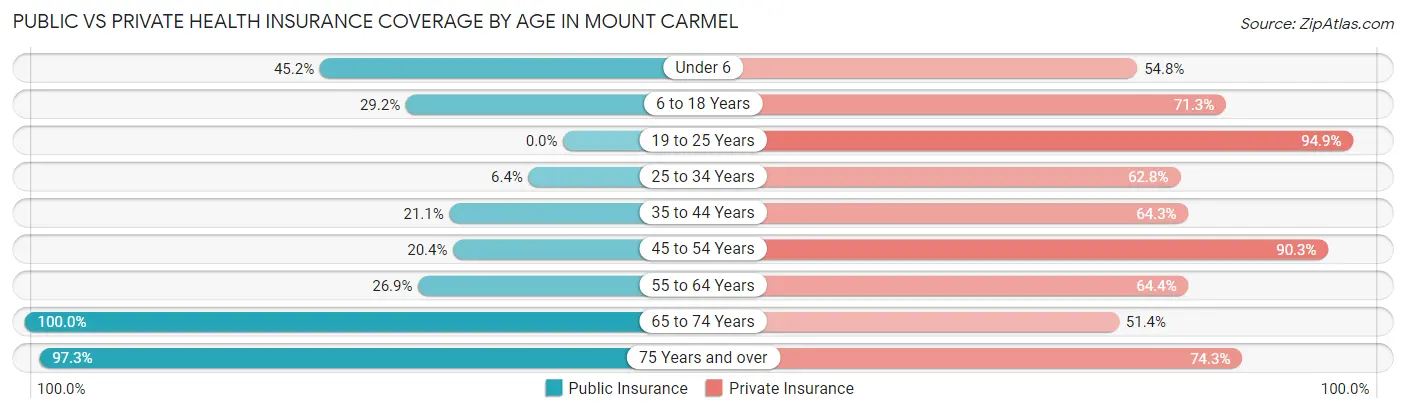
| Age Bracket | Public Insurance | Private Insurance |
| Under 6 | 159 (45.2%) | 193 (54.8%) |
| 6 to 18 Years | 222 (29.2%) | 542 (71.3%) |
| 19 to 25 Years | 0 (0.0%) | 469 (94.9%) |
| 25 to 34 Years | 49 (6.4%) | 478 (62.8%) |
| 35 to 44 Years | 109 (21.1%) | 332 (64.3%) |
| 45 to 54 Years | 179 (20.4%) | 791 (90.3%) |
| 55 to 64 Years | 182 (26.9%) | 435 (64.3%) |
| 65 to 74 Years | 453 (100.0%) | 233 (51.4%) |
| 75 Years and over | 572 (97.3%) | 437 (74.3%) |
| Total | 1,925 (35.1%) | 3,910 (71.4%) |
Disability Status by Sex by Age in Mount Carmel
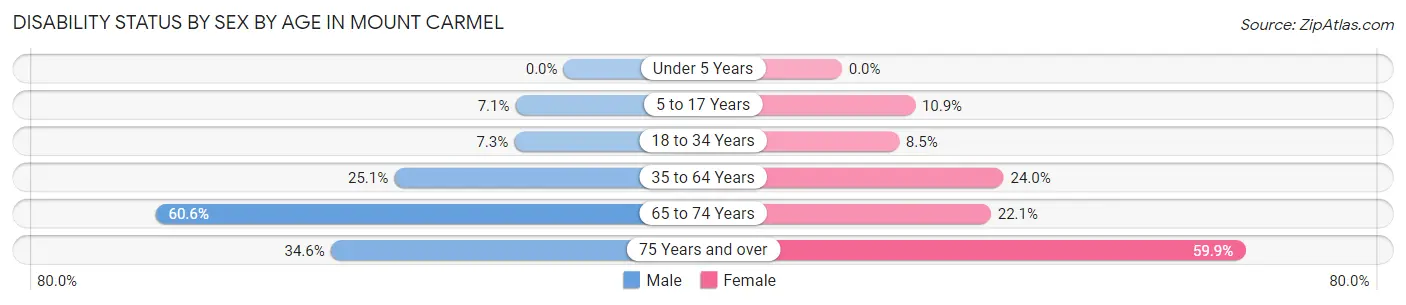
| Age Bracket | Male | Female |
| Under 5 Years | 0 (0.0%) | 0 (0.0%) |
| 5 to 17 Years | 24 (7.1%) | 49 (10.9%) |
| 18 to 34 Years | 48 (7.3%) | 54 (8.5%) |
| 35 to 64 Years | 275 (25.1%) | 234 (24.0%) |
| 65 to 74 Years | 132 (60.6%) | 52 (22.1%) |
| 75 Years and over | 93 (34.6%) | 191 (59.9%) |
Disability Class by Sex by Age in Mount Carmel
Disability Class: Hearing Difficulty
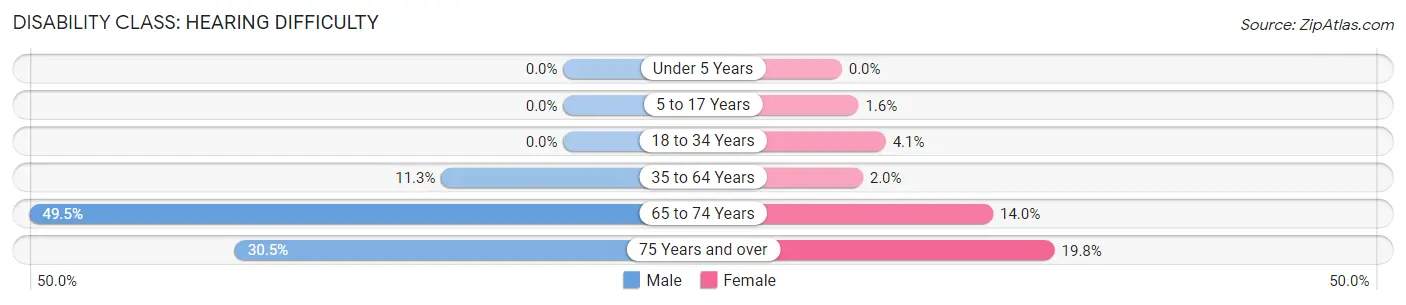
| Age Bracket | Male | Female |
| Under 5 Years | 0 (0.0%) | 0 (0.0%) |
| 5 to 17 Years | 0 (0.0%) | 7 (1.5%) |
| 18 to 34 Years | 0 (0.0%) | 26 (4.1%) |
| 35 to 64 Years | 124 (11.3%) | 19 (1.9%) |
| 65 to 74 Years | 108 (49.5%) | 33 (14.0%) |
| 75 Years and over | 82 (30.5%) | 63 (19.8%) |
Disability Class: Vision Difficulty
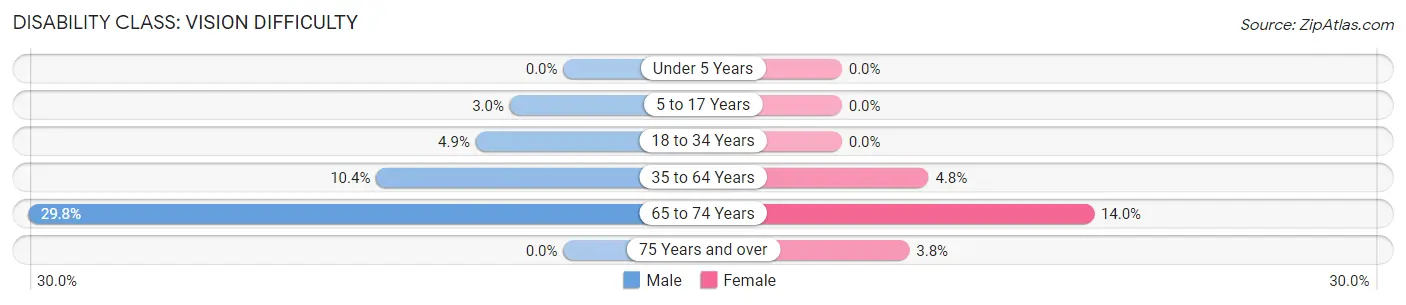
| Age Bracket | Male | Female |
| Under 5 Years | 0 (0.0%) | 0 (0.0%) |
| 5 to 17 Years | 10 (3.0%) | 0 (0.0%) |
| 18 to 34 Years | 32 (4.9%) | 0 (0.0%) |
| 35 to 64 Years | 114 (10.4%) | 47 (4.8%) |
| 65 to 74 Years | 65 (29.8%) | 33 (14.0%) |
| 75 Years and over | 0 (0.0%) | 12 (3.8%) |
Disability Class: Cognitive Difficulty
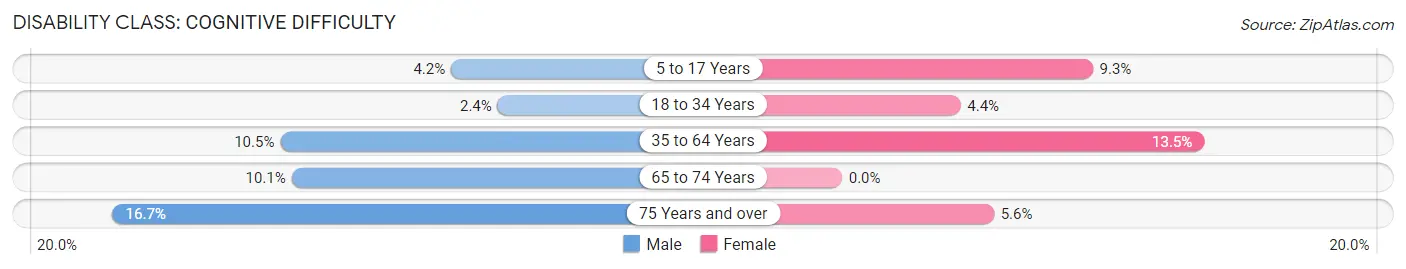
| Age Bracket | Male | Female |
| 5 to 17 Years | 14 (4.2%) | 42 (9.3%) |
| 18 to 34 Years | 16 (2.4%) | 28 (4.4%) |
| 35 to 64 Years | 115 (10.5%) | 131 (13.5%) |
| 65 to 74 Years | 22 (10.1%) | 0 (0.0%) |
| 75 Years and over | 45 (16.7%) | 18 (5.6%) |
Disability Class: Ambulatory Difficulty
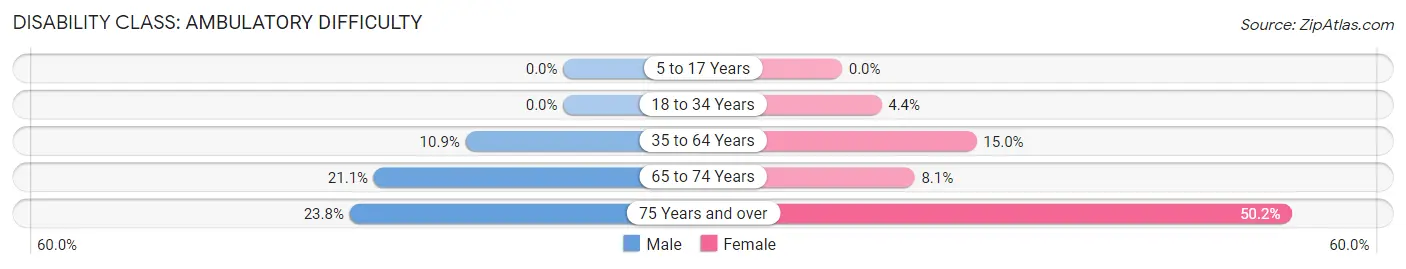
| Age Bracket | Male | Female |
| 5 to 17 Years | 0 (0.0%) | 0 (0.0%) |
| 18 to 34 Years | 0 (0.0%) | 28 (4.4%) |
| 35 to 64 Years | 119 (10.9%) | 146 (15.0%) |
| 65 to 74 Years | 46 (21.1%) | 19 (8.1%) |
| 75 Years and over | 64 (23.8%) | 160 (50.2%) |
Disability Class: Self-Care Difficulty
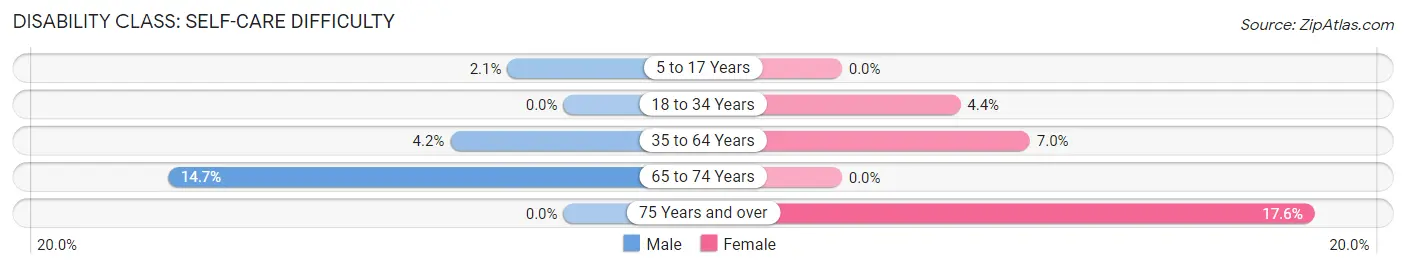
| Age Bracket | Male | Female |
| 5 to 17 Years | 7 (2.1%) | 0 (0.0%) |
| 18 to 34 Years | 0 (0.0%) | 28 (4.4%) |
| 35 to 64 Years | 46 (4.2%) | 68 (7.0%) |
| 65 to 74 Years | 32 (14.7%) | 0 (0.0%) |
| 75 Years and over | 0 (0.0%) | 56 (17.5%) |
Technology Access in Mount Carmel
Computing Device Access in Mount Carmel
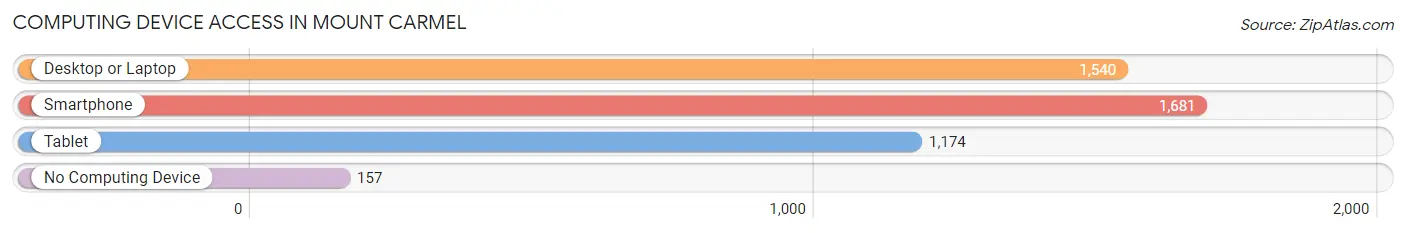
| Device Type | # Households | % Households |
| Desktop or Laptop | 1,540 | 72.7% |
| Smartphone | 1,681 | 79.3% |
| Tablet | 1,174 | 55.4% |
| No Computing Device | 157 | 7.4% |
| Total | 2,119 | 100.0% |
Internet Access in Mount Carmel
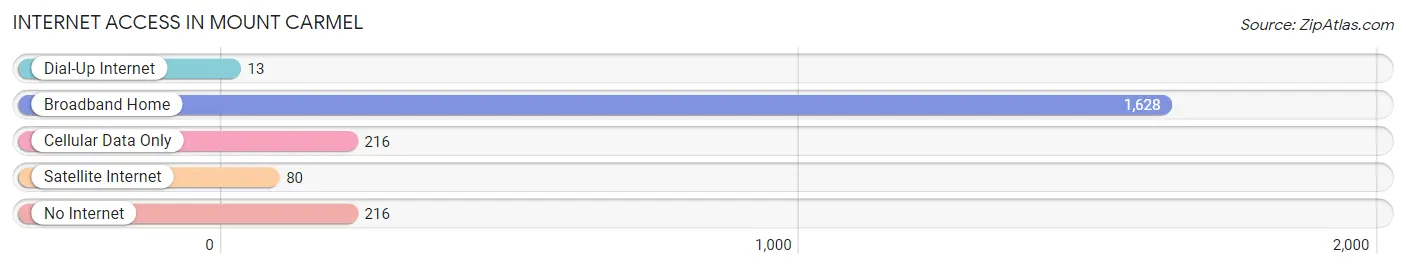
| Internet Type | # Households | % Households |
| Dial-Up Internet | 13 | 0.6% |
| Broadband Home | 1,628 | 76.8% |
| Cellular Data Only | 216 | 10.2% |
| Satellite Internet | 80 | 3.8% |
| No Internet | 216 | 10.2% |
| Total | 2,119 | 100.0% |
Mount Carmel Summary
Carmel, Tennessee is a small town located in Hawkins County, in the northeastern part of the state. It is situated on the banks of the Holston River, and is part of the Kingsport-Bristol-Bristol metropolitan area. The town has a population of approximately 1,000 people, and is known for its rural charm and small-town atmosphere.
History
The area that is now Carmel was first settled in the late 1700s by a group of settlers from North Carolina. The town was originally known as “Carmel”, after the biblical Mount Carmel. The town was officially incorporated in 1883, and the first post office was established in 1884.
In the early 1900s, the town was a thriving agricultural center, with a number of farms and businesses. The town was also home to a number of churches, including the First Baptist Church of Carmel, which was founded in 1887.
In the mid-1900s, the town began to decline as the local economy shifted away from agriculture. The town’s population began to decline, and many of the businesses and churches closed. In the late 1970s, the town was revitalized with the opening of a new industrial park, which brought new jobs and businesses to the area.
Geography
Carmel is located in Hawkins County, in the northeastern part of the state. It is situated on the banks of the Holston River, and is part of the Kingsport-Bristol-Bristol metropolitan area. The town has a total area of 1.2 square miles, all of which is land.
The town is located in a hilly region, with elevations ranging from 1,000 to 1,500 feet above sea level. The climate is humid subtropical, with hot, humid summers and mild winters.
Economy
The economy of Carmel is largely based on agriculture and manufacturing. The town is home to a number of farms, as well as a number of small businesses. The town is also home to a number of industrial parks, which provide jobs for many of the town’s residents.
The town is also home to a number of tourist attractions, including the historic Carmel Church, the Hawkins County Museum, and the Hawkins County Fairgrounds.
Demographics
As of the 2010 census, the population of Carmel was 1,000 people. The racial makeup of the town was 97.2% White, 0.7% African American, 0.2% Native American, 0.2% Asian, 0.2% from other races, and 1.7% from two or more races. Hispanic or Latino of any race were 0.7% of the population.
The median income for a household in the town was $30,000, and the median income for a family was $35,000. The per capita income for the town was $15,000. About 15.7% of families and 18.2% of the population were below the poverty line, including 25.0% of those under age 18 and 11.1% of those age 65 or over.
Common Questions
What is Per Capita Income in Mount Carmel?
Per Capita income in Mount Carmel is $36,460.
What is the Median Family Income in Mount Carmel?
Median Family Income in Mount Carmel is $70,409.
What is the Median Household income in Mount Carmel?
Median Household Income in Mount Carmel is $64,971.
What is Income or Wage Gap in Mount Carmel?
Income or Wage Gap in Mount Carmel is 39.6%.
Women in Mount Carmel earn 60.4 cents for every dollar earned by a man.
What is Inequality or Gini Index in Mount Carmel?
Inequality or Gini Index in Mount Carmel is 0.48.
What is the Total Population of Mount Carmel?
Total Population of Mount Carmel is 5,486.
What is the Total Male Population of Mount Carmel?
Total Male Population of Mount Carmel is 2,714.
What is the Total Female Population of Mount Carmel?
Total Female Population of Mount Carmel is 2,772.
What is the Ratio of Males per 100 Females in Mount Carmel?
There are 97.91 Males per 100 Females in Mount Carmel.
What is the Ratio of Females per 100 Males in Mount Carmel?
There are 102.14 Females per 100 Males in Mount Carmel.
What is the Median Population Age in Mount Carmel?
Median Population Age in Mount Carmel is 42.2 Years.
What is the Average Family Size in Mount Carmel
Average Family Size in Mount Carmel is 3.2 People.
What is the Average Household Size in Mount Carmel
Average Household Size in Mount Carmel is 2.6 People.
How Large is the Labor Force in Mount Carmel?
There are 2,482 People in the Labor Forcein in Mount Carmel.
What is the Percentage of People in the Labor Force in Mount Carmel?
54.3% of People are in the Labor Force in Mount Carmel.
What is the Unemployment Rate in Mount Carmel?
Unemployment Rate in Mount Carmel is 5.8%.