Lawrenceburg, TN Map & Demographics
Lawrenceburg Map
Lawrenceburg Overview
$23,292
PER CAPITA INCOME
$45,337
AVG FAMILY INCOME
$37,644
AVG HOUSEHOLD INCOME
39.3%
WAGE / INCOME GAP [ % ]
60.7¢/ $1
WAGE / INCOME GAP [ $ ]
$8,537
FAMILY INCOME DEFICIT
0.47
INEQUALITY / GINI INDEX
11,592
TOTAL POPULATION
5,452
MALE POPULATION
6,140
FEMALE POPULATION
88.79
MALES / 100 FEMALES
112.62
FEMALES / 100 MALES
37.3
MEDIAN AGE
3.0
AVG FAMILY SIZE
2.3
AVG HOUSEHOLD SIZE
4,754
LABOR FORCE [ PEOPLE ]
53.1%
PERCENT IN LABOR FORCE
9.3%
UNEMPLOYMENT RATE
Lawrenceburg Zip Codes
Lawrenceburg Area Codes
Income in Lawrenceburg
Income Overview in Lawrenceburg
Per Capita Income in Lawrenceburg is $23,292, while median incomes of families and households are $45,337 and $37,644 respectively.
| Characteristic | Number | Measure |
| Per Capita Income | 11,592 | $23,292 |
| Median Family Income | 2,793 | $45,337 |
| Mean Family Income | 2,793 | $59,083 |
| Median Household Income | 4,866 | $37,644 |
| Mean Household Income | 4,866 | $51,044 |
| Income Deficit | 2,793 | $8,537 |
| Wage / Income Gap (%) | 11,592 | 39.27% |
| Wage / Income Gap ($) | 11,592 | 60.73¢ per $1 |
| Gini / Inequality Index | 11,592 | 0.47 |
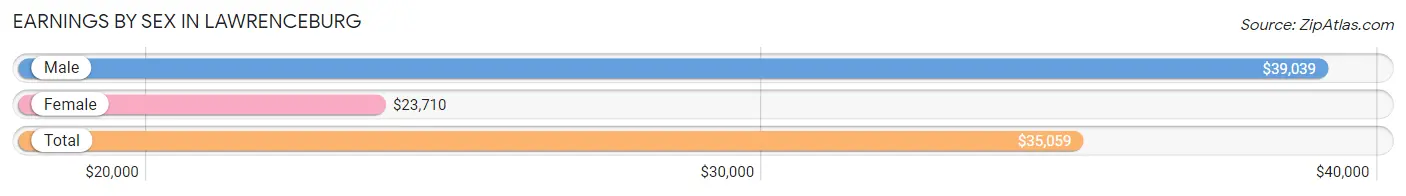
Earnings by Sex in Lawrenceburg
Average Earnings in Lawrenceburg are $35,059, $39,039 for men and $23,710 for women, a difference of 39.3%.
| Sex | Number | Average Earnings |
| Male | 2,495 (51.9%) | $39,039 |
| Female | 2,314 (48.1%) | $23,710 |
| Total | 4,809 (100.0%) | $35,059 |
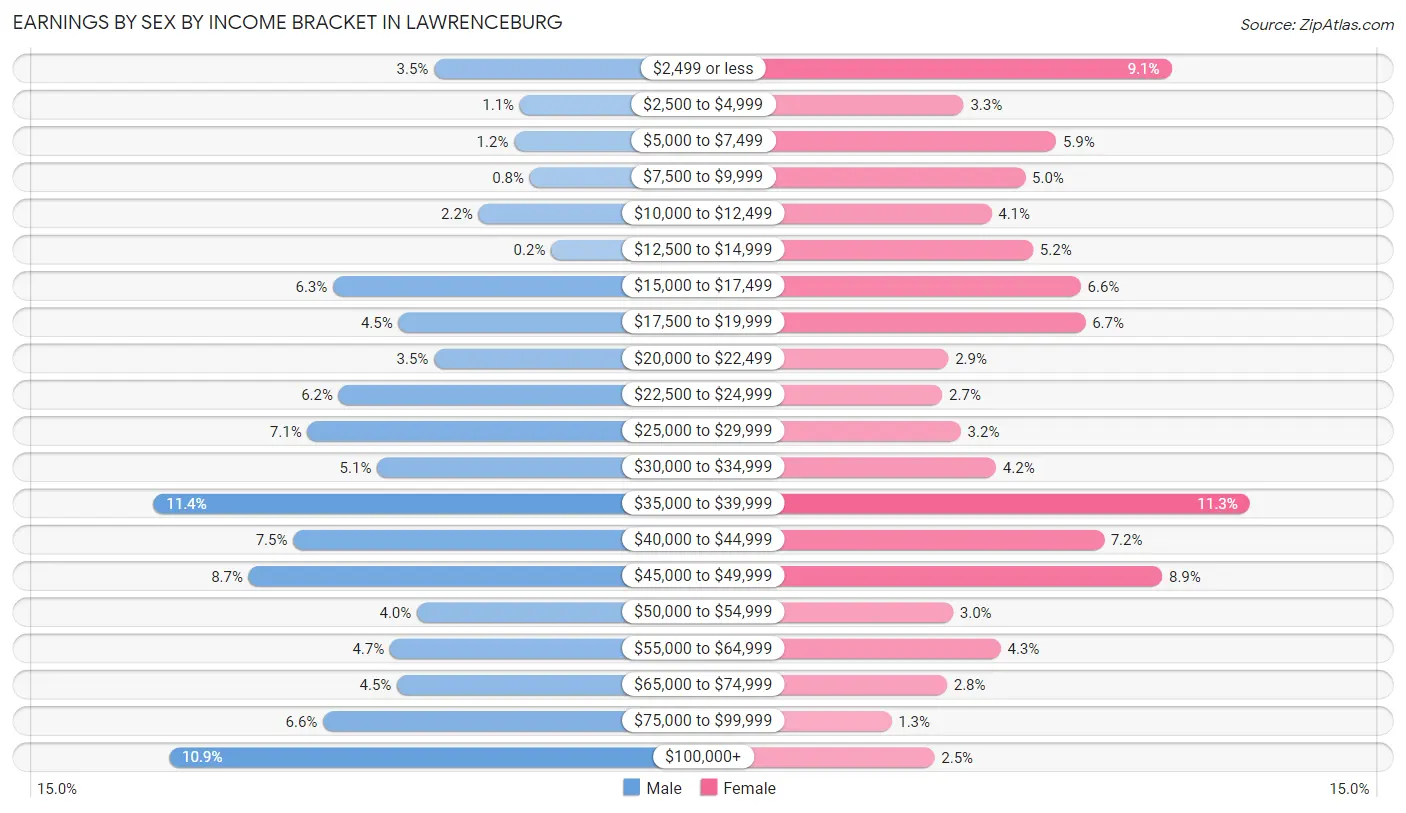
Earnings by Sex by Income Bracket in Lawrenceburg
The most common earnings brackets in Lawrenceburg are $35,000 to $39,999 for men (284 | 11.4%) and $35,000 to $39,999 for women (262 | 11.3%).
| Income | Male | Female |
| $2,499 or less | 87 (3.5%) | 211 (9.1%) |
| $2,500 to $4,999 | 27 (1.1%) | 76 (3.3%) |
| $5,000 to $7,499 | 31 (1.2%) | 136 (5.9%) |
| $7,500 to $9,999 | 20 (0.8%) | 116 (5.0%) |
| $10,000 to $12,499 | 56 (2.2%) | 94 (4.1%) |
| $12,500 to $14,999 | 5 (0.2%) | 121 (5.2%) |
| $15,000 to $17,499 | 158 (6.3%) | 152 (6.6%) |
| $17,500 to $19,999 | 112 (4.5%) | 155 (6.7%) |
| $20,000 to $22,499 | 87 (3.5%) | 66 (2.9%) |
| $22,500 to $24,999 | 154 (6.2%) | 62 (2.7%) |
| $25,000 to $29,999 | 176 (7.0%) | 74 (3.2%) |
| $30,000 to $34,999 | 127 (5.1%) | 97 (4.2%) |
| $35,000 to $39,999 | 284 (11.4%) | 262 (11.3%) |
| $40,000 to $44,999 | 186 (7.4%) | 167 (7.2%) |
| $45,000 to $49,999 | 217 (8.7%) | 205 (8.9%) |
| $50,000 to $54,999 | 99 (4.0%) | 69 (3.0%) |
| $55,000 to $64,999 | 118 (4.7%) | 100 (4.3%) |
| $65,000 to $74,999 | 113 (4.5%) | 65 (2.8%) |
| $75,000 to $99,999 | 165 (6.6%) | 29 (1.3%) |
| $100,000+ | 273 (10.9%) | 57 (2.5%) |
| Total | 2,495 (100.0%) | 2,314 (100.0%) |
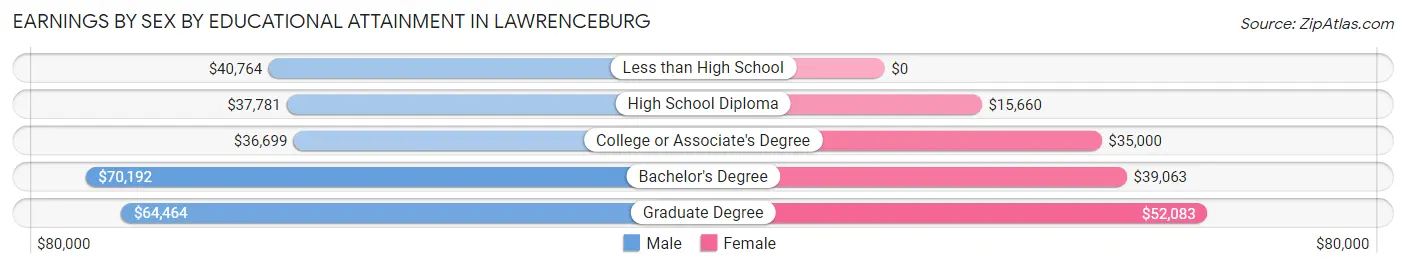
Earnings by Sex by Educational Attainment in Lawrenceburg
Average earnings in Lawrenceburg are $40,060 for men and $30,333 for women, a difference of 24.3%. Men with an educational attainment of bachelor's degree enjoy the highest average annual earnings of $70,192, while those with college or associate's degree education earn the least with $36,699. Women with an educational attainment of graduate degree earn the most with the average annual earnings of $52,083, while those with high school diploma education have the smallest earnings of $15,660.
| Educational Attainment | Male Income | Female Income |
| Less than High School | $40,764 | $0 |
| High School Diploma | $37,781 | $15,660 |
| College or Associate's Degree | $36,699 | $35,000 |
| Bachelor's Degree | $70,192 | $39,063 |
| Graduate Degree | $64,464 | $52,083 |
| Total | $40,060 | $30,333 |
Family Income in Lawrenceburg
Family Income Brackets in Lawrenceburg
According to the Lawrenceburg family income data, there are 525 families falling into the $50,000 to $74,999 income range, which is the most common income bracket and makes up 18.8% of all families. Conversely, the $200,000+ income bracket is the least frequent group with only 70 families (2.5%) belonging to this category.
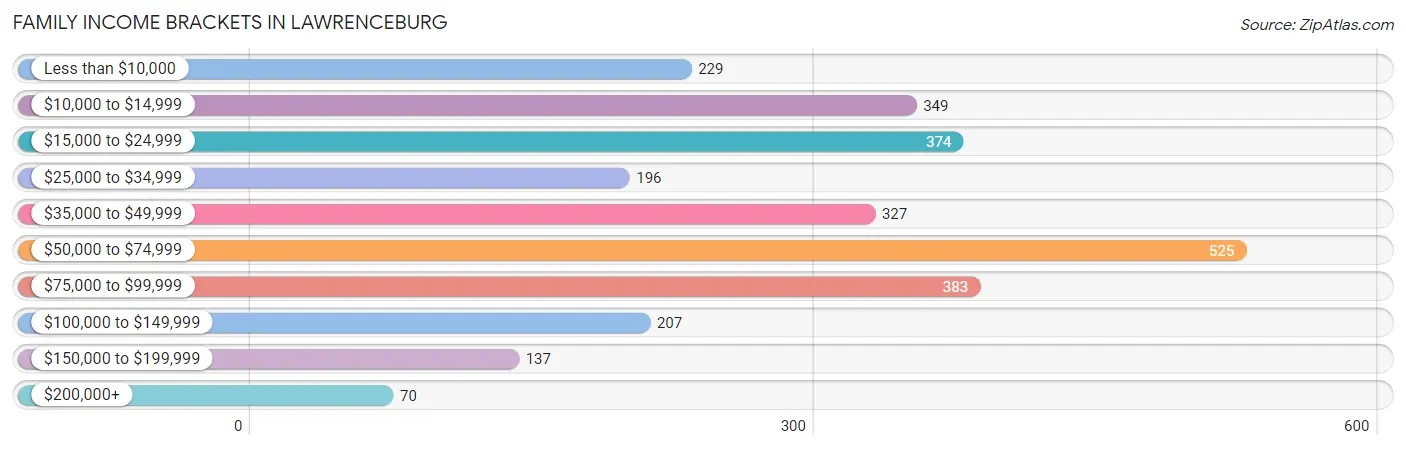
| Income Bracket | # Families | % Families |
| Less than $10,000 | 229 | 8.2% |
| $10,000 to $14,999 | 349 | 12.5% |
| $15,000 to $24,999 | 374 | 13.4% |
| $25,000 to $34,999 | 196 | 7.0% |
| $35,000 to $49,999 | 327 | 11.7% |
| $50,000 to $74,999 | 525 | 18.8% |
| $75,000 to $99,999 | 383 | 13.7% |
| $100,000 to $149,999 | 207 | 7.4% |
| $150,000 to $199,999 | 137 | 4.9% |
| $200,000+ | 70 | 2.5% |
Family Income by Famaliy Size in Lawrenceburg
7+ person families (37 | 1.3%) account for the highest median family income in Lawrenceburg with $94,702 per family, while 2-person families (1,748 | 62.6%) have the highest median income of $19,916 per family member.
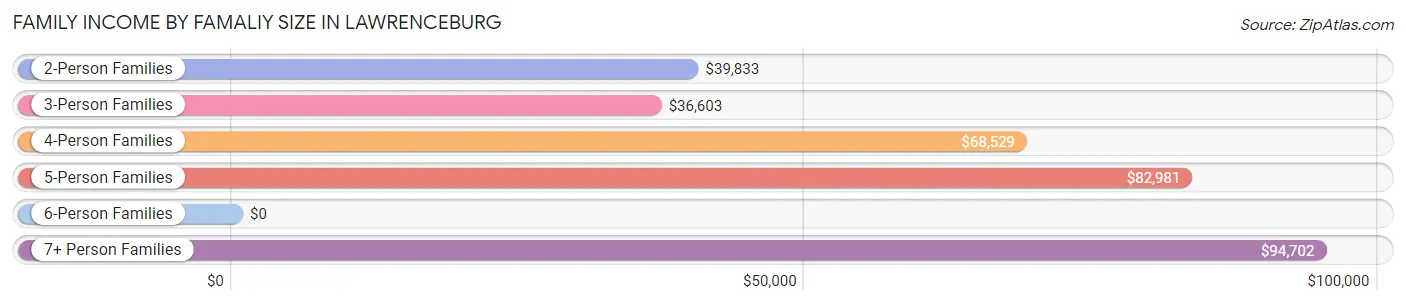
| Income Bracket | # Families | Median Income |
| 2-Person Families | 1,748 (62.6%) | $39,833 |
| 3-Person Families | 486 (17.4%) | $36,603 |
| 4-Person Families | 336 (12.0%) | $68,529 |
| 5-Person Families | 170 (6.1%) | $82,981 |
| 6-Person Families | 16 (0.6%) | $0 |
| 7+ Person Families | 37 (1.3%) | $94,702 |
| Total | 2,793 (100.0%) | $45,337 |
Family Income by Number of Earners in Lawrenceburg
The median family income in Lawrenceburg is $45,337, with families comprising 3+ earners (85) having the highest median family income of $106,467, while families with no earners (749) have the lowest median family income of $21,303, accounting for 3.0% and 26.8% of families, respectively.
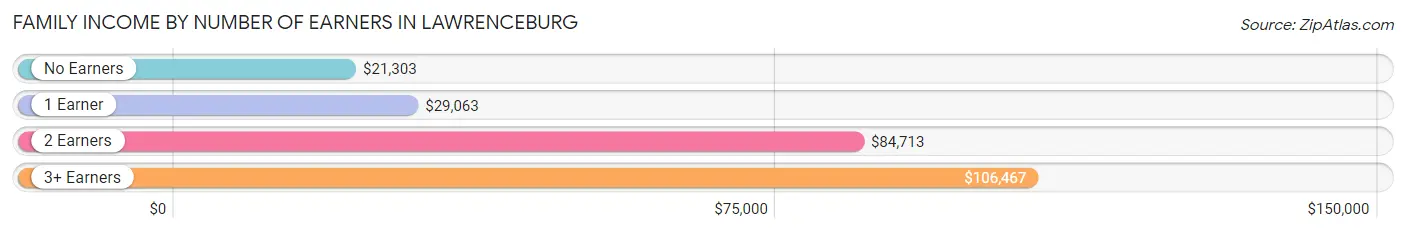
| Number of Earners | # Families | Median Income |
| No Earners | 749 (26.8%) | $21,303 |
| 1 Earner | 1,123 (40.2%) | $29,063 |
| 2 Earners | 836 (29.9%) | $84,713 |
| 3+ Earners | 85 (3.0%) | $106,467 |
| Total | 2,793 (100.0%) | $45,337 |
Household Income in Lawrenceburg
Household Income Brackets in Lawrenceburg
With 769 households falling in the category, the $50,000 to $74,999 income range is the most frequent in Lawrenceburg, accounting for 15.8% of all households. In contrast, only 78 households (1.6%) fall into the $200,000+ income bracket, making it the least populous group.
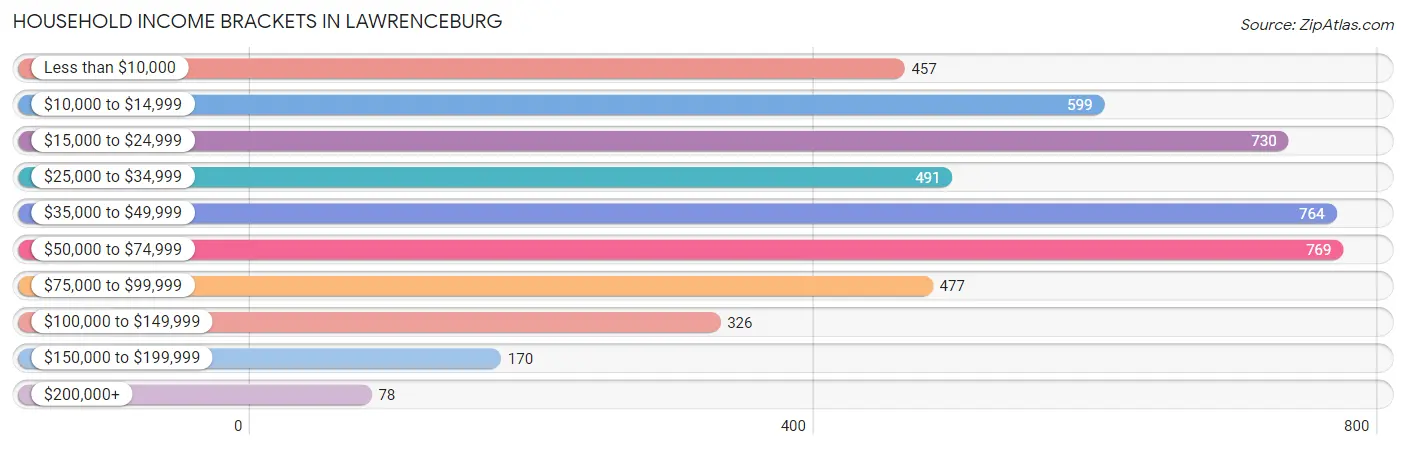
| Income Bracket | # Households | % Households |
| Less than $10,000 | 457 | 9.4% |
| $10,000 to $14,999 | 599 | 12.3% |
| $15,000 to $24,999 | 730 | 15.0% |
| $25,000 to $34,999 | 491 | 10.1% |
| $35,000 to $49,999 | 764 | 15.7% |
| $50,000 to $74,999 | 769 | 15.8% |
| $75,000 to $99,999 | 477 | 9.8% |
| $100,000 to $149,999 | 326 | 6.7% |
| $150,000 to $199,999 | 170 | 3.5% |
| $200,000+ | 78 | 1.6% |
Household Income by Householder Age in Lawrenceburg
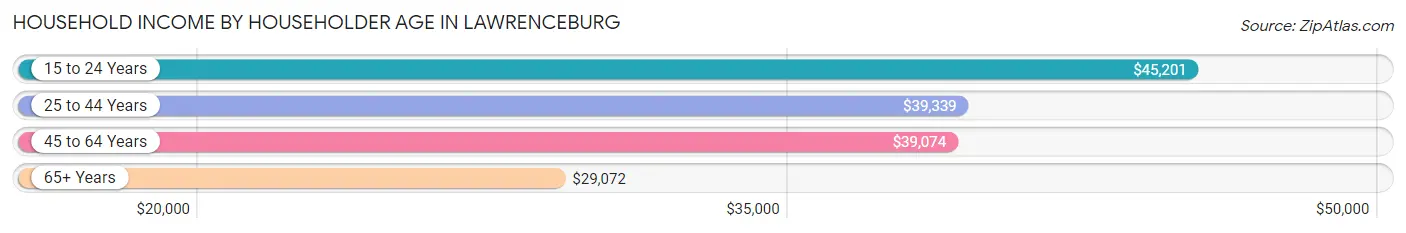
The median household income in Lawrenceburg is $37,644, with the highest median household income of $45,201 found in the 15 to 24 years age bracket for the primary householder. A total of 237 households (4.9%) fall into this category. Meanwhile, the 65+ years age bracket for the primary householder has the lowest median household income of $29,072, with 1,515 households (31.1%) in this group.
| Income Bracket | # Households | Median Income |
| 15 to 24 Years | 237 (4.9%) | $45,201 |
| 25 to 44 Years | 1,666 (34.2%) | $39,339 |
| 45 to 64 Years | 1,448 (29.8%) | $39,074 |
| 65+ Years | 1,515 (31.1%) | $29,072 |
| Total | 4,866 (100.0%) | $37,644 |
Poverty in Lawrenceburg
Income Below Poverty by Sex and Age in Lawrenceburg
With 21.0% poverty level for males and 33.1% for females among the residents of Lawrenceburg, 6 to 11 year old males and 12 to 14 year old females are the most vulnerable to poverty, with 172 males (42.8%) and 108 females (51.4%) in their respective age groups living below the poverty level.
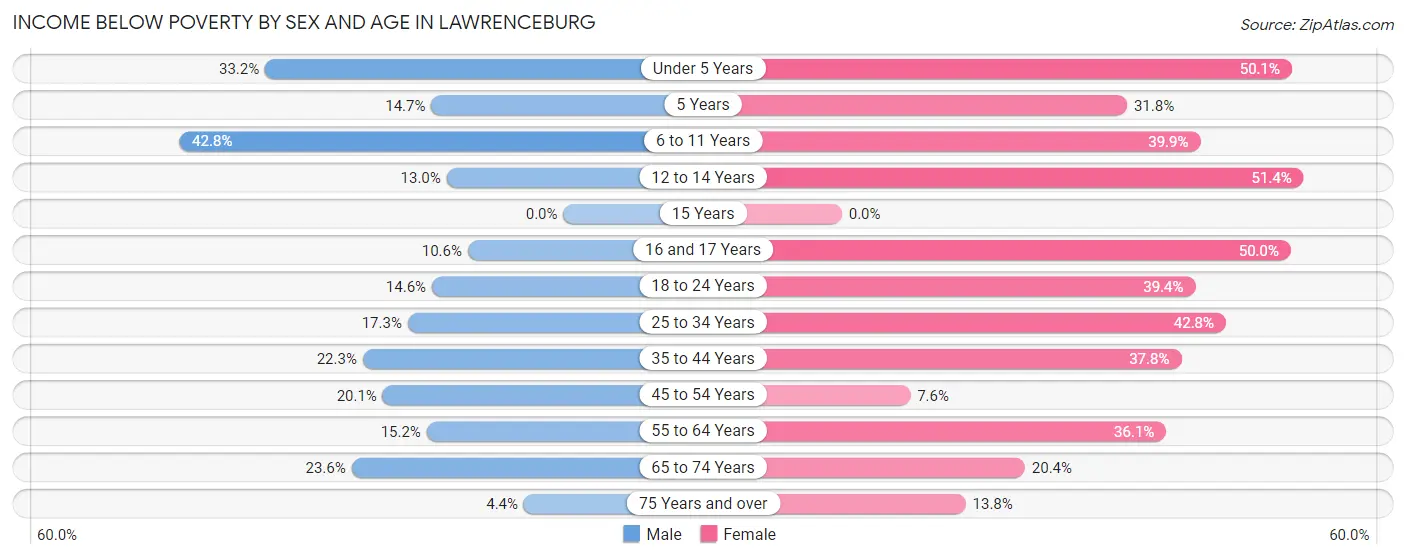
| Age Bracket | Male | Female |
| Under 5 Years | 193 (33.2%) | 224 (50.1%) |
| 5 Years | 10 (14.7%) | 27 (31.8%) |
| 6 to 11 Years | 172 (42.8%) | 202 (39.9%) |
| 12 to 14 Years | 26 (13.0%) | 108 (51.4%) |
| 15 Years | 0 (0.0%) | 0 (0.0%) |
| 16 and 17 Years | 15 (10.6%) | 15 (50.0%) |
| 18 to 24 Years | 47 (14.6%) | 187 (39.4%) |
| 25 to 34 Years | 135 (17.3%) | 429 (42.8%) |
| 35 to 44 Years | 143 (22.3%) | 248 (37.8%) |
| 45 to 54 Years | 139 (20.1%) | 38 (7.6%) |
| 55 to 64 Years | 84 (15.2%) | 259 (36.1%) |
| 65 to 74 Years | 117 (23.6%) | 137 (20.4%) |
| 75 Years and over | 14 (4.4%) | 76 (13.8%) |
| Total | 1,095 (21.0%) | 1,950 (33.1%) |
Income Above Poverty by Sex and Age in Lawrenceburg
According to the poverty statistics in Lawrenceburg, males aged 15 years and females aged 15 years are the age groups that are most secure financially, with 100.0% of males and 100.0% of females in these age groups living above the poverty line.
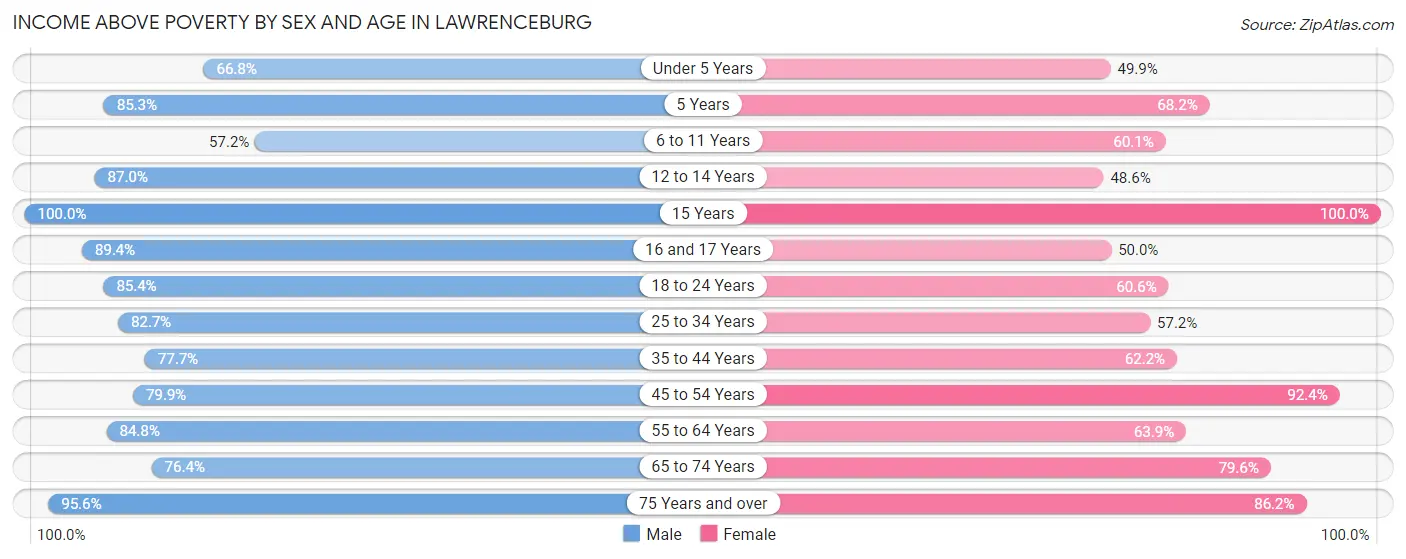
| Age Bracket | Male | Female |
| Under 5 Years | 388 (66.8%) | 223 (49.9%) |
| 5 Years | 58 (85.3%) | 58 (68.2%) |
| 6 to 11 Years | 230 (57.2%) | 304 (60.1%) |
| 12 to 14 Years | 174 (87.0%) | 102 (48.6%) |
| 15 Years | 20 (100.0%) | 41 (100.0%) |
| 16 and 17 Years | 126 (89.4%) | 15 (50.0%) |
| 18 to 24 Years | 274 (85.4%) | 288 (60.6%) |
| 25 to 34 Years | 644 (82.7%) | 574 (57.2%) |
| 35 to 44 Years | 497 (77.7%) | 408 (62.2%) |
| 45 to 54 Years | 552 (79.9%) | 461 (92.4%) |
| 55 to 64 Years | 468 (84.8%) | 458 (63.9%) |
| 65 to 74 Years | 379 (76.4%) | 535 (79.6%) |
| 75 Years and over | 304 (95.6%) | 475 (86.2%) |
| Total | 4,114 (79.0%) | 3,942 (66.9%) |
Income Below Poverty Among Married-Couple Families in Lawrenceburg
The poverty statistics for married-couple families in Lawrenceburg show that 12.3% or 192 of the total 1,558 families live below the poverty line. Families with no children have the highest poverty rate of 15.7%, comprising of 152 families. On the other hand, families with 1 or 2 children have the lowest poverty rate of 6.3%, which includes 28 families.
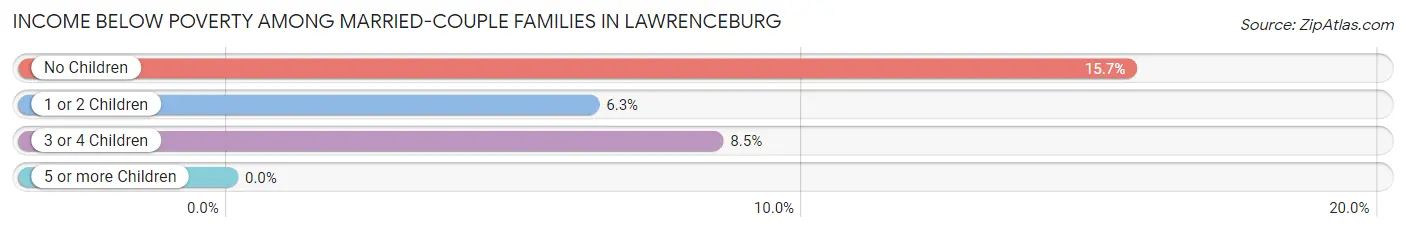
| Children | Above Poverty | Below Poverty |
| No Children | 819 (84.4%) | 152 (15.7%) |
| 1 or 2 Children | 417 (93.7%) | 28 (6.3%) |
| 3 or 4 Children | 130 (91.5%) | 12 (8.5%) |
| 5 or more Children | 0 (0.0%) | 0 (0.0%) |
| Total | 1,366 (87.7%) | 192 (12.3%) |
Income Below Poverty Among Single-Parent Households in Lawrenceburg
According to the poverty data in Lawrenceburg, 34.2% or 63 single-father households and 58.1% or 611 single-mother households are living below the poverty line. Among single-father households, those with 3 or 4 children have the highest poverty rate, with 5 households (100.0%) experiencing poverty. Likewise, among single-mother households, those with 1 or 2 children have the highest poverty rate, with 523 households (74.3%) falling below the poverty line.
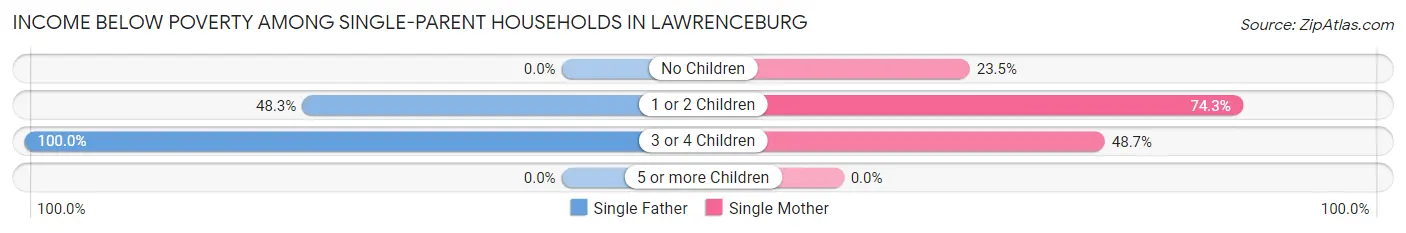
| Children | Single Father | Single Mother |
| No Children | 0 (0.0%) | 70 (23.5%) |
| 1 or 2 Children | 58 (48.3%) | 523 (74.3%) |
| 3 or 4 Children | 5 (100.0%) | 18 (48.6%) |
| 5 or more Children | 0 (0.0%) | 0 (0.0%) |
| Total | 63 (34.2%) | 611 (58.1%) |
Income Below Poverty Among Married-Couple vs Single-Parent Households in Lawrenceburg
The poverty data for Lawrenceburg shows that 192 of the married-couple family households (12.3%) and 674 of the single-parent households (54.6%) are living below the poverty level. Within the married-couple family households, those with no children have the highest poverty rate, with 152 households (15.7%) falling below the poverty line. Among the single-parent households, those with 1 or 2 children have the highest poverty rate, with 581 household (70.5%) living below poverty.
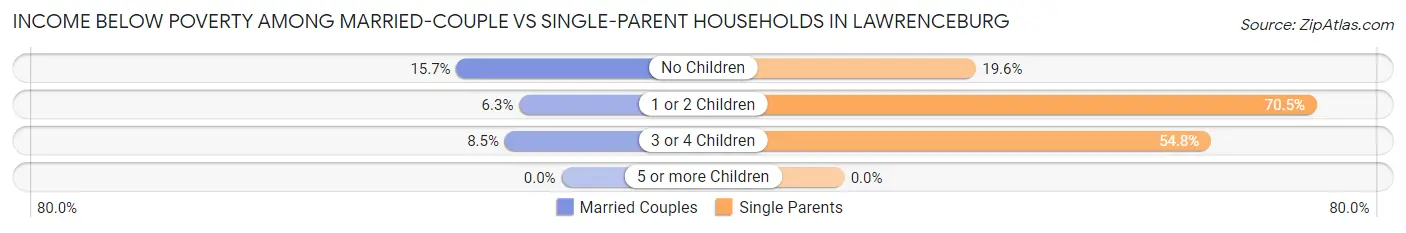
| Children | Married-Couple Families | Single-Parent Households |
| No Children | 152 (15.7%) | 70 (19.6%) |
| 1 or 2 Children | 28 (6.3%) | 581 (70.5%) |
| 3 or 4 Children | 12 (8.5%) | 23 (54.8%) |
| 5 or more Children | 0 (0.0%) | 0 (0.0%) |
| Total | 192 (12.3%) | 674 (54.6%) |
Race in Lawrenceburg
The most populous races in Lawrenceburg are White / Caucasian (10,135 | 87.4%), Two or more Races (703 | 6.1%), and Hispanic or Latino (564 | 4.9%).
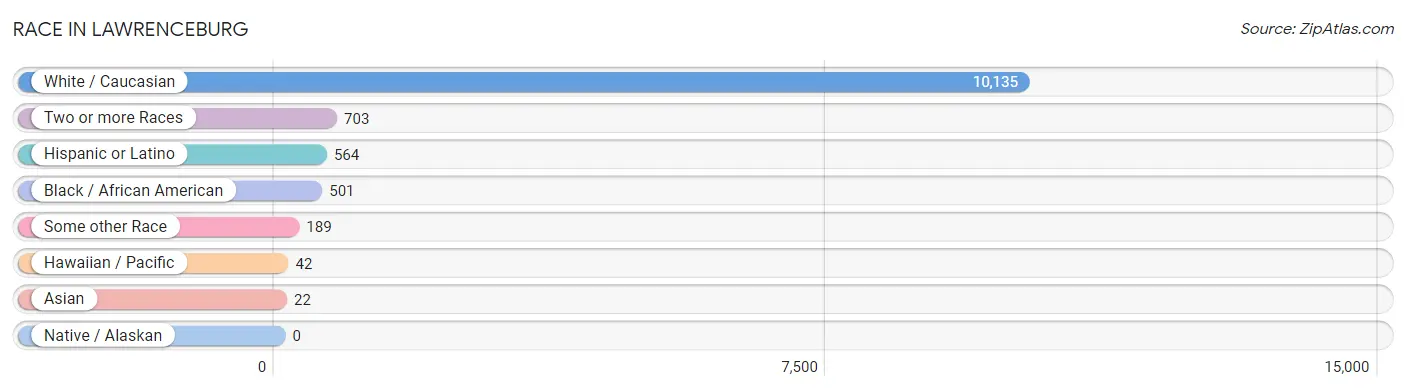
| Race | # Population | % Population |
| Asian | 22 | 0.2% |
| Black / African American | 501 | 4.3% |
| Hawaiian / Pacific | 42 | 0.4% |
| Hispanic or Latino | 564 | 4.9% |
| Native / Alaskan | 0 | 0.0% |
| White / Caucasian | 10,135 | 87.4% |
| Two or more Races | 703 | 6.1% |
| Some other Race | 189 | 1.6% |
| Total | 11,592 | 100.0% |
Ancestry in Lawrenceburg
The most populous ancestries reported in Lawrenceburg are American (1,803 | 15.5%), English (1,595 | 13.8%), Irish (1,231 | 10.6%), German (1,045 | 9.0%), and Mexican (483 | 4.2%), together accounting for 53.1% of all Lawrenceburg residents.
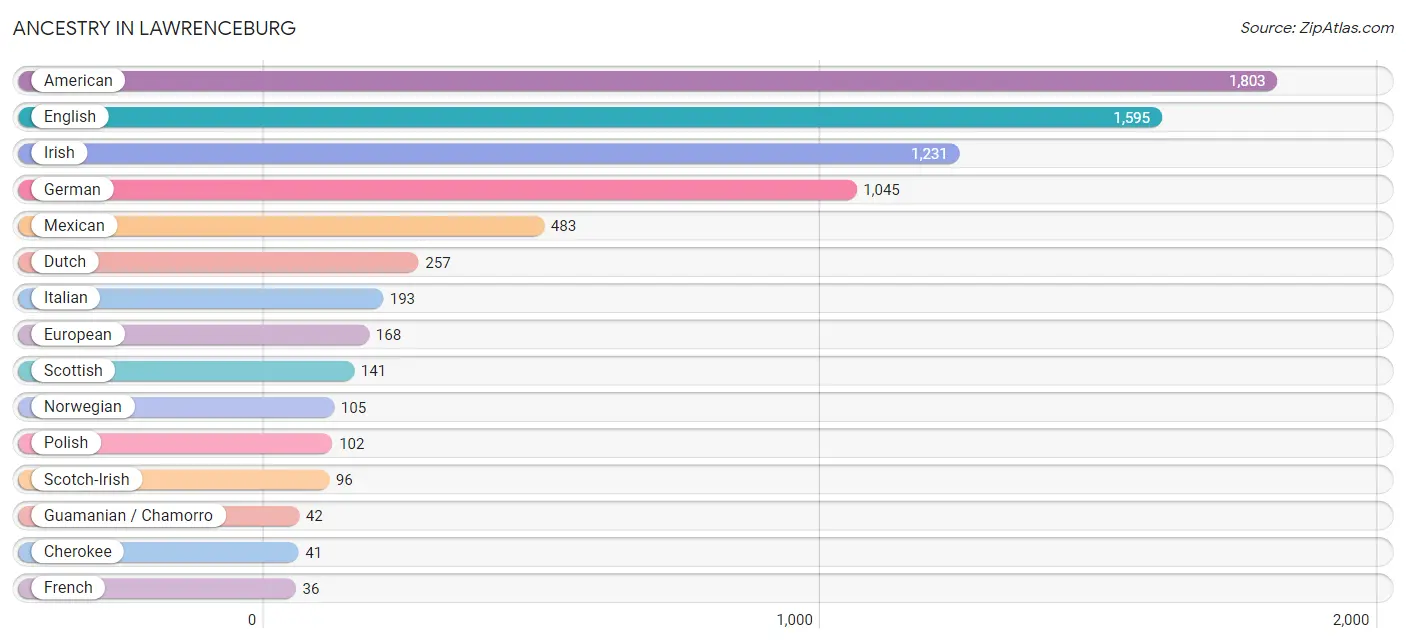
| Ancestry | # Population | % Population |
| African | 4 | 0.0% |
| American | 1,803 | 15.5% |
| Armenian | 14 | 0.1% |
| Burmese | 22 | 0.2% |
| Central American | 35 | 0.3% |
| Cherokee | 41 | 0.4% |
| Cuban | 27 | 0.2% |
| Czech | 33 | 0.3% |
| Czechoslovakian | 12 | 0.1% |
| Dutch | 257 | 2.2% |
| English | 1,595 | 13.8% |
| European | 168 | 1.5% |
| French | 36 | 0.3% |
| French Canadian | 26 | 0.2% |
| German | 1,045 | 9.0% |
| Guamanian / Chamorro | 42 | 0.4% |
| Guatemalan | 14 | 0.1% |
| Hungarian | 5 | 0.0% |
| Irish | 1,231 | 10.6% |
| Italian | 193 | 1.7% |
| Jamaican | 26 | 0.2% |
| Mexican | 483 | 4.2% |
| Northern European | 14 | 0.1% |
| Norwegian | 105 | 0.9% |
| Polish | 102 | 0.9% |
| Portuguese | 23 | 0.2% |
| Puerto Rican | 19 | 0.2% |
| Russian | 16 | 0.1% |
| Salvadoran | 21 | 0.2% |
| Scandinavian | 6 | 0.1% |
| Scotch-Irish | 96 | 0.8% |
| Scottish | 141 | 1.2% |
| Slovene | 26 | 0.2% |
| Subsaharan African | 4 | 0.0% |
| Ukrainian | 12 | 0.1% |
| Welsh | 31 | 0.3% | View All 36 Rows |
Immigrants in Lawrenceburg
The most numerous immigrant groups reported in Lawrenceburg came from Latin America (194 | 1.7%), Central America (171 | 1.5%), Mexico (167 | 1.4%), Europe (41 | 0.4%), and Germany (29 | 0.3%), together accounting for 5.2% of all Lawrenceburg residents.
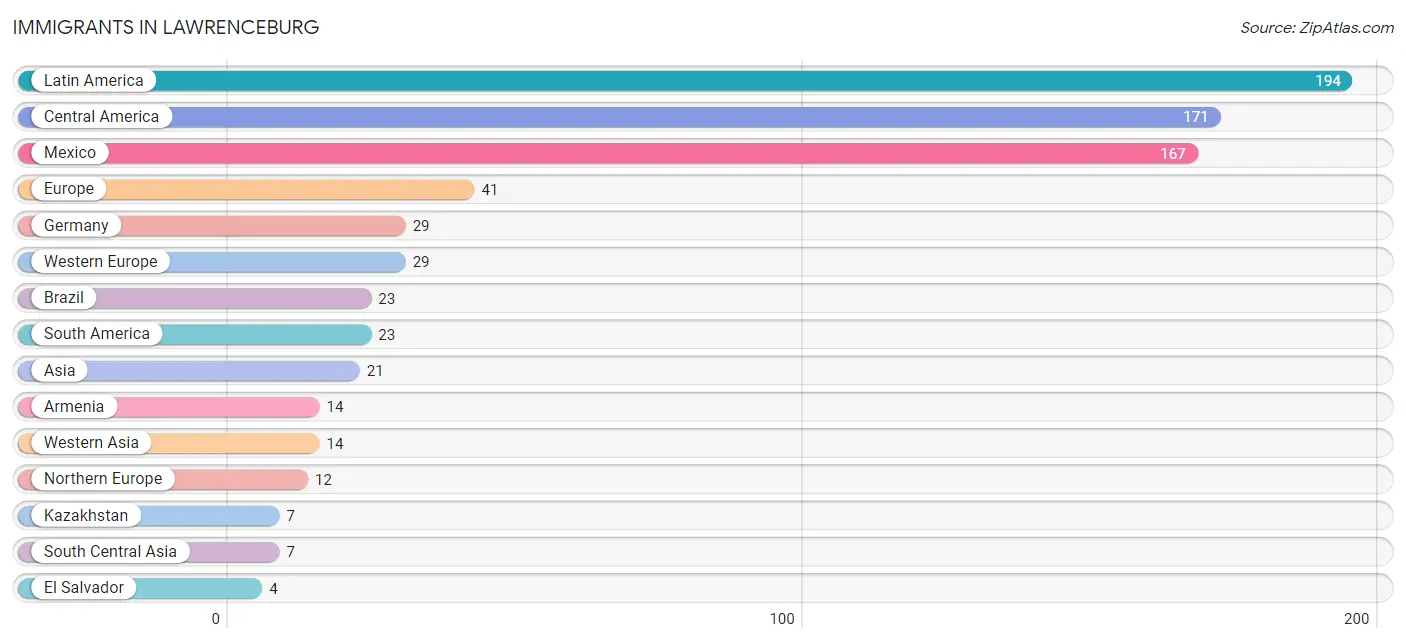
| Immigration Origin | # Population | % Population |
| Armenia | 14 | 0.1% |
| Asia | 21 | 0.2% |
| Brazil | 23 | 0.2% |
| Central America | 171 | 1.5% |
| El Salvador | 4 | 0.0% |
| Europe | 41 | 0.4% |
| Germany | 29 | 0.3% |
| Kazakhstan | 7 | 0.1% |
| Latin America | 194 | 1.7% |
| Mexico | 167 | 1.4% |
| Northern Europe | 12 | 0.1% |
| South America | 23 | 0.2% |
| South Central Asia | 7 | 0.1% |
| Western Asia | 14 | 0.1% |
| Western Europe | 29 | 0.3% | View All 15 Rows |
Sex and Age in Lawrenceburg
Sex and Age in Lawrenceburg
The most populous age groups in Lawrenceburg are Under 5 Years (581 | 10.7%) for men and 30 to 34 Years (560 | 9.1%) for women.
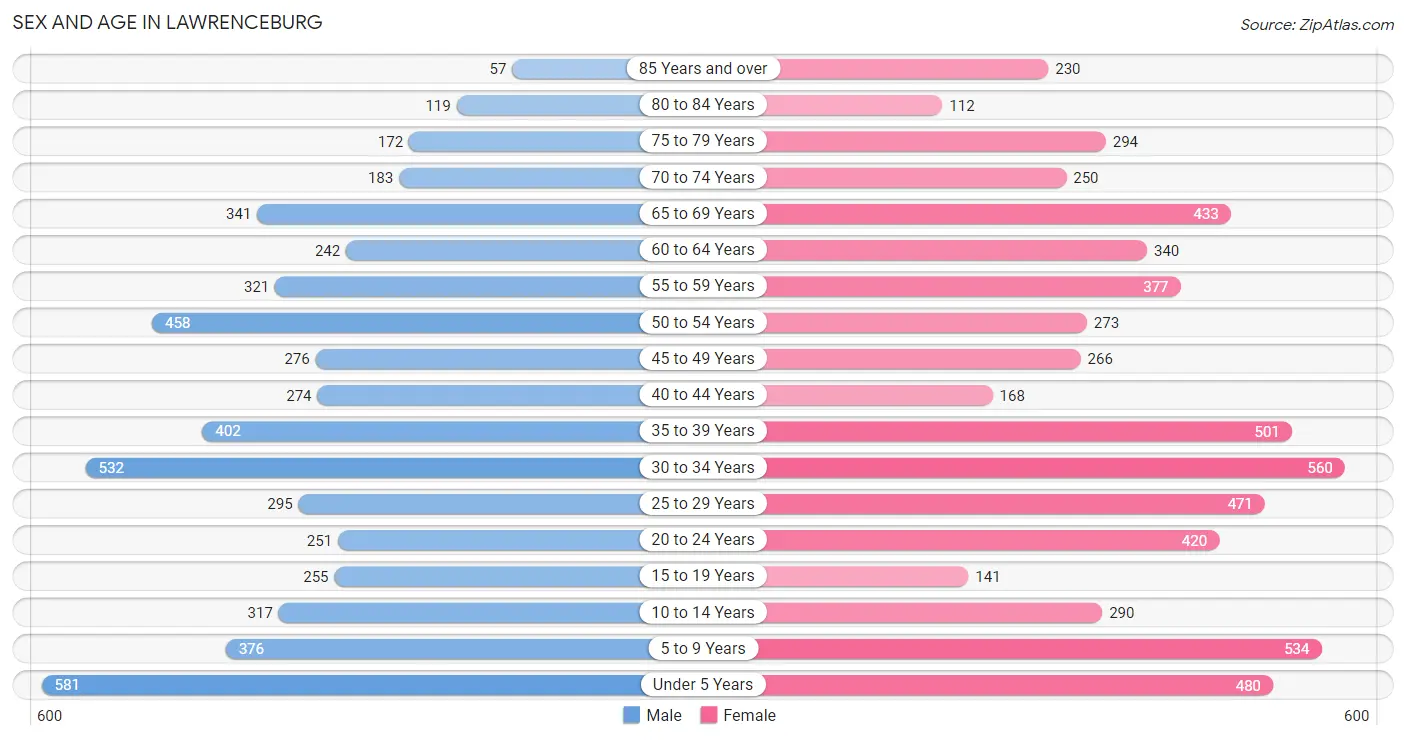
| Age Bracket | Male | Female |
| Under 5 Years | 581 (10.7%) | 480 (7.8%) |
| 5 to 9 Years | 376 (6.9%) | 534 (8.7%) |
| 10 to 14 Years | 317 (5.8%) | 290 (4.7%) |
| 15 to 19 Years | 255 (4.7%) | 141 (2.3%) |
| 20 to 24 Years | 251 (4.6%) | 420 (6.8%) |
| 25 to 29 Years | 295 (5.4%) | 471 (7.7%) |
| 30 to 34 Years | 532 (9.8%) | 560 (9.1%) |
| 35 to 39 Years | 402 (7.4%) | 501 (8.2%) |
| 40 to 44 Years | 274 (5.0%) | 168 (2.7%) |
| 45 to 49 Years | 276 (5.1%) | 266 (4.3%) |
| 50 to 54 Years | 458 (8.4%) | 273 (4.4%) |
| 55 to 59 Years | 321 (5.9%) | 377 (6.1%) |
| 60 to 64 Years | 242 (4.4%) | 340 (5.5%) |
| 65 to 69 Years | 341 (6.2%) | 433 (7.0%) |
| 70 to 74 Years | 183 (3.4%) | 250 (4.1%) |
| 75 to 79 Years | 172 (3.2%) | 294 (4.8%) |
| 80 to 84 Years | 119 (2.2%) | 112 (1.8%) |
| 85 Years and over | 57 (1.1%) | 230 (3.7%) |
| Total | 5,452 (100.0%) | 6,140 (100.0%) |
Families and Households in Lawrenceburg
Median Family Size in Lawrenceburg
The median family size in Lawrenceburg is 2.95 persons per family, with married-couple families (1,558 | 55.8%) accounting for the largest median family size of 3.17 persons per family. On the other hand, single male/father families (184 | 6.6%) represent the smallest median family size with 2.51 persons per family.
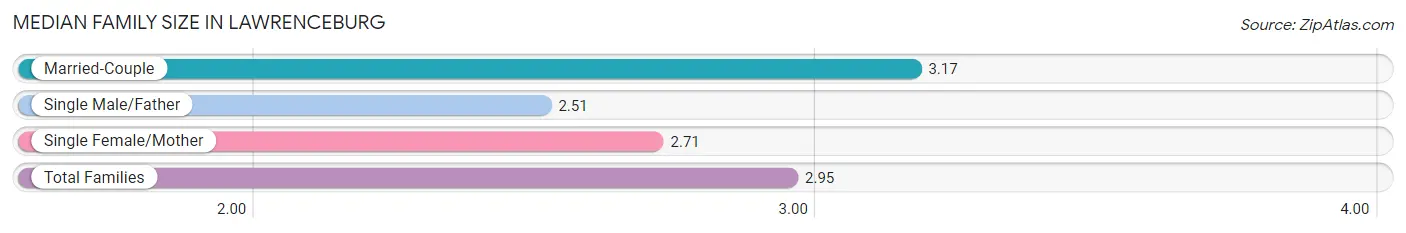
| Family Type | # Families | Family Size |
| Married-Couple | 1,558 (55.8%) | 3.17 |
| Single Male/Father | 184 (6.6%) | 2.51 |
| Single Female/Mother | 1,051 (37.6%) | 2.71 |
| Total Families | 2,793 (100.0%) | 2.95 |
Median Household Size in Lawrenceburg
The median household size in Lawrenceburg is 2.30 persons per household, with married-couple households (1,558 | 32.0%) accounting for the largest median household size of 3.23 persons per household. non-family households (2,073 | 42.6%) represent the smallest median household size with 1.18 persons per household.
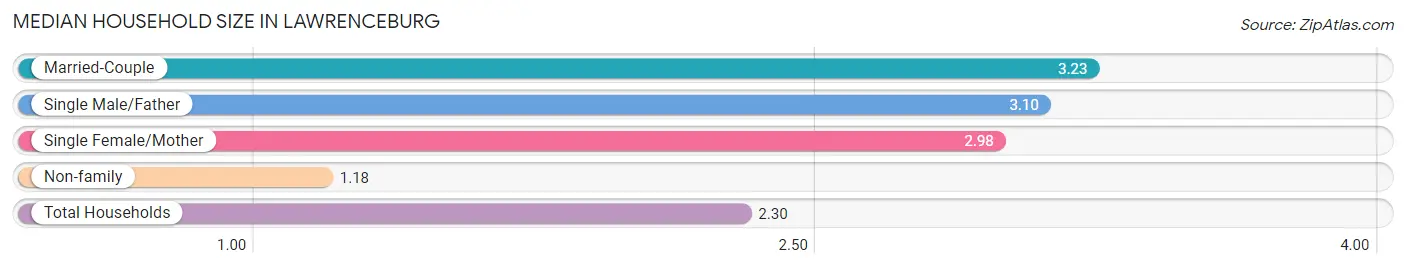
| Household Type | # Households | Household Size |
| Married-Couple | 1,558 (32.0%) | 3.23 |
| Single Male/Father | 184 (3.8%) | 3.10 |
| Single Female/Mother | 1,051 (21.6%) | 2.98 |
| Non-family | 2,073 (42.6%) | 1.18 |
| Total Households | 4,866 (100.0%) | 2.30 |
Household Size by Marriage Status in Lawrenceburg
Out of a total of 4,866 households in Lawrenceburg, 2,793 (57.4%) are family households, while 2,073 (42.6%) are nonfamily households. The most numerous type of family households are 2-person households, comprising 1,483, and the most common type of nonfamily households are 1-person households, comprising 1,664.
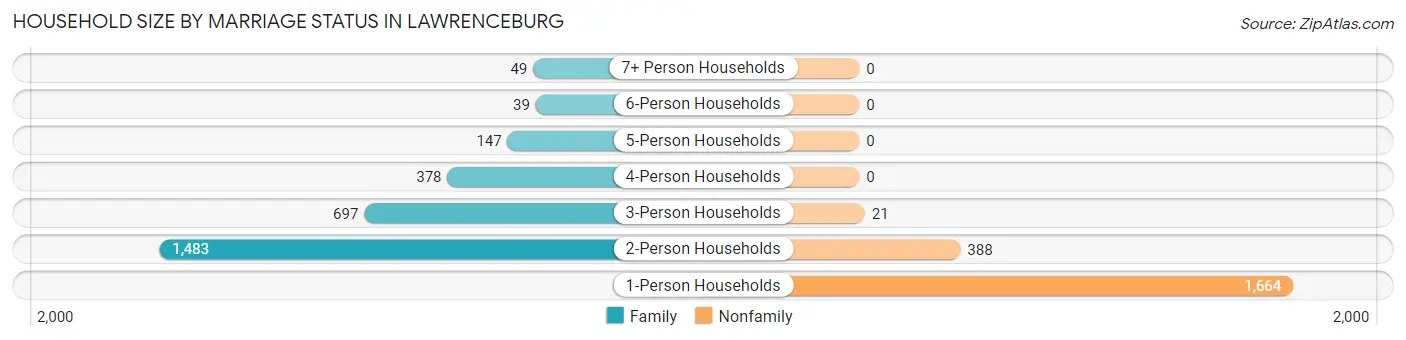
| Household Size | Family Households | Nonfamily Households |
| 1-Person Households | - | 1,664 (34.2%) |
| 2-Person Households | 1,483 (30.5%) | 388 (8.0%) |
| 3-Person Households | 697 (14.3%) | 21 (0.4%) |
| 4-Person Households | 378 (7.8%) | 0 (0.0%) |
| 5-Person Households | 147 (3.0%) | 0 (0.0%) |
| 6-Person Households | 39 (0.8%) | 0 (0.0%) |
| 7+ Person Households | 49 (1.0%) | 0 (0.0%) |
| Total | 2,793 (57.4%) | 2,073 (42.6%) |
Female Fertility in Lawrenceburg
Fertility by Age in Lawrenceburg
Average fertility rate in Lawrenceburg is 108.0 births per 1,000 women. Women in the age bracket of 20 to 34 years have the highest fertility rate with 130.0 births per 1,000 women. Women in the age bracket of 20 to 34 years acount for 66.8% of all women with births.
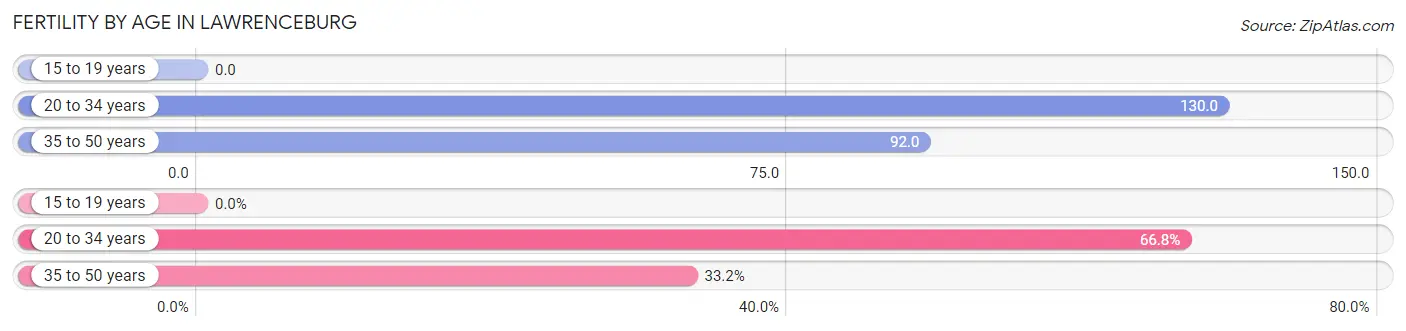
| Age Bracket | Women with Births | Births / 1,000 Women |
| 15 to 19 years | 0 (0.0%) | 0.0 |
| 20 to 34 years | 189 (66.8%) | 130.0 |
| 35 to 50 years | 94 (33.2%) | 92.0 |
| Total | 283 (100.0%) | 108.0 |
Fertility by Age by Marriage Status in Lawrenceburg
30.0% of women with births (283) in Lawrenceburg are married. The highest percentage of unmarried women with births falls into 35 to 50 years age bracket with 100.0% of them unmarried at the time of birth, while the lowest percentage of unmarried women with births belong to 20 to 34 years age bracket with 55.0% of them unmarried.
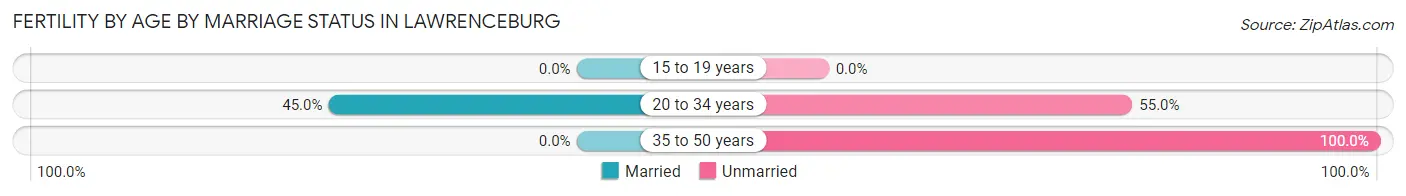
| Age Bracket | Married | Unmarried |
| 15 to 19 years | 0 (0.0%) | 0 (0.0%) |
| 20 to 34 years | 85 (45.0%) | 104 (55.0%) |
| 35 to 50 years | 0 (0.0%) | 94 (100.0%) |
| Total | 85 (30.0%) | 198 (70.0%) |
Fertility by Education in Lawrenceburg
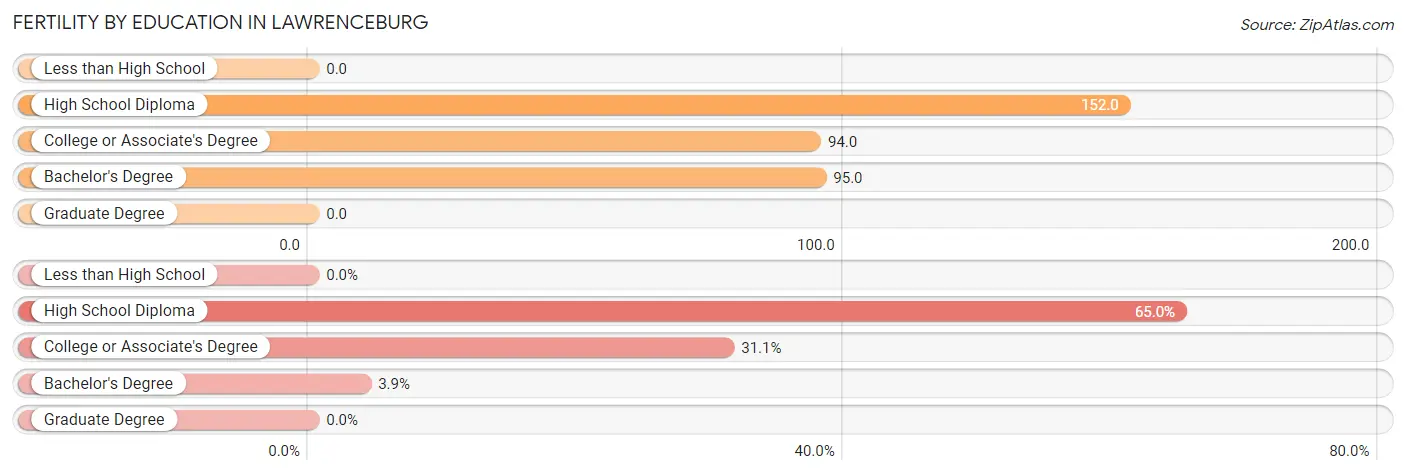
| Educational Attainment | Women with Births | Births / 1,000 Women |
| Less than High School | 0 (0.0%) | 0.0 |
| High School Diploma | 184 (65.0%) | 152.0 |
| College or Associate's Degree | 88 (31.1%) | 94.0 |
| Bachelor's Degree | 11 (3.9%) | 95.0 |
| Graduate Degree | 0 (0.0%) | 0.0 |
| Total | 283 (100.0%) | 108.0 |
Fertility by Education by Marriage Status in Lawrenceburg
70.0% of women with births in Lawrenceburg are unmarried. Women with the educational attainment of bachelor's degree are most likely to be married with 100.0% of them married at childbirth, while women with the educational attainment of high school diploma are least likely to be married with 78.8% of them unmarried at childbirth.
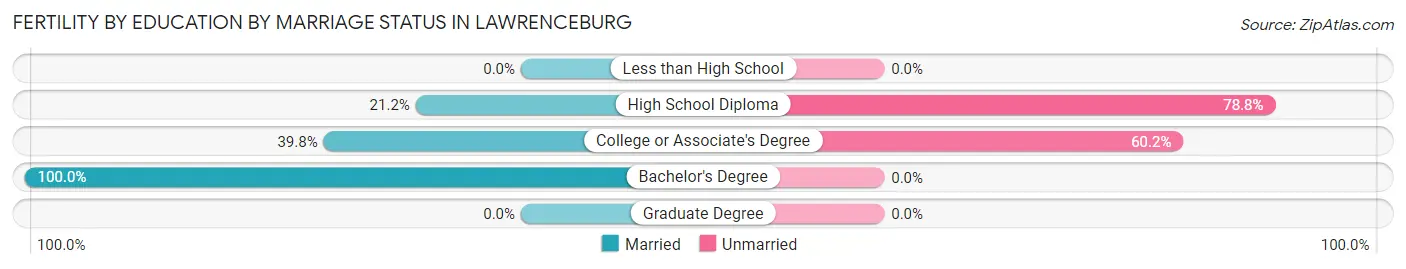
| Educational Attainment | Married | Unmarried |
| Less than High School | 0 (0.0%) | 0 (0.0%) |
| High School Diploma | 39 (21.2%) | 145 (78.8%) |
| College or Associate's Degree | 35 (39.8%) | 53 (60.2%) |
| Bachelor's Degree | 11 (100.0%) | 0 (0.0%) |
| Graduate Degree | 0 (0.0%) | 0 (0.0%) |
| Total | 85 (30.0%) | 198 (70.0%) |
Employment Characteristics in Lawrenceburg
Employment by Class of Employer in Lawrenceburg
Among the 4,279 employed individuals in Lawrenceburg, private company employees (3,115 | 72.8%), not-for-profit organizations (321 | 7.5%), and local government employees (312 | 7.3%) make up the most common classes of employment.
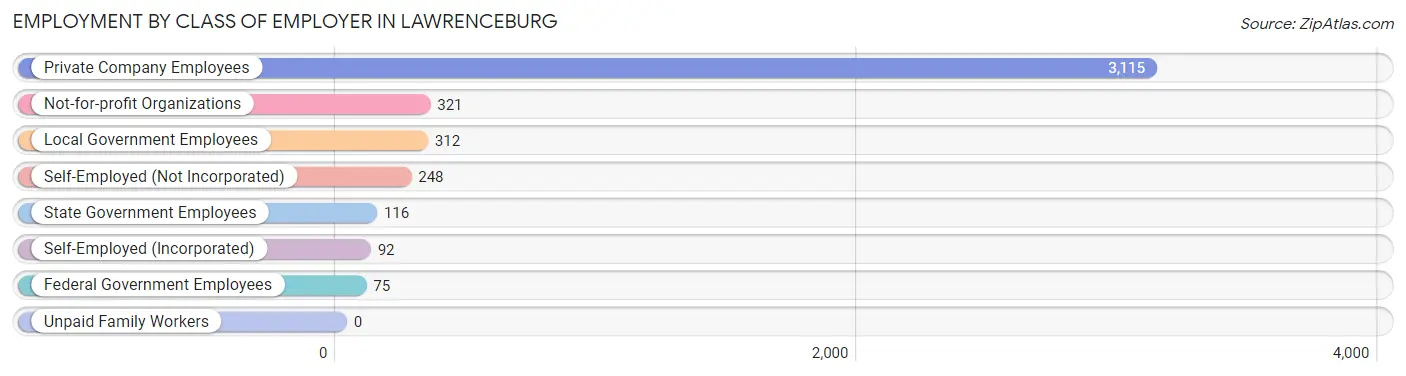
| Employer Class | # Employees | % Employees |
| Private Company Employees | 3,115 | 72.8% |
| Self-Employed (Incorporated) | 92 | 2.1% |
| Self-Employed (Not Incorporated) | 248 | 5.8% |
| Not-for-profit Organizations | 321 | 7.5% |
| Local Government Employees | 312 | 7.3% |
| State Government Employees | 116 | 2.7% |
| Federal Government Employees | 75 | 1.8% |
| Unpaid Family Workers | 0 | 0.0% |
| Total | 4,279 | 100.0% |
Employment Status by Age in Lawrenceburg
According to the labor force statistics for Lawrenceburg, out of the total population over 16 years of age (8,953), 53.1% or 4,754 individuals are in the labor force, with 9.3% or 442 of them unemployed. The age group with the highest labor force participation rate is 30 to 34 years, with 81.3% or 888 individuals in the labor force. Within the labor force, the 20 to 24 years age range has the highest percentage of unemployed individuals, with 23.4% or 117 of them being unemployed.
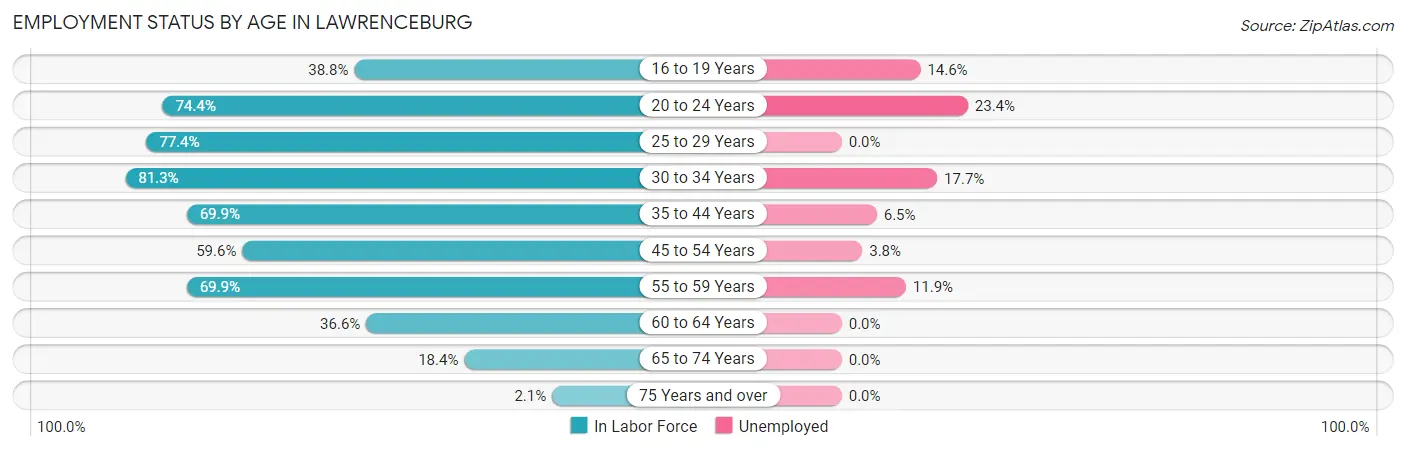
| Age Bracket | In Labor Force | Unemployed |
| 16 to 19 Years | 130 (38.8%) | 19 (14.6%) |
| 20 to 24 Years | 499 (74.4%) | 117 (23.4%) |
| 25 to 29 Years | 593 (77.4%) | 0 (0.0%) |
| 30 to 34 Years | 888 (81.3%) | 157 (17.7%) |
| 35 to 44 Years | 940 (69.9%) | 61 (6.5%) |
| 45 to 54 Years | 759 (59.6%) | 29 (3.8%) |
| 55 to 59 Years | 488 (69.9%) | 58 (11.9%) |
| 60 to 64 Years | 213 (36.6%) | 0 (0.0%) |
| 65 to 74 Years | 222 (18.4%) | 0 (0.0%) |
| 75 Years and over | 21 (2.1%) | 0 (0.0%) |
| Total | 4,754 (53.1%) | 442 (9.3%) |
Employment Status by Educational Attainment in Lawrenceburg
According to labor force statistics for Lawrenceburg, 67.4% of individuals (3,880) out of the total population between 25 and 64 years of age (5,756) are in the labor force, with 7.9% or 307 of them being unemployed. The group with the highest labor force participation rate are those with the educational attainment of bachelor's degree or higher, with 94.2% or 799 individuals in the labor force. Within the labor force, individuals with less than high school education have the highest percentage of unemployment, with 31.4% or 91 of them being unemployed.
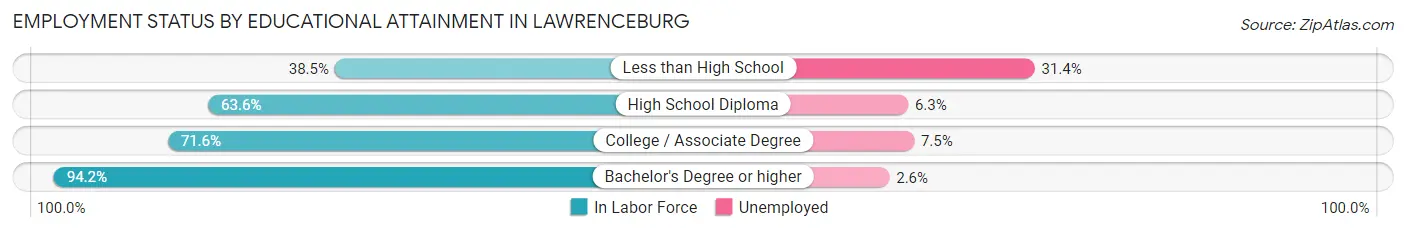
| Educational Attainment | In Labor Force | Unemployed |
| Less than High School | 290 (38.5%) | 237 (31.4%) |
| High School Diploma | 1,453 (63.6%) | 144 (6.3%) |
| College / Associate Degree | 1,339 (71.6%) | 140 (7.5%) |
| Bachelor's Degree or higher | 799 (94.2%) | 22 (2.6%) |
| Total | 3,880 (67.4%) | 455 (7.9%) |
Employment Occupations by Sex in Lawrenceburg
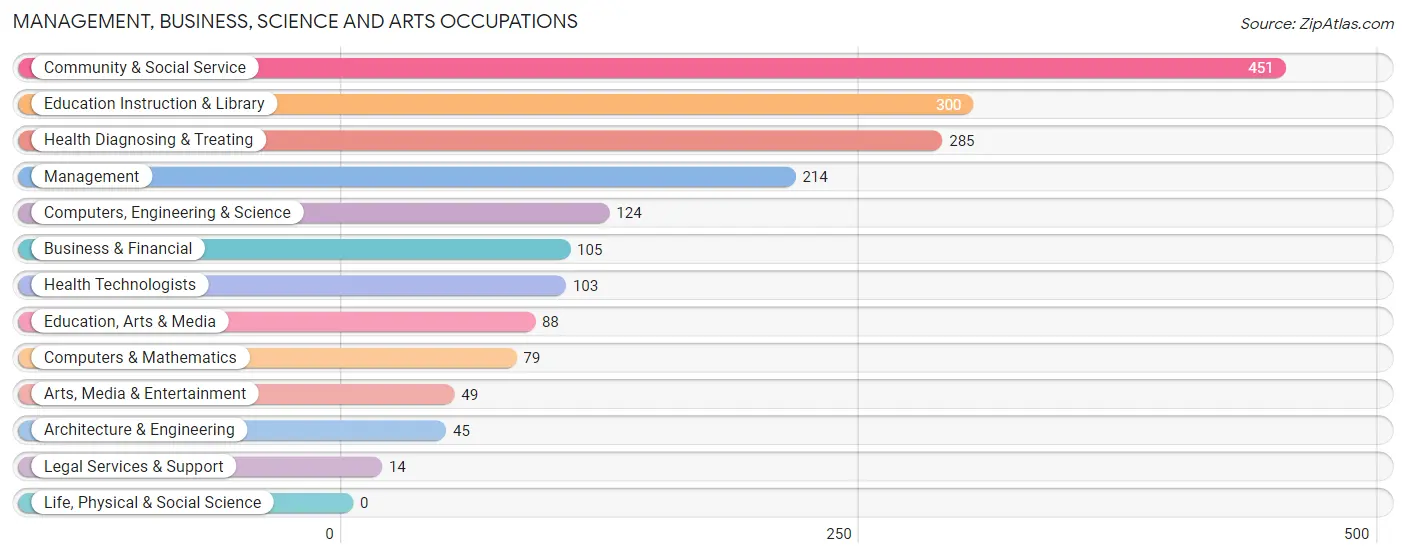
Management, Business, Science and Arts Occupations
The most common Management, Business, Science and Arts occupations in Lawrenceburg are Community & Social Service (451 | 10.5%), Education Instruction & Library (300 | 7.0%), Health Diagnosing & Treating (285 | 6.6%), Management (214 | 5.0%), and Computers, Engineering & Science (124 | 2.9%).
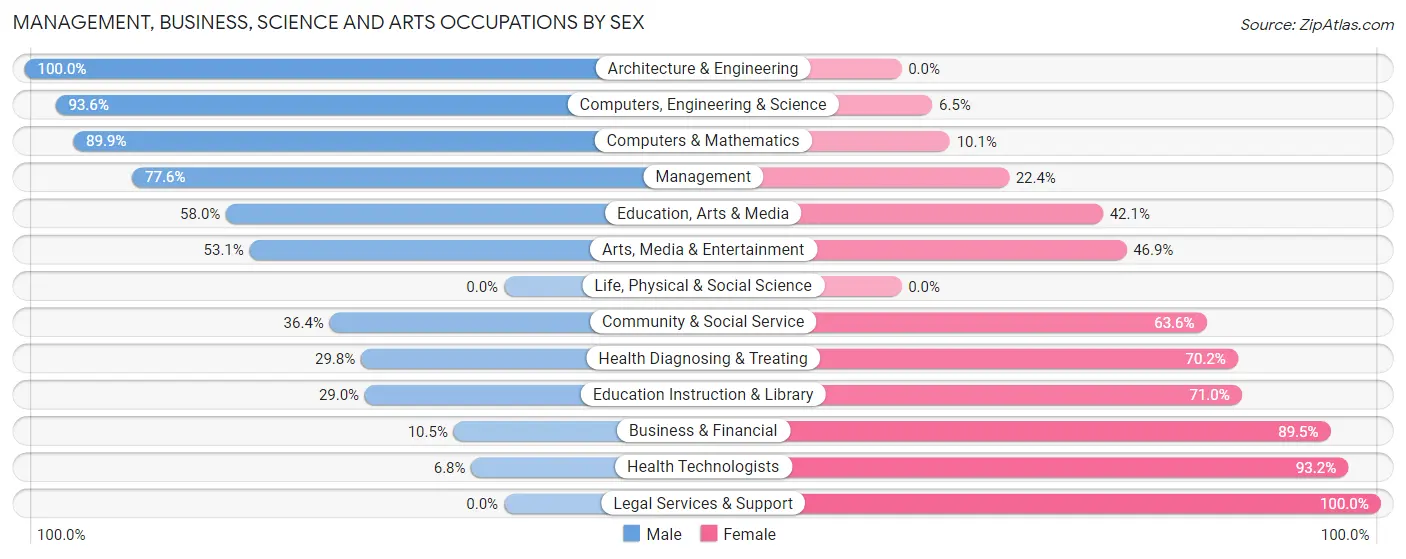
Management, Business, Science and Arts Occupations by Sex
Within the Management, Business, Science and Arts occupations in Lawrenceburg, the most male-oriented occupations are Architecture & Engineering (100.0%), Computers, Engineering & Science (93.5%), and Computers & Mathematics (89.9%), while the most female-oriented occupations are Legal Services & Support (100.0%), Health Technologists (93.2%), and Business & Financial (89.5%).
| Occupation | Male | Female |
| Management | 166 (77.6%) | 48 (22.4%) |
| Business & Financial | 11 (10.5%) | 94 (89.5%) |
| Computers, Engineering & Science | 116 (93.5%) | 8 (6.5%) |
| Computers & Mathematics | 71 (89.9%) | 8 (10.1%) |
| Architecture & Engineering | 45 (100.0%) | 0 (0.0%) |
| Life, Physical & Social Science | 0 (0.0%) | 0 (0.0%) |
| Community & Social Service | 164 (36.4%) | 287 (63.6%) |
| Education, Arts & Media | 51 (58.0%) | 37 (42.0%) |
| Legal Services & Support | 0 (0.0%) | 14 (100.0%) |
| Education Instruction & Library | 87 (29.0%) | 213 (71.0%) |
| Arts, Media & Entertainment | 26 (53.1%) | 23 (46.9%) |
| Health Diagnosing & Treating | 85 (29.8%) | 200 (70.2%) |
| Health Technologists | 7 (6.8%) | 96 (93.2%) |
| Total (Category) | 542 (46.0%) | 637 (54.0%) |
| Total (Overall) | 2,164 (50.3%) | 2,137 (49.7%) |
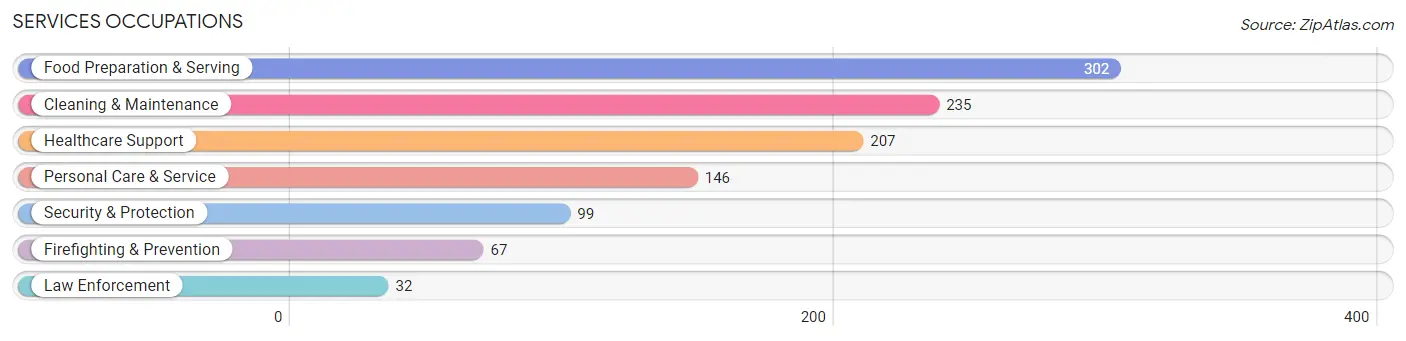
Services Occupations
The most common Services occupations in Lawrenceburg are Food Preparation & Serving (302 | 7.0%), Cleaning & Maintenance (235 | 5.5%), Healthcare Support (207 | 4.8%), Personal Care & Service (146 | 3.4%), and Security & Protection (99 | 2.3%).
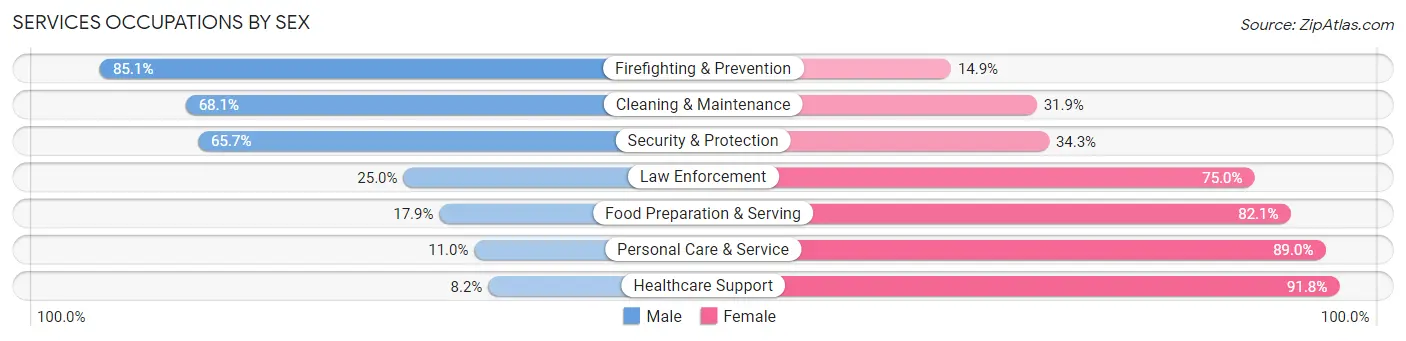
Services Occupations by Sex
Within the Services occupations in Lawrenceburg, the most male-oriented occupations are Firefighting & Prevention (85.1%), Cleaning & Maintenance (68.1%), and Security & Protection (65.7%), while the most female-oriented occupations are Healthcare Support (91.8%), Personal Care & Service (89.0%), and Food Preparation & Serving (82.1%).
| Occupation | Male | Female |
| Healthcare Support | 17 (8.2%) | 190 (91.8%) |
| Security & Protection | 65 (65.7%) | 34 (34.3%) |
| Firefighting & Prevention | 57 (85.1%) | 10 (14.9%) |
| Law Enforcement | 8 (25.0%) | 24 (75.0%) |
| Food Preparation & Serving | 54 (17.9%) | 248 (82.1%) |
| Cleaning & Maintenance | 160 (68.1%) | 75 (31.9%) |
| Personal Care & Service | 16 (11.0%) | 130 (89.0%) |
| Total (Category) | 312 (31.6%) | 677 (68.4%) |
| Total (Overall) | 2,164 (50.3%) | 2,137 (49.7%) |
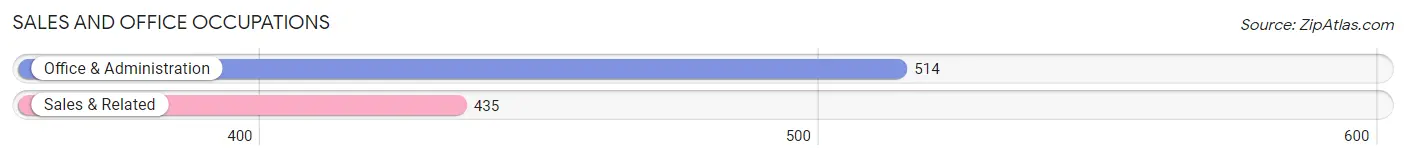
Sales and Office Occupations
The most common Sales and Office occupations in Lawrenceburg are Office & Administration (514 | 11.9%), and Sales & Related (435 | 10.1%).
Sales and Office Occupations by Sex
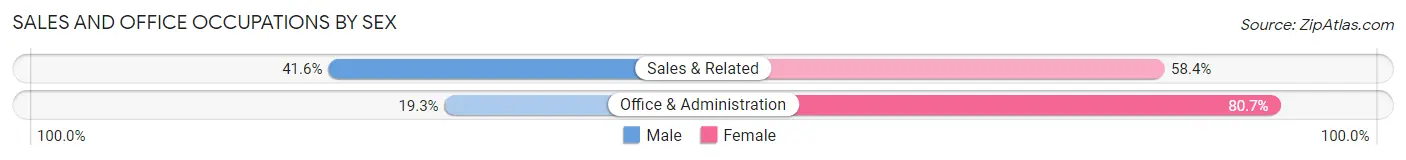
| Occupation | Male | Female |
| Sales & Related | 181 (41.6%) | 254 (58.4%) |
| Office & Administration | 99 (19.3%) | 415 (80.7%) |
| Total (Category) | 280 (29.5%) | 669 (70.5%) |
| Total (Overall) | 2,164 (50.3%) | 2,137 (49.7%) |
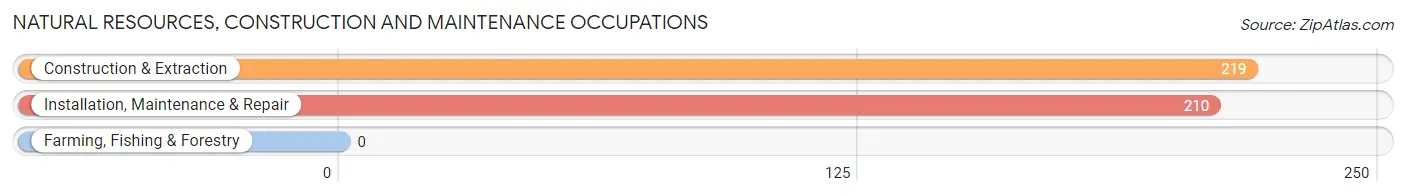
Natural Resources, Construction and Maintenance Occupations
The most common Natural Resources, Construction and Maintenance occupations in Lawrenceburg are Construction & Extraction (219 | 5.1%), and Installation, Maintenance & Repair (210 | 4.9%).
Natural Resources, Construction and Maintenance Occupations by Sex
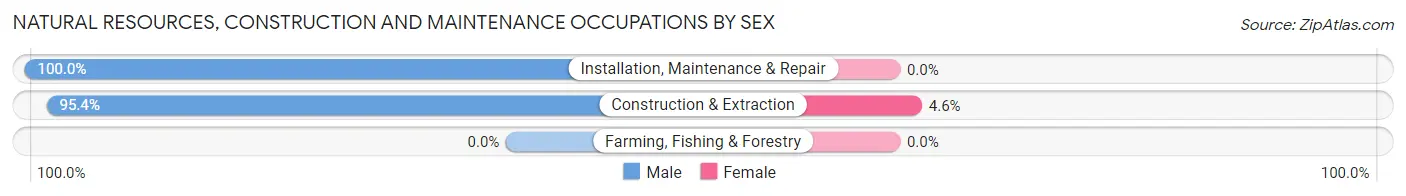
| Occupation | Male | Female |
| Farming, Fishing & Forestry | 0 (0.0%) | 0 (0.0%) |
| Construction & Extraction | 209 (95.4%) | 10 (4.6%) |
| Installation, Maintenance & Repair | 210 (100.0%) | 0 (0.0%) |
| Total (Category) | 419 (97.7%) | 10 (2.3%) |
| Total (Overall) | 2,164 (50.3%) | 2,137 (49.7%) |
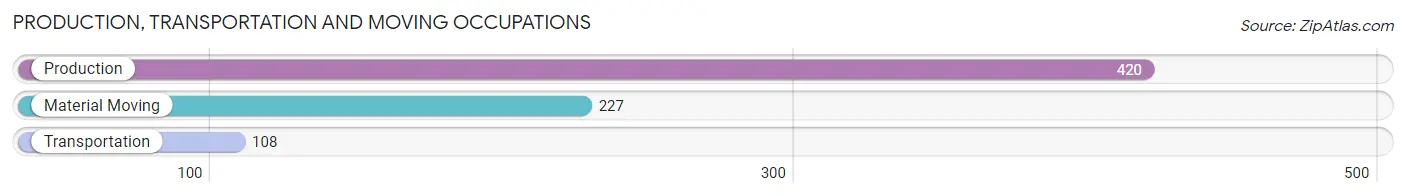
Production, Transportation and Moving Occupations
The most common Production, Transportation and Moving occupations in Lawrenceburg are Production (420 | 9.8%), Material Moving (227 | 5.3%), and Transportation (108 | 2.5%).
Production, Transportation and Moving Occupations by Sex
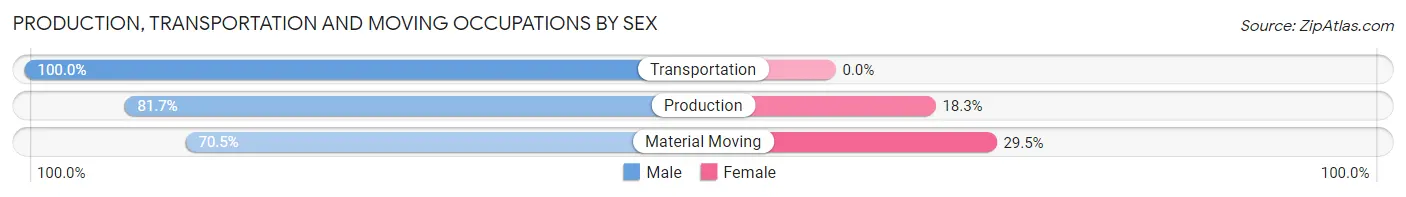
| Occupation | Male | Female |
| Production | 343 (81.7%) | 77 (18.3%) |
| Transportation | 108 (100.0%) | 0 (0.0%) |
| Material Moving | 160 (70.5%) | 67 (29.5%) |
| Total (Category) | 611 (80.9%) | 144 (19.1%) |
| Total (Overall) | 2,164 (50.3%) | 2,137 (49.7%) |
Employment Industries by Sex in Lawrenceburg
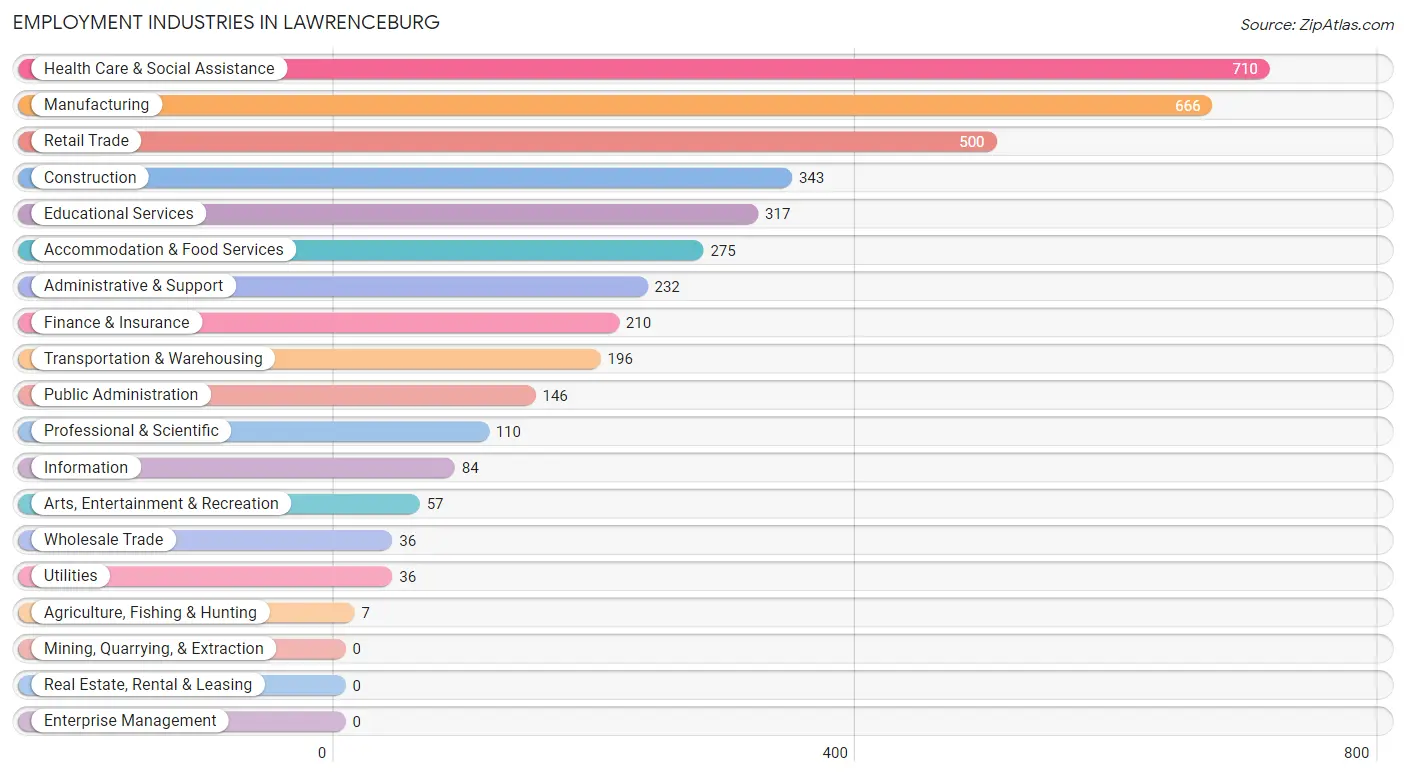
Employment Industries in Lawrenceburg
The major employment industries in Lawrenceburg include Health Care & Social Assistance (710 | 16.5%), Manufacturing (666 | 15.5%), Retail Trade (500 | 11.6%), Construction (343 | 8.0%), and Educational Services (317 | 7.4%).
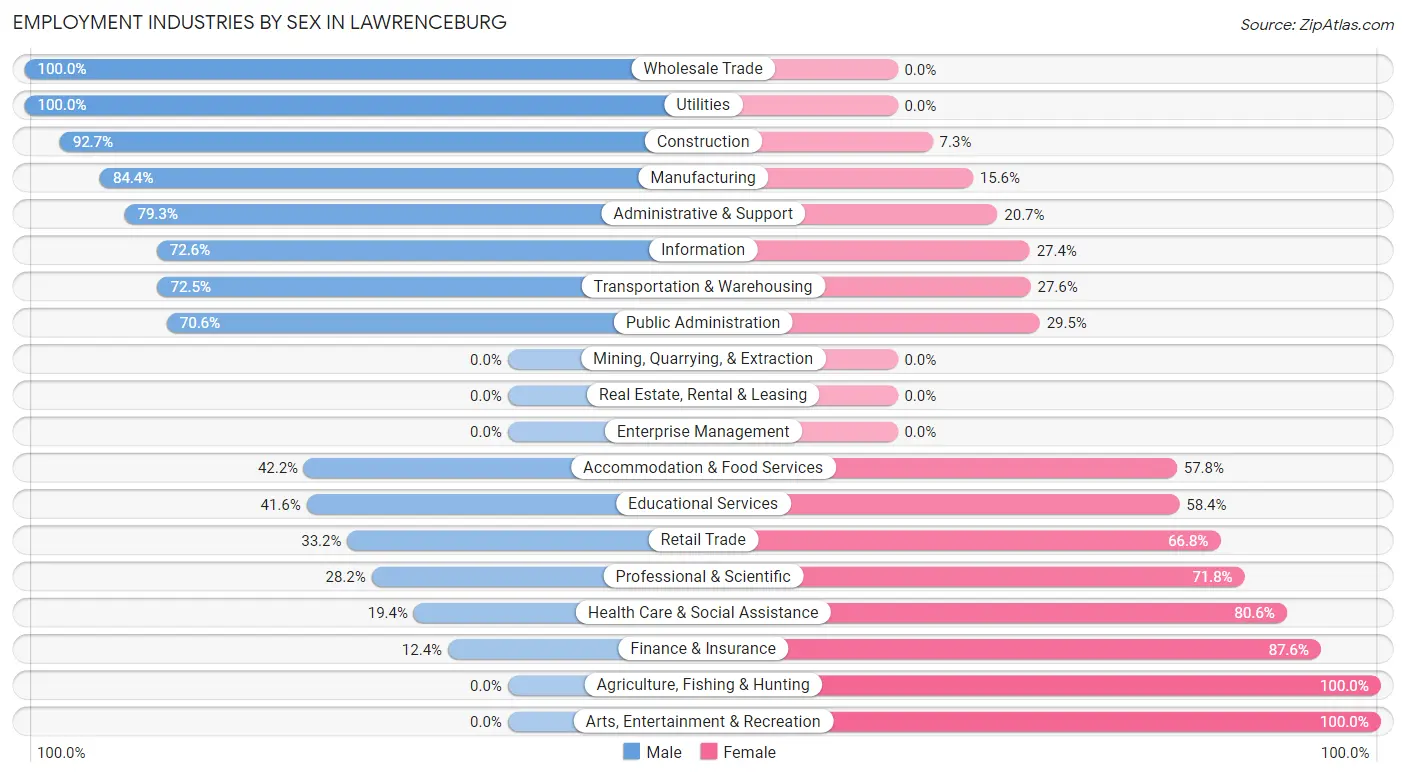
Employment Industries by Sex in Lawrenceburg
The Lawrenceburg industries that see more men than women are Wholesale Trade (100.0%), Utilities (100.0%), and Construction (92.7%), whereas the industries that tend to have a higher number of women are Agriculture, Fishing & Hunting (100.0%), Arts, Entertainment & Recreation (100.0%), and Finance & Insurance (87.6%).
| Industry | Male | Female |
| Agriculture, Fishing & Hunting | 0 (0.0%) | 7 (100.0%) |
| Mining, Quarrying, & Extraction | 0 (0.0%) | 0 (0.0%) |
| Construction | 318 (92.7%) | 25 (7.3%) |
| Manufacturing | 562 (84.4%) | 104 (15.6%) |
| Wholesale Trade | 36 (100.0%) | 0 (0.0%) |
| Retail Trade | 166 (33.2%) | 334 (66.8%) |
| Transportation & Warehousing | 142 (72.5%) | 54 (27.6%) |
| Utilities | 36 (100.0%) | 0 (0.0%) |
| Information | 61 (72.6%) | 23 (27.4%) |
| Finance & Insurance | 26 (12.4%) | 184 (87.6%) |
| Real Estate, Rental & Leasing | 0 (0.0%) | 0 (0.0%) |
| Professional & Scientific | 31 (28.2%) | 79 (71.8%) |
| Enterprise Management | 0 (0.0%) | 0 (0.0%) |
| Administrative & Support | 184 (79.3%) | 48 (20.7%) |
| Educational Services | 132 (41.6%) | 185 (58.4%) |
| Health Care & Social Assistance | 138 (19.4%) | 572 (80.6%) |
| Arts, Entertainment & Recreation | 0 (0.0%) | 57 (100.0%) |
| Accommodation & Food Services | 116 (42.2%) | 159 (57.8%) |
| Public Administration | 103 (70.6%) | 43 (29.4%) |
| Total | 2,164 (50.3%) | 2,137 (49.7%) |
Education in Lawrenceburg
School Enrollment in Lawrenceburg
The most common levels of schooling among the 2,464 students in Lawrenceburg are elementary school (655 | 26.6%), middle school (504 | 20.4%), and nursery / preschool (492 | 20.0%).
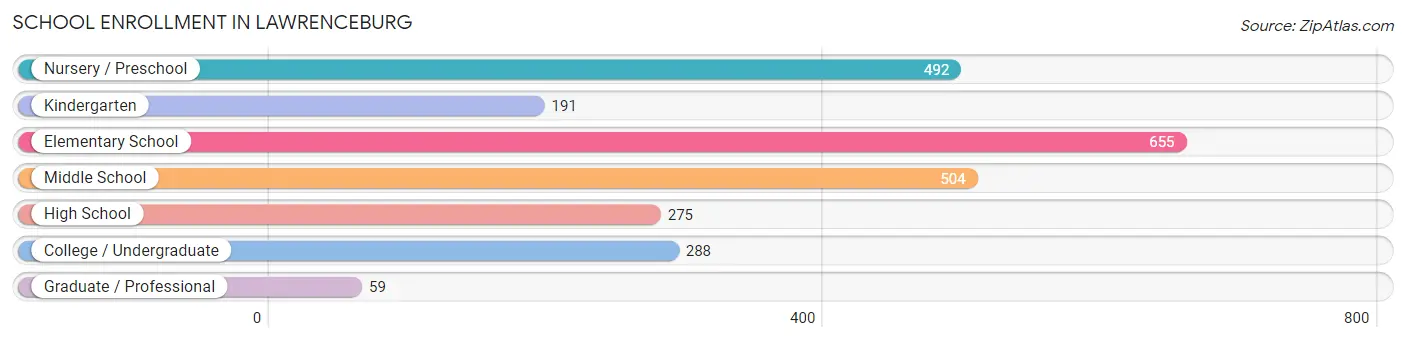
| School Level | # Students | % Students |
| Nursery / Preschool | 492 | 20.0% |
| Kindergarten | 191 | 7.7% |
| Elementary School | 655 | 26.6% |
| Middle School | 504 | 20.4% |
| High School | 275 | 11.2% |
| College / Undergraduate | 288 | 11.7% |
| Graduate / Professional | 59 | 2.4% |
| Total | 2,464 | 100.0% |
School Enrollment by Age by Funding Source in Lawrenceburg
Out of a total of 2,464 students who are enrolled in schools in Lawrenceburg, 436 (17.7%) attend a private institution, while the remaining 2,028 (82.3%) are enrolled in public schools. The age group of 35 years and over has the highest likelihood of being enrolled in private schools, with 46 (48.4% in the age bracket) enrolled. Conversely, the age group of 10 to 14 year olds has the lowest likelihood of being enrolled in a private school, with 544 (89.6% in the age bracket) attending a public institution.
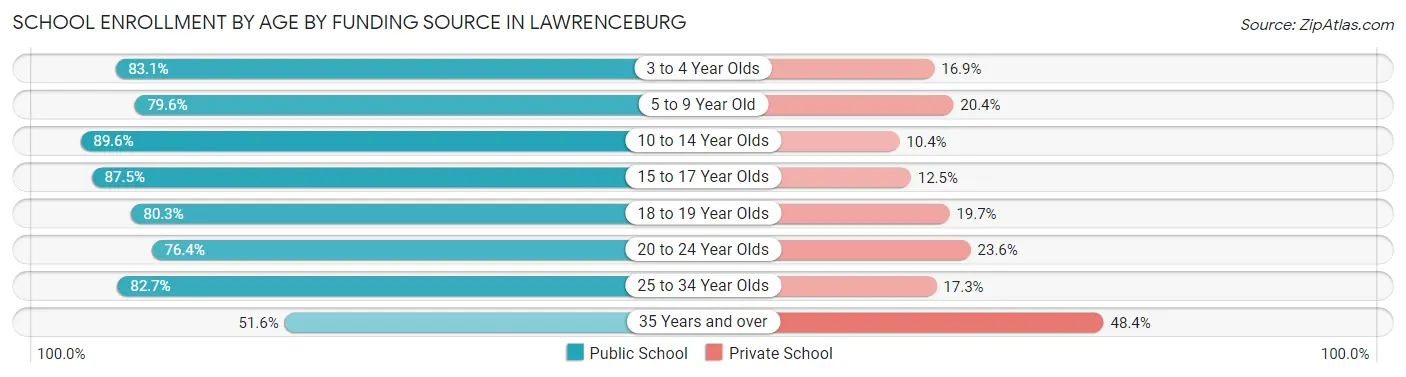
| Age Bracket | Public School | Private School |
| 3 to 4 Year Olds | 330 (83.1%) | 67 (16.9%) |
| 5 to 9 Year Old | 674 (79.6%) | 173 (20.4%) |
| 10 to 14 Year Olds | 544 (89.6%) | 63 (10.4%) |
| 15 to 17 Year Olds | 203 (87.5%) | 29 (12.5%) |
| 18 to 19 Year Olds | 53 (80.3%) | 13 (19.7%) |
| 20 to 24 Year Olds | 84 (76.4%) | 26 (23.6%) |
| 25 to 34 Year Olds | 91 (82.7%) | 19 (17.3%) |
| 35 Years and over | 49 (51.6%) | 46 (48.4%) |
| Total | 2,028 (82.3%) | 436 (17.7%) |
Educational Attainment by Field of Study in Lawrenceburg
Education (362 | 25.3%), business (313 | 21.8%), liberal arts & history (173 | 12.1%), science & technology (100 | 7.0%), and bio, nature & agricultural (90 | 6.3%) are the most common fields of study among 1,433 individuals in Lawrenceburg who have obtained a bachelor's degree or higher.
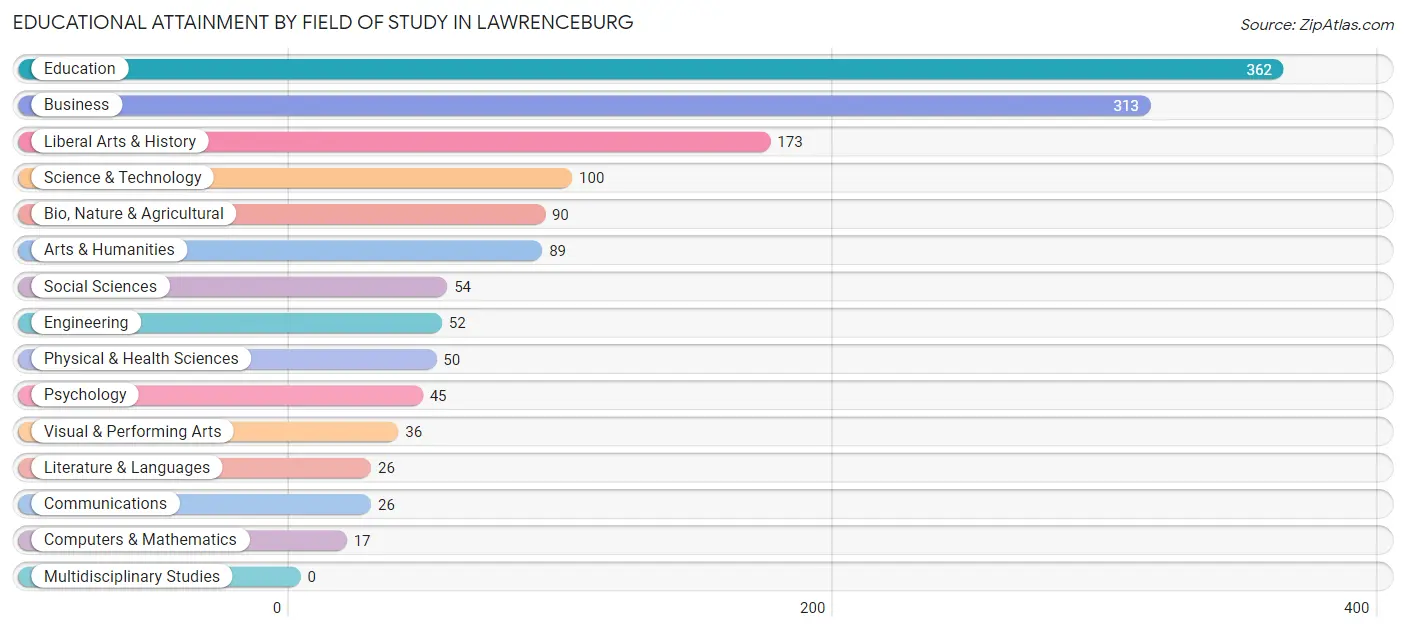
| Field of Study | # Graduates | % Graduates |
| Computers & Mathematics | 17 | 1.2% |
| Bio, Nature & Agricultural | 90 | 6.3% |
| Physical & Health Sciences | 50 | 3.5% |
| Psychology | 45 | 3.1% |
| Social Sciences | 54 | 3.8% |
| Engineering | 52 | 3.6% |
| Multidisciplinary Studies | 0 | 0.0% |
| Science & Technology | 100 | 7.0% |
| Business | 313 | 21.8% |
| Education | 362 | 25.3% |
| Literature & Languages | 26 | 1.8% |
| Liberal Arts & History | 173 | 12.1% |
| Visual & Performing Arts | 36 | 2.5% |
| Communications | 26 | 1.8% |
| Arts & Humanities | 89 | 6.2% |
| Total | 1,433 | 100.0% |
Transportation & Commute in Lawrenceburg
Vehicle Availability by Sex in Lawrenceburg
The most prevalent vehicle ownership categories in Lawrenceburg are males with 2 vehicles (941, accounting for 43.5%) and females with 2 vehicles (557, making up 44.5%).
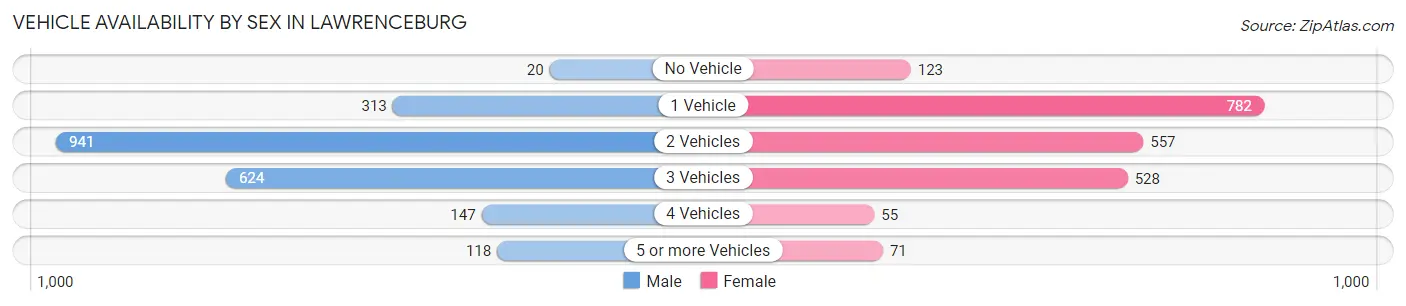
| Vehicles Available | Male | Female |
| No Vehicle | 20 (0.9%) | 123 (5.8%) |
| 1 Vehicle | 313 (14.5%) | 782 (37.0%) |
| 2 Vehicles | 941 (43.5%) | 557 (26.3%) |
| 3 Vehicles | 624 (28.8%) | 528 (24.9%) |
| 4 Vehicles | 147 (6.8%) | 55 (2.6%) |
| 5 or more Vehicles | 118 (5.5%) | 71 (3.4%) |
| Total | 2,163 (100.0%) | 2,116 (100.0%) |
Commute Time in Lawrenceburg
The most frequently occuring commute durations in Lawrenceburg are 5 to 9 minutes (988 commuters, 24.8%), 10 to 14 minutes (732 commuters, 18.4%), and 15 to 19 minutes (546 commuters, 13.7%).
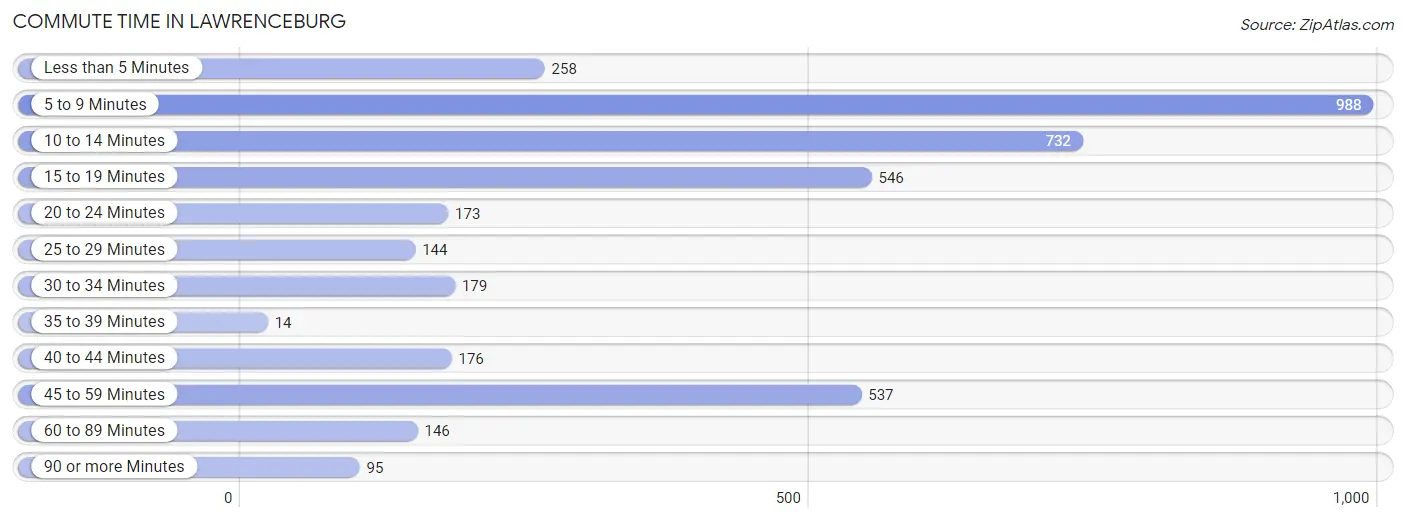
| Commute Time | # Commuters | % Commuters |
| Less than 5 Minutes | 258 | 6.5% |
| 5 to 9 Minutes | 988 | 24.8% |
| 10 to 14 Minutes | 732 | 18.4% |
| 15 to 19 Minutes | 546 | 13.7% |
| 20 to 24 Minutes | 173 | 4.3% |
| 25 to 29 Minutes | 144 | 3.6% |
| 30 to 34 Minutes | 179 | 4.5% |
| 35 to 39 Minutes | 14 | 0.4% |
| 40 to 44 Minutes | 176 | 4.4% |
| 45 to 59 Minutes | 537 | 13.5% |
| 60 to 89 Minutes | 146 | 3.7% |
| 90 or more Minutes | 95 | 2.4% |
Commute Time by Sex in Lawrenceburg
The most common commute times in Lawrenceburg are 5 to 9 minutes (464 commuters, 22.3%) for males and 5 to 9 minutes (524 commuters, 27.5%) for females.
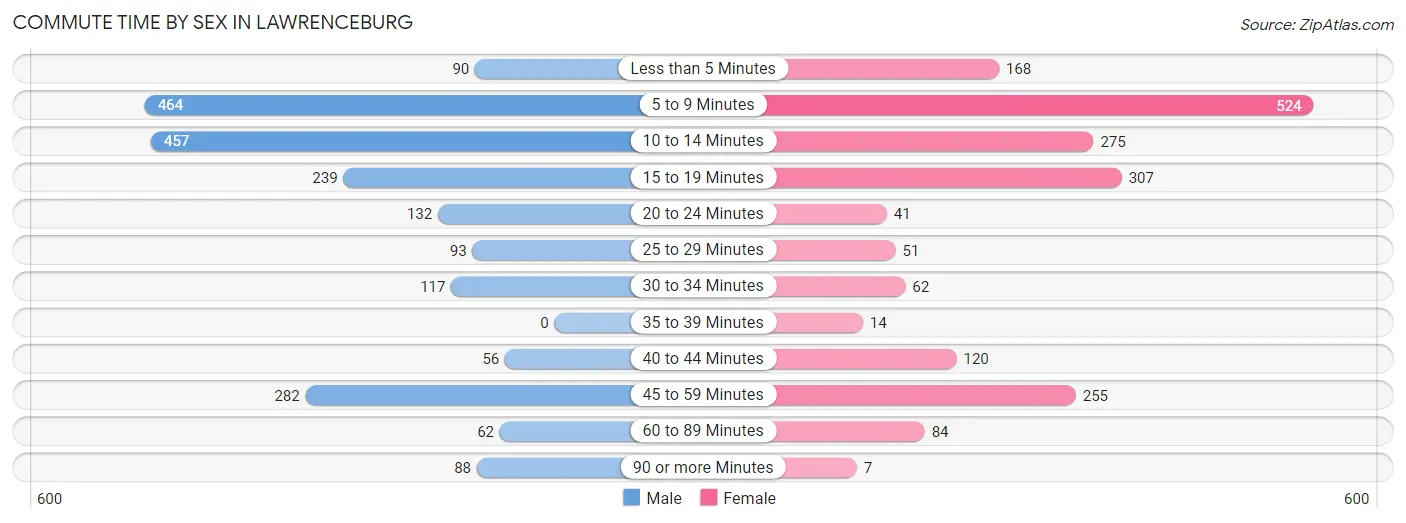
| Commute Time | Male | Female |
| Less than 5 Minutes | 90 (4.3%) | 168 (8.8%) |
| 5 to 9 Minutes | 464 (22.3%) | 524 (27.5%) |
| 10 to 14 Minutes | 457 (22.0%) | 275 (14.4%) |
| 15 to 19 Minutes | 239 (11.5%) | 307 (16.1%) |
| 20 to 24 Minutes | 132 (6.4%) | 41 (2.1%) |
| 25 to 29 Minutes | 93 (4.5%) | 51 (2.7%) |
| 30 to 34 Minutes | 117 (5.6%) | 62 (3.3%) |
| 35 to 39 Minutes | 0 (0.0%) | 14 (0.7%) |
| 40 to 44 Minutes | 56 (2.7%) | 120 (6.3%) |
| 45 to 59 Minutes | 282 (13.6%) | 255 (13.4%) |
| 60 to 89 Minutes | 62 (3.0%) | 84 (4.4%) |
| 90 or more Minutes | 88 (4.2%) | 7 (0.4%) |
Time of Departure to Work by Sex in Lawrenceburg
The most frequent times of departure to work in Lawrenceburg are 12:00 PM to 3:59 PM (308, 14.8%) for males and 7:30 AM to 7:59 AM (467, 24.5%) for females.
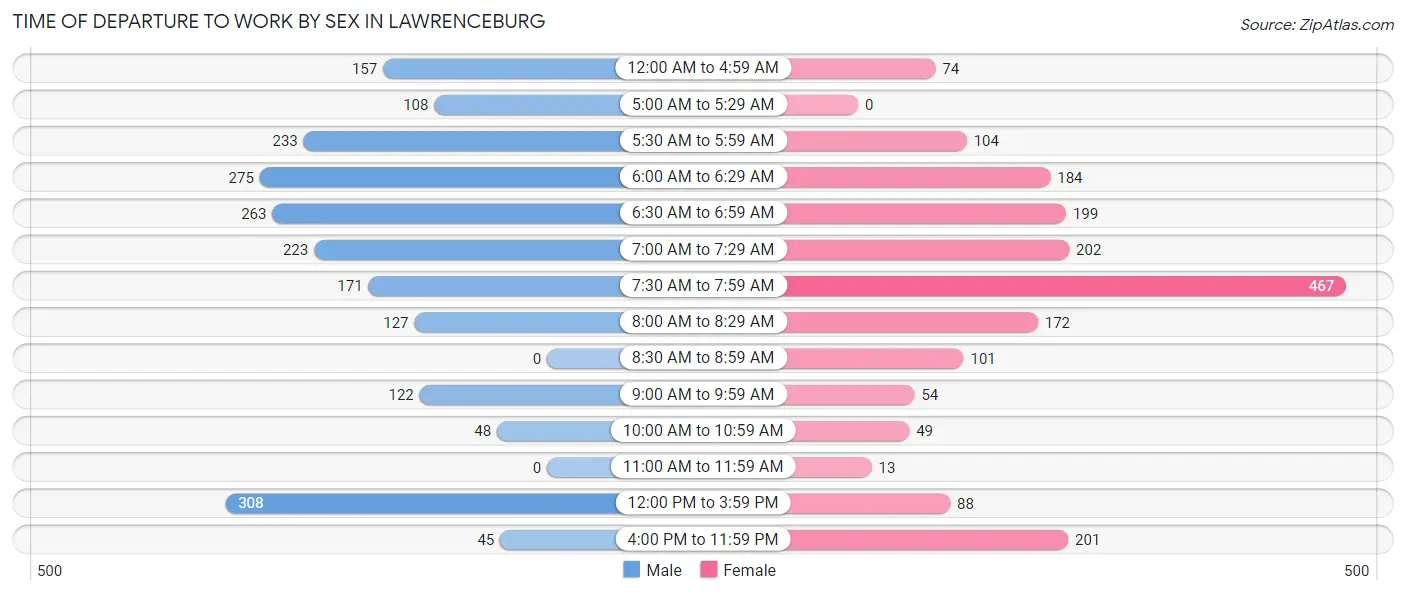
| Time of Departure | Male | Female |
| 12:00 AM to 4:59 AM | 157 (7.5%) | 74 (3.9%) |
| 5:00 AM to 5:29 AM | 108 (5.2%) | 0 (0.0%) |
| 5:30 AM to 5:59 AM | 233 (11.2%) | 104 (5.4%) |
| 6:00 AM to 6:29 AM | 275 (13.2%) | 184 (9.6%) |
| 6:30 AM to 6:59 AM | 263 (12.6%) | 199 (10.4%) |
| 7:00 AM to 7:29 AM | 223 (10.7%) | 202 (10.6%) |
| 7:30 AM to 7:59 AM | 171 (8.2%) | 467 (24.5%) |
| 8:00 AM to 8:29 AM | 127 (6.1%) | 172 (9.0%) |
| 8:30 AM to 8:59 AM | 0 (0.0%) | 101 (5.3%) |
| 9:00 AM to 9:59 AM | 122 (5.9%) | 54 (2.8%) |
| 10:00 AM to 10:59 AM | 48 (2.3%) | 49 (2.6%) |
| 11:00 AM to 11:59 AM | 0 (0.0%) | 13 (0.7%) |
| 12:00 PM to 3:59 PM | 308 (14.8%) | 88 (4.6%) |
| 4:00 PM to 11:59 PM | 45 (2.2%) | 201 (10.5%) |
| Total | 2,080 (100.0%) | 1,908 (100.0%) |
Housing Occupancy in Lawrenceburg
Occupancy by Ownership in Lawrenceburg
Of the total 4,866 dwellings in Lawrenceburg, owner-occupied units account for 2,573 (52.9%), while renter-occupied units make up 2,293 (47.1%).
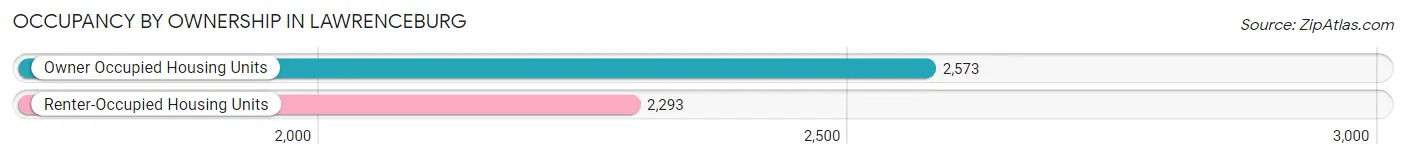
| Occupancy | # Housing Units | % Housing Units |
| Owner Occupied Housing Units | 2,573 | 52.9% |
| Renter-Occupied Housing Units | 2,293 | 47.1% |
| Total Occupied Housing Units | 4,866 | 100.0% |
Occupancy by Household Size in Lawrenceburg
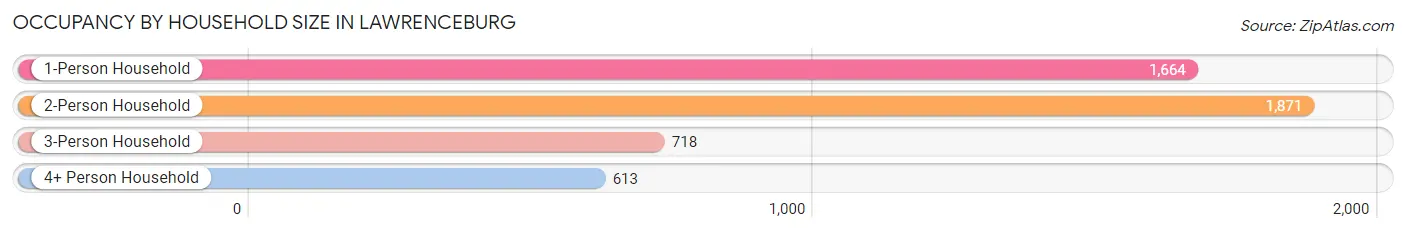
| Household Size | # Housing Units | % Housing Units |
| 1-Person Household | 1,664 | 34.2% |
| 2-Person Household | 1,871 | 38.5% |
| 3-Person Household | 718 | 14.8% |
| 4+ Person Household | 613 | 12.6% |
| Total Housing Units | 4,866 | 100.0% |
Occupancy by Ownership by Household Size in Lawrenceburg
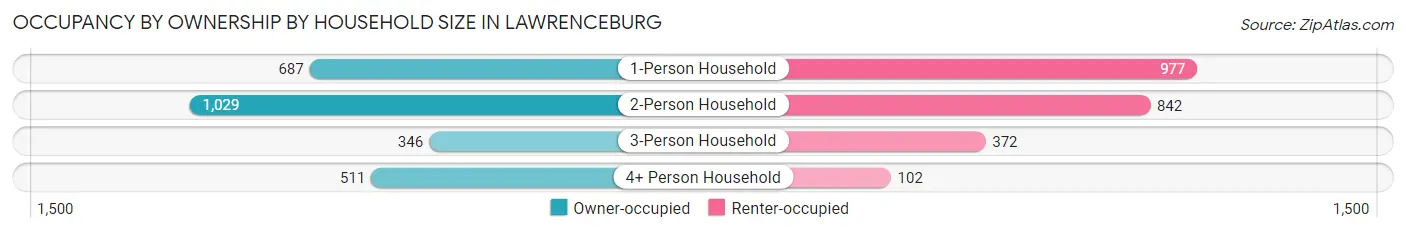
| Household Size | Owner-occupied | Renter-occupied |
| 1-Person Household | 687 (41.3%) | 977 (58.7%) |
| 2-Person Household | 1,029 (55.0%) | 842 (45.0%) |
| 3-Person Household | 346 (48.2%) | 372 (51.8%) |
| 4+ Person Household | 511 (83.4%) | 102 (16.6%) |
| Total Housing Units | 2,573 (52.9%) | 2,293 (47.1%) |
Occupancy by Educational Attainment in Lawrenceburg
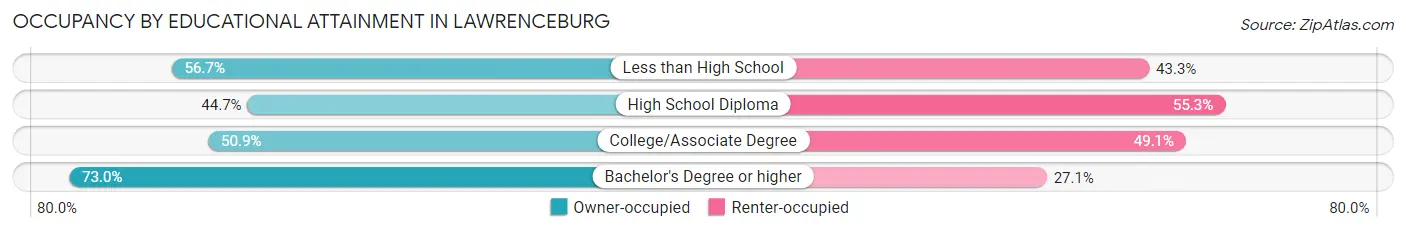
| Household Size | Owner-occupied | Renter-occupied |
| Less than High School | 313 (56.7%) | 239 (43.3%) |
| High School Diploma | 886 (44.7%) | 1,098 (55.3%) |
| College/Associate Degree | 751 (50.9%) | 725 (49.1%) |
| Bachelor's Degree or higher | 623 (73.0%) | 231 (27.1%) |
Occupancy by Age of Householder in Lawrenceburg
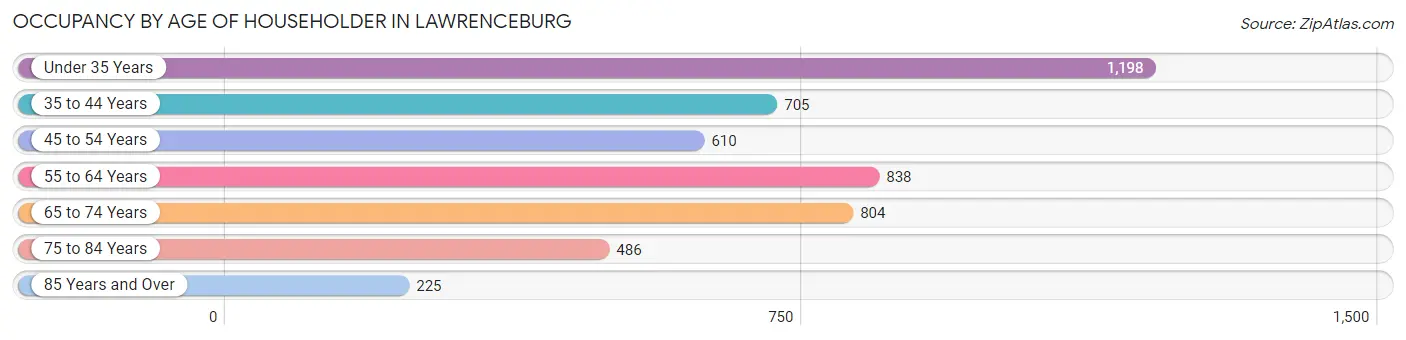
| Age Bracket | # Households | % Households |
| Under 35 Years | 1,198 | 24.6% |
| 35 to 44 Years | 705 | 14.5% |
| 45 to 54 Years | 610 | 12.5% |
| 55 to 64 Years | 838 | 17.2% |
| 65 to 74 Years | 804 | 16.5% |
| 75 to 84 Years | 486 | 10.0% |
| 85 Years and Over | 225 | 4.6% |
| Total | 4,866 | 100.0% |
Housing Finances in Lawrenceburg
Median Income by Occupancy in Lawrenceburg
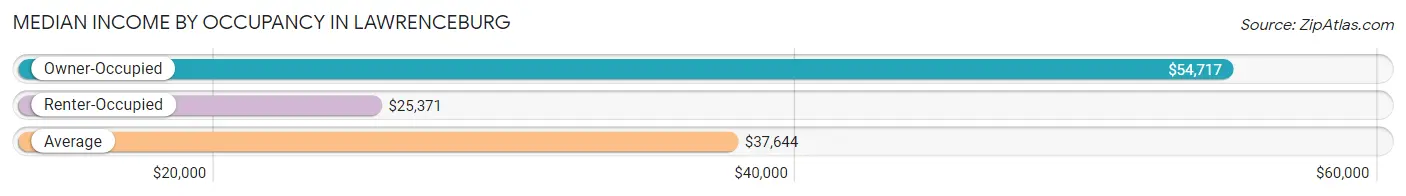
| Occupancy Type | # Households | Median Income |
| Owner-Occupied | 2,573 (52.9%) | $54,717 |
| Renter-Occupied | 2,293 (47.1%) | $25,371 |
| Average | 4,866 (100.0%) | $37,644 |
Occupancy by Householder Income Bracket in Lawrenceburg
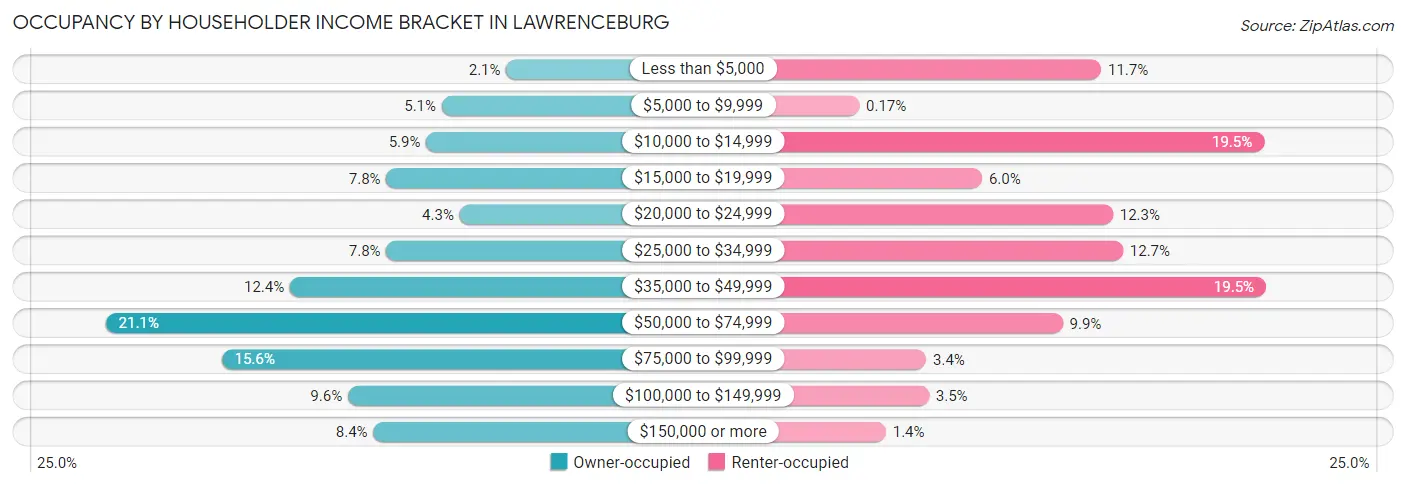
| Income Bracket | Owner-occupied | Renter-occupied |
| Less than $5,000 | 53 (2.1%) | 268 (11.7%) |
| $5,000 to $9,999 | 132 (5.1%) | 4 (0.2%) |
| $10,000 to $14,999 | 151 (5.9%) | 446 (19.5%) |
| $15,000 to $19,999 | 200 (7.8%) | 138 (6.0%) |
| $20,000 to $24,999 | 110 (4.3%) | 281 (12.2%) |
| $25,000 to $34,999 | 200 (7.8%) | 292 (12.7%) |
| $35,000 to $49,999 | 318 (12.4%) | 448 (19.5%) |
| $50,000 to $74,999 | 544 (21.1%) | 226 (9.9%) |
| $75,000 to $99,999 | 402 (15.6%) | 77 (3.4%) |
| $100,000 to $149,999 | 247 (9.6%) | 80 (3.5%) |
| $150,000 or more | 216 (8.4%) | 33 (1.4%) |
| Total | 2,573 (100.0%) | 2,293 (100.0%) |
Monthly Housing Cost Tiers in Lawrenceburg
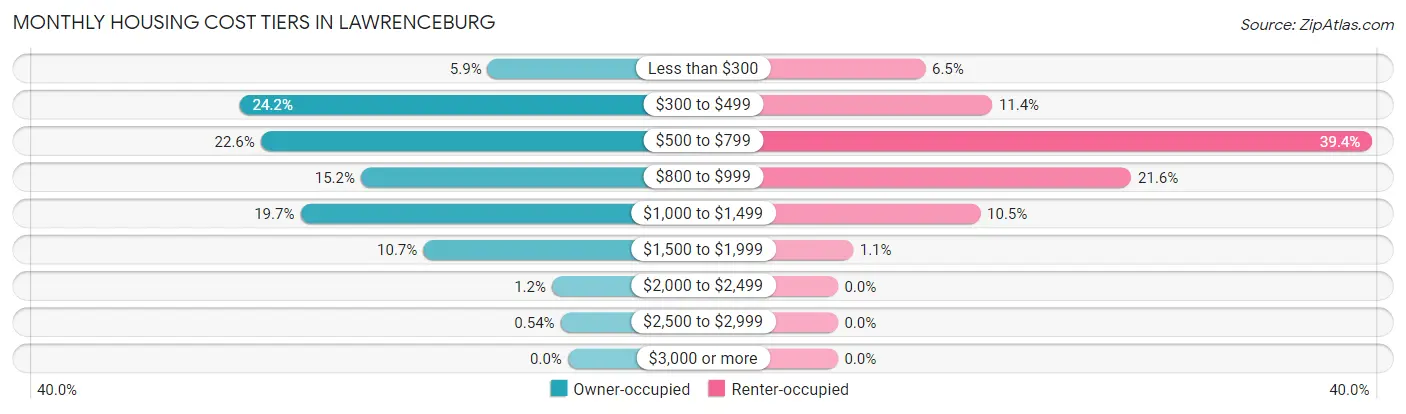
| Monthly Cost | Owner-occupied | Renter-occupied |
| Less than $300 | 152 (5.9%) | 148 (6.5%) |
| $300 to $499 | 622 (24.2%) | 261 (11.4%) |
| $500 to $799 | 582 (22.6%) | 903 (39.4%) |
| $800 to $999 | 392 (15.2%) | 496 (21.6%) |
| $1,000 to $1,499 | 507 (19.7%) | 241 (10.5%) |
| $1,500 to $1,999 | 274 (10.6%) | 26 (1.1%) |
| $2,000 to $2,499 | 30 (1.2%) | 0 (0.0%) |
| $2,500 to $2,999 | 14 (0.5%) | 0 (0.0%) |
| $3,000 or more | 0 (0.0%) | 0 (0.0%) |
| Total | 2,573 (100.0%) | 2,293 (100.0%) |
Physical Housing Characteristics in Lawrenceburg
Housing Structures in Lawrenceburg
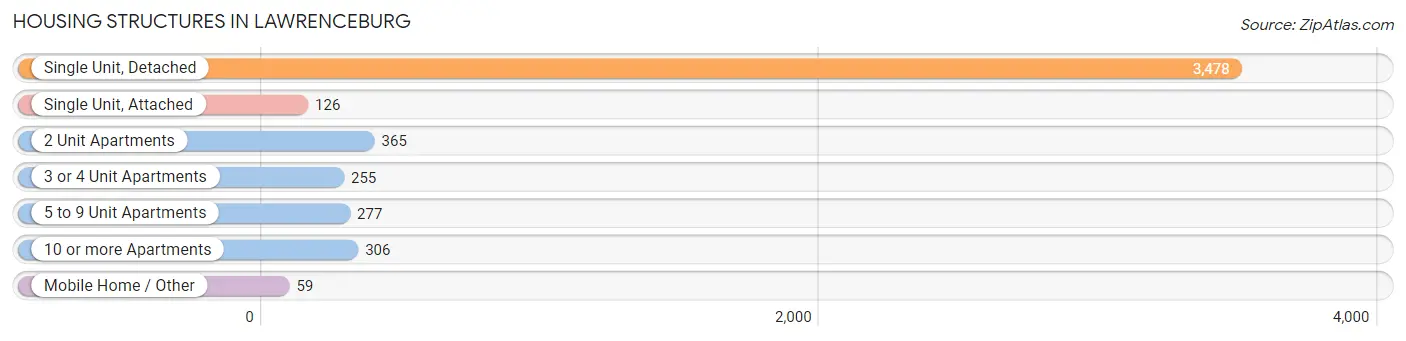
| Structure Type | # Housing Units | % Housing Units |
| Single Unit, Detached | 3,478 | 71.5% |
| Single Unit, Attached | 126 | 2.6% |
| 2 Unit Apartments | 365 | 7.5% |
| 3 or 4 Unit Apartments | 255 | 5.2% |
| 5 to 9 Unit Apartments | 277 | 5.7% |
| 10 or more Apartments | 306 | 6.3% |
| Mobile Home / Other | 59 | 1.2% |
| Total | 4,866 | 100.0% |
Housing Structures by Occupancy in Lawrenceburg
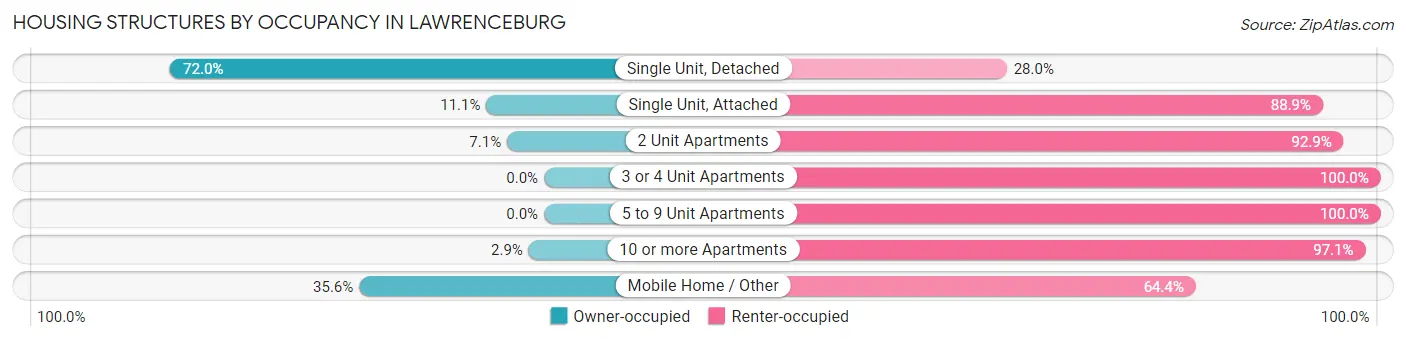
| Structure Type | Owner-occupied | Renter-occupied |
| Single Unit, Detached | 2,503 (72.0%) | 975 (28.0%) |
| Single Unit, Attached | 14 (11.1%) | 112 (88.9%) |
| 2 Unit Apartments | 26 (7.1%) | 339 (92.9%) |
| 3 or 4 Unit Apartments | 0 (0.0%) | 255 (100.0%) |
| 5 to 9 Unit Apartments | 0 (0.0%) | 277 (100.0%) |
| 10 or more Apartments | 9 (2.9%) | 297 (97.1%) |
| Mobile Home / Other | 21 (35.6%) | 38 (64.4%) |
| Total | 2,573 (52.9%) | 2,293 (47.1%) |
Housing Structures by Number of Rooms in Lawrenceburg
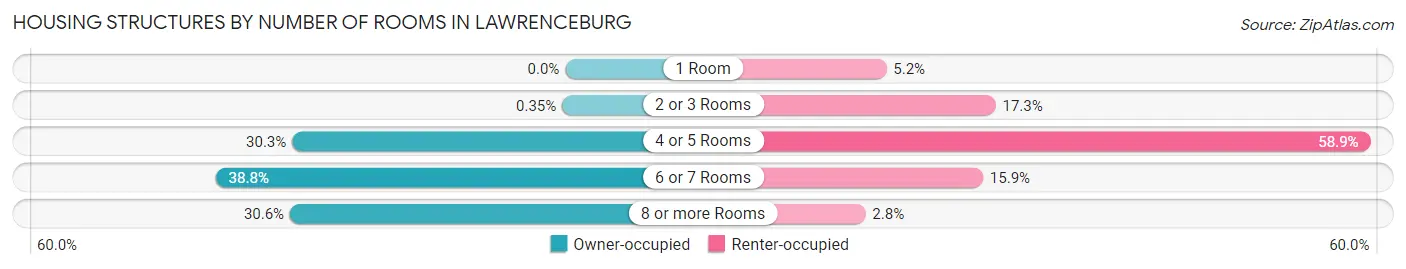
| Number of Rooms | Owner-occupied | Renter-occupied |
| 1 Room | 0 (0.0%) | 118 (5.1%) |
| 2 or 3 Rooms | 9 (0.4%) | 396 (17.3%) |
| 4 or 5 Rooms | 780 (30.3%) | 1,350 (58.9%) |
| 6 or 7 Rooms | 998 (38.8%) | 364 (15.9%) |
| 8 or more Rooms | 786 (30.5%) | 65 (2.8%) |
| Total | 2,573 (100.0%) | 2,293 (100.0%) |
Housing Structure by Heating Type in Lawrenceburg
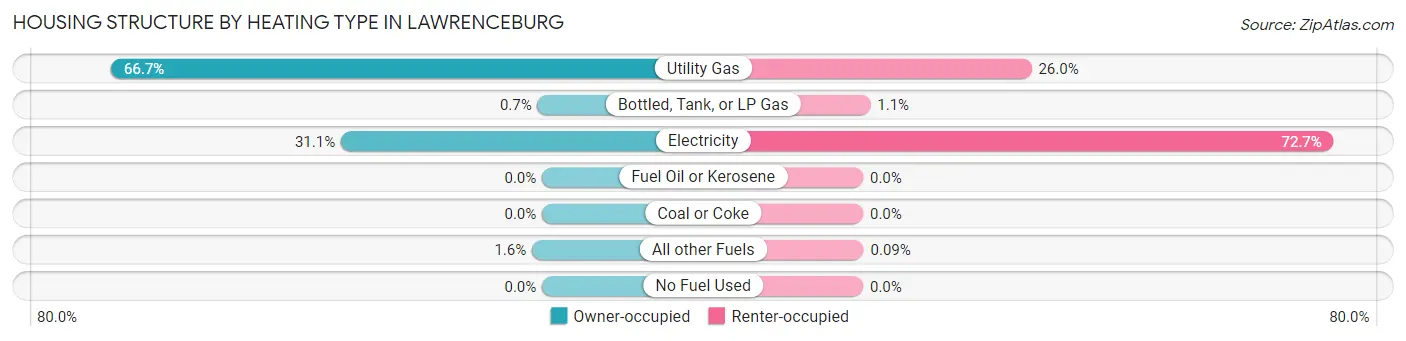
| Heating Type | Owner-occupied | Renter-occupied |
| Utility Gas | 1,715 (66.6%) | 597 (26.0%) |
| Bottled, Tank, or LP Gas | 18 (0.7%) | 26 (1.1%) |
| Electricity | 800 (31.1%) | 1,668 (72.7%) |
| Fuel Oil or Kerosene | 0 (0.0%) | 0 (0.0%) |
| Coal or Coke | 0 (0.0%) | 0 (0.0%) |
| All other Fuels | 40 (1.5%) | 2 (0.1%) |
| No Fuel Used | 0 (0.0%) | 0 (0.0%) |
| Total | 2,573 (100.0%) | 2,293 (100.0%) |
Household Vehicle Usage in Lawrenceburg
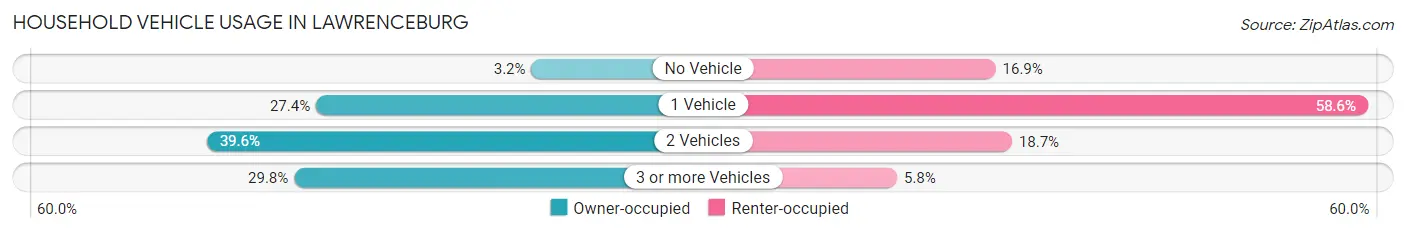
| Vehicles per Household | Owner-occupied | Renter-occupied |
| No Vehicle | 83 (3.2%) | 387 (16.9%) |
| 1 Vehicle | 704 (27.4%) | 1,343 (58.6%) |
| 2 Vehicles | 1,019 (39.6%) | 429 (18.7%) |
| 3 or more Vehicles | 767 (29.8%) | 134 (5.8%) |
| Total | 2,573 (100.0%) | 2,293 (100.0%) |
Real Estate & Mortgages in Lawrenceburg
Real Estate and Mortgage Overview in Lawrenceburg
| Characteristic | Without Mortgage | With Mortgage |
| Housing Units | 1,201 | 1,372 |
| Median Property Value | $138,700 | $155,700 |
| Median Household Income | $52,575 | $84 |
| Monthly Housing Costs | $445 | $0 |
| Real Estate Taxes | $993 | $52 |
Property Value by Mortgage Status in Lawrenceburg
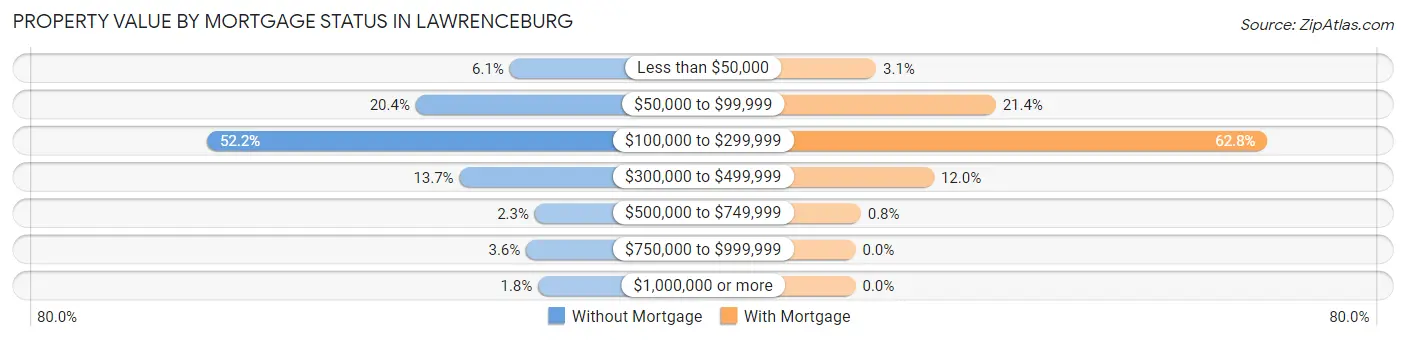
| Property Value | Without Mortgage | With Mortgage |
| Less than $50,000 | 73 (6.1%) | 43 (3.1%) |
| $50,000 to $99,999 | 245 (20.4%) | 293 (21.4%) |
| $100,000 to $299,999 | 627 (52.2%) | 861 (62.8%) |
| $300,000 to $499,999 | 165 (13.7%) | 164 (11.9%) |
| $500,000 to $749,999 | 27 (2.2%) | 11 (0.8%) |
| $750,000 to $999,999 | 43 (3.6%) | 0 (0.0%) |
| $1,000,000 or more | 21 (1.8%) | 0 (0.0%) |
| Total | 1,201 (100.0%) | 1,372 (100.0%) |
Household Income by Mortgage Status in Lawrenceburg
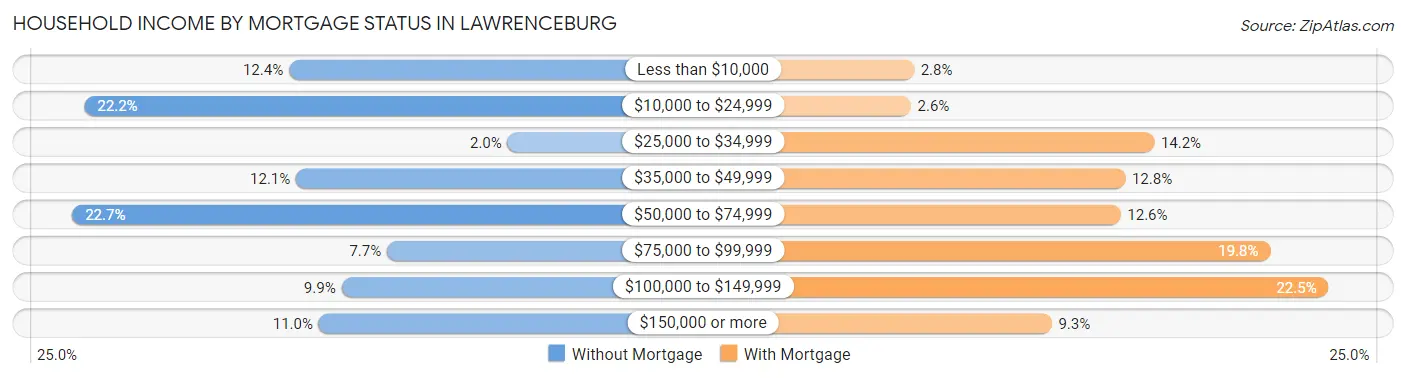
| Household Income | Without Mortgage | With Mortgage |
| Less than $10,000 | 149 (12.4%) | 38 (2.8%) |
| $10,000 to $24,999 | 266 (22.2%) | 36 (2.6%) |
| $25,000 to $34,999 | 24 (2.0%) | 195 (14.2%) |
| $35,000 to $49,999 | 145 (12.1%) | 176 (12.8%) |
| $50,000 to $74,999 | 273 (22.7%) | 173 (12.6%) |
| $75,000 to $99,999 | 93 (7.7%) | 271 (19.8%) |
| $100,000 to $149,999 | 119 (9.9%) | 309 (22.5%) |
| $150,000 or more | 132 (11.0%) | 128 (9.3%) |
| Total | 1,201 (100.0%) | 1,372 (100.0%) |
Property Value to Household Income Ratio in Lawrenceburg
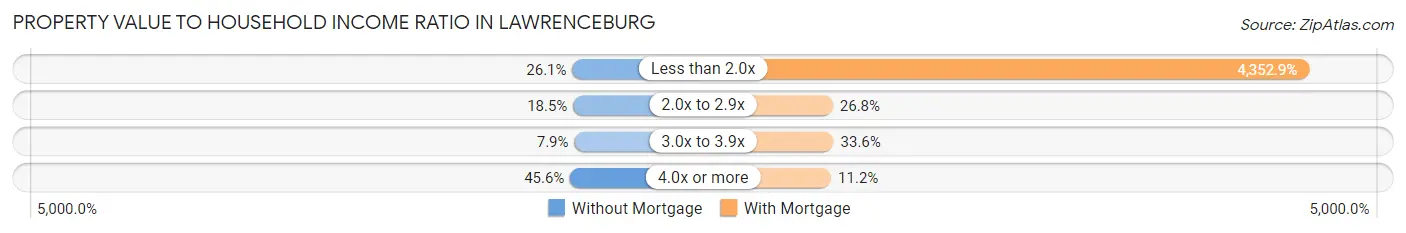
| Value-to-Income Ratio | Without Mortgage | With Mortgage |
| Less than 2.0x | 313 (26.1%) | 59,722 (4,352.9%) |
| 2.0x to 2.9x | 222 (18.5%) | 368 (26.8%) |
| 3.0x to 3.9x | 95 (7.9%) | 461 (33.6%) |
| 4.0x or more | 548 (45.6%) | 153 (11.2%) |
| Total | 1,201 (100.0%) | 1,372 (100.0%) |
Real Estate Taxes by Mortgage Status in Lawrenceburg
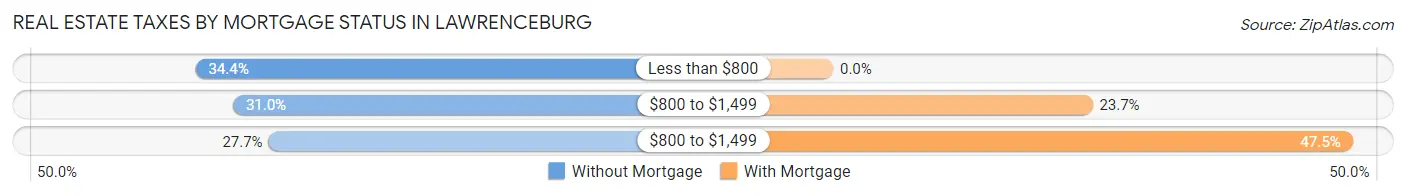
| Property Taxes | Without Mortgage | With Mortgage |
| Less than $800 | 413 (34.4%) | 0 (0.0%) |
| $800 to $1,499 | 372 (31.0%) | 325 (23.7%) |
| $800 to $1,499 | 333 (27.7%) | 651 (47.4%) |
| Total | 1,201 (100.0%) | 1,372 (100.0%) |
Health & Disability in Lawrenceburg
Health Insurance Coverage by Age in Lawrenceburg
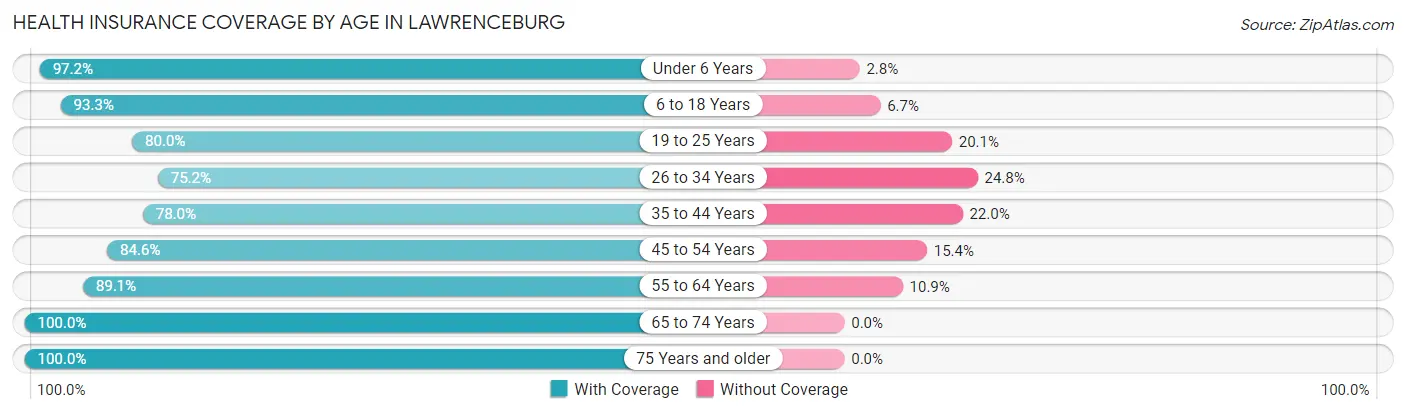
| Age Bracket | With Coverage | Without Coverage |
| Under 6 Years | 1,202 (97.2%) | 35 (2.8%) |
| 6 to 18 Years | 1,545 (93.3%) | 111 (6.7%) |
| 19 to 25 Years | 646 (79.9%) | 162 (20.1%) |
| 26 to 34 Years | 1,268 (75.2%) | 419 (24.8%) |
| 35 to 44 Years | 1,001 (78.0%) | 283 (22.0%) |
| 45 to 54 Years | 1,007 (84.6%) | 183 (15.4%) |
| 55 to 64 Years | 1,131 (89.1%) | 138 (10.9%) |
| 65 to 74 Years | 1,168 (100.0%) | 0 (0.0%) |
| 75 Years and older | 869 (100.0%) | 0 (0.0%) |
| Total | 9,837 (88.1%) | 1,331 (11.9%) |
Health Insurance Coverage by Citizenship Status in Lawrenceburg
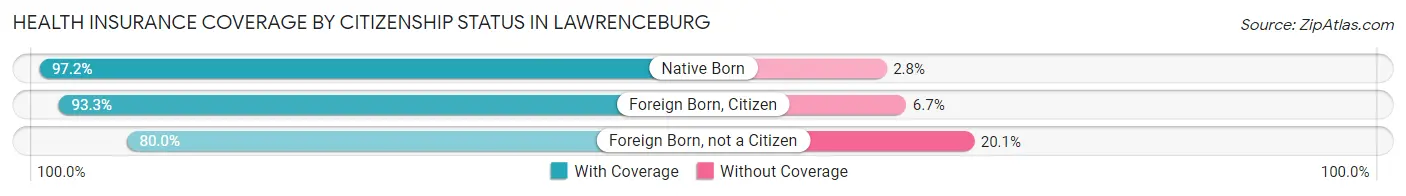
| Citizenship Status | With Coverage | Without Coverage |
| Native Born | 1,202 (97.2%) | 35 (2.8%) |
| Foreign Born, Citizen | 1,545 (93.3%) | 111 (6.7%) |
| Foreign Born, not a Citizen | 646 (79.9%) | 162 (20.1%) |
Health Insurance Coverage by Household Income in Lawrenceburg
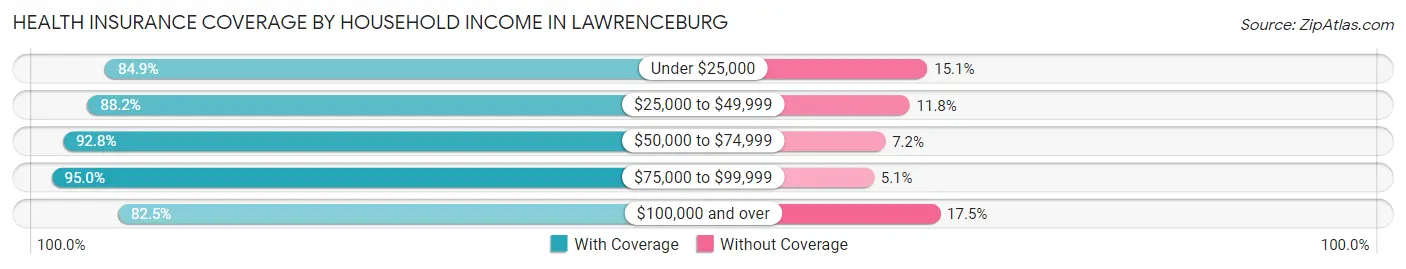
| Household Income | With Coverage | Without Coverage |
| Under $25,000 | 2,803 (84.9%) | 498 (15.1%) |
| $25,000 to $49,999 | 2,098 (88.2%) | 280 (11.8%) |
| $50,000 to $74,999 | 1,779 (92.8%) | 138 (7.2%) |
| $75,000 to $99,999 | 1,597 (95.0%) | 85 (5.1%) |
| $100,000 and over | 1,557 (82.5%) | 330 (17.5%) |
Public vs Private Health Insurance Coverage by Age in Lawrenceburg
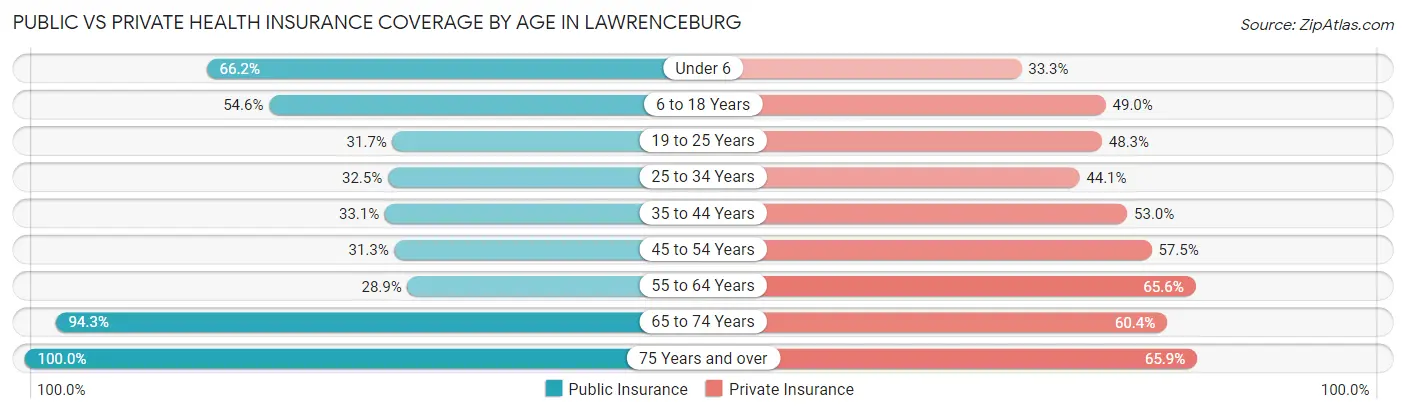
| Age Bracket | Public Insurance | Private Insurance |
| Under 6 | 819 (66.2%) | 412 (33.3%) |
| 6 to 18 Years | 904 (54.6%) | 811 (49.0%) |
| 19 to 25 Years | 256 (31.7%) | 390 (48.3%) |
| 25 to 34 Years | 549 (32.5%) | 744 (44.1%) |
| 35 to 44 Years | 425 (33.1%) | 680 (53.0%) |
| 45 to 54 Years | 373 (31.3%) | 684 (57.5%) |
| 55 to 64 Years | 367 (28.9%) | 833 (65.6%) |
| 65 to 74 Years | 1,101 (94.3%) | 705 (60.4%) |
| 75 Years and over | 869 (100.0%) | 573 (65.9%) |
| Total | 5,663 (50.7%) | 5,832 (52.2%) |
Disability Status by Sex by Age in Lawrenceburg
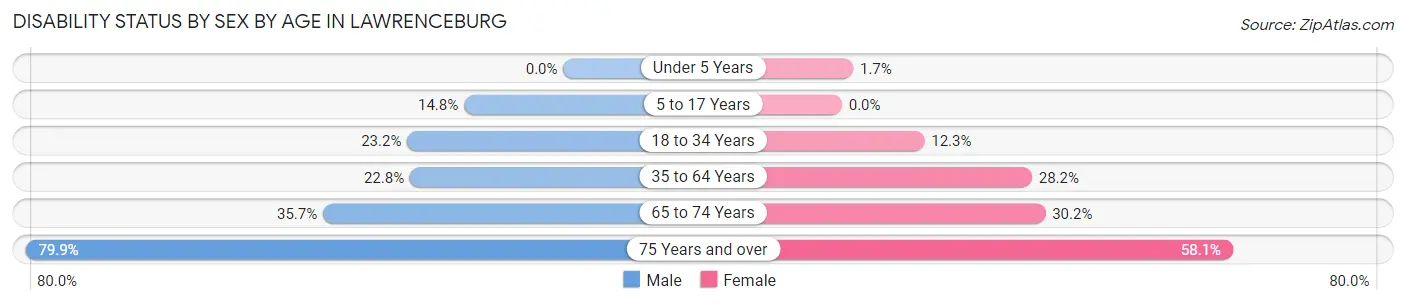
| Age Bracket | Male | Female |
| Under 5 Years | 0 (0.0%) | 8 (1.7%) |
| 5 to 17 Years | 126 (14.7%) | 0 (0.0%) |
| 18 to 34 Years | 255 (23.2%) | 181 (12.2%) |
| 35 to 64 Years | 426 (22.8%) | 528 (28.2%) |
| 65 to 74 Years | 177 (35.7%) | 203 (30.2%) |
| 75 Years and over | 254 (79.9%) | 320 (58.1%) |
Disability Class by Sex by Age in Lawrenceburg
Disability Class: Hearing Difficulty
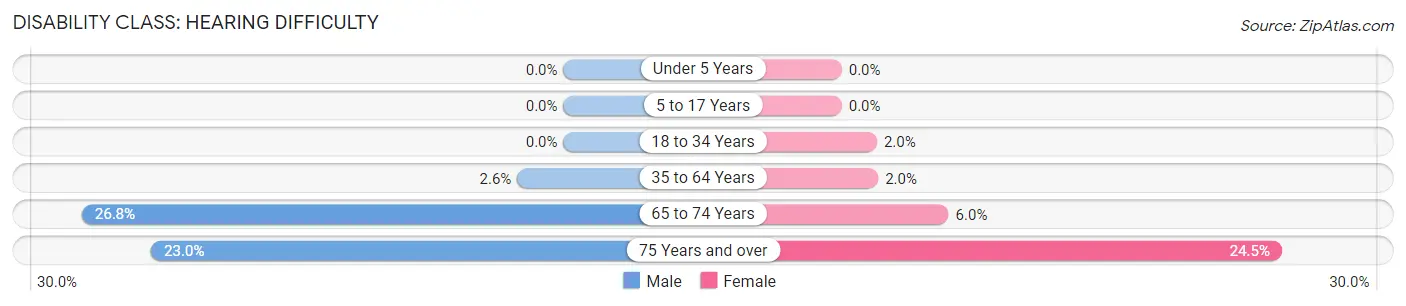
| Age Bracket | Male | Female |
| Under 5 Years | 0 (0.0%) | 0 (0.0%) |
| 5 to 17 Years | 0 (0.0%) | 0 (0.0%) |
| 18 to 34 Years | 0 (0.0%) | 29 (2.0%) |
| 35 to 64 Years | 48 (2.6%) | 38 (2.0%) |
| 65 to 74 Years | 133 (26.8%) | 40 (5.9%) |
| 75 Years and over | 73 (23.0%) | 135 (24.5%) |
Disability Class: Vision Difficulty
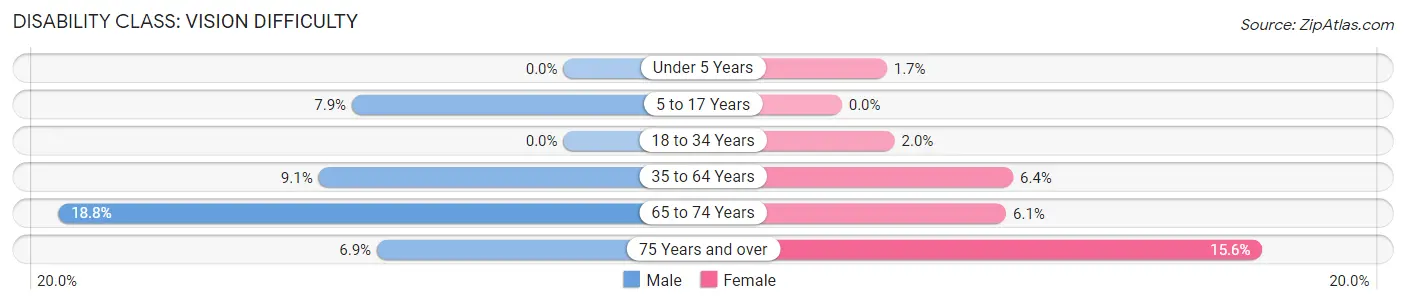
| Age Bracket | Male | Female |
| Under 5 Years | 0 (0.0%) | 8 (1.7%) |
| 5 to 17 Years | 67 (7.9%) | 0 (0.0%) |
| 18 to 34 Years | 0 (0.0%) | 29 (2.0%) |
| 35 to 64 Years | 170 (9.1%) | 119 (6.4%) |
| 65 to 74 Years | 93 (18.8%) | 41 (6.1%) |
| 75 Years and over | 22 (6.9%) | 86 (15.6%) |
Disability Class: Cognitive Difficulty
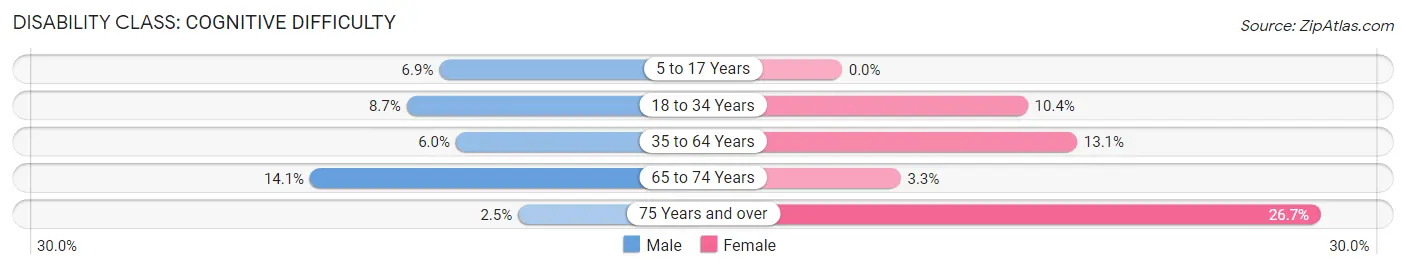
| Age Bracket | Male | Female |
| 5 to 17 Years | 59 (6.9%) | 0 (0.0%) |
| 18 to 34 Years | 96 (8.7%) | 153 (10.3%) |
| 35 to 64 Years | 112 (6.0%) | 245 (13.1%) |
| 65 to 74 Years | 70 (14.1%) | 22 (3.3%) |
| 75 Years and over | 8 (2.5%) | 147 (26.7%) |
Disability Class: Ambulatory Difficulty
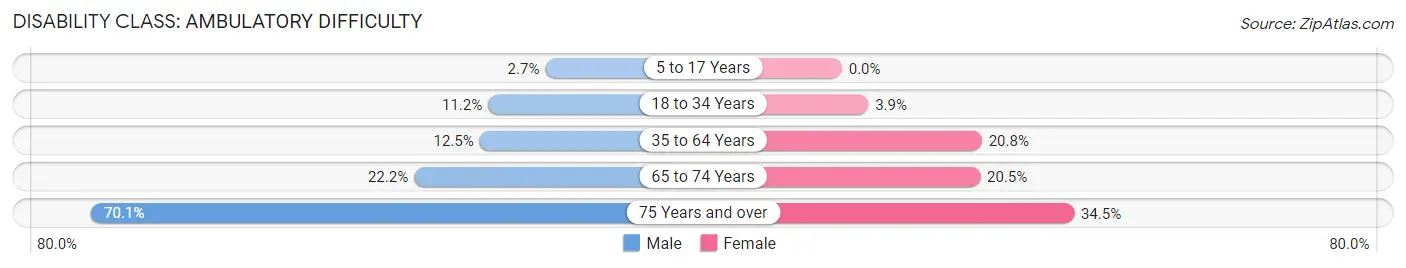
| Age Bracket | Male | Female |
| 5 to 17 Years | 23 (2.7%) | 0 (0.0%) |
| 18 to 34 Years | 123 (11.2%) | 58 (3.9%) |
| 35 to 64 Years | 233 (12.4%) | 389 (20.8%) |
| 65 to 74 Years | 110 (22.2%) | 138 (20.5%) |
| 75 Years and over | 223 (70.1%) | 190 (34.5%) |
Disability Class: Self-Care Difficulty
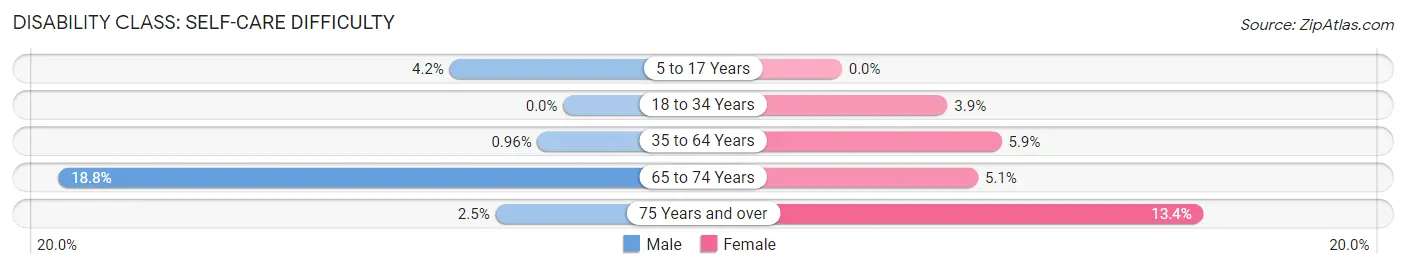
| Age Bracket | Male | Female |
| 5 to 17 Years | 36 (4.2%) | 0 (0.0%) |
| 18 to 34 Years | 0 (0.0%) | 58 (3.9%) |
| 35 to 64 Years | 18 (1.0%) | 111 (5.9%) |
| 65 to 74 Years | 93 (18.8%) | 34 (5.1%) |
| 75 Years and over | 8 (2.5%) | 74 (13.4%) |
Technology Access in Lawrenceburg
Computing Device Access in Lawrenceburg
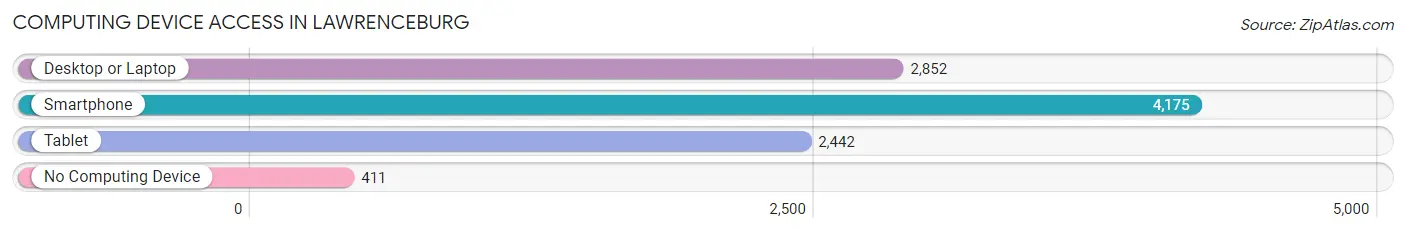
| Device Type | # Households | % Households |
| Desktop or Laptop | 2,852 | 58.6% |
| Smartphone | 4,175 | 85.8% |
| Tablet | 2,442 | 50.2% |
| No Computing Device | 411 | 8.5% |
| Total | 4,866 | 100.0% |
Internet Access in Lawrenceburg
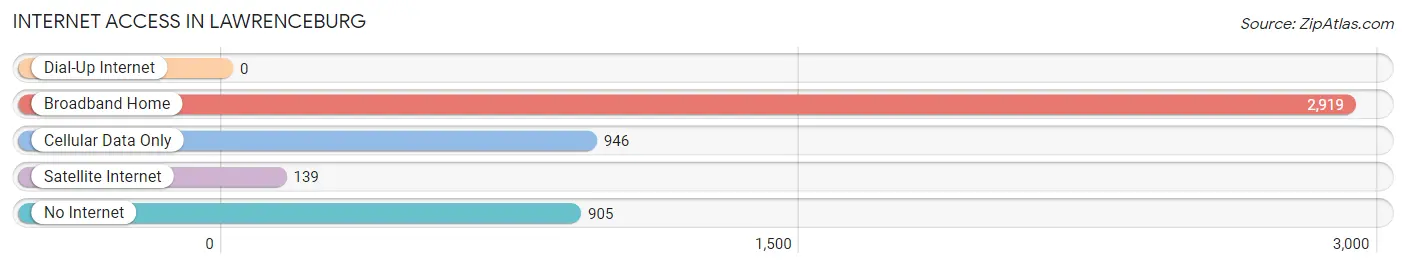
| Internet Type | # Households | % Households |
| Dial-Up Internet | 0 | 0.0% |
| Broadband Home | 2,919 | 60.0% |
| Cellular Data Only | 946 | 19.4% |
| Satellite Internet | 139 | 2.9% |
| No Internet | 905 | 18.6% |
| Total | 4,866 | 100.0% |
Lawrenceburg Summary
Lawrenceburg, Tennessee is a small city located in the south-central part of the state, about 70 miles south of Nashville. It is the county seat of Lawrence County and is part of the Huntsville-Decatur Combined Statistical Area. The city has a population of about 11,000 people and is known for its historic downtown area, which is listed on the National Register of Historic Places.
Geography
Lawrenceburg is located in the Highland Rim region of Tennessee, which is characterized by rolling hills and fertile soil. The city is situated on the banks of the Elk River, which flows through the city and is a popular spot for fishing and other recreational activities. The city is surrounded by several small towns and rural areas, including Ethridge, Summertown, and Leoma.
The climate in Lawrenceburg is humid subtropical, with hot summers and mild winters. The average annual temperature is around 63 degrees Fahrenheit, with an average high of around 87 degrees in the summer and an average low of around 40 degrees in the winter. The city receives an average of 48 inches of precipitation per year, with most of it falling in the spring and summer months.
Economy
Lawrenceburg’s economy is largely based on agriculture and manufacturing. The city is home to several large manufacturing plants, including a Tyson Foods poultry processing plant and a General Motors plant. The city is also home to several small businesses, including restaurants, retail stores, and service providers.
The city is also home to several educational institutions, including the University of Tennessee at Martin, Motlow State Community College, and the Tennessee College of Applied Technology. These institutions provide educational opportunities for the city’s residents and contribute to the local economy.
Demographics
As of the 2010 census, the population of Lawrenceburg was 10,428. The racial makeup of the city was 87.3% White, 8.7% African American, 0.3% Native American, 0.5% Asian, 0.1% Pacific Islander, 1.2% from other races, and 2.0% from two or more races. Hispanic or Latino of any race were 2.7% of the population.
The median household income in Lawrenceburg was $35,945, and the median family income was $45,945. The per capita income for the city was $19,945. About 17.3% of the population was below the poverty line.
Conclusion
Lawrenceburg, Tennessee is a small city located in the south-central part of the state. It is the county seat of Lawrence County and is part of the Huntsville-Decatur Combined Statistical Area. The city has a population of about 11,000 people and is known for its historic downtown area, which is listed on the National Register of Historic Places. The city’s economy is largely based on agriculture and manufacturing, and it is home to several educational institutions. The population of Lawrenceburg is mostly white, with a small percentage of African Americans, Native Americans, Asians, and other races. The median household income in Lawrenceburg is slightly below the national average, and about 17.3% of the population is below the poverty line.
Common Questions
What is Per Capita Income in Lawrenceburg?
Per Capita income in Lawrenceburg is $23,292.
What is the Median Family Income in Lawrenceburg?
Median Family Income in Lawrenceburg is $45,337.
What is the Median Household income in Lawrenceburg?
Median Household Income in Lawrenceburg is $37,644.
What is Income or Wage Gap in Lawrenceburg?
Income or Wage Gap in Lawrenceburg is 39.3%.
Women in Lawrenceburg earn 60.7 cents for every dollar earned by a man.
What is Family Income Deficit in Lawrenceburg?
Family Income Deficit in Lawrenceburg is $8,537.
Families that are below poverty line in Lawrenceburg earn $8,537 less on average than the poverty threshold level.
What is Inequality or Gini Index in Lawrenceburg?
Inequality or Gini Index in Lawrenceburg is 0.47.
What is the Total Population of Lawrenceburg?
Total Population of Lawrenceburg is 11,592.
What is the Total Male Population of Lawrenceburg?
Total Male Population of Lawrenceburg is 5,452.
What is the Total Female Population of Lawrenceburg?
Total Female Population of Lawrenceburg is 6,140.
What is the Ratio of Males per 100 Females in Lawrenceburg?
There are 88.79 Males per 100 Females in Lawrenceburg.
What is the Ratio of Females per 100 Males in Lawrenceburg?
There are 112.62 Females per 100 Males in Lawrenceburg.
What is the Median Population Age in Lawrenceburg?
Median Population Age in Lawrenceburg is 37.3 Years.
What is the Average Family Size in Lawrenceburg
Average Family Size in Lawrenceburg is 3.0 People.
What is the Average Household Size in Lawrenceburg
Average Household Size in Lawrenceburg is 2.3 People.
How Large is the Labor Force in Lawrenceburg?
There are 4,754 People in the Labor Forcein in Lawrenceburg.
What is the Percentage of People in the Labor Force in Lawrenceburg?
53.1% of People are in the Labor Force in Lawrenceburg.
What is the Unemployment Rate in Lawrenceburg?
Unemployment Rate in Lawrenceburg is 9.3%.