White House, TN Map & Demographics
White House Map
White House Overview
$41,424
PER CAPITA INCOME
$94,454
AVG FAMILY INCOME
$85,404
AVG HOUSEHOLD INCOME
33.9%
WAGE / INCOME GAP [ % ]
66.1¢/ $1
WAGE / INCOME GAP [ $ ]
0.38
INEQUALITY / GINI INDEX
13,305
TOTAL POPULATION
6,609
MALE POPULATION
6,696
FEMALE POPULATION
98.70
MALES / 100 FEMALES
101.32
FEMALES / 100 MALES
36.5
MEDIAN AGE
3.0
AVG FAMILY SIZE
2.6
AVG HOUSEHOLD SIZE
7,676
LABOR FORCE [ PEOPLE ]
71.8%
PERCENT IN LABOR FORCE
2.5%
UNEMPLOYMENT RATE
White House Zip Codes
White House Area Codes
Income in White House
Income Overview in White House
Per Capita Income in White House is $41,424, while median incomes of families and households are $94,454 and $85,404 respectively.
| Characteristic | Number | Measure |
| Per Capita Income | 13,305 | $41,424 |
| Median Family Income | 3,860 | $94,454 |
| Mean Family Income | 3,860 | $118,143 |
| Median Household Income | 5,041 | $85,404 |
| Mean Household Income | 5,041 | $106,452 |
| Income Deficit | 3,860 | $0 |
| Wage / Income Gap (%) | 13,305 | 33.95% |
| Wage / Income Gap ($) | 13,305 | 66.05¢ per $1 |
| Gini / Inequality Index | 13,305 | 0.38 |
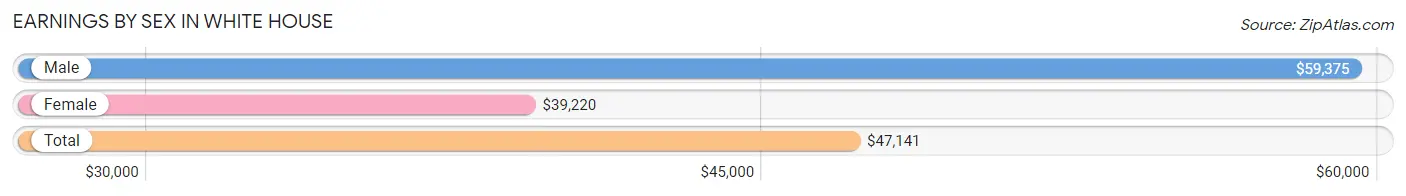
Earnings by Sex in White House
Average Earnings in White House are $47,141, $59,375 for men and $39,220 for women, a difference of 34.0%.
| Sex | Number | Average Earnings |
| Male | 4,270 (52.7%) | $59,375 |
| Female | 3,833 (47.3%) | $39,220 |
| Total | 8,103 (100.0%) | $47,141 |
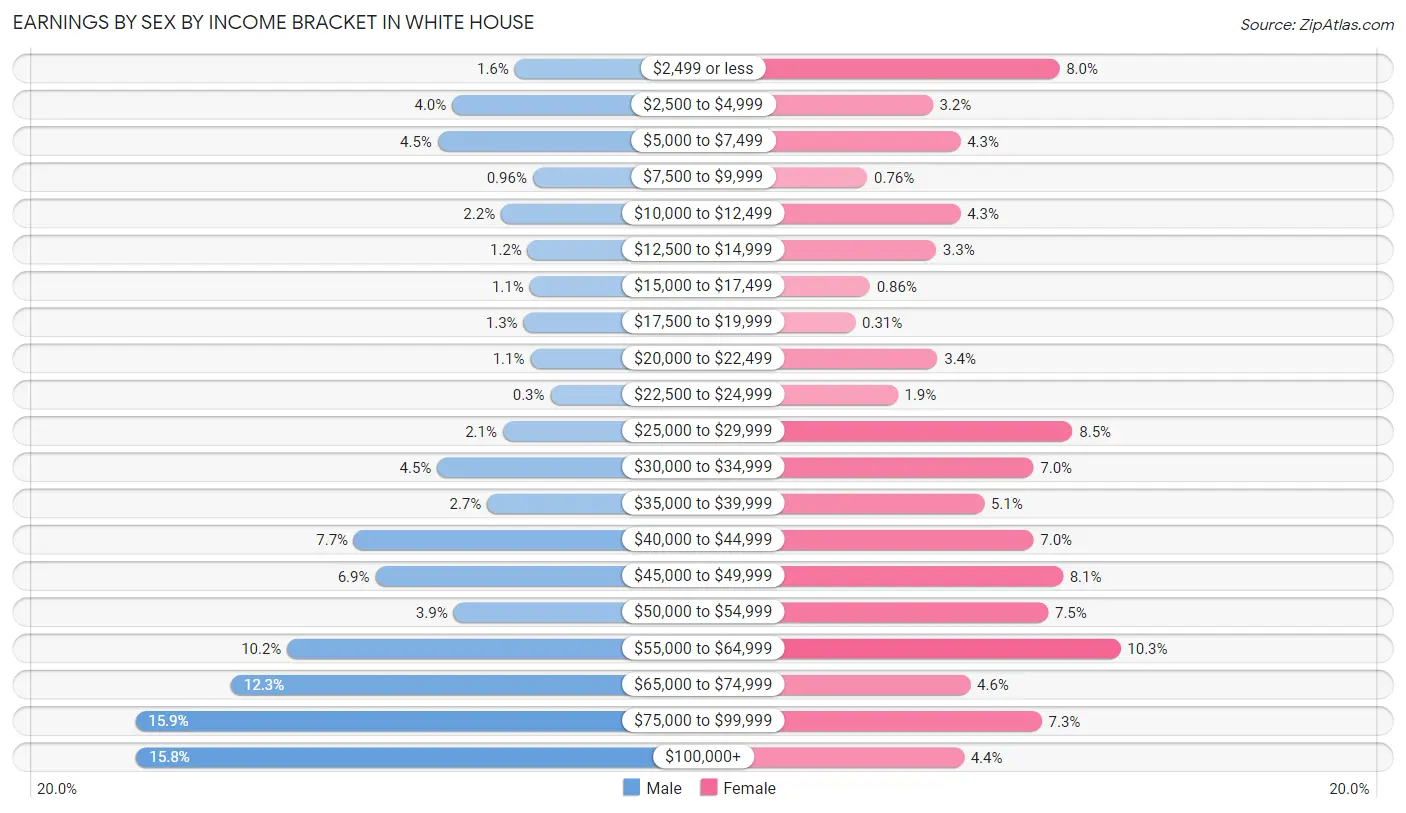
Earnings by Sex by Income Bracket in White House
The most common earnings brackets in White House are $75,000 to $99,999 for men (677 | 15.9%) and $55,000 to $64,999 for women (393 | 10.2%).
| Income | Male | Female |
| $2,499 or less | 70 (1.6%) | 305 (8.0%) |
| $2,500 to $4,999 | 170 (4.0%) | 123 (3.2%) |
| $5,000 to $7,499 | 193 (4.5%) | 163 (4.3%) |
| $7,500 to $9,999 | 41 (1.0%) | 29 (0.8%) |
| $10,000 to $12,499 | 92 (2.1%) | 163 (4.3%) |
| $12,500 to $14,999 | 49 (1.1%) | 128 (3.3%) |
| $15,000 to $17,499 | 46 (1.1%) | 33 (0.9%) |
| $17,500 to $19,999 | 56 (1.3%) | 12 (0.3%) |
| $20,000 to $22,499 | 45 (1.1%) | 130 (3.4%) |
| $22,500 to $24,999 | 13 (0.3%) | 73 (1.9%) |
| $25,000 to $29,999 | 89 (2.1%) | 324 (8.5%) |
| $30,000 to $34,999 | 194 (4.5%) | 268 (7.0%) |
| $35,000 to $39,999 | 114 (2.7%) | 197 (5.1%) |
| $40,000 to $44,999 | 327 (7.7%) | 268 (7.0%) |
| $45,000 to $49,999 | 293 (6.9%) | 310 (8.1%) |
| $50,000 to $54,999 | 168 (3.9%) | 289 (7.5%) |
| $55,000 to $64,999 | 434 (10.2%) | 393 (10.2%) |
| $65,000 to $74,999 | 524 (12.3%) | 177 (4.6%) |
| $75,000 to $99,999 | 677 (15.9%) | 280 (7.3%) |
| $100,000+ | 675 (15.8%) | 168 (4.4%) |
| Total | 4,270 (100.0%) | 3,833 (100.0%) |
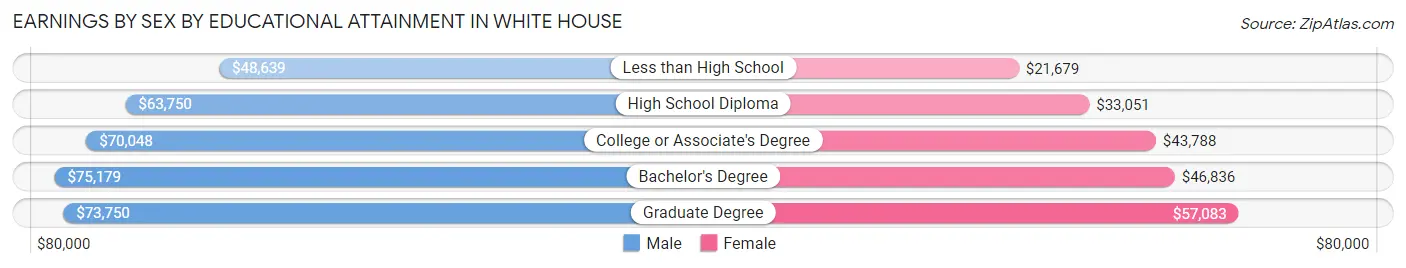
Earnings by Sex by Educational Attainment in White House
Average earnings in White House are $66,655 for men and $43,590 for women, a difference of 34.6%. Men with an educational attainment of bachelor's degree enjoy the highest average annual earnings of $75,179, while those with less than high school education earn the least with $48,639. Women with an educational attainment of graduate degree earn the most with the average annual earnings of $57,083, while those with less than high school education have the smallest earnings of $21,679.
| Educational Attainment | Male Income | Female Income |
| Less than High School | $48,639 | $21,679 |
| High School Diploma | $63,750 | $33,051 |
| College or Associate's Degree | $70,048 | $43,788 |
| Bachelor's Degree | $75,179 | $46,836 |
| Graduate Degree | $73,750 | $57,083 |
| Total | $66,655 | $43,590 |
Family Income in White House
Family Income Brackets in White House
According to the White House family income data, there are 892 families falling into the $100,000 to $149,999 income range, which is the most common income bracket and makes up 23.1% of all families. Conversely, the $15,000 to $24,999 income bracket is the least frequent group with only 12 families (0.3%) belonging to this category.
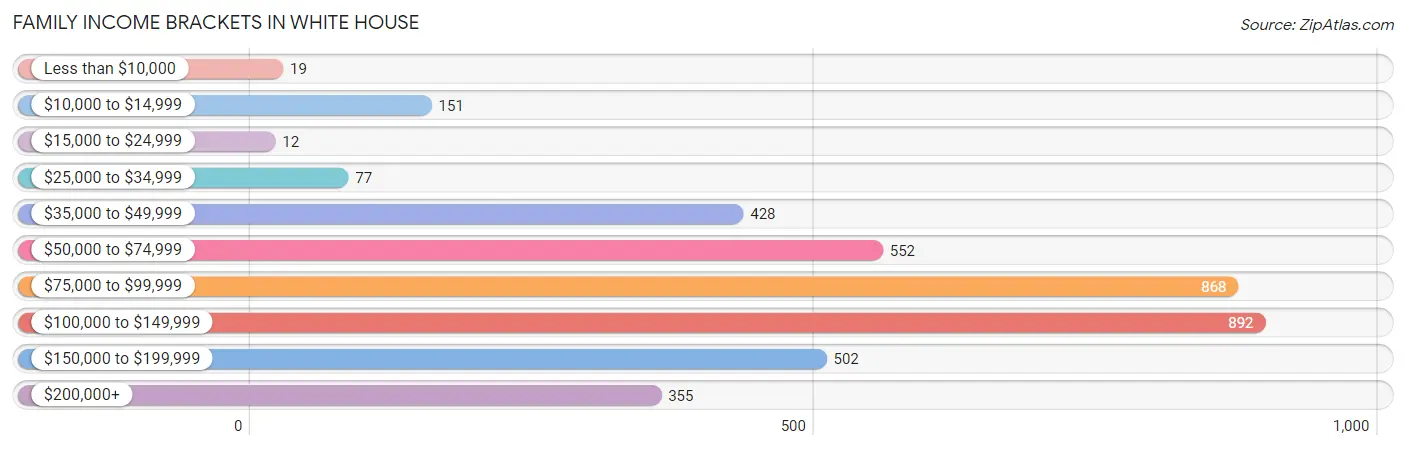
| Income Bracket | # Families | % Families |
| Less than $10,000 | 19 | 0.5% |
| $10,000 to $14,999 | 151 | 3.9% |
| $15,000 to $24,999 | 12 | 0.3% |
| $25,000 to $34,999 | 77 | 2.0% |
| $35,000 to $49,999 | 428 | 11.1% |
| $50,000 to $74,999 | 552 | 14.3% |
| $75,000 to $99,999 | 868 | 22.5% |
| $100,000 to $149,999 | 892 | 23.1% |
| $150,000 to $199,999 | 502 | 13.0% |
| $200,000+ | 355 | 9.2% |
Family Income by Famaliy Size in White House
4-person families (863 | 22.4%) account for the highest median family income in White House with $141,849 per family, while 2-person families (1,826 | 47.3%) have the highest median income of $40,310 per family member.
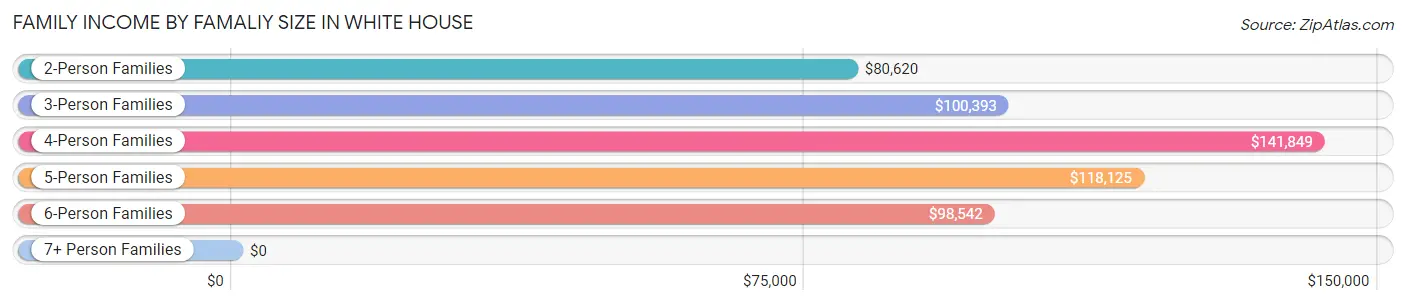
| Income Bracket | # Families | Median Income |
| 2-Person Families | 1,826 (47.3%) | $80,620 |
| 3-Person Families | 934 (24.2%) | $100,393 |
| 4-Person Families | 863 (22.4%) | $141,849 |
| 5-Person Families | 175 (4.5%) | $118,125 |
| 6-Person Families | 53 (1.4%) | $98,542 |
| 7+ Person Families | 9 (0.2%) | $0 |
| Total | 3,860 (100.0%) | $94,454 |
Family Income by Number of Earners in White House
The median family income in White House is $94,454, with families comprising 3+ earners (407) having the highest median family income of $150,724, while families with no earners (318) have the lowest median family income of $44,167, accounting for 10.5% and 8.2% of families, respectively.
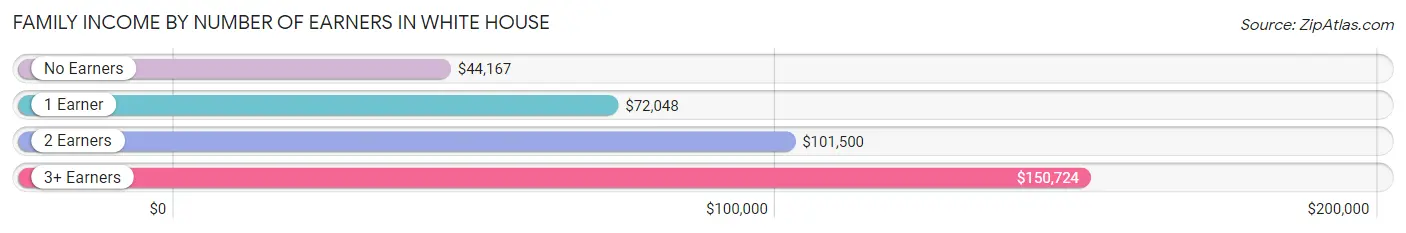
| Number of Earners | # Families | Median Income |
| No Earners | 318 (8.2%) | $44,167 |
| 1 Earner | 999 (25.9%) | $72,048 |
| 2 Earners | 2,136 (55.3%) | $101,500 |
| 3+ Earners | 407 (10.5%) | $150,724 |
| Total | 3,860 (100.0%) | $94,454 |
Household Income in White House
Household Income Brackets in White House
With 1,079 households falling in the category, the $75,000 to $99,999 income range is the most frequent in White House, accounting for 21.4% of all households. In contrast, only 45 households (0.9%) fall into the less than $10,000 income bracket, making it the least populous group.
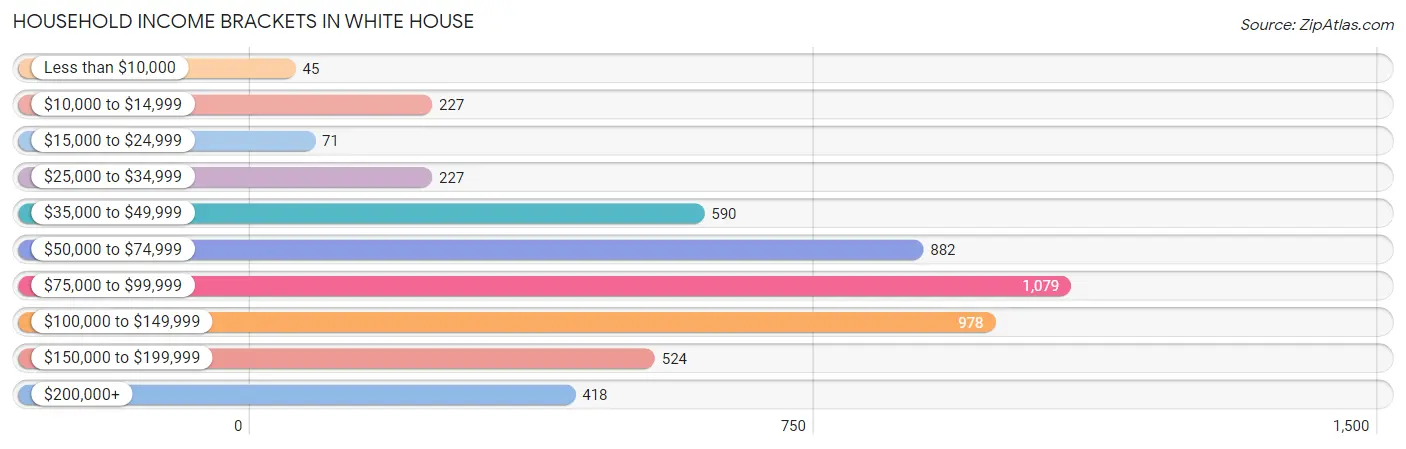
| Income Bracket | # Households | % Households |
| Less than $10,000 | 45 | 0.9% |
| $10,000 to $14,999 | 227 | 4.5% |
| $15,000 to $24,999 | 71 | 1.4% |
| $25,000 to $34,999 | 227 | 4.5% |
| $35,000 to $49,999 | 590 | 11.7% |
| $50,000 to $74,999 | 882 | 17.5% |
| $75,000 to $99,999 | 1,079 | 21.4% |
| $100,000 to $149,999 | 978 | 19.4% |
| $150,000 to $199,999 | 524 | 10.4% |
| $200,000+ | 418 | 8.3% |
Household Income by Householder Age in White House
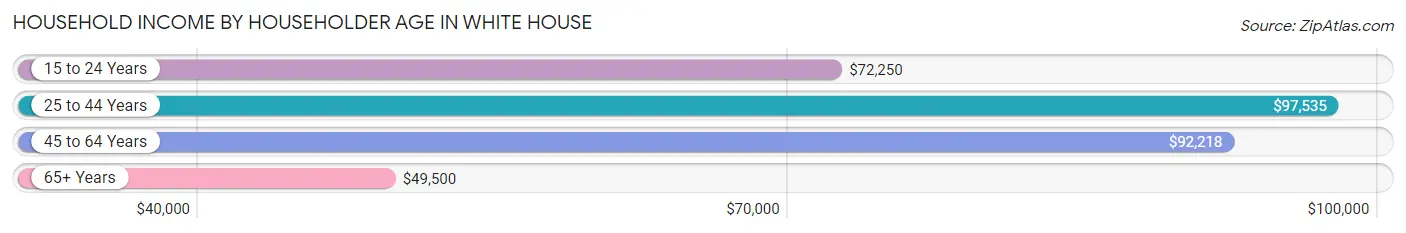
The median household income in White House is $85,404, with the highest median household income of $97,535 found in the 25 to 44 years age bracket for the primary householder. A total of 2,183 households (43.3%) fall into this category. Meanwhile, the 65+ years age bracket for the primary householder has the lowest median household income of $49,500, with 986 households (19.6%) in this group.
| Income Bracket | # Households | Median Income |
| 15 to 24 Years | 229 (4.5%) | $72,250 |
| 25 to 44 Years | 2,183 (43.3%) | $97,535 |
| 45 to 64 Years | 1,643 (32.6%) | $92,218 |
| 65+ Years | 986 (19.6%) | $49,500 |
| Total | 5,041 (100.0%) | $85,404 |
Poverty in White House
Income Below Poverty by Sex and Age in White House
With 3.8% poverty level for males and 5.4% for females among the residents of White House, 25 to 34 year old males and 16 and 17 year old females are the most vulnerable to poverty, with 86 males (8.1%) and 65 females (27.4%) in their respective age groups living below the poverty level.
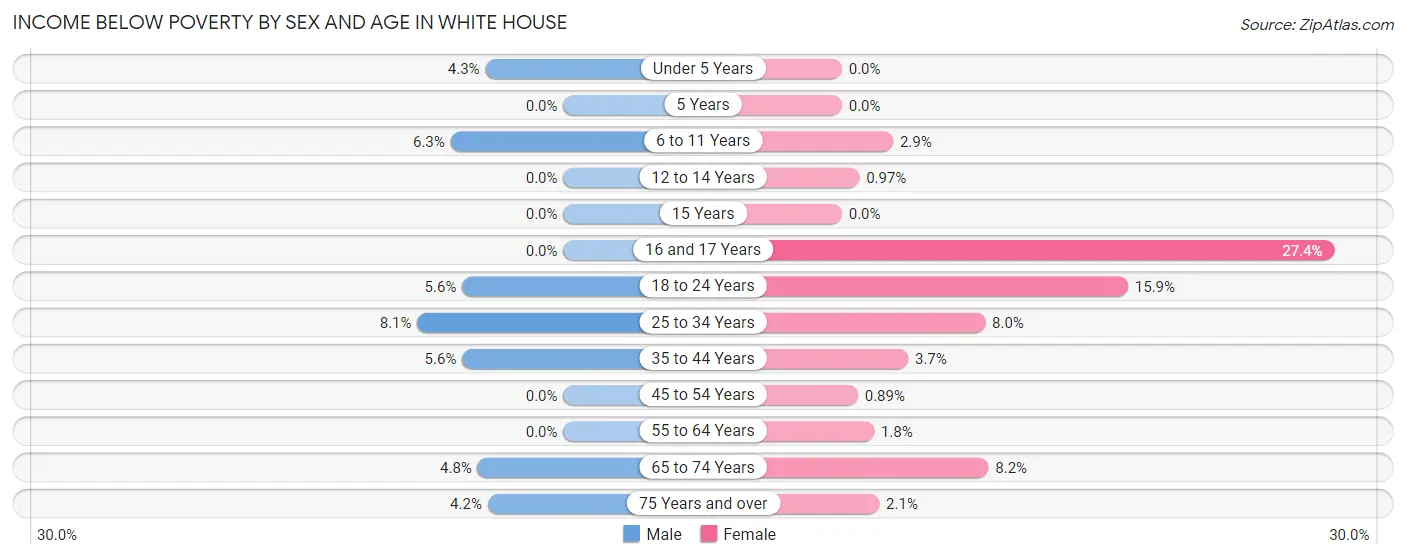
| Age Bracket | Male | Female |
| Under 5 Years | 16 (4.3%) | 0 (0.0%) |
| 5 Years | 0 (0.0%) | 0 (0.0%) |
| 6 to 11 Years | 24 (6.3%) | 10 (2.9%) |
| 12 to 14 Years | 0 (0.0%) | 6 (1.0%) |
| 15 Years | 0 (0.0%) | 0 (0.0%) |
| 16 and 17 Years | 0 (0.0%) | 65 (27.4%) |
| 18 to 24 Years | 32 (5.6%) | 72 (15.9%) |
| 25 to 34 Years | 86 (8.1%) | 93 (8.0%) |
| 35 to 44 Years | 57 (5.6%) | 39 (3.7%) |
| 45 to 54 Years | 0 (0.0%) | 6 (0.9%) |
| 55 to 64 Years | 0 (0.0%) | 15 (1.8%) |
| 65 to 74 Years | 18 (4.8%) | 43 (8.2%) |
| 75 Years and over | 19 (4.2%) | 10 (2.1%) |
| Total | 252 (3.8%) | 359 (5.4%) |
Income Above Poverty by Sex and Age in White House
According to the poverty statistics in White House, males aged 5 years and females aged under 5 years are the age groups that are most secure financially, with 100.0% of males and 100.0% of females in these age groups living above the poverty line.
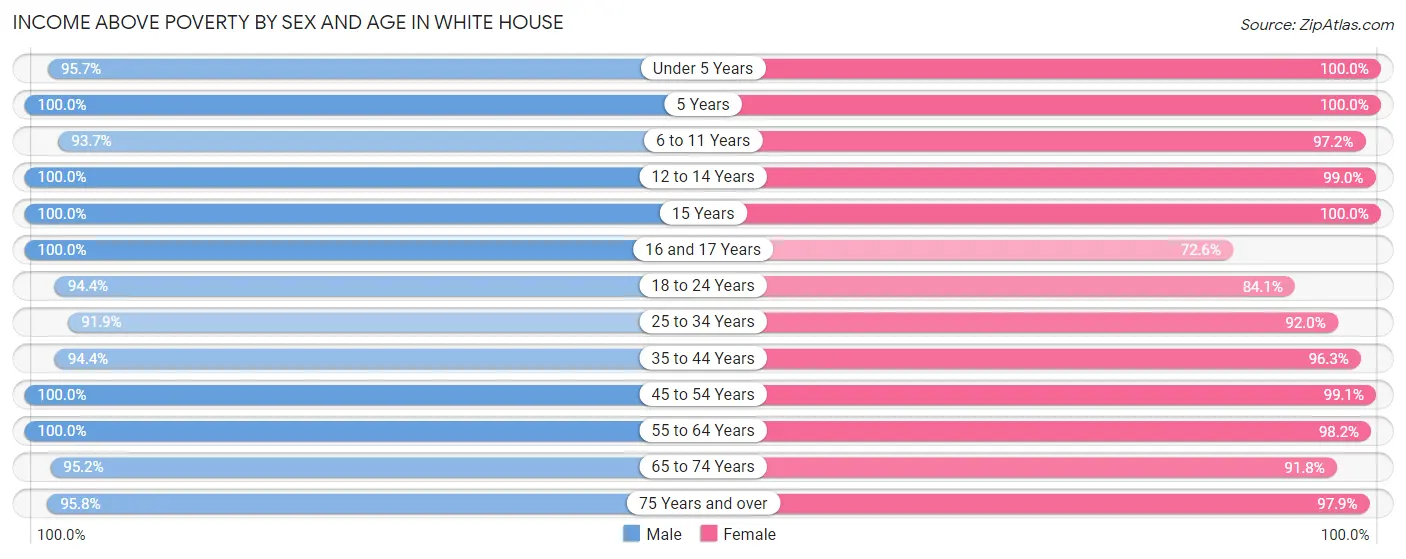
| Age Bracket | Male | Female |
| Under 5 Years | 353 (95.7%) | 214 (100.0%) |
| 5 Years | 92 (100.0%) | 54 (100.0%) |
| 6 to 11 Years | 358 (93.7%) | 341 (97.2%) |
| 12 to 14 Years | 268 (100.0%) | 611 (99.0%) |
| 15 Years | 197 (100.0%) | 18 (100.0%) |
| 16 and 17 Years | 171 (100.0%) | 172 (72.6%) |
| 18 to 24 Years | 536 (94.4%) | 380 (84.1%) |
| 25 to 34 Years | 972 (91.9%) | 1,073 (92.0%) |
| 35 to 44 Years | 956 (94.4%) | 1,019 (96.3%) |
| 45 to 54 Years | 877 (100.0%) | 665 (99.1%) |
| 55 to 64 Years | 734 (100.0%) | 825 (98.2%) |
| 65 to 74 Years | 359 (95.2%) | 484 (91.8%) |
| 75 Years and over | 432 (95.8%) | 471 (97.9%) |
| Total | 6,305 (96.2%) | 6,327 (94.6%) |
Income Below Poverty Among Married-Couple Families in White House
The poverty statistics for married-couple families in White House show that 3.4% or 109 of the total 3,234 families live below the poverty line. Families with 3 or 4 children have the highest poverty rate of 5.7%, comprising of 7 families. On the other hand, families with 5 or more children have the lowest poverty rate of 0.0%, which includes 0 families.
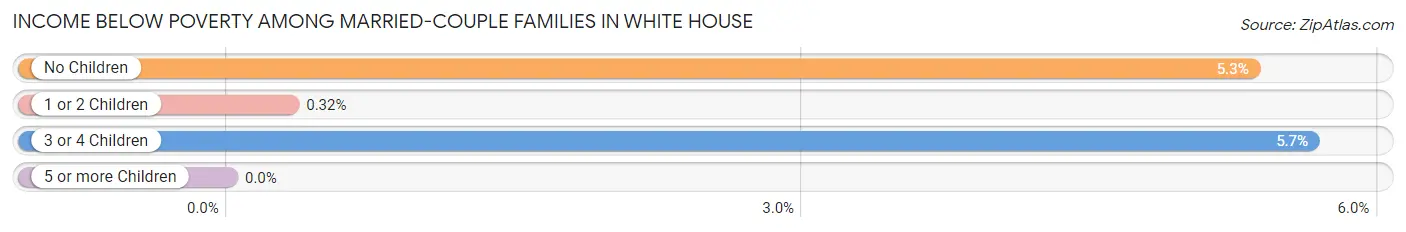
| Children | Above Poverty | Below Poverty |
| No Children | 1,736 (94.7%) | 98 (5.3%) |
| 1 or 2 Children | 1,263 (99.7%) | 4 (0.3%) |
| 3 or 4 Children | 117 (94.4%) | 7 (5.7%) |
| 5 or more Children | 9 (100.0%) | 0 (0.0%) |
| Total | 3,125 (96.6%) | 109 (3.4%) |
Income Below Poverty Among Single-Parent Households in White House
According to the poverty data in White House, 24.5% or 51 single-father households and 6.7% or 28 single-mother households are living below the poverty line. Among single-father households, those with 1 or 2 children have the highest poverty rate, with 51 households (31.7%) experiencing poverty. Likewise, among single-mother households, those with no children have the highest poverty rate, with 9 households (7.0%) falling below the poverty line.
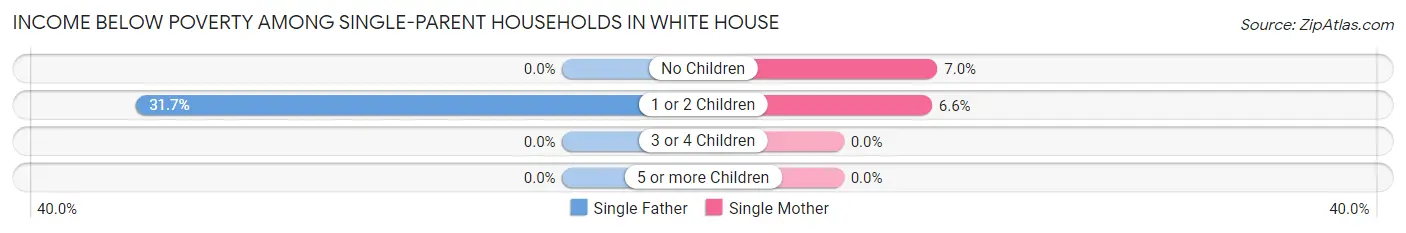
| Children | Single Father | Single Mother |
| No Children | 0 (0.0%) | 9 (7.0%) |
| 1 or 2 Children | 51 (31.7%) | 19 (6.6%) |
| 3 or 4 Children | 0 (0.0%) | 0 (0.0%) |
| 5 or more Children | 0 (0.0%) | 0 (0.0%) |
| Total | 51 (24.5%) | 28 (6.7%) |
Income Below Poverty Among Married-Couple vs Single-Parent Households in White House
The poverty data for White House shows that 109 of the married-couple family households (3.4%) and 79 of the single-parent households (12.6%) are living below the poverty level. Within the married-couple family households, those with 3 or 4 children have the highest poverty rate, with 7 households (5.7%) falling below the poverty line. Among the single-parent households, those with 1 or 2 children have the highest poverty rate, with 70 household (15.6%) living below poverty.
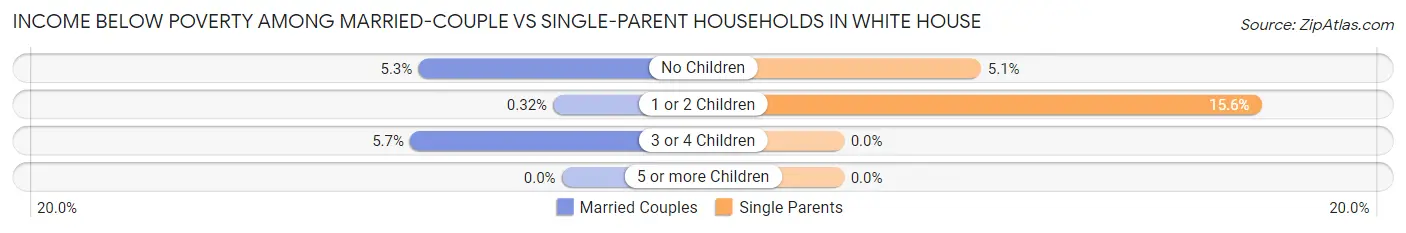
| Children | Married-Couple Families | Single-Parent Households |
| No Children | 98 (5.3%) | 9 (5.1%) |
| 1 or 2 Children | 4 (0.3%) | 70 (15.6%) |
| 3 or 4 Children | 7 (5.7%) | 0 (0.0%) |
| 5 or more Children | 0 (0.0%) | 0 (0.0%) |
| Total | 109 (3.4%) | 79 (12.6%) |
Race in White House
The most populous races in White House are White / Caucasian (11,805 | 88.7%), Two or more Races (870 | 6.5%), and Hispanic or Latino (585 | 4.4%).
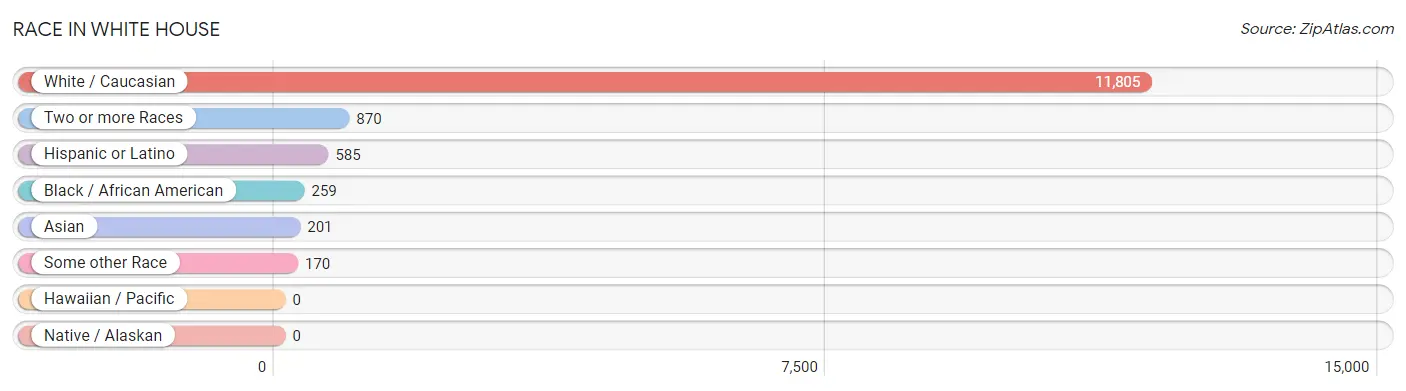
| Race | # Population | % Population |
| Asian | 201 | 1.5% |
| Black / African American | 259 | 1.9% |
| Hawaiian / Pacific | 0 | 0.0% |
| Hispanic or Latino | 585 | 4.4% |
| Native / Alaskan | 0 | 0.0% |
| White / Caucasian | 11,805 | 88.7% |
| Two or more Races | 870 | 6.5% |
| Some other Race | 170 | 1.3% |
| Total | 13,305 | 100.0% |
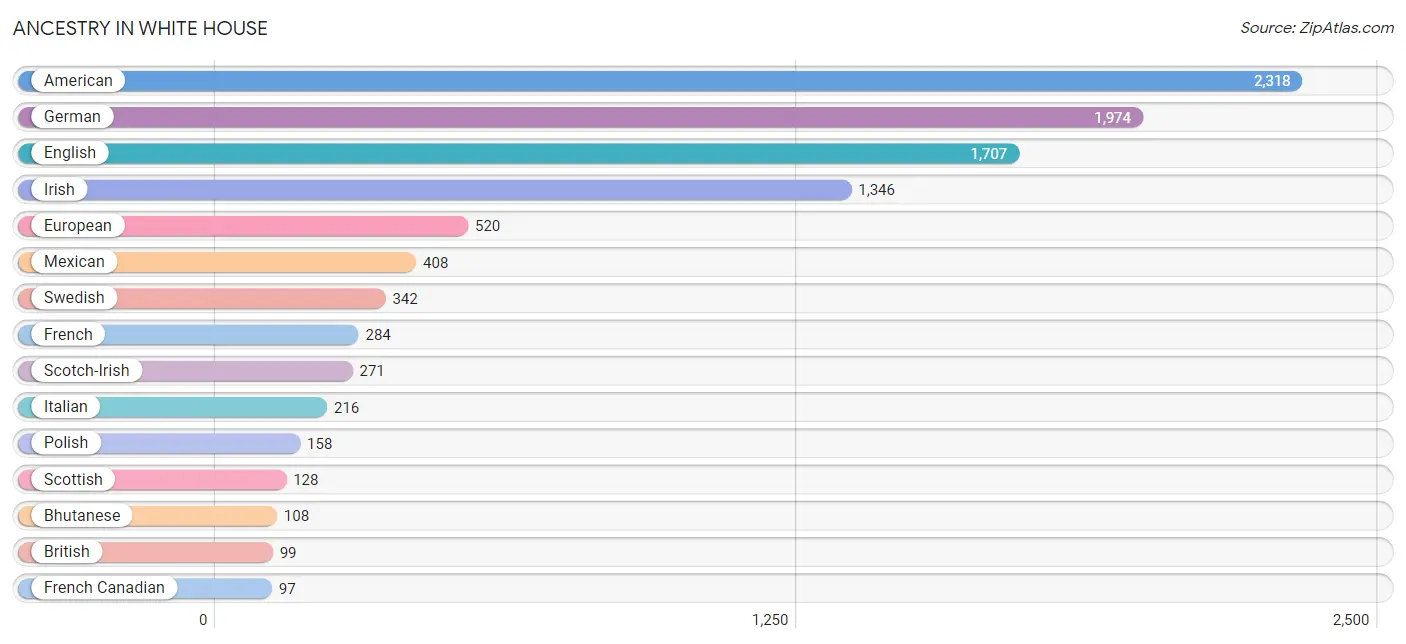
Ancestry in White House
The most populous ancestries reported in White House are American (2,318 | 17.4%), German (1,974 | 14.8%), English (1,707 | 12.8%), Irish (1,346 | 10.1%), and European (520 | 3.9%), together accounting for 59.1% of all White House residents.
| Ancestry | # Population | % Population |
| American | 2,318 | 17.4% |
| Arab | 28 | 0.2% |
| Basque | 22 | 0.2% |
| Bhutanese | 108 | 0.8% |
| Blackfeet | 8 | 0.1% |
| British | 99 | 0.7% |
| Burmese | 6 | 0.1% |
| Central American | 84 | 0.6% |
| Cherokee | 31 | 0.2% |
| Colombian | 20 | 0.2% |
| Costa Rican | 28 | 0.2% |
| Czech | 44 | 0.3% |
| Danish | 36 | 0.3% |
| Dutch | 94 | 0.7% |
| English | 1,707 | 12.8% |
| European | 520 | 3.9% |
| Finnish | 46 | 0.4% |
| French | 284 | 2.1% |
| French Canadian | 97 | 0.7% |
| German | 1,974 | 14.8% |
| Guatemalan | 19 | 0.1% |
| Hungarian | 12 | 0.1% |
| Indian (Asian) | 47 | 0.4% |
| Irish | 1,346 | 10.1% |
| Italian | 216 | 1.6% |
| Korean | 23 | 0.2% |
| Lebanese | 28 | 0.2% |
| Lithuanian | 10 | 0.1% |
| Maltese | 10 | 0.1% |
| Mexican | 408 | 3.1% |
| Nigerian | 97 | 0.7% |
| Norwegian | 58 | 0.4% |
| Pennsylvania German | 11 | 0.1% |
| Polish | 158 | 1.2% |
| Portuguese | 66 | 0.5% |
| Salvadoran | 37 | 0.3% |
| Scandinavian | 5 | 0.0% |
| Scotch-Irish | 271 | 2.0% |
| Scottish | 128 | 1.0% |
| South American | 50 | 0.4% |
| Spaniard | 43 | 0.3% |
| Sri Lankan | 42 | 0.3% |
| Subsaharan African | 97 | 0.7% |
| Swedish | 342 | 2.6% |
| Thai | 35 | 0.3% |
| Ukrainian | 29 | 0.2% |
| Venezuelan | 30 | 0.2% |
| Welsh | 37 | 0.3% | View All 48 Rows |
Immigrants in White House
The most numerous immigrant groups reported in White House came from Latin America (266 | 2.0%), Central America (216 | 1.6%), Asia (161 | 1.2%), Mexico (117 | 0.9%), and Eastern Asia (90 | 0.7%), together accounting for 6.4% of all White House residents.
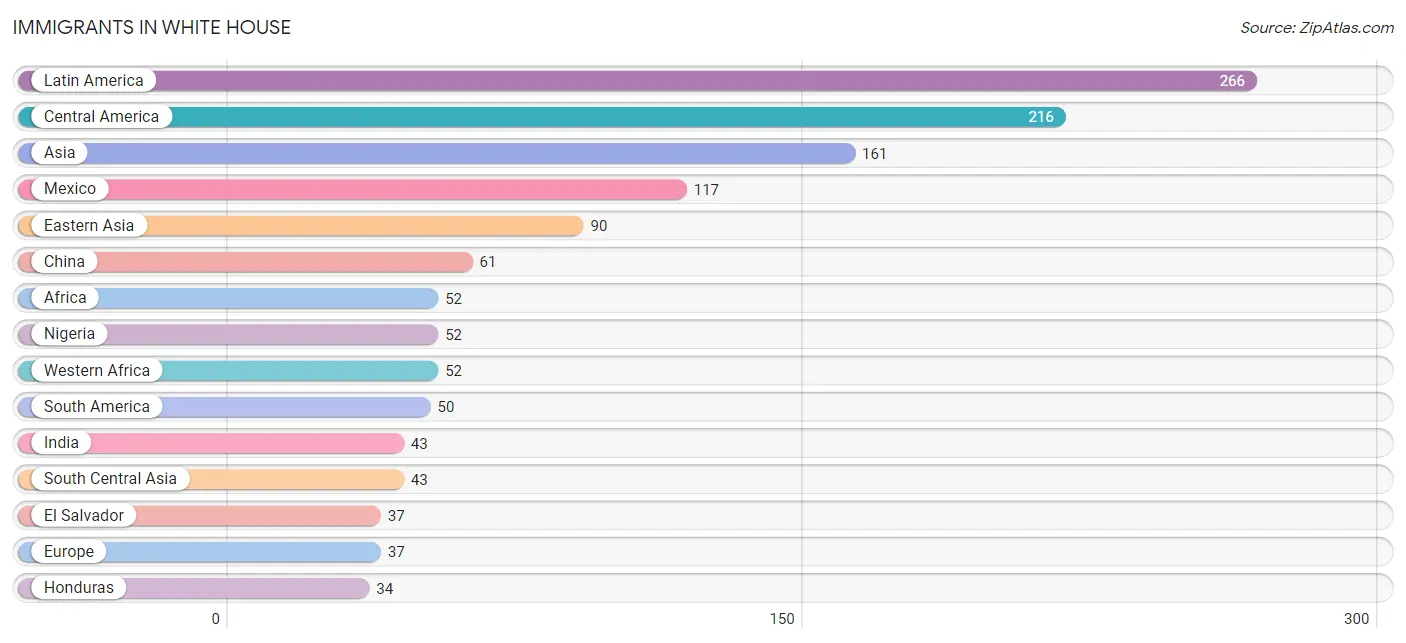
| Immigration Origin | # Population | % Population |
| Africa | 52 | 0.4% |
| Asia | 161 | 1.2% |
| Canada | 23 | 0.2% |
| Central America | 216 | 1.6% |
| China | 61 | 0.5% |
| Colombia | 20 | 0.2% |
| Costa Rica | 28 | 0.2% |
| Eastern Asia | 90 | 0.7% |
| Eastern Europe | 14 | 0.1% |
| El Salvador | 37 | 0.3% |
| Europe | 37 | 0.3% |
| Honduras | 34 | 0.3% |
| India | 43 | 0.3% |
| Japan | 23 | 0.2% |
| Korea | 6 | 0.1% |
| Latin America | 266 | 2.0% |
| Mexico | 117 | 0.9% |
| Nigeria | 52 | 0.4% |
| Northern Europe | 23 | 0.2% |
| Romania | 6 | 0.1% |
| South America | 50 | 0.4% |
| South Central Asia | 43 | 0.3% |
| South Eastern Asia | 28 | 0.2% |
| Ukraine | 8 | 0.1% |
| Venezuela | 30 | 0.2% |
| Vietnam | 28 | 0.2% |
| Western Africa | 52 | 0.4% | View All 27 Rows |
Sex and Age in White House
Sex and Age in White House
The most populous age groups in White House are 35 to 39 Years (661 | 10.0%) for men and 30 to 34 Years (753 | 11.3%) for women.
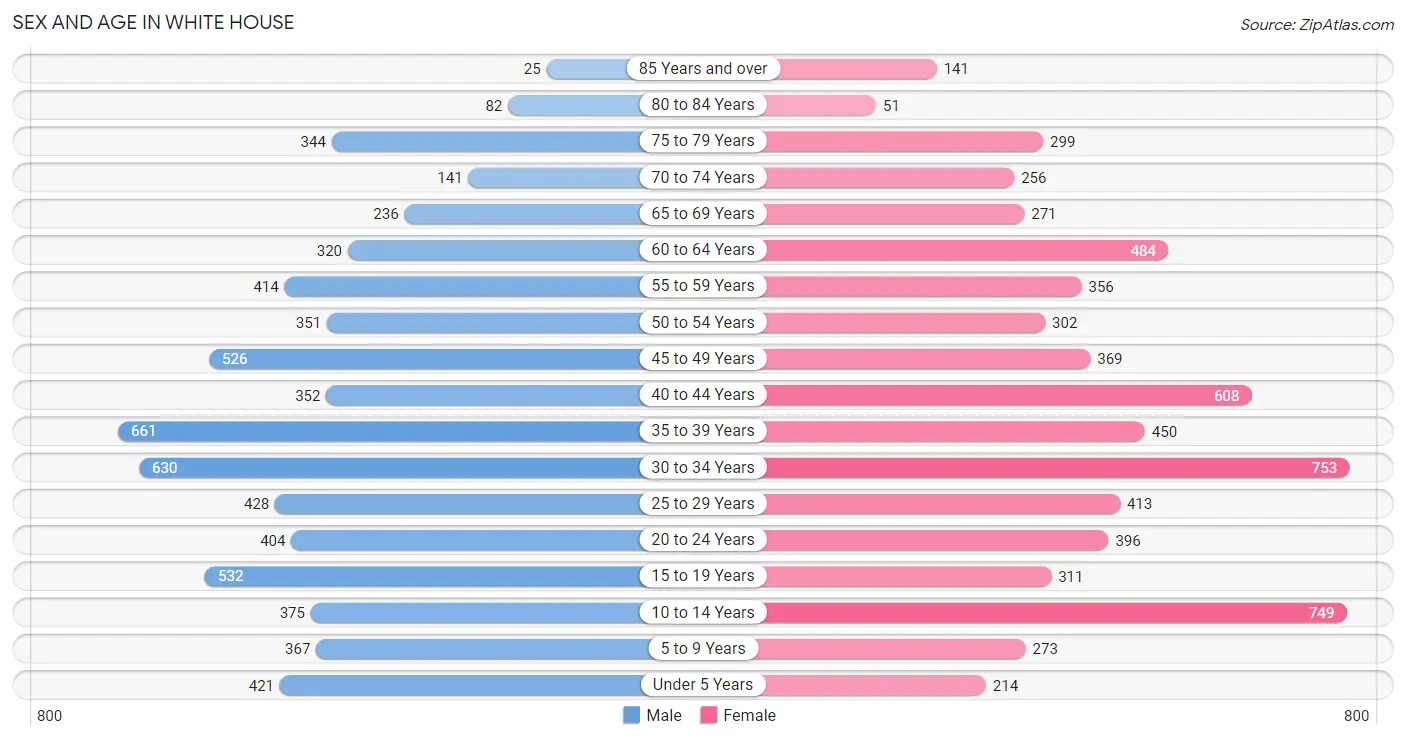
| Age Bracket | Male | Female |
| Under 5 Years | 421 (6.4%) | 214 (3.2%) |
| 5 to 9 Years | 367 (5.6%) | 273 (4.1%) |
| 10 to 14 Years | 375 (5.7%) | 749 (11.2%) |
| 15 to 19 Years | 532 (8.1%) | 311 (4.6%) |
| 20 to 24 Years | 404 (6.1%) | 396 (5.9%) |
| 25 to 29 Years | 428 (6.5%) | 413 (6.2%) |
| 30 to 34 Years | 630 (9.5%) | 753 (11.3%) |
| 35 to 39 Years | 661 (10.0%) | 450 (6.7%) |
| 40 to 44 Years | 352 (5.3%) | 608 (9.1%) |
| 45 to 49 Years | 526 (8.0%) | 369 (5.5%) |
| 50 to 54 Years | 351 (5.3%) | 302 (4.5%) |
| 55 to 59 Years | 414 (6.3%) | 356 (5.3%) |
| 60 to 64 Years | 320 (4.8%) | 484 (7.2%) |
| 65 to 69 Years | 236 (3.6%) | 271 (4.1%) |
| 70 to 74 Years | 141 (2.1%) | 256 (3.8%) |
| 75 to 79 Years | 344 (5.2%) | 299 (4.5%) |
| 80 to 84 Years | 82 (1.2%) | 51 (0.8%) |
| 85 Years and over | 25 (0.4%) | 141 (2.1%) |
| Total | 6,609 (100.0%) | 6,696 (100.0%) |
Families and Households in White House
Median Family Size in White House
The median family size in White House is 2.97 persons per family, with married-couple families (3,234 | 83.8%) accounting for the largest median family size of 3.04 persons per family. On the other hand, single male/father families (208 | 5.4%) represent the smallest median family size with 2.26 persons per family.
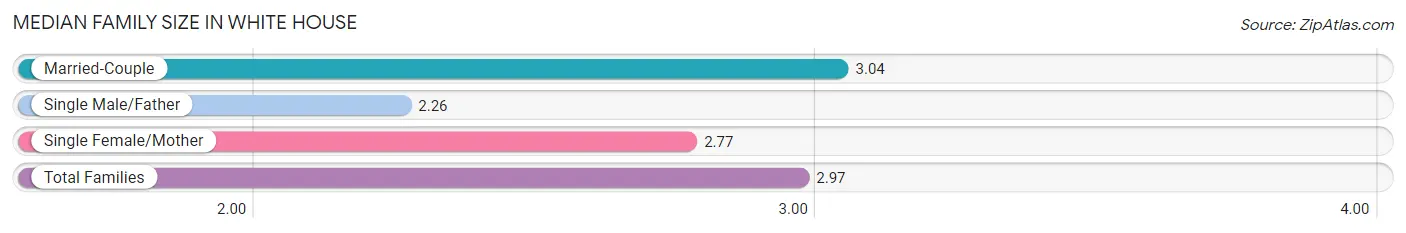
| Family Type | # Families | Family Size |
| Married-Couple | 3,234 (83.8%) | 3.04 |
| Single Male/Father | 208 (5.4%) | 2.26 |
| Single Female/Mother | 418 (10.8%) | 2.77 |
| Total Families | 3,860 (100.0%) | 2.97 |
Median Household Size in White House
The median household size in White House is 2.64 persons per household, with married-couple households (3,234 | 64.1%) accounting for the largest median household size of 3.06 persons per household. non-family households (1,181 | 23.4%) represent the smallest median household size with 1.35 persons per household.
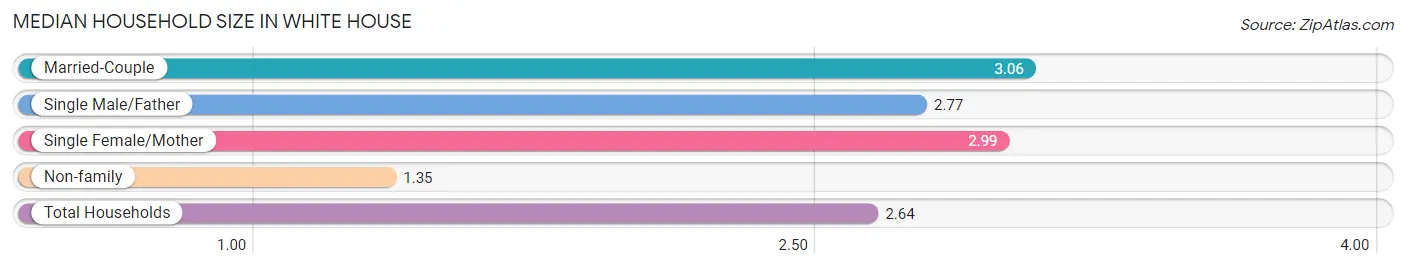
| Household Type | # Households | Household Size |
| Married-Couple | 3,234 (64.1%) | 3.06 |
| Single Male/Father | 208 (4.1%) | 2.77 |
| Single Female/Mother | 418 (8.3%) | 2.99 |
| Non-family | 1,181 (23.4%) | 1.35 |
| Total Households | 5,041 (100.0%) | 2.64 |
Household Size by Marriage Status in White House
Out of a total of 5,041 households in White House, 3,860 (76.6%) are family households, while 1,181 (23.4%) are nonfamily households. The most numerous type of family households are 2-person households, comprising 1,657, and the most common type of nonfamily households are 1-person households, comprising 924.
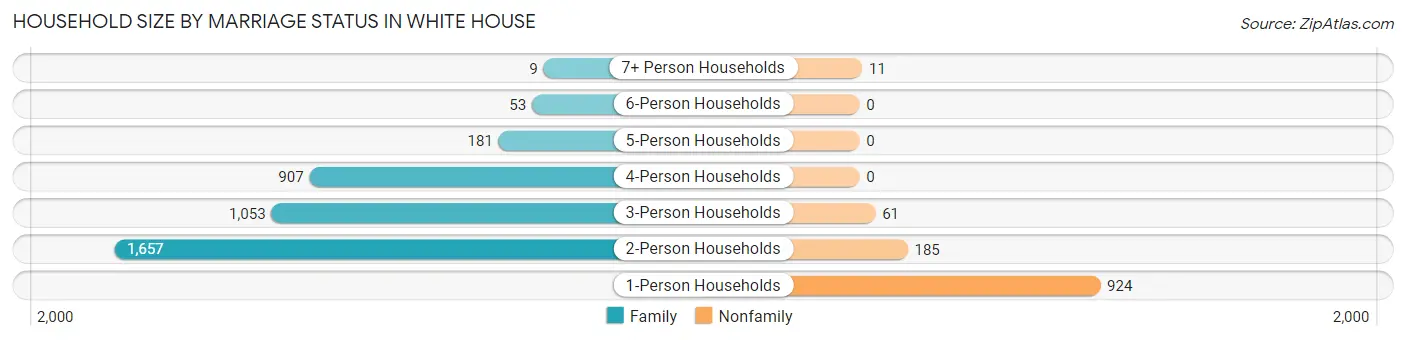
| Household Size | Family Households | Nonfamily Households |
| 1-Person Households | - | 924 (18.3%) |
| 2-Person Households | 1,657 (32.9%) | 185 (3.7%) |
| 3-Person Households | 1,053 (20.9%) | 61 (1.2%) |
| 4-Person Households | 907 (18.0%) | 0 (0.0%) |
| 5-Person Households | 181 (3.6%) | 0 (0.0%) |
| 6-Person Households | 53 (1.1%) | 0 (0.0%) |
| 7+ Person Households | 9 (0.2%) | 11 (0.2%) |
| Total | 3,860 (76.6%) | 1,181 (23.4%) |
Female Fertility in White House
Fertility by Age in White House
Average fertility rate in White House is 58.0 births per 1,000 women. Women in the age bracket of 20 to 34 years have the highest fertility rate with 102.0 births per 1,000 women. Women in the age bracket of 20 to 34 years acount for 81.5% of all women with births.
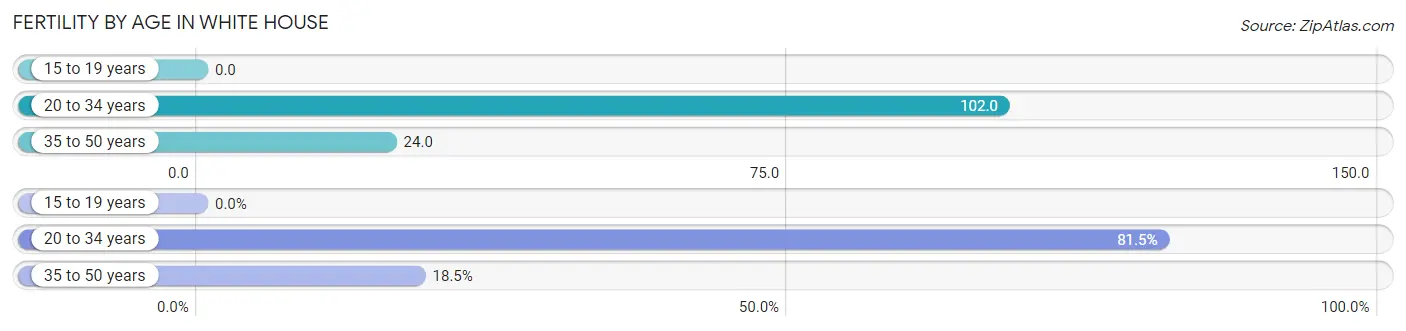
| Age Bracket | Women with Births | Births / 1,000 Women |
| 15 to 19 years | 0 (0.0%) | 0.0 |
| 20 to 34 years | 159 (81.5%) | 102.0 |
| 35 to 50 years | 36 (18.5%) | 24.0 |
| Total | 195 (100.0%) | 58.0 |
Fertility by Age by Marriage Status in White House
92.8% of women with births (195) in White House are married. The highest percentage of unmarried women with births falls into 20 to 34 years age bracket with 8.8% of them unmarried at the time of birth, while the lowest percentage of unmarried women with births belong to 35 to 50 years age bracket with 0.0% of them unmarried.
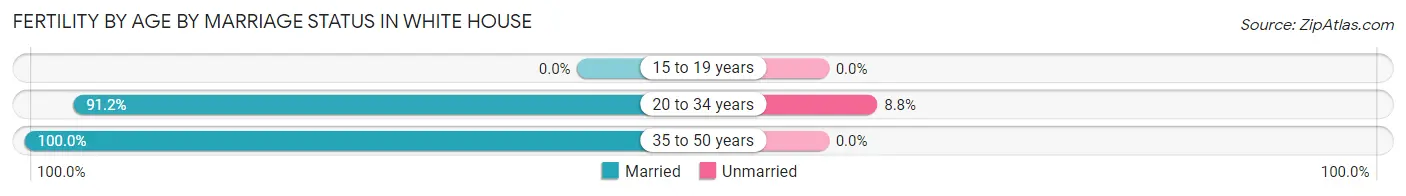
| Age Bracket | Married | Unmarried |
| 15 to 19 years | 0 (0.0%) | 0 (0.0%) |
| 20 to 34 years | 145 (91.2%) | 14 (8.8%) |
| 35 to 50 years | 36 (100.0%) | 0 (0.0%) |
| Total | 181 (92.8%) | 14 (7.2%) |
Fertility by Education in White House
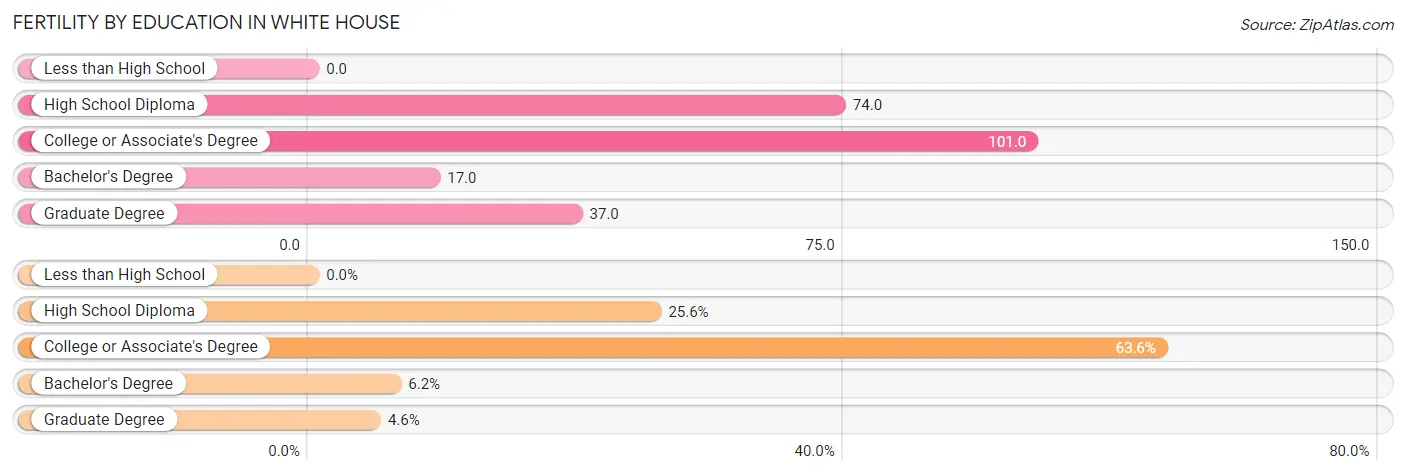
| Educational Attainment | Women with Births | Births / 1,000 Women |
| Less than High School | 0 (0.0%) | 0.0 |
| High School Diploma | 50 (25.6%) | 74.0 |
| College or Associate's Degree | 124 (63.6%) | 101.0 |
| Bachelor's Degree | 12 (6.1%) | 17.0 |
| Graduate Degree | 9 (4.6%) | 37.0 |
| Total | 195 (100.0%) | 58.0 |
Fertility by Education by Marriage Status in White House
7.2% of women with births in White House are unmarried. Women with the educational attainment of college or associate's degree are most likely to be married with 100.0% of them married at childbirth, while women with the educational attainment of high school diploma are least likely to be married with 28.0% of them unmarried at childbirth.
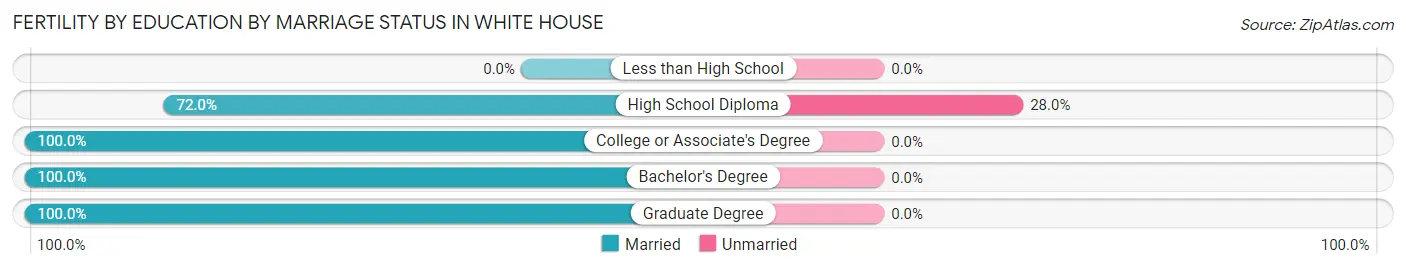
| Educational Attainment | Married | Unmarried |
| Less than High School | 0 (0.0%) | 0 (0.0%) |
| High School Diploma | 36 (72.0%) | 14 (28.0%) |
| College or Associate's Degree | 124 (100.0%) | 0 (0.0%) |
| Bachelor's Degree | 12 (100.0%) | 0 (0.0%) |
| Graduate Degree | 9 (100.0%) | 0 (0.0%) |
| Total | 181 (92.8%) | 14 (7.2%) |
Employment Characteristics in White House
Employment by Class of Employer in White House
Among the 7,418 employed individuals in White House, private company employees (5,483 | 73.9%), local government employees (649 | 8.7%), and not-for-profit organizations (462 | 6.2%) make up the most common classes of employment.
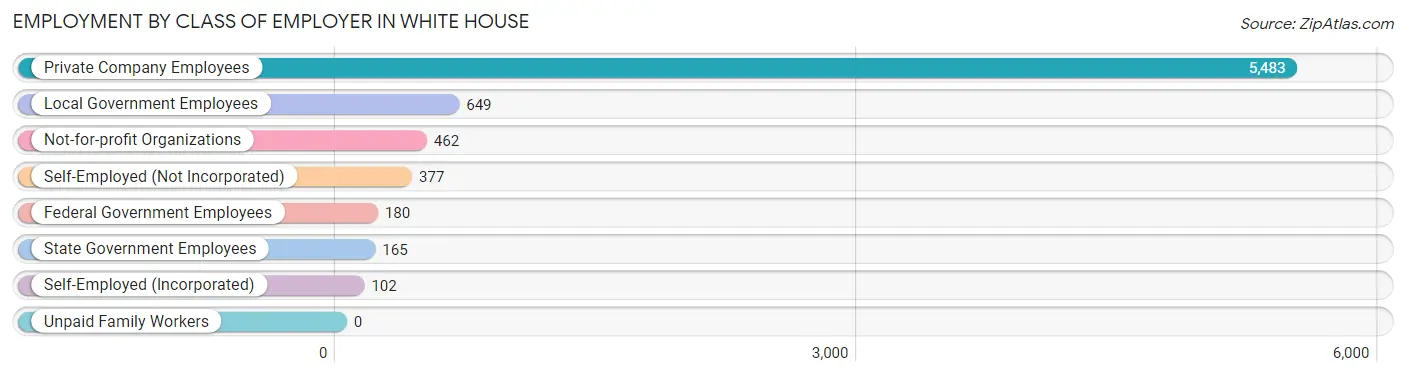
| Employer Class | # Employees | % Employees |
| Private Company Employees | 5,483 | 73.9% |
| Self-Employed (Incorporated) | 102 | 1.4% |
| Self-Employed (Not Incorporated) | 377 | 5.1% |
| Not-for-profit Organizations | 462 | 6.2% |
| Local Government Employees | 649 | 8.7% |
| State Government Employees | 165 | 2.2% |
| Federal Government Employees | 180 | 2.4% |
| Unpaid Family Workers | 0 | 0.0% |
| Total | 7,418 | 100.0% |
Employment Status by Age in White House
According to the labor force statistics for White House, out of the total population over 16 years of age (10,691), 71.8% or 7,676 individuals are in the labor force, with 2.5% or 192 of them unemployed. The age group with the highest labor force participation rate is 25 to 29 years, with 98.5% or 828 individuals in the labor force. Within the labor force, the 75 years and over age range has the highest percentage of unemployed individuals, with 22.9% or 16 of them being unemployed.
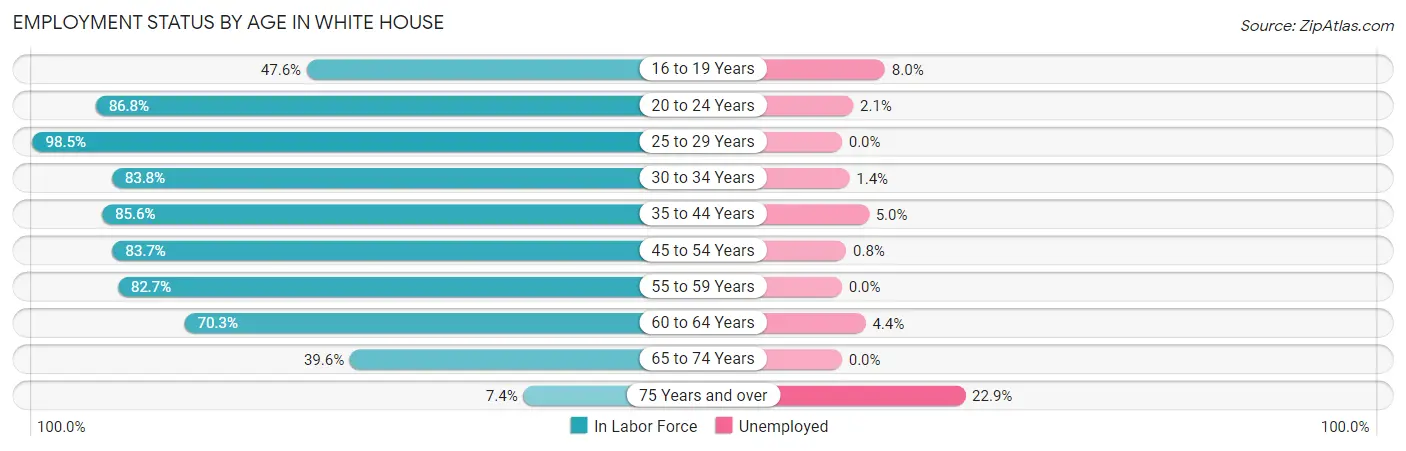
| Age Bracket | In Labor Force | Unemployed |
| 16 to 19 Years | 299 (47.6%) | 24 (8.0%) |
| 20 to 24 Years | 694 (86.8%) | 15 (2.1%) |
| 25 to 29 Years | 828 (98.5%) | 0 (0.0%) |
| 30 to 34 Years | 1,159 (83.8%) | 16 (1.4%) |
| 35 to 44 Years | 1,773 (85.6%) | 89 (5.0%) |
| 45 to 54 Years | 1,296 (83.7%) | 10 (0.8%) |
| 55 to 59 Years | 637 (82.7%) | 0 (0.0%) |
| 60 to 64 Years | 565 (70.3%) | 25 (4.4%) |
| 65 to 74 Years | 358 (39.6%) | 0 (0.0%) |
| 75 Years and over | 70 (7.4%) | 16 (22.9%) |
| Total | 7,676 (71.8%) | 192 (2.5%) |
Employment Status by Educational Attainment in White House
According to labor force statistics for White House, 84.3% of individuals (6,253) out of the total population between 25 and 64 years of age (7,417) are in the labor force, with 2.2% or 138 of them being unemployed. The group with the highest labor force participation rate are those with the educational attainment of bachelor's degree or higher, with 92.4% or 1,881 individuals in the labor force. Within the labor force, individuals with high school diploma education have the highest percentage of unemployment, with 4.3% or 74 of them being unemployed.
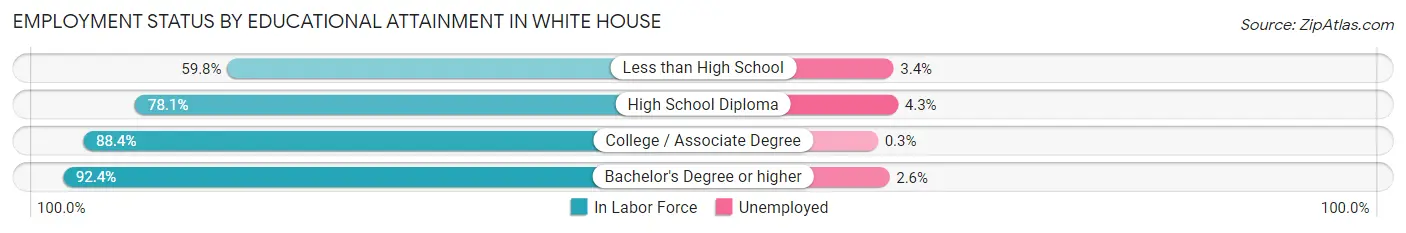
| Educational Attainment | In Labor Force | Unemployed |
| Less than High School | 324 (59.8%) | 18 (3.4%) |
| High School Diploma | 1,728 (78.1%) | 95 (4.3%) |
| College / Associate Degree | 2,321 (88.4%) | 8 (0.3%) |
| Bachelor's Degree or higher | 1,881 (92.4%) | 53 (2.6%) |
| Total | 6,253 (84.3%) | 163 (2.2%) |
Employment Occupations by Sex in White House
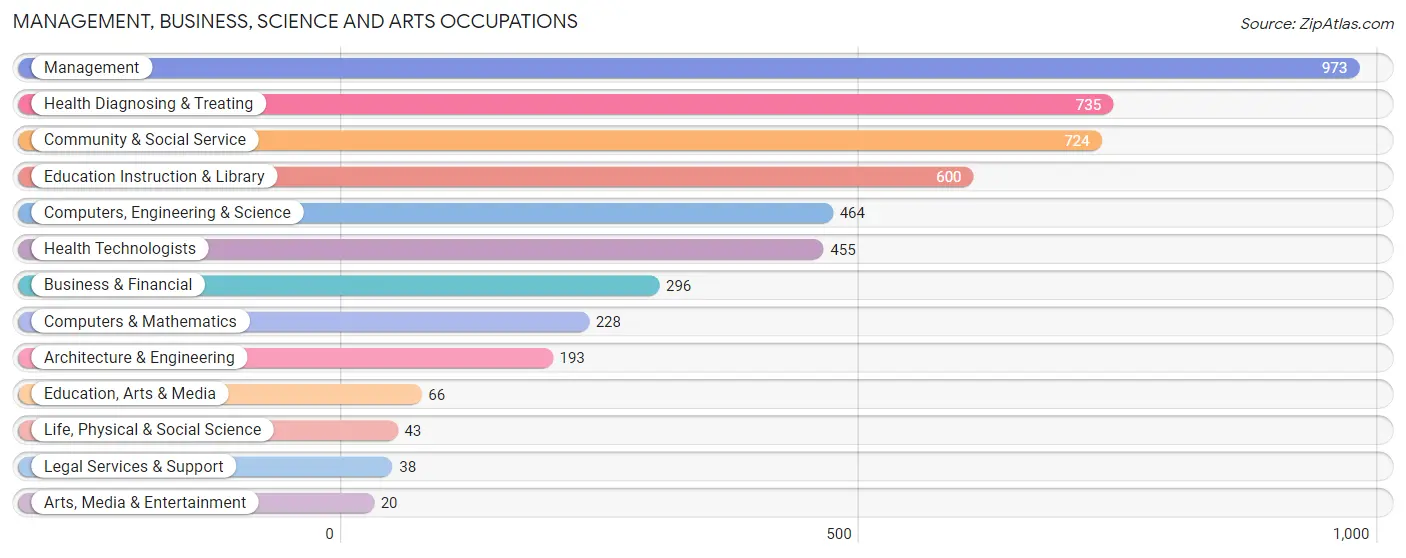
Management, Business, Science and Arts Occupations
The most common Management, Business, Science and Arts occupations in White House are Management (973 | 13.0%), Health Diagnosing & Treating (735 | 9.8%), Community & Social Service (724 | 9.7%), Education Instruction & Library (600 | 8.0%), and Computers, Engineering & Science (464 | 6.2%).
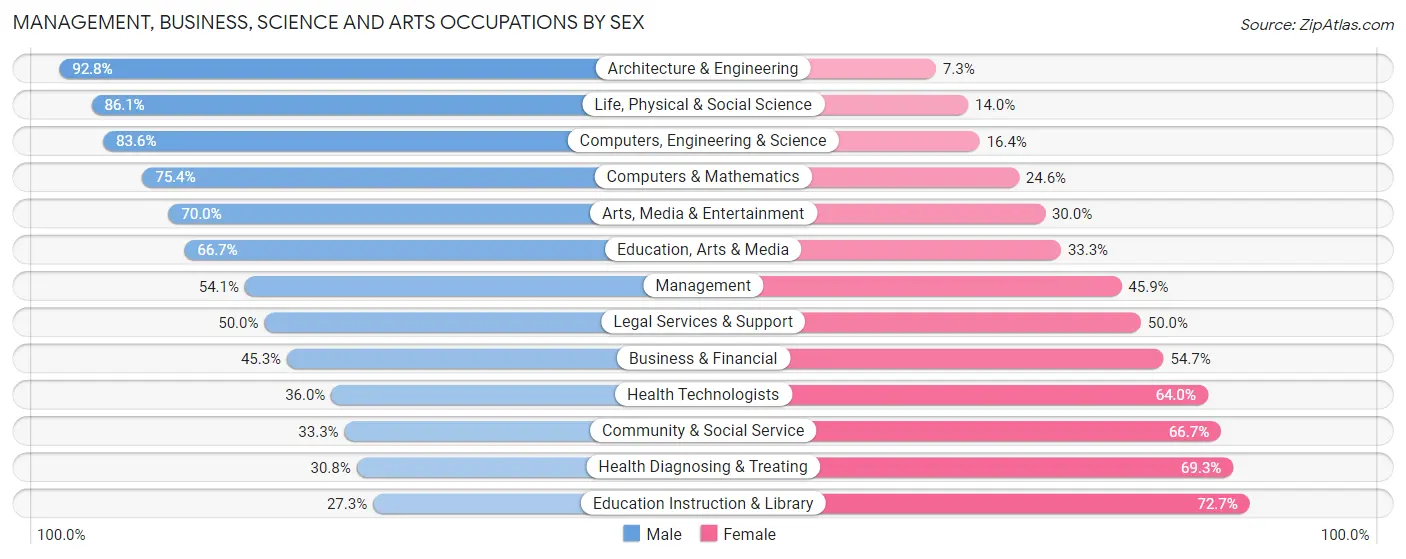
Management, Business, Science and Arts Occupations by Sex
Within the Management, Business, Science and Arts occupations in White House, the most male-oriented occupations are Architecture & Engineering (92.7%), Life, Physical & Social Science (86.1%), and Computers, Engineering & Science (83.6%), while the most female-oriented occupations are Education Instruction & Library (72.7%), Health Diagnosing & Treating (69.3%), and Community & Social Service (66.7%).
| Occupation | Male | Female |
| Management | 526 (54.1%) | 447 (45.9%) |
| Business & Financial | 134 (45.3%) | 162 (54.7%) |
| Computers, Engineering & Science | 388 (83.6%) | 76 (16.4%) |
| Computers & Mathematics | 172 (75.4%) | 56 (24.6%) |
| Architecture & Engineering | 179 (92.7%) | 14 (7.2%) |
| Life, Physical & Social Science | 37 (86.1%) | 6 (14.0%) |
| Community & Social Service | 241 (33.3%) | 483 (66.7%) |
| Education, Arts & Media | 44 (66.7%) | 22 (33.3%) |
| Legal Services & Support | 19 (50.0%) | 19 (50.0%) |
| Education Instruction & Library | 164 (27.3%) | 436 (72.7%) |
| Arts, Media & Entertainment | 14 (70.0%) | 6 (30.0%) |
| Health Diagnosing & Treating | 226 (30.7%) | 509 (69.3%) |
| Health Technologists | 164 (36.0%) | 291 (64.0%) |
| Total (Category) | 1,515 (47.5%) | 1,677 (52.5%) |
| Total (Overall) | 4,067 (54.5%) | 3,400 (45.5%) |
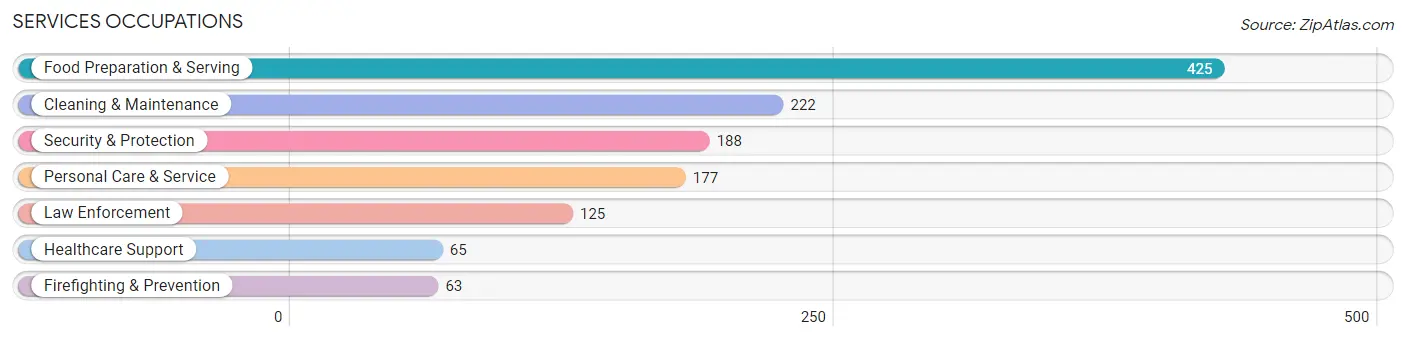
Services Occupations
The most common Services occupations in White House are Food Preparation & Serving (425 | 5.7%), Cleaning & Maintenance (222 | 3.0%), Security & Protection (188 | 2.5%), Personal Care & Service (177 | 2.4%), and Law Enforcement (125 | 1.7%).
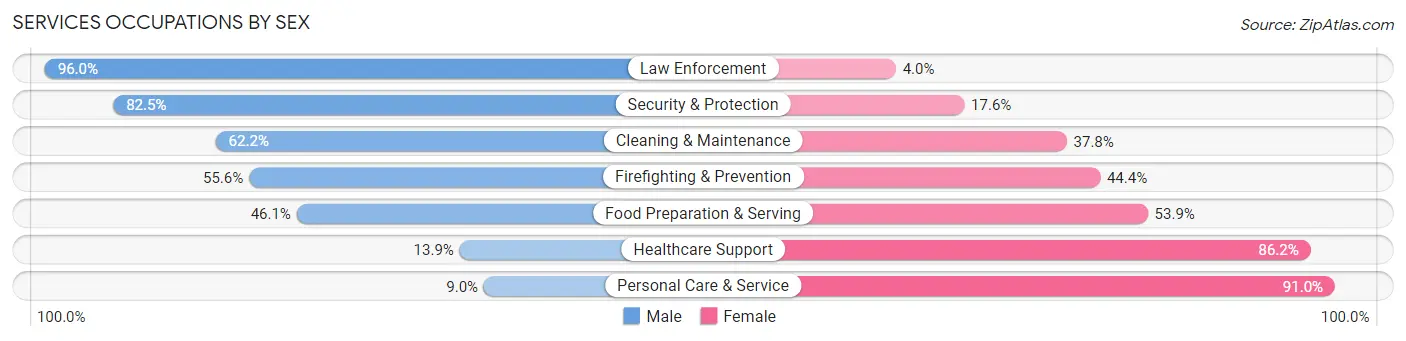
Services Occupations by Sex
Within the Services occupations in White House, the most male-oriented occupations are Law Enforcement (96.0%), Security & Protection (82.5%), and Cleaning & Maintenance (62.2%), while the most female-oriented occupations are Personal Care & Service (91.0%), Healthcare Support (86.2%), and Food Preparation & Serving (53.9%).
| Occupation | Male | Female |
| Healthcare Support | 9 (13.9%) | 56 (86.2%) |
| Security & Protection | 155 (82.5%) | 33 (17.5%) |
| Firefighting & Prevention | 35 (55.6%) | 28 (44.4%) |
| Law Enforcement | 120 (96.0%) | 5 (4.0%) |
| Food Preparation & Serving | 196 (46.1%) | 229 (53.9%) |
| Cleaning & Maintenance | 138 (62.2%) | 84 (37.8%) |
| Personal Care & Service | 16 (9.0%) | 161 (91.0%) |
| Total (Category) | 514 (47.7%) | 563 (52.3%) |
| Total (Overall) | 4,067 (54.5%) | 3,400 (45.5%) |
Sales and Office Occupations
The most common Sales and Office occupations in White House are Office & Administration (1,134 | 15.2%), and Sales & Related (609 | 8.2%).

Sales and Office Occupations by Sex
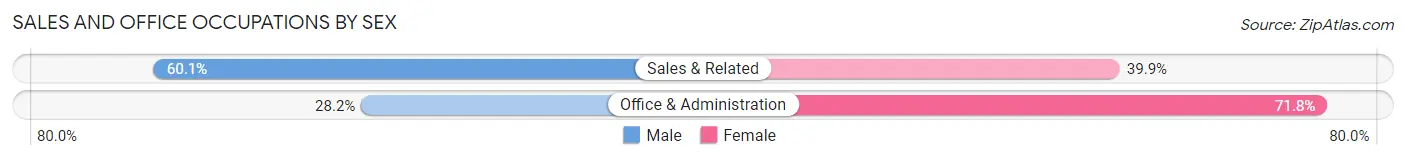
| Occupation | Male | Female |
| Sales & Related | 366 (60.1%) | 243 (39.9%) |
| Office & Administration | 320 (28.2%) | 814 (71.8%) |
| Total (Category) | 686 (39.4%) | 1,057 (60.6%) |
| Total (Overall) | 4,067 (54.5%) | 3,400 (45.5%) |
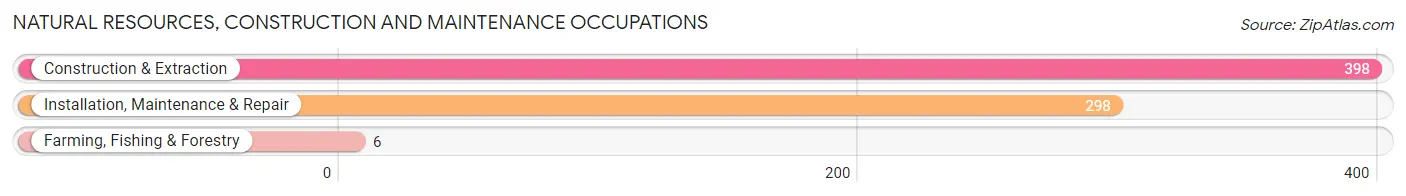
Natural Resources, Construction and Maintenance Occupations
The most common Natural Resources, Construction and Maintenance occupations in White House are Construction & Extraction (398 | 5.3%), Installation, Maintenance & Repair (298 | 4.0%), and Farming, Fishing & Forestry (6 | 0.1%).
Natural Resources, Construction and Maintenance Occupations by Sex
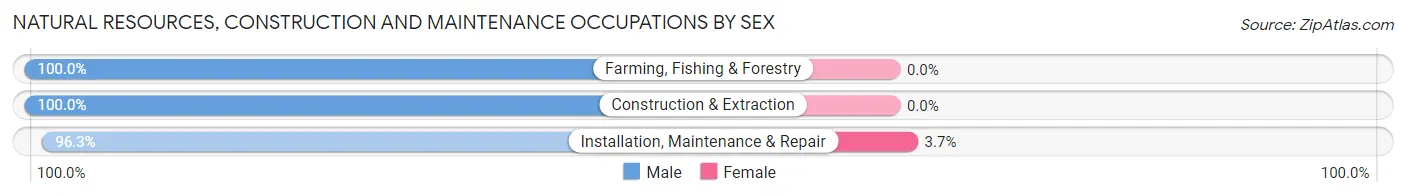
| Occupation | Male | Female |
| Farming, Fishing & Forestry | 6 (100.0%) | 0 (0.0%) |
| Construction & Extraction | 398 (100.0%) | 0 (0.0%) |
| Installation, Maintenance & Repair | 287 (96.3%) | 11 (3.7%) |
| Total (Category) | 691 (98.4%) | 11 (1.6%) |
| Total (Overall) | 4,067 (54.5%) | 3,400 (45.5%) |
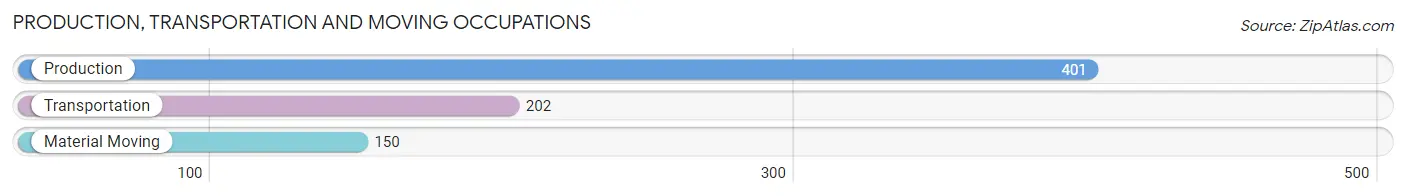
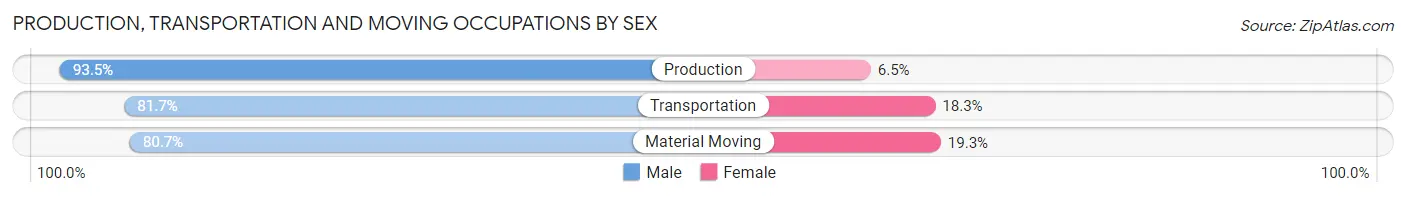
Production, Transportation and Moving Occupations
The most common Production, Transportation and Moving occupations in White House are Production (401 | 5.4%), Transportation (202 | 2.7%), and Material Moving (150 | 2.0%).
Production, Transportation and Moving Occupations by Sex
| Occupation | Male | Female |
| Production | 375 (93.5%) | 26 (6.5%) |
| Transportation | 165 (81.7%) | 37 (18.3%) |
| Material Moving | 121 (80.7%) | 29 (19.3%) |
| Total (Category) | 661 (87.8%) | 92 (12.2%) |
| Total (Overall) | 4,067 (54.5%) | 3,400 (45.5%) |
Employment Industries by Sex in White House
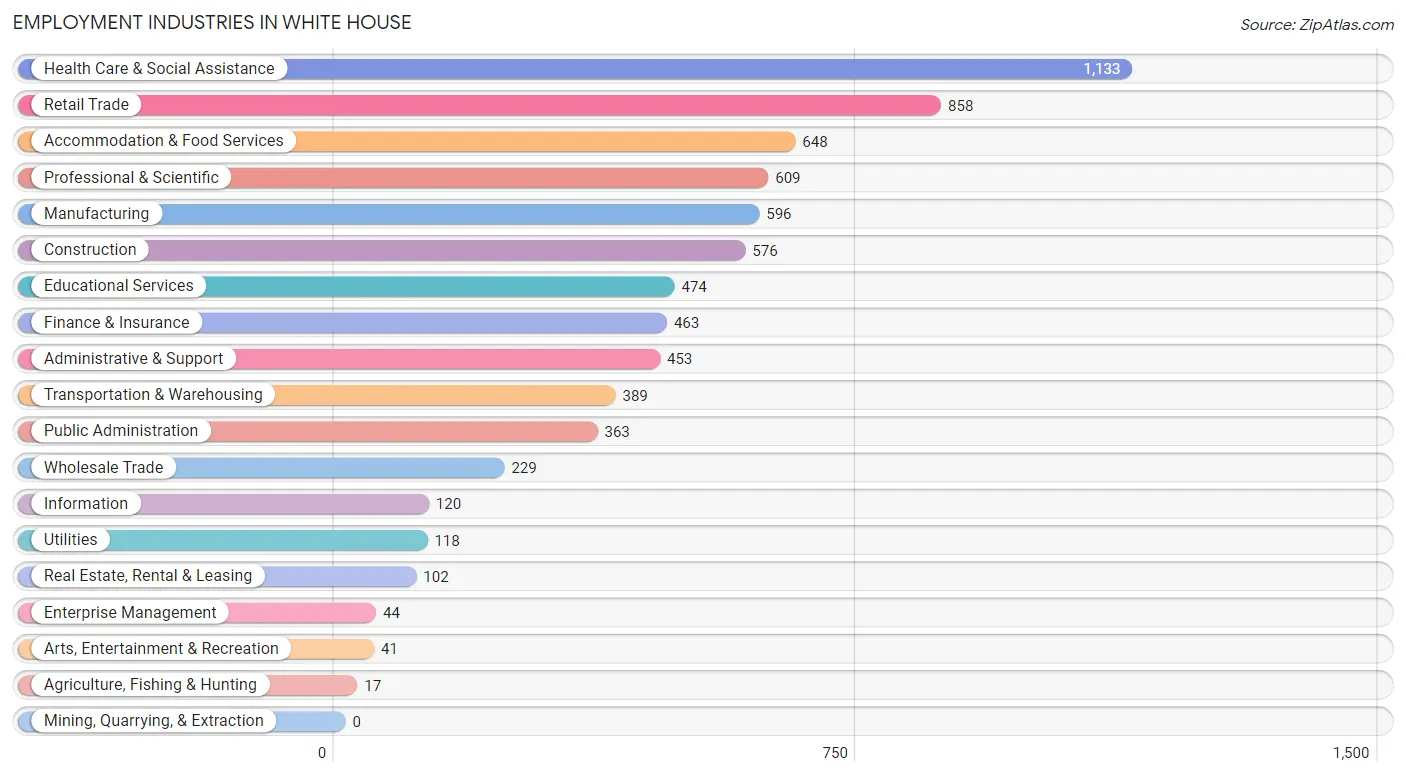
Employment Industries in White House
The major employment industries in White House include Health Care & Social Assistance (1,133 | 15.2%), Retail Trade (858 | 11.5%), Accommodation & Food Services (648 | 8.7%), Professional & Scientific (609 | 8.2%), and Manufacturing (596 | 8.0%).
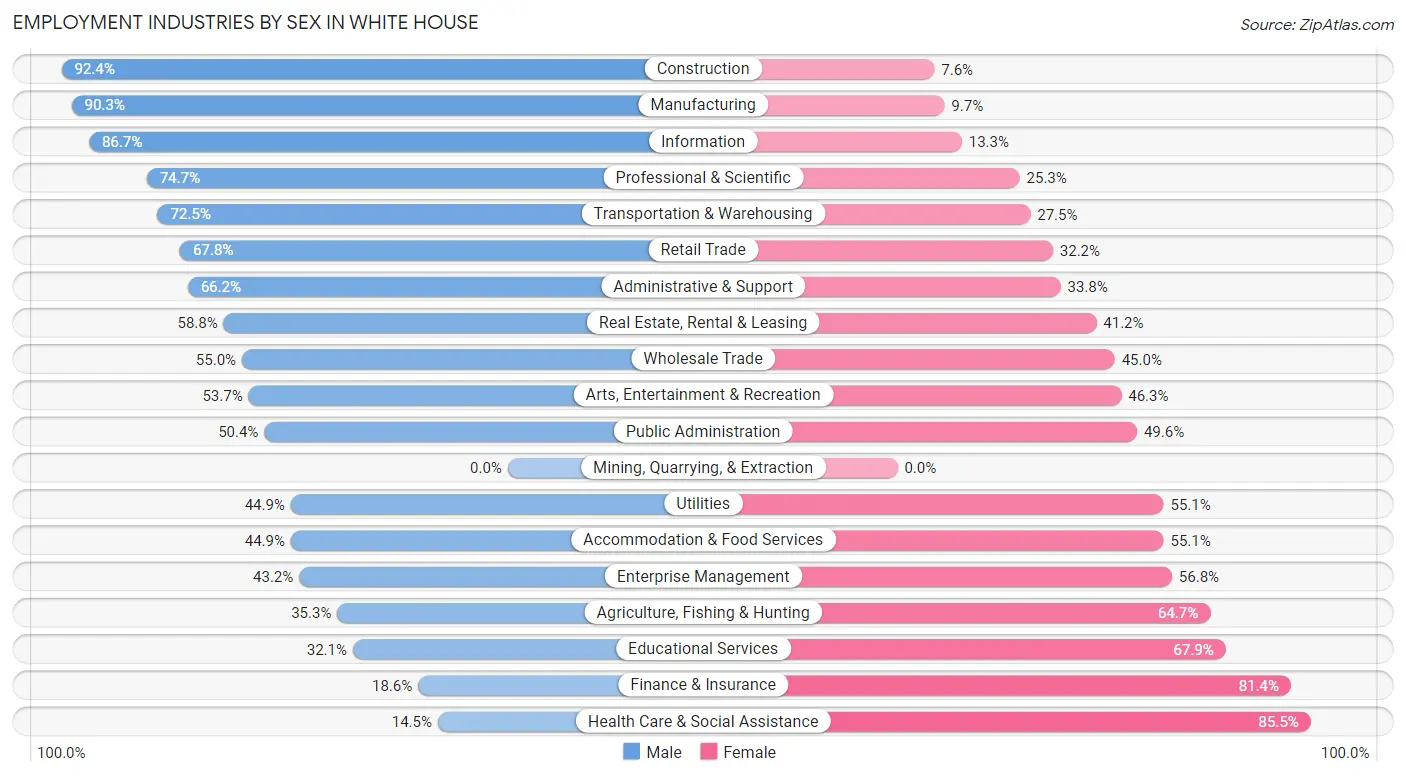
Employment Industries by Sex in White House
The White House industries that see more men than women are Construction (92.4%), Manufacturing (90.3%), and Information (86.7%), whereas the industries that tend to have a higher number of women are Health Care & Social Assistance (85.5%), Finance & Insurance (81.4%), and Educational Services (67.9%).
| Industry | Male | Female |
| Agriculture, Fishing & Hunting | 6 (35.3%) | 11 (64.7%) |
| Mining, Quarrying, & Extraction | 0 (0.0%) | 0 (0.0%) |
| Construction | 532 (92.4%) | 44 (7.6%) |
| Manufacturing | 538 (90.3%) | 58 (9.7%) |
| Wholesale Trade | 126 (55.0%) | 103 (45.0%) |
| Retail Trade | 582 (67.8%) | 276 (32.2%) |
| Transportation & Warehousing | 282 (72.5%) | 107 (27.5%) |
| Utilities | 53 (44.9%) | 65 (55.1%) |
| Information | 104 (86.7%) | 16 (13.3%) |
| Finance & Insurance | 86 (18.6%) | 377 (81.4%) |
| Real Estate, Rental & Leasing | 60 (58.8%) | 42 (41.2%) |
| Professional & Scientific | 455 (74.7%) | 154 (25.3%) |
| Enterprise Management | 19 (43.2%) | 25 (56.8%) |
| Administrative & Support | 300 (66.2%) | 153 (33.8%) |
| Educational Services | 152 (32.1%) | 322 (67.9%) |
| Health Care & Social Assistance | 164 (14.5%) | 969 (85.5%) |
| Arts, Entertainment & Recreation | 22 (53.7%) | 19 (46.3%) |
| Accommodation & Food Services | 291 (44.9%) | 357 (55.1%) |
| Public Administration | 183 (50.4%) | 180 (49.6%) |
| Total | 4,067 (54.5%) | 3,400 (45.5%) |
Education in White House
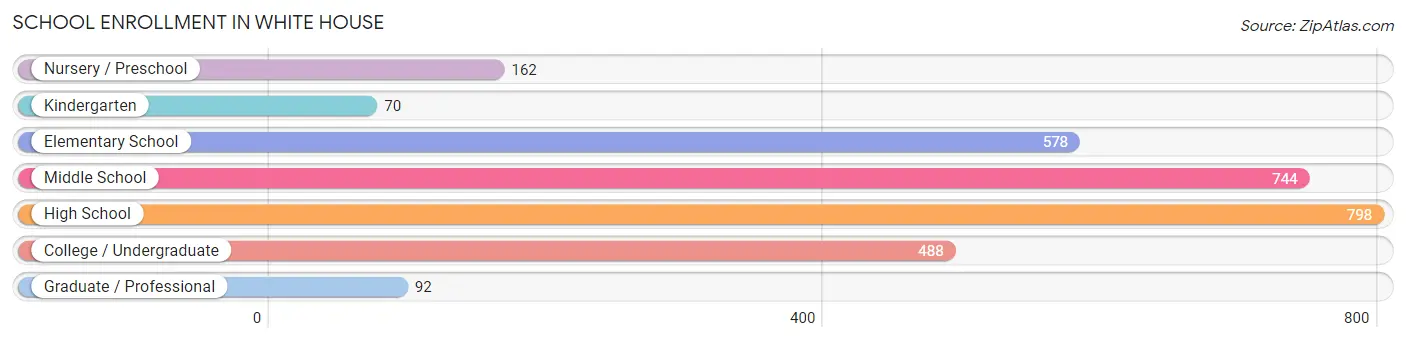
School Enrollment in White House
The most common levels of schooling among the 2,932 students in White House are high school (798 | 27.2%), middle school (744 | 25.4%), and elementary school (578 | 19.7%).
| School Level | # Students | % Students |
| Nursery / Preschool | 162 | 5.5% |
| Kindergarten | 70 | 2.4% |
| Elementary School | 578 | 19.7% |
| Middle School | 744 | 25.4% |
| High School | 798 | 27.2% |
| College / Undergraduate | 488 | 16.6% |
| Graduate / Professional | 92 | 3.1% |
| Total | 2,932 | 100.0% |
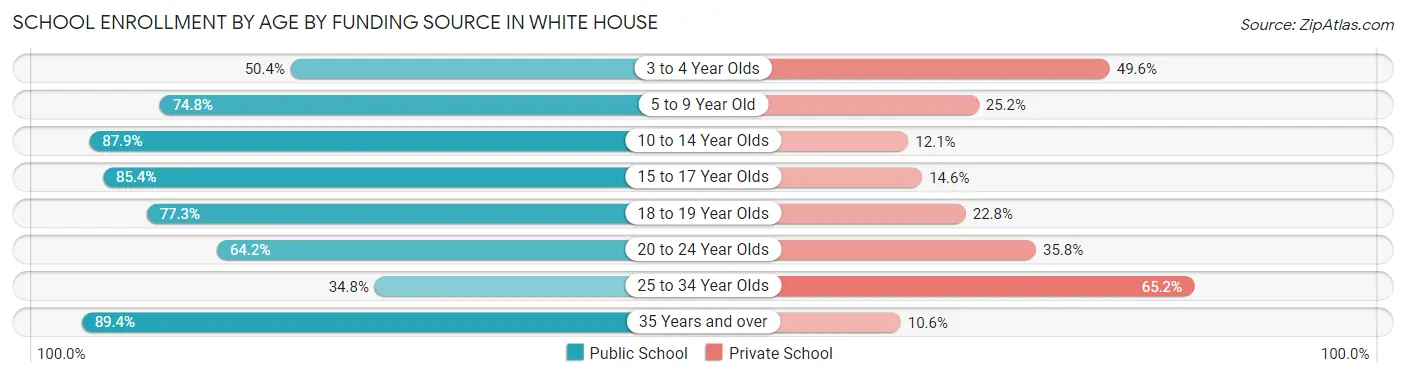
School Enrollment by Age by Funding Source in White House
Out of a total of 2,932 students who are enrolled in schools in White House, 657 (22.4%) attend a private institution, while the remaining 2,275 (77.6%) are enrolled in public schools. The age group of 25 to 34 year olds has the highest likelihood of being enrolled in private schools, with 120 (65.2% in the age bracket) enrolled. Conversely, the age group of 35 years and over has the lowest likelihood of being enrolled in a private school, with 42 (89.4% in the age bracket) attending a public institution.
| Age Bracket | Public School | Private School |
| 3 to 4 Year Olds | 58 (50.4%) | 57 (49.6%) |
| 5 to 9 Year Old | 431 (74.8%) | 145 (25.2%) |
| 10 to 14 Year Olds | 970 (87.9%) | 133 (12.1%) |
| 15 to 17 Year Olds | 420 (85.4%) | 72 (14.6%) |
| 18 to 19 Year Olds | 146 (77.2%) | 43 (22.8%) |
| 20 to 24 Year Olds | 145 (64.2%) | 81 (35.8%) |
| 25 to 34 Year Olds | 64 (34.8%) | 120 (65.2%) |
| 35 Years and over | 42 (89.4%) | 5 (10.6%) |
| Total | 2,275 (77.6%) | 657 (22.4%) |
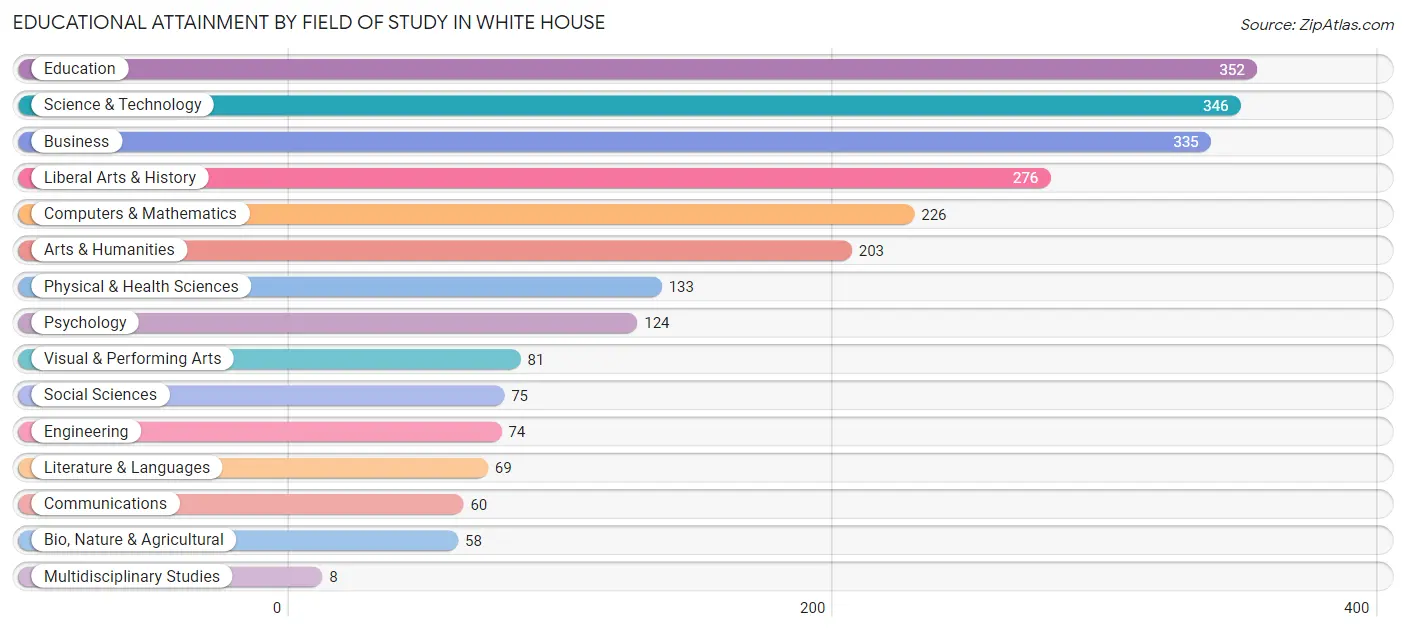
Educational Attainment by Field of Study in White House
Education (352 | 14.5%), science & technology (346 | 14.3%), business (335 | 13.8%), liberal arts & history (276 | 11.4%), and computers & mathematics (226 | 9.3%) are the most common fields of study among 2,420 individuals in White House who have obtained a bachelor's degree or higher.
| Field of Study | # Graduates | % Graduates |
| Computers & Mathematics | 226 | 9.3% |
| Bio, Nature & Agricultural | 58 | 2.4% |
| Physical & Health Sciences | 133 | 5.5% |
| Psychology | 124 | 5.1% |
| Social Sciences | 75 | 3.1% |
| Engineering | 74 | 3.1% |
| Multidisciplinary Studies | 8 | 0.3% |
| Science & Technology | 346 | 14.3% |
| Business | 335 | 13.8% |
| Education | 352 | 14.5% |
| Literature & Languages | 69 | 2.9% |
| Liberal Arts & History | 276 | 11.4% |
| Visual & Performing Arts | 81 | 3.4% |
| Communications | 60 | 2.5% |
| Arts & Humanities | 203 | 8.4% |
| Total | 2,420 | 100.0% |
Transportation & Commute in White House
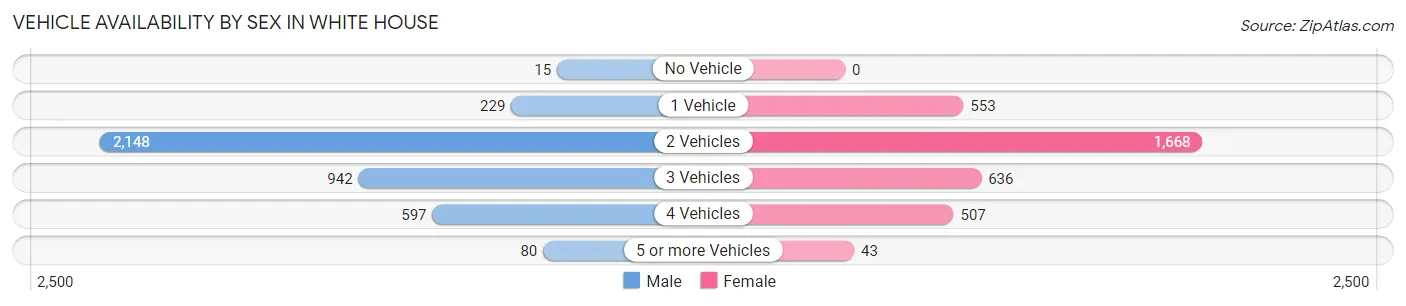
Vehicle Availability by Sex in White House
The most prevalent vehicle ownership categories in White House are males with 2 vehicles (2,148, accounting for 53.5%) and females with 2 vehicles (1,668, making up 63.0%).
| Vehicles Available | Male | Female |
| No Vehicle | 15 (0.4%) | 0 (0.0%) |
| 1 Vehicle | 229 (5.7%) | 553 (16.2%) |
| 2 Vehicles | 2,148 (53.5%) | 1,668 (49.0%) |
| 3 Vehicles | 942 (23.5%) | 636 (18.7%) |
| 4 Vehicles | 597 (14.9%) | 507 (14.9%) |
| 5 or more Vehicles | 80 (2.0%) | 43 (1.3%) |
| Total | 4,011 (100.0%) | 3,407 (100.0%) |
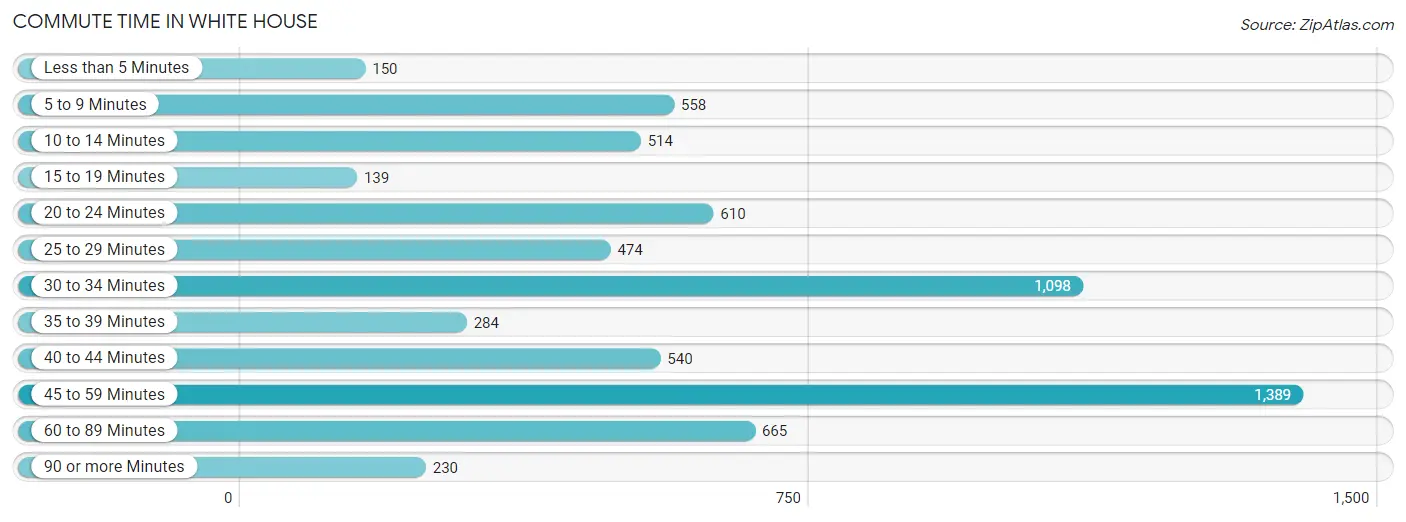
Commute Time in White House
The most frequently occuring commute durations in White House are 45 to 59 minutes (1,389 commuters, 20.9%), 30 to 34 minutes (1,098 commuters, 16.5%), and 60 to 89 minutes (665 commuters, 10.0%).
| Commute Time | # Commuters | % Commuters |
| Less than 5 Minutes | 150 | 2.3% |
| 5 to 9 Minutes | 558 | 8.4% |
| 10 to 14 Minutes | 514 | 7.7% |
| 15 to 19 Minutes | 139 | 2.1% |
| 20 to 24 Minutes | 610 | 9.2% |
| 25 to 29 Minutes | 474 | 7.1% |
| 30 to 34 Minutes | 1,098 | 16.5% |
| 35 to 39 Minutes | 284 | 4.3% |
| 40 to 44 Minutes | 540 | 8.1% |
| 45 to 59 Minutes | 1,389 | 20.9% |
| 60 to 89 Minutes | 665 | 10.0% |
| 90 or more Minutes | 230 | 3.5% |
Commute Time by Sex in White House
The most common commute times in White House are 45 to 59 minutes (899 commuters, 25.0%) for males and 45 to 59 minutes (490 commuters, 16.1%) for females.
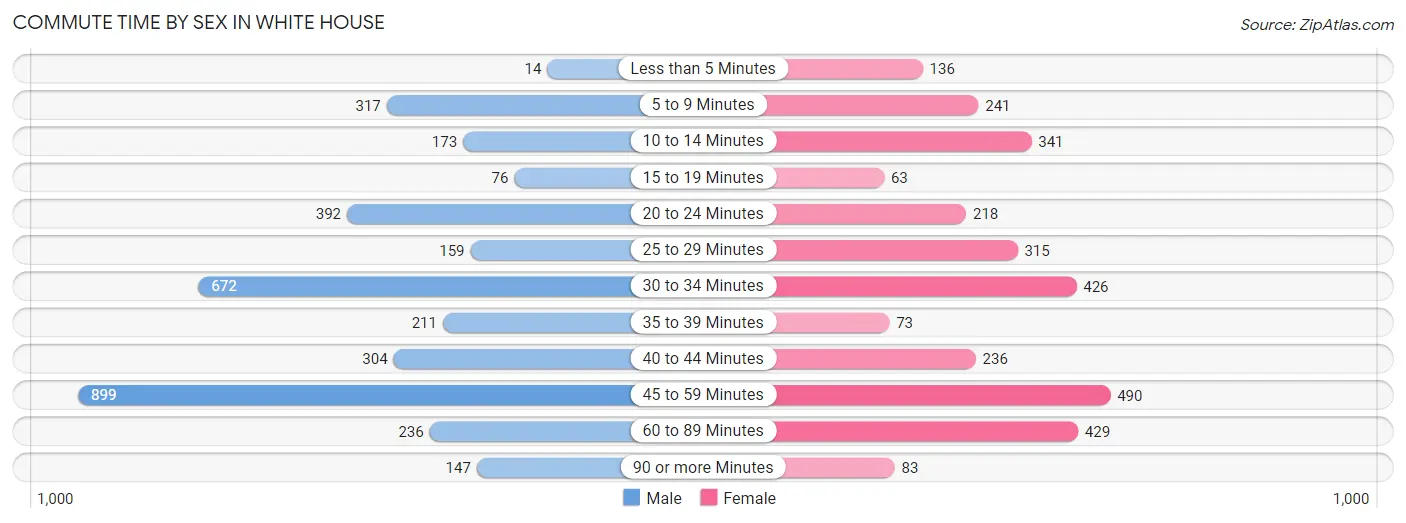
| Commute Time | Male | Female |
| Less than 5 Minutes | 14 (0.4%) | 136 (4.5%) |
| 5 to 9 Minutes | 317 (8.8%) | 241 (7.9%) |
| 10 to 14 Minutes | 173 (4.8%) | 341 (11.2%) |
| 15 to 19 Minutes | 76 (2.1%) | 63 (2.1%) |
| 20 to 24 Minutes | 392 (10.9%) | 218 (7.1%) |
| 25 to 29 Minutes | 159 (4.4%) | 315 (10.3%) |
| 30 to 34 Minutes | 672 (18.7%) | 426 (14.0%) |
| 35 to 39 Minutes | 211 (5.9%) | 73 (2.4%) |
| 40 to 44 Minutes | 304 (8.4%) | 236 (7.7%) |
| 45 to 59 Minutes | 899 (25.0%) | 490 (16.1%) |
| 60 to 89 Minutes | 236 (6.6%) | 429 (14.1%) |
| 90 or more Minutes | 147 (4.1%) | 83 (2.7%) |
Time of Departure to Work by Sex in White House
The most frequent times of departure to work in White House are 7:00 AM to 7:29 AM (594, 16.5%) for males and 6:30 AM to 6:59 AM (548, 18.0%) for females.
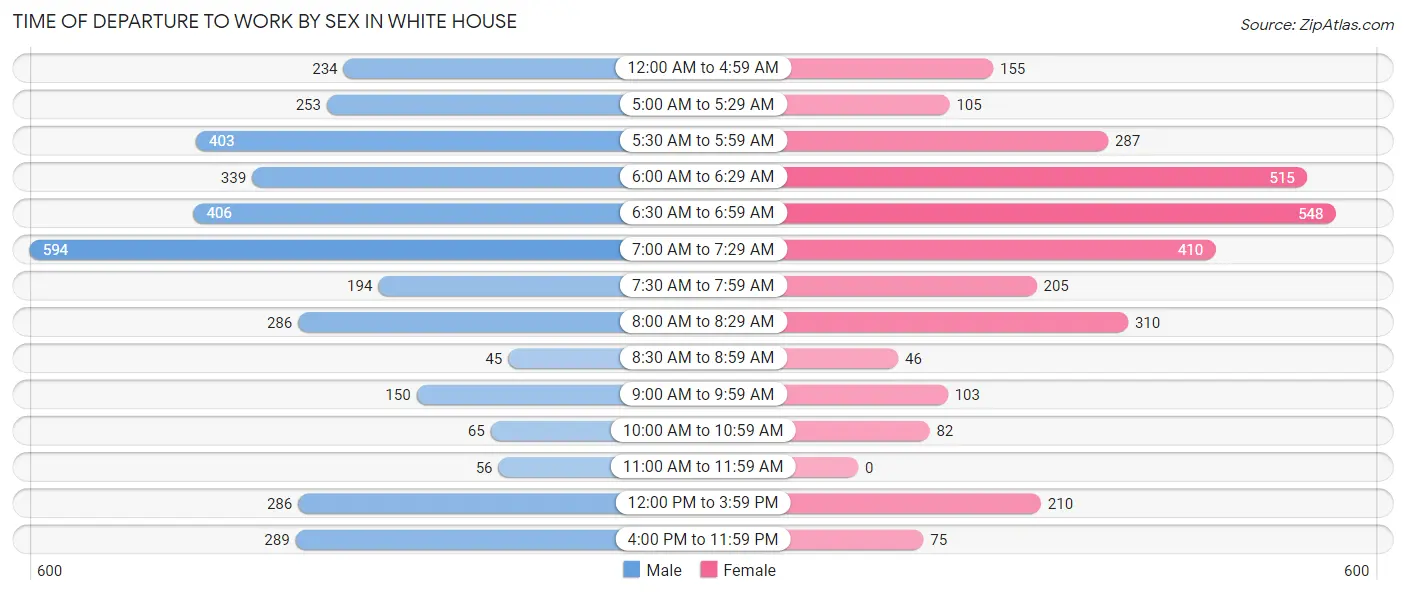
| Time of Departure | Male | Female |
| 12:00 AM to 4:59 AM | 234 (6.5%) | 155 (5.1%) |
| 5:00 AM to 5:29 AM | 253 (7.0%) | 105 (3.4%) |
| 5:30 AM to 5:59 AM | 403 (11.2%) | 287 (9.4%) |
| 6:00 AM to 6:29 AM | 339 (9.4%) | 515 (16.9%) |
| 6:30 AM to 6:59 AM | 406 (11.3%) | 548 (18.0%) |
| 7:00 AM to 7:29 AM | 594 (16.5%) | 410 (13.4%) |
| 7:30 AM to 7:59 AM | 194 (5.4%) | 205 (6.7%) |
| 8:00 AM to 8:29 AM | 286 (7.9%) | 310 (10.2%) |
| 8:30 AM to 8:59 AM | 45 (1.3%) | 46 (1.5%) |
| 9:00 AM to 9:59 AM | 150 (4.2%) | 103 (3.4%) |
| 10:00 AM to 10:59 AM | 65 (1.8%) | 82 (2.7%) |
| 11:00 AM to 11:59 AM | 56 (1.6%) | 0 (0.0%) |
| 12:00 PM to 3:59 PM | 286 (7.9%) | 210 (6.9%) |
| 4:00 PM to 11:59 PM | 289 (8.0%) | 75 (2.5%) |
| Total | 3,600 (100.0%) | 3,051 (100.0%) |
Housing Occupancy in White House
Occupancy by Ownership in White House
Of the total 5,041 dwellings in White House, owner-occupied units account for 3,833 (76.0%), while renter-occupied units make up 1,208 (24.0%).
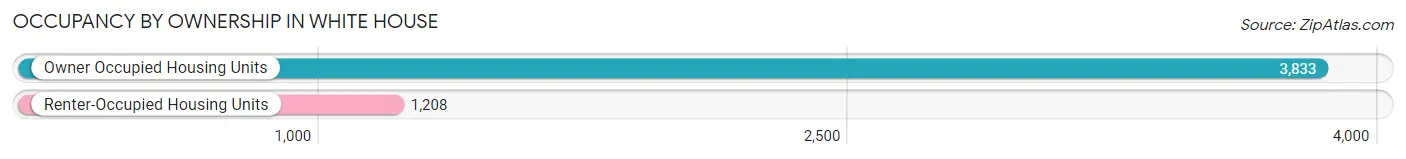
| Occupancy | # Housing Units | % Housing Units |
| Owner Occupied Housing Units | 3,833 | 76.0% |
| Renter-Occupied Housing Units | 1,208 | 24.0% |
| Total Occupied Housing Units | 5,041 | 100.0% |
Occupancy by Household Size in White House
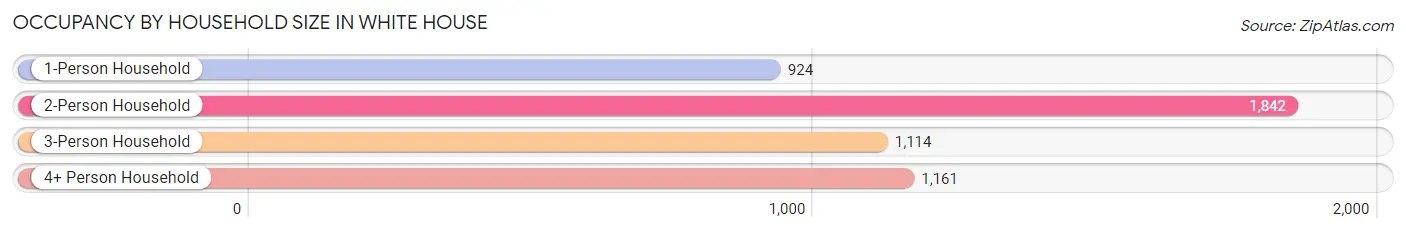
| Household Size | # Housing Units | % Housing Units |
| 1-Person Household | 924 | 18.3% |
| 2-Person Household | 1,842 | 36.5% |
| 3-Person Household | 1,114 | 22.1% |
| 4+ Person Household | 1,161 | 23.0% |
| Total Housing Units | 5,041 | 100.0% |
Occupancy by Ownership by Household Size in White House
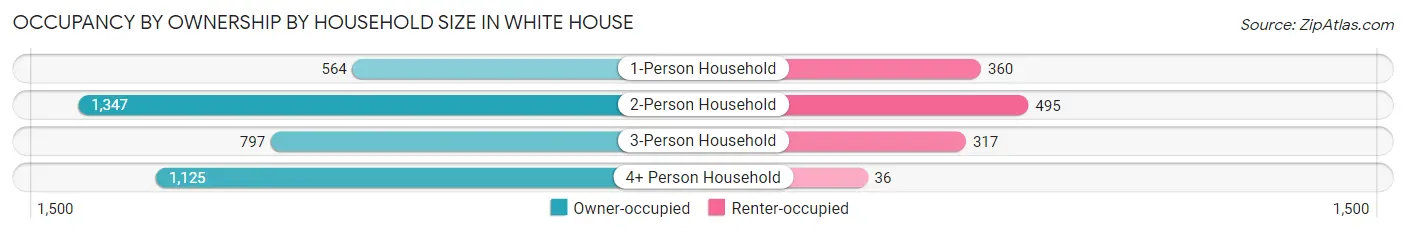
| Household Size | Owner-occupied | Renter-occupied |
| 1-Person Household | 564 (61.0%) | 360 (39.0%) |
| 2-Person Household | 1,347 (73.1%) | 495 (26.9%) |
| 3-Person Household | 797 (71.5%) | 317 (28.5%) |
| 4+ Person Household | 1,125 (96.9%) | 36 (3.1%) |
| Total Housing Units | 3,833 (76.0%) | 1,208 (24.0%) |
Occupancy by Educational Attainment in White House
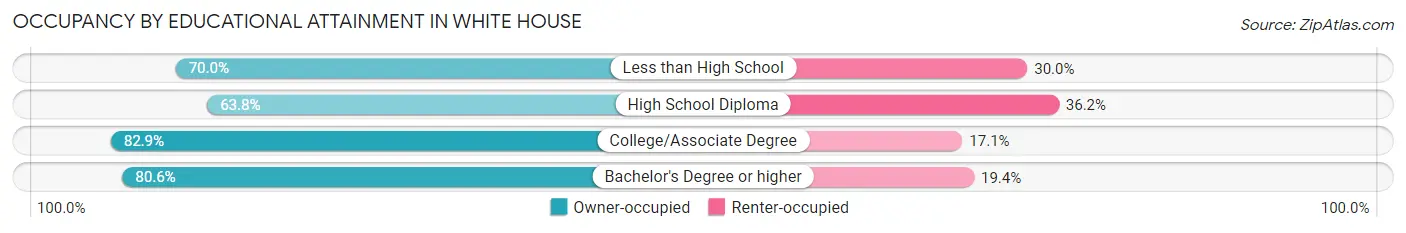
| Household Size | Owner-occupied | Renter-occupied |
| Less than High School | 278 (70.0%) | 119 (30.0%) |
| High School Diploma | 884 (63.8%) | 502 (36.2%) |
| College/Associate Degree | 1,624 (82.9%) | 335 (17.1%) |
| Bachelor's Degree or higher | 1,047 (80.6%) | 252 (19.4%) |
Occupancy by Age of Householder in White House
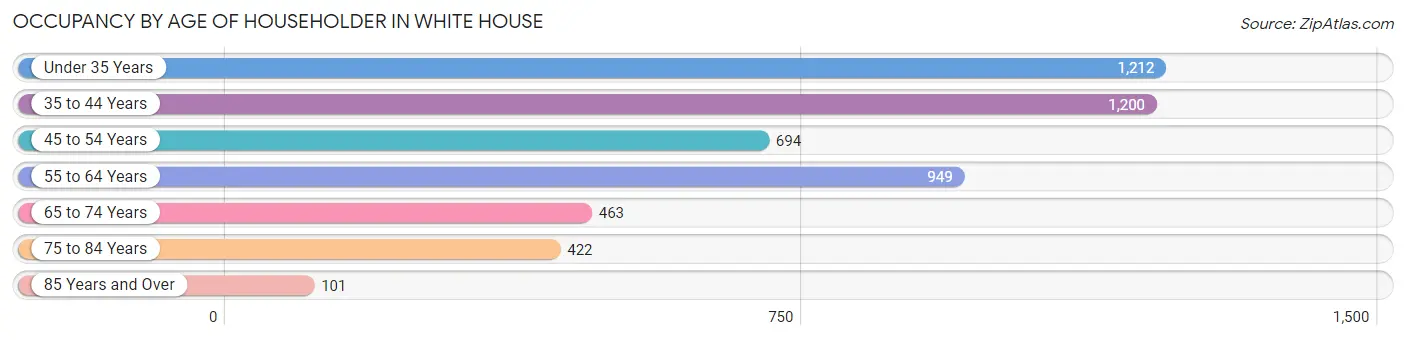
| Age Bracket | # Households | % Households |
| Under 35 Years | 1,212 | 24.0% |
| 35 to 44 Years | 1,200 | 23.8% |
| 45 to 54 Years | 694 | 13.8% |
| 55 to 64 Years | 949 | 18.8% |
| 65 to 74 Years | 463 | 9.2% |
| 75 to 84 Years | 422 | 8.4% |
| 85 Years and Over | 101 | 2.0% |
| Total | 5,041 | 100.0% |
Housing Finances in White House
Median Income by Occupancy in White House
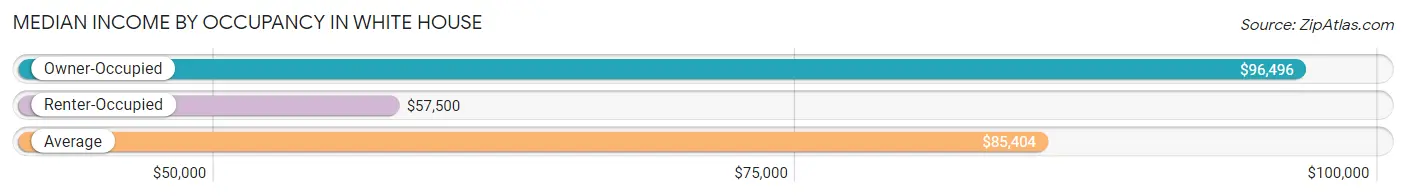
| Occupancy Type | # Households | Median Income |
| Owner-Occupied | 3,833 (76.0%) | $96,496 |
| Renter-Occupied | 1,208 (24.0%) | $57,500 |
| Average | 5,041 (100.0%) | $85,404 |
Occupancy by Householder Income Bracket in White House
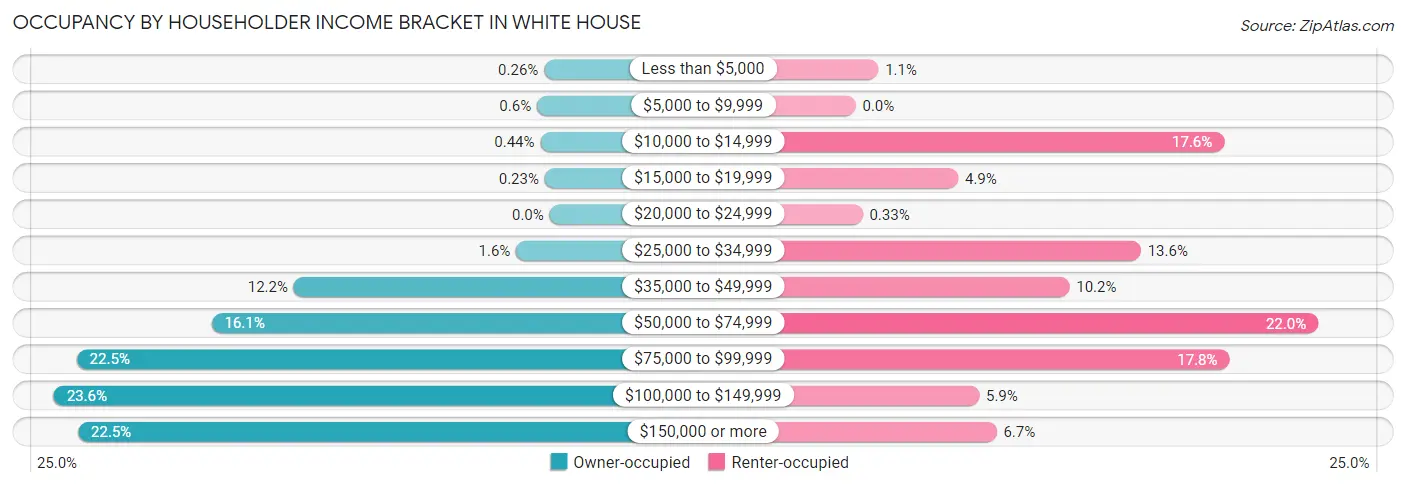
| Income Bracket | Owner-occupied | Renter-occupied |
| Less than $5,000 | 10 (0.3%) | 13 (1.1%) |
| $5,000 to $9,999 | 23 (0.6%) | 0 (0.0%) |
| $10,000 to $14,999 | 17 (0.4%) | 212 (17.5%) |
| $15,000 to $19,999 | 9 (0.2%) | 59 (4.9%) |
| $20,000 to $24,999 | 0 (0.0%) | 4 (0.3%) |
| $25,000 to $34,999 | 61 (1.6%) | 164 (13.6%) |
| $35,000 to $49,999 | 467 (12.2%) | 123 (10.2%) |
| $50,000 to $74,999 | 617 (16.1%) | 266 (22.0%) |
| $75,000 to $99,999 | 863 (22.5%) | 215 (17.8%) |
| $100,000 to $149,999 | 905 (23.6%) | 71 (5.9%) |
| $150,000 or more | 861 (22.5%) | 81 (6.7%) |
| Total | 3,833 (100.0%) | 1,208 (100.0%) |
Monthly Housing Cost Tiers in White House
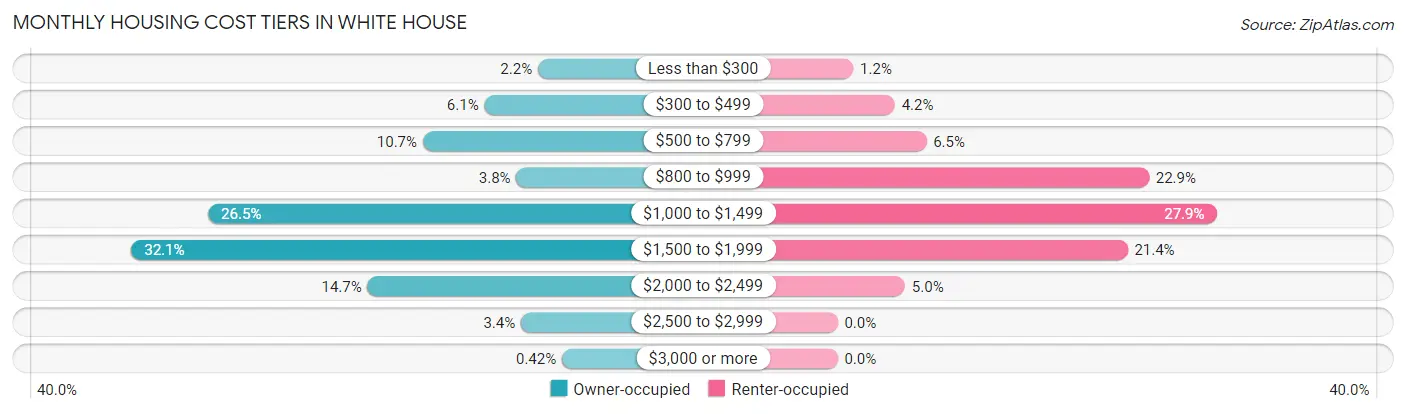
| Monthly Cost | Owner-occupied | Renter-occupied |
| Less than $300 | 84 (2.2%) | 14 (1.2%) |
| $300 to $499 | 235 (6.1%) | 51 (4.2%) |
| $500 to $799 | 409 (10.7%) | 79 (6.5%) |
| $800 to $999 | 145 (3.8%) | 277 (22.9%) |
| $1,000 to $1,499 | 1,015 (26.5%) | 337 (27.9%) |
| $1,500 to $1,999 | 1,232 (32.1%) | 258 (21.4%) |
| $2,000 to $2,499 | 565 (14.7%) | 60 (5.0%) |
| $2,500 to $2,999 | 132 (3.4%) | 0 (0.0%) |
| $3,000 or more | 16 (0.4%) | 0 (0.0%) |
| Total | 3,833 (100.0%) | 1,208 (100.0%) |
Physical Housing Characteristics in White House
Housing Structures in White House
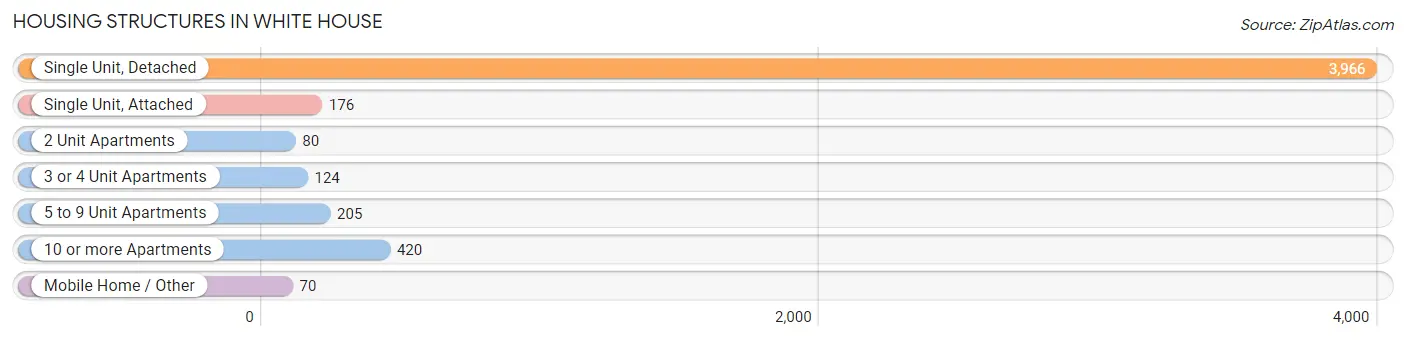
| Structure Type | # Housing Units | % Housing Units |
| Single Unit, Detached | 3,966 | 78.7% |
| Single Unit, Attached | 176 | 3.5% |
| 2 Unit Apartments | 80 | 1.6% |
| 3 or 4 Unit Apartments | 124 | 2.5% |
| 5 to 9 Unit Apartments | 205 | 4.1% |
| 10 or more Apartments | 420 | 8.3% |
| Mobile Home / Other | 70 | 1.4% |
| Total | 5,041 | 100.0% |
Housing Structures by Occupancy in White House
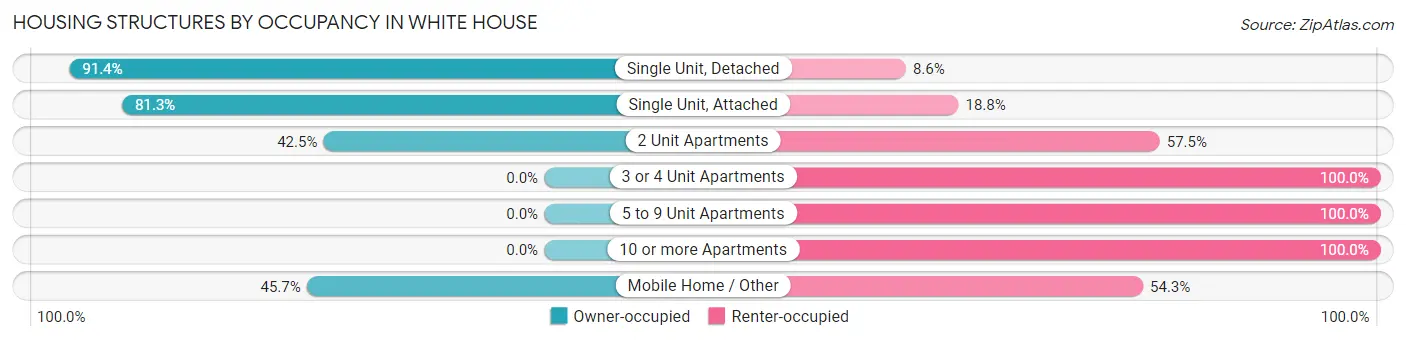
| Structure Type | Owner-occupied | Renter-occupied |
| Single Unit, Detached | 3,624 (91.4%) | 342 (8.6%) |
| Single Unit, Attached | 143 (81.2%) | 33 (18.8%) |
| 2 Unit Apartments | 34 (42.5%) | 46 (57.5%) |
| 3 or 4 Unit Apartments | 0 (0.0%) | 124 (100.0%) |
| 5 to 9 Unit Apartments | 0 (0.0%) | 205 (100.0%) |
| 10 or more Apartments | 0 (0.0%) | 420 (100.0%) |
| Mobile Home / Other | 32 (45.7%) | 38 (54.3%) |
| Total | 3,833 (76.0%) | 1,208 (24.0%) |
Housing Structures by Number of Rooms in White House
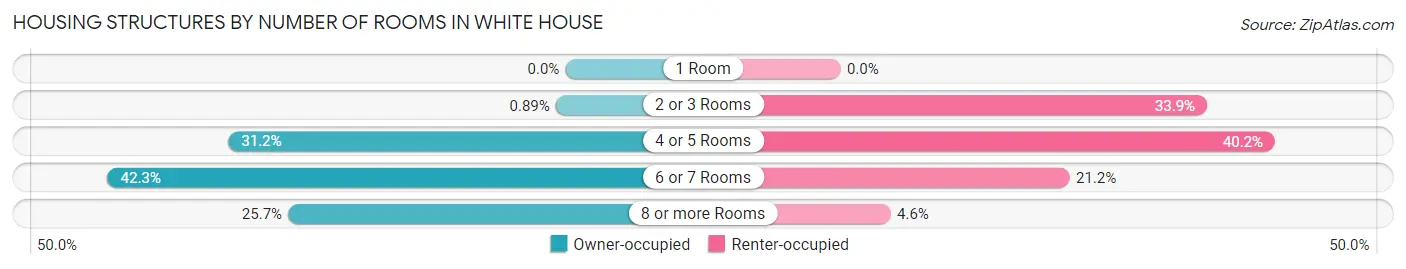
| Number of Rooms | Owner-occupied | Renter-occupied |
| 1 Room | 0 (0.0%) | 0 (0.0%) |
| 2 or 3 Rooms | 34 (0.9%) | 410 (33.9%) |
| 4 or 5 Rooms | 1,194 (31.1%) | 486 (40.2%) |
| 6 or 7 Rooms | 1,622 (42.3%) | 256 (21.2%) |
| 8 or more Rooms | 983 (25.7%) | 56 (4.6%) |
| Total | 3,833 (100.0%) | 1,208 (100.0%) |
Housing Structure by Heating Type in White House
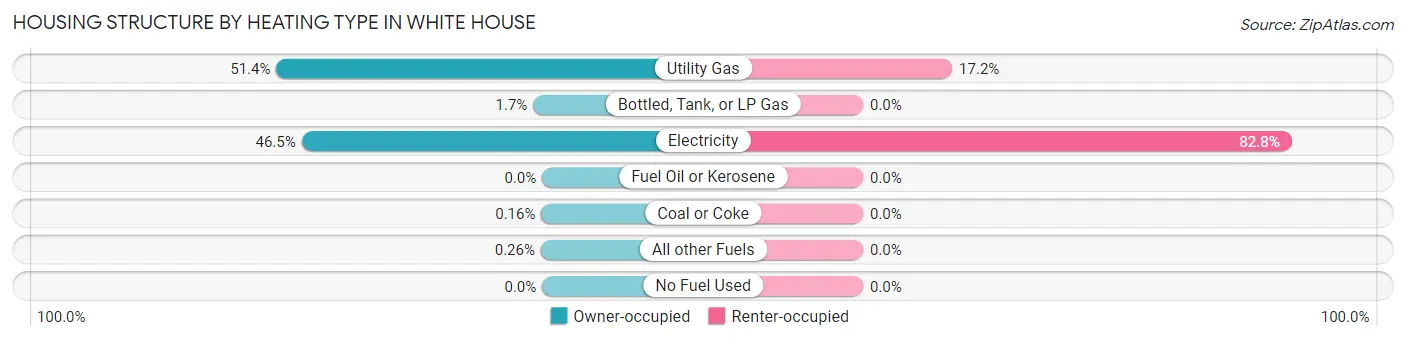
| Heating Type | Owner-occupied | Renter-occupied |
| Utility Gas | 1,969 (51.4%) | 208 (17.2%) |
| Bottled, Tank, or LP Gas | 66 (1.7%) | 0 (0.0%) |
| Electricity | 1,782 (46.5%) | 1,000 (82.8%) |
| Fuel Oil or Kerosene | 0 (0.0%) | 0 (0.0%) |
| Coal or Coke | 6 (0.2%) | 0 (0.0%) |
| All other Fuels | 10 (0.3%) | 0 (0.0%) |
| No Fuel Used | 0 (0.0%) | 0 (0.0%) |
| Total | 3,833 (100.0%) | 1,208 (100.0%) |
Household Vehicle Usage in White House
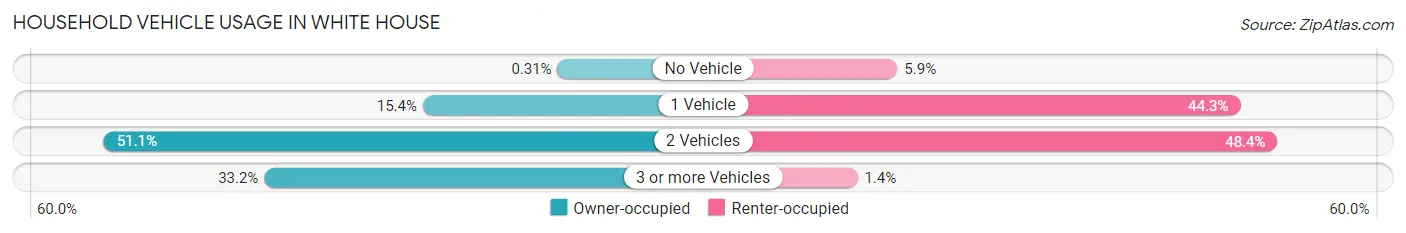
| Vehicles per Household | Owner-occupied | Renter-occupied |
| No Vehicle | 12 (0.3%) | 71 (5.9%) |
| 1 Vehicle | 590 (15.4%) | 535 (44.3%) |
| 2 Vehicles | 1,960 (51.1%) | 585 (48.4%) |
| 3 or more Vehicles | 1,271 (33.2%) | 17 (1.4%) |
| Total | 3,833 (100.0%) | 1,208 (100.0%) |
Real Estate & Mortgages in White House
Real Estate and Mortgage Overview in White House
| Characteristic | Without Mortgage | With Mortgage |
| Housing Units | 747 | 3,086 |
| Median Property Value | $295,400 | $285,400 |
| Median Household Income | $70,139 | $743 |
| Monthly Housing Costs | $552 | $16 |
| Real Estate Taxes | $1,731 | $49 |
Property Value by Mortgage Status in White House
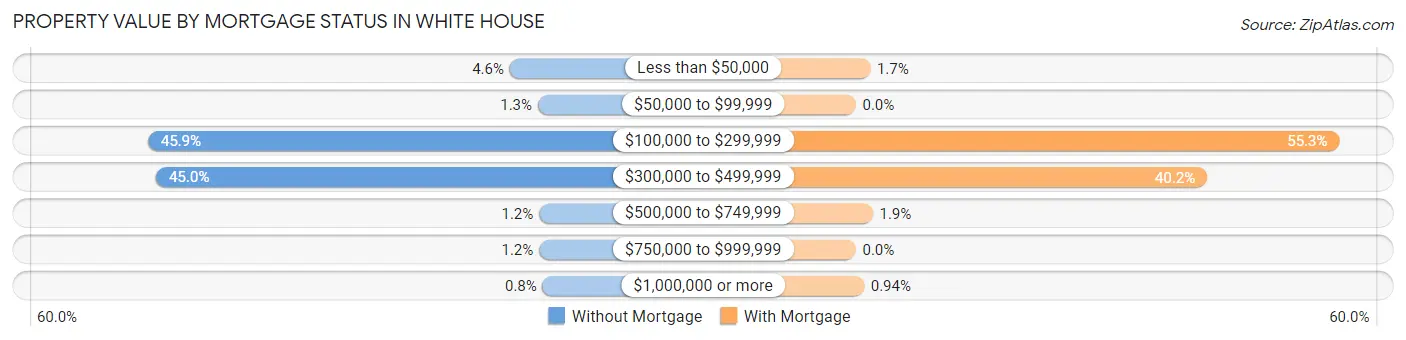
| Property Value | Without Mortgage | With Mortgage |
| Less than $50,000 | 34 (4.5%) | 51 (1.7%) |
| $50,000 to $99,999 | 10 (1.3%) | 0 (0.0%) |
| $100,000 to $299,999 | 343 (45.9%) | 1,706 (55.3%) |
| $300,000 to $499,999 | 336 (45.0%) | 1,240 (40.2%) |
| $500,000 to $749,999 | 9 (1.2%) | 60 (1.9%) |
| $750,000 to $999,999 | 9 (1.2%) | 0 (0.0%) |
| $1,000,000 or more | 6 (0.8%) | 29 (0.9%) |
| Total | 747 (100.0%) | 3,086 (100.0%) |
Household Income by Mortgage Status in White House
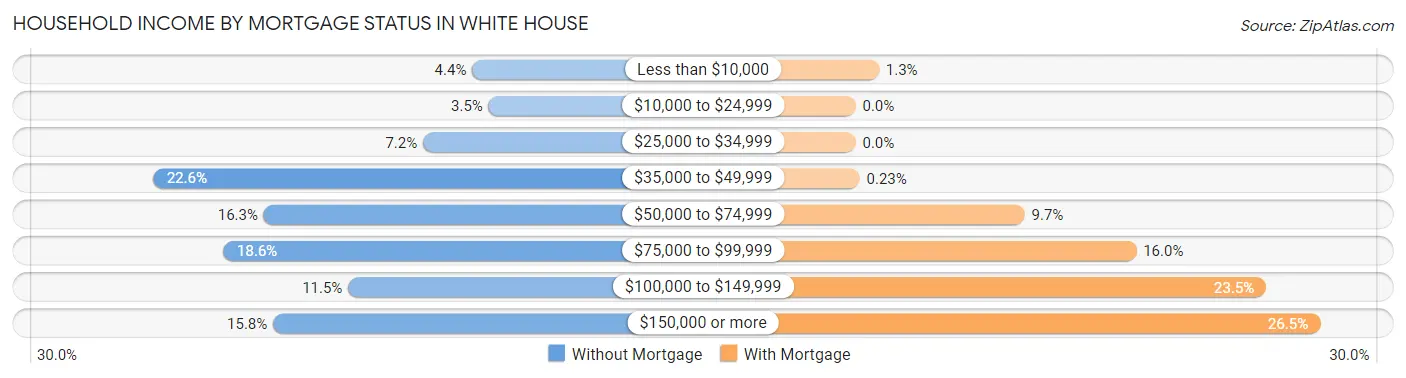
| Household Income | Without Mortgage | With Mortgage |
| Less than $10,000 | 33 (4.4%) | 41 (1.3%) |
| $10,000 to $24,999 | 26 (3.5%) | 0 (0.0%) |
| $25,000 to $34,999 | 54 (7.2%) | 0 (0.0%) |
| $35,000 to $49,999 | 169 (22.6%) | 7 (0.2%) |
| $50,000 to $74,999 | 122 (16.3%) | 298 (9.7%) |
| $75,000 to $99,999 | 139 (18.6%) | 495 (16.0%) |
| $100,000 to $149,999 | 86 (11.5%) | 724 (23.5%) |
| $150,000 or more | 118 (15.8%) | 819 (26.5%) |
| Total | 747 (100.0%) | 3,086 (100.0%) |
Property Value to Household Income Ratio in White House
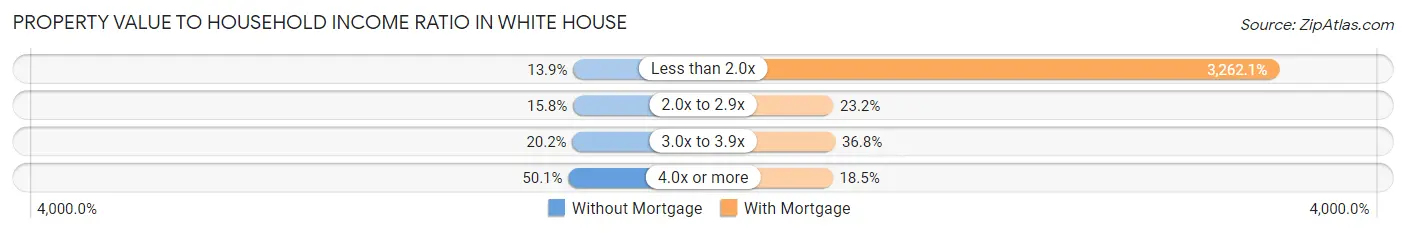
| Value-to-Income Ratio | Without Mortgage | With Mortgage |
| Less than 2.0x | 104 (13.9%) | 100,669 (3,262.1%) |
| 2.0x to 2.9x | 118 (15.8%) | 717 (23.2%) |
| 3.0x to 3.9x | 151 (20.2%) | 1,134 (36.7%) |
| 4.0x or more | 374 (50.1%) | 572 (18.5%) |
| Total | 747 (100.0%) | 3,086 (100.0%) |
Real Estate Taxes by Mortgage Status in White House
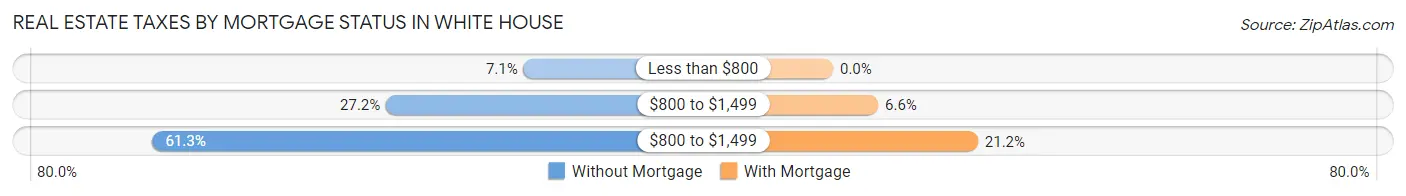
| Property Taxes | Without Mortgage | With Mortgage |
| Less than $800 | 53 (7.1%) | 0 (0.0%) |
| $800 to $1,499 | 203 (27.2%) | 203 (6.6%) |
| $800 to $1,499 | 458 (61.3%) | 653 (21.2%) |
| Total | 747 (100.0%) | 3,086 (100.0%) |
Health & Disability in White House
Health Insurance Coverage by Age in White House
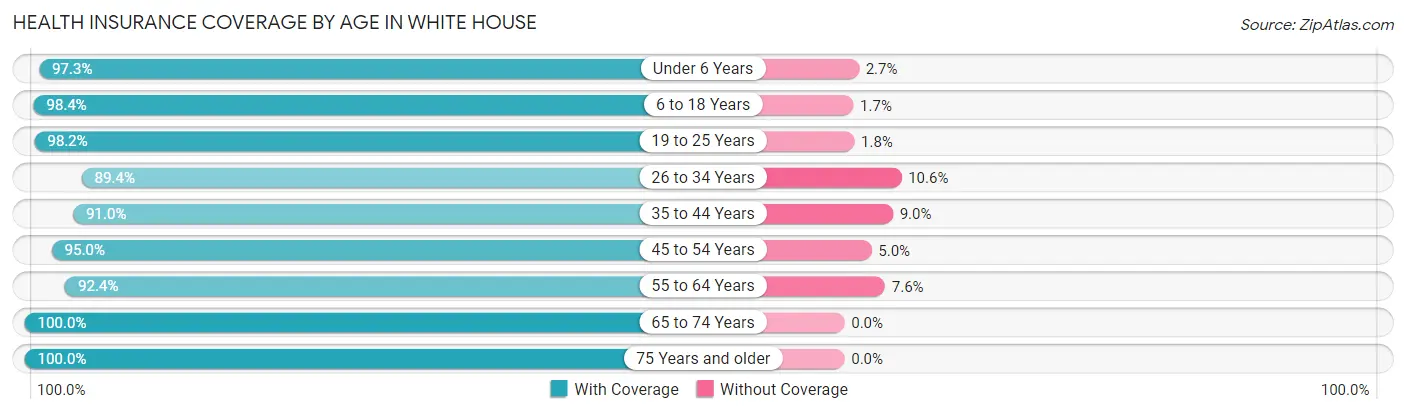
| Age Bracket | With Coverage | Without Coverage |
| Under 6 Years | 760 (97.3%) | 21 (2.7%) |
| 6 to 18 Years | 2,330 (98.4%) | 39 (1.7%) |
| 19 to 25 Years | 1,019 (98.2%) | 19 (1.8%) |
| 26 to 34 Years | 1,843 (89.4%) | 219 (10.6%) |
| 35 to 44 Years | 1,884 (91.0%) | 187 (9.0%) |
| 45 to 54 Years | 1,470 (95.0%) | 78 (5.0%) |
| 55 to 64 Years | 1,455 (92.4%) | 119 (7.6%) |
| 65 to 74 Years | 904 (100.0%) | 0 (0.0%) |
| 75 Years and older | 932 (100.0%) | 0 (0.0%) |
| Total | 12,597 (94.9%) | 682 (5.1%) |
Health Insurance Coverage by Citizenship Status in White House
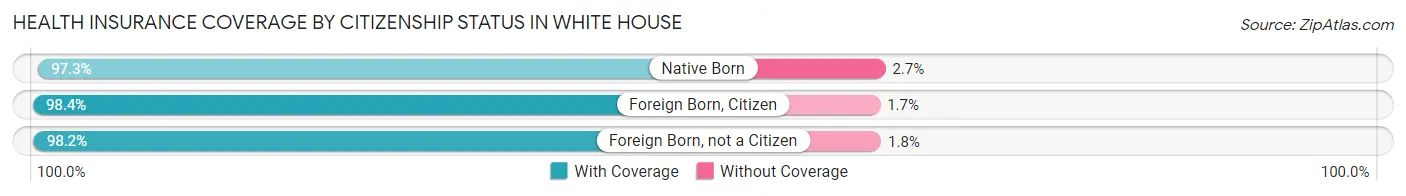
| Citizenship Status | With Coverage | Without Coverage |
| Native Born | 760 (97.3%) | 21 (2.7%) |
| Foreign Born, Citizen | 2,330 (98.4%) | 39 (1.7%) |
| Foreign Born, not a Citizen | 1,019 (98.2%) | 19 (1.8%) |
Health Insurance Coverage by Household Income in White House
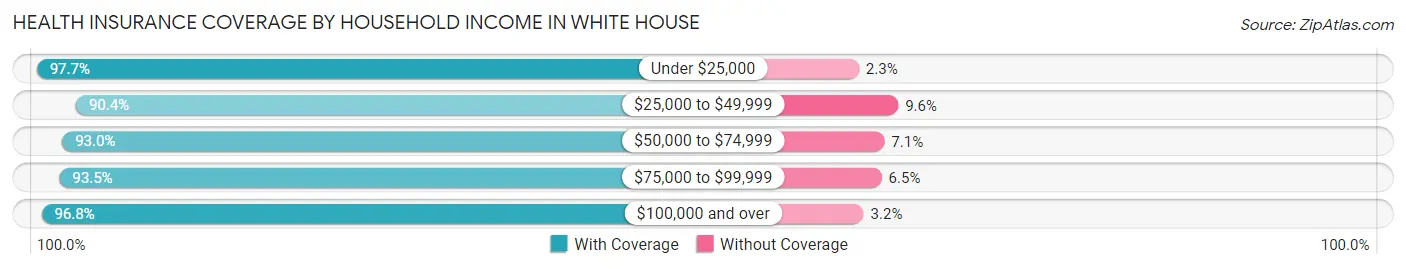
| Household Income | With Coverage | Without Coverage |
| Under $25,000 | 560 (97.7%) | 13 (2.3%) |
| $25,000 to $49,999 | 1,417 (90.4%) | 151 (9.6%) |
| $50,000 to $74,999 | 1,741 (92.9%) | 132 (7.0%) |
| $75,000 to $99,999 | 2,590 (93.5%) | 181 (6.5%) |
| $100,000 and over | 6,289 (96.8%) | 205 (3.2%) |
Public vs Private Health Insurance Coverage by Age in White House
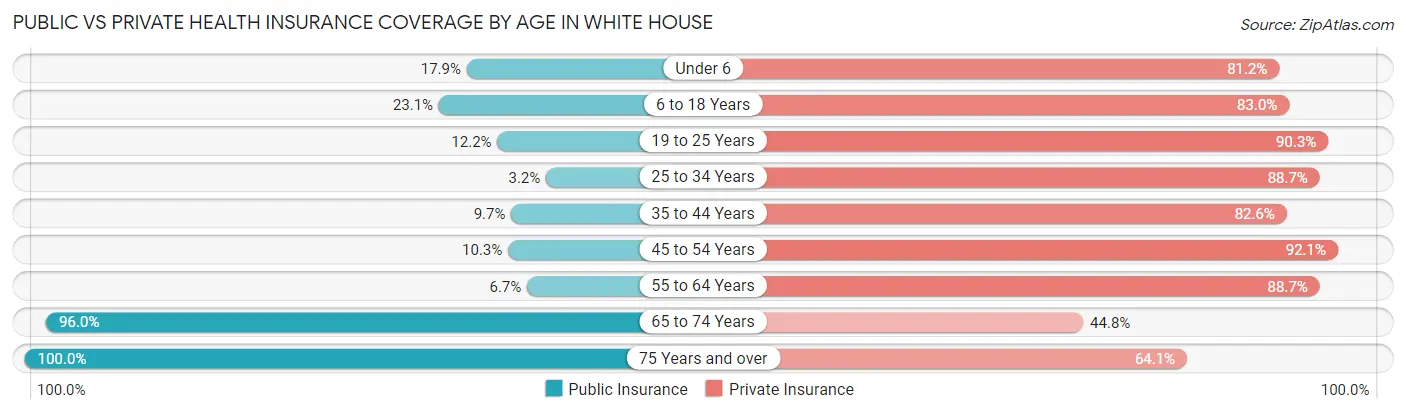
| Age Bracket | Public Insurance | Private Insurance |
| Under 6 | 140 (17.9%) | 634 (81.2%) |
| 6 to 18 Years | 547 (23.1%) | 1,967 (83.0%) |
| 19 to 25 Years | 127 (12.2%) | 937 (90.3%) |
| 25 to 34 Years | 66 (3.2%) | 1,829 (88.7%) |
| 35 to 44 Years | 200 (9.7%) | 1,710 (82.6%) |
| 45 to 54 Years | 159 (10.3%) | 1,425 (92.0%) |
| 55 to 64 Years | 106 (6.7%) | 1,396 (88.7%) |
| 65 to 74 Years | 868 (96.0%) | 405 (44.8%) |
| 75 Years and over | 932 (100.0%) | 597 (64.1%) |
| Total | 3,145 (23.7%) | 10,900 (82.1%) |
Disability Status by Sex by Age in White House
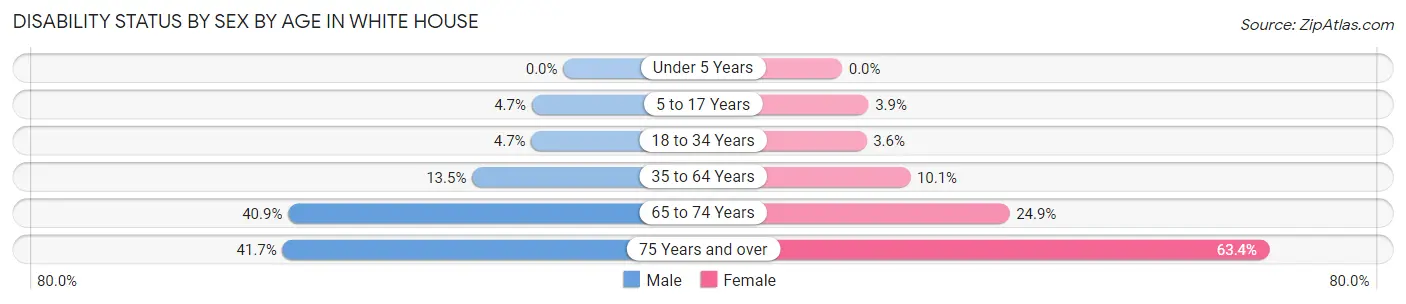
| Age Bracket | Male | Female |
| Under 5 Years | 0 (0.0%) | 0 (0.0%) |
| 5 to 17 Years | 52 (4.7%) | 50 (3.9%) |
| 18 to 34 Years | 77 (4.7%) | 58 (3.6%) |
| 35 to 64 Years | 355 (13.5%) | 260 (10.1%) |
| 65 to 74 Years | 154 (40.8%) | 131 (24.9%) |
| 75 Years and over | 188 (41.7%) | 305 (63.4%) |
Disability Class by Sex by Age in White House
Disability Class: Hearing Difficulty
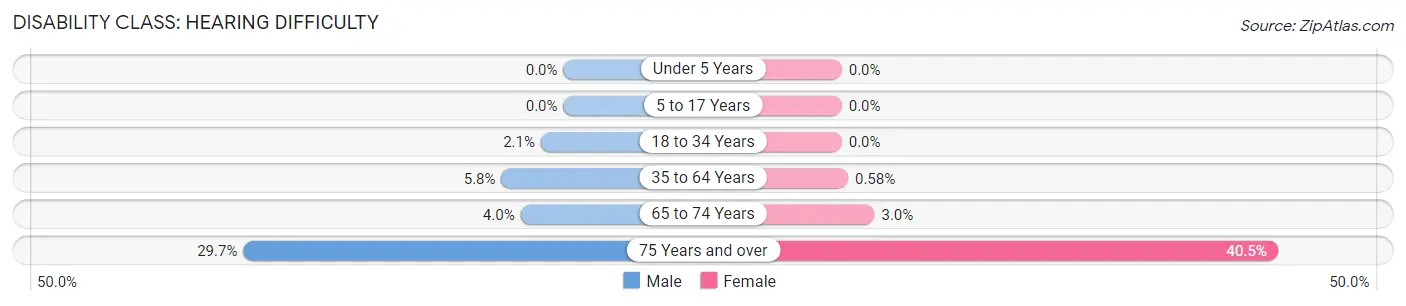
| Age Bracket | Male | Female |
| Under 5 Years | 0 (0.0%) | 0 (0.0%) |
| 5 to 17 Years | 0 (0.0%) | 0 (0.0%) |
| 18 to 34 Years | 34 (2.1%) | 0 (0.0%) |
| 35 to 64 Years | 151 (5.8%) | 15 (0.6%) |
| 65 to 74 Years | 15 (4.0%) | 16 (3.0%) |
| 75 Years and over | 134 (29.7%) | 195 (40.5%) |
Disability Class: Vision Difficulty
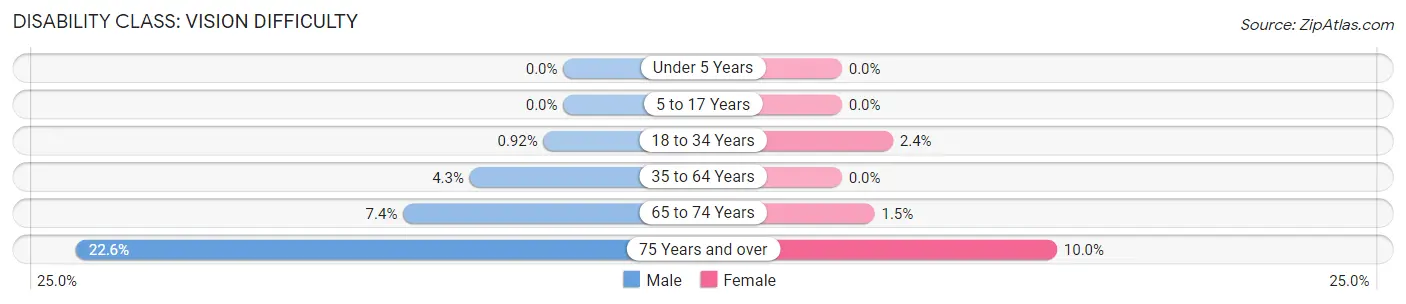
| Age Bracket | Male | Female |
| Under 5 Years | 0 (0.0%) | 0 (0.0%) |
| 5 to 17 Years | 0 (0.0%) | 0 (0.0%) |
| 18 to 34 Years | 15 (0.9%) | 38 (2.4%) |
| 35 to 64 Years | 114 (4.3%) | 0 (0.0%) |
| 65 to 74 Years | 28 (7.4%) | 8 (1.5%) |
| 75 Years and over | 102 (22.6%) | 48 (10.0%) |
Disability Class: Cognitive Difficulty
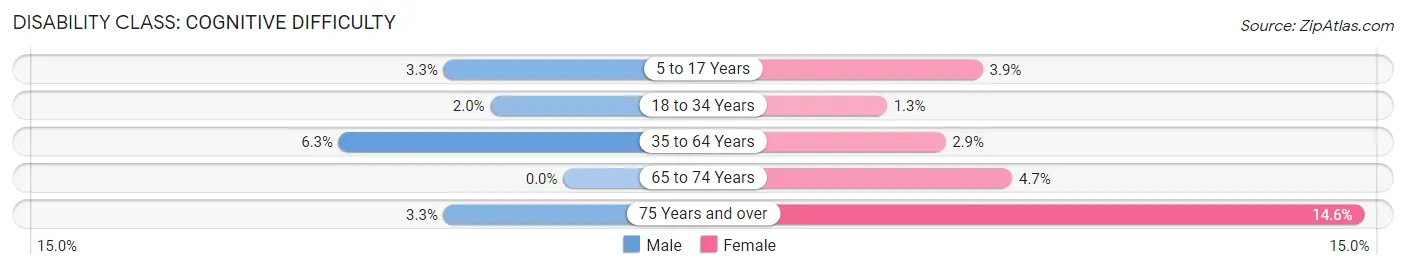
| Age Bracket | Male | Female |
| 5 to 17 Years | 37 (3.3%) | 50 (3.9%) |
| 18 to 34 Years | 33 (2.0%) | 20 (1.3%) |
| 35 to 64 Years | 164 (6.2%) | 74 (2.9%) |
| 65 to 74 Years | 0 (0.0%) | 25 (4.7%) |
| 75 Years and over | 15 (3.3%) | 70 (14.5%) |
Disability Class: Ambulatory Difficulty
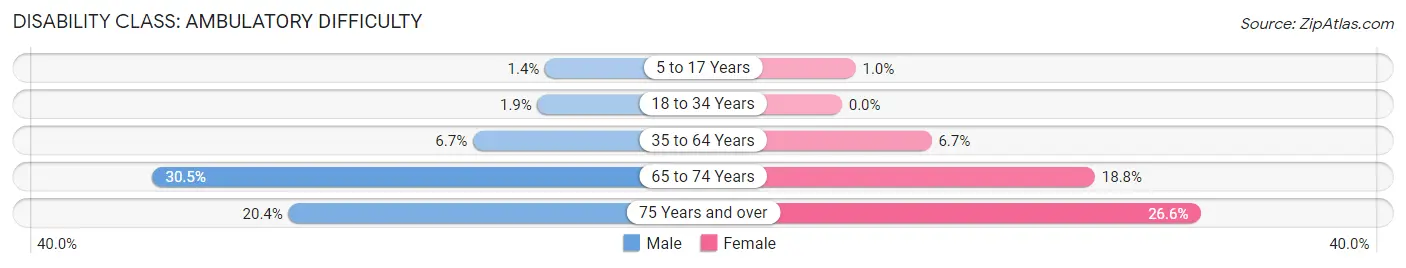
| Age Bracket | Male | Female |
| 5 to 17 Years | 15 (1.3%) | 13 (1.0%) |
| 18 to 34 Years | 31 (1.9%) | 0 (0.0%) |
| 35 to 64 Years | 176 (6.7%) | 171 (6.7%) |
| 65 to 74 Years | 115 (30.5%) | 99 (18.8%) |
| 75 Years and over | 92 (20.4%) | 128 (26.6%) |
Disability Class: Self-Care Difficulty
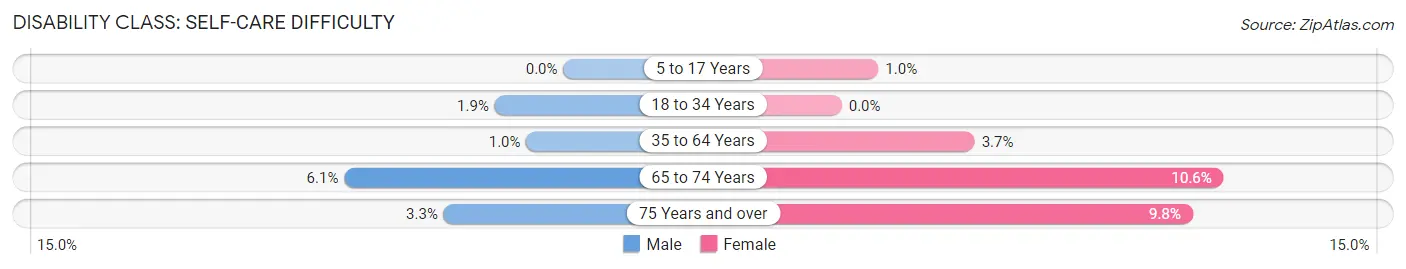
| Age Bracket | Male | Female |
| 5 to 17 Years | 0 (0.0%) | 13 (1.0%) |
| 18 to 34 Years | 31 (1.9%) | 0 (0.0%) |
| 35 to 64 Years | 27 (1.0%) | 95 (3.7%) |
| 65 to 74 Years | 23 (6.1%) | 56 (10.6%) |
| 75 Years and over | 15 (3.3%) | 47 (9.8%) |
Technology Access in White House
Computing Device Access in White House
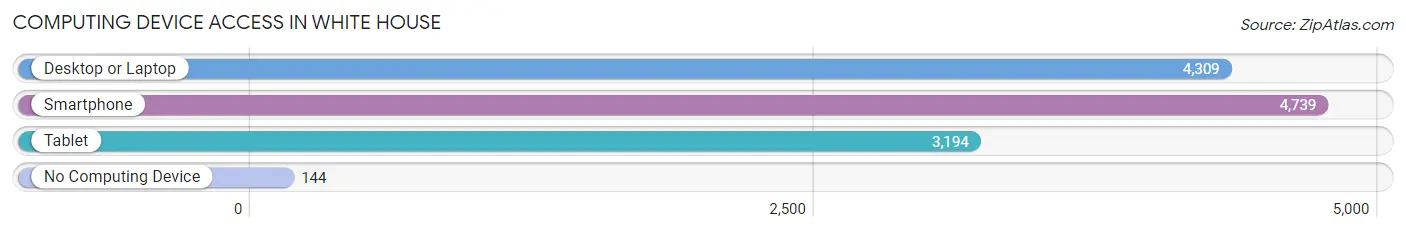
| Device Type | # Households | % Households |
| Desktop or Laptop | 4,309 | 85.5% |
| Smartphone | 4,739 | 94.0% |
| Tablet | 3,194 | 63.4% |
| No Computing Device | 144 | 2.9% |
| Total | 5,041 | 100.0% |
Internet Access in White House
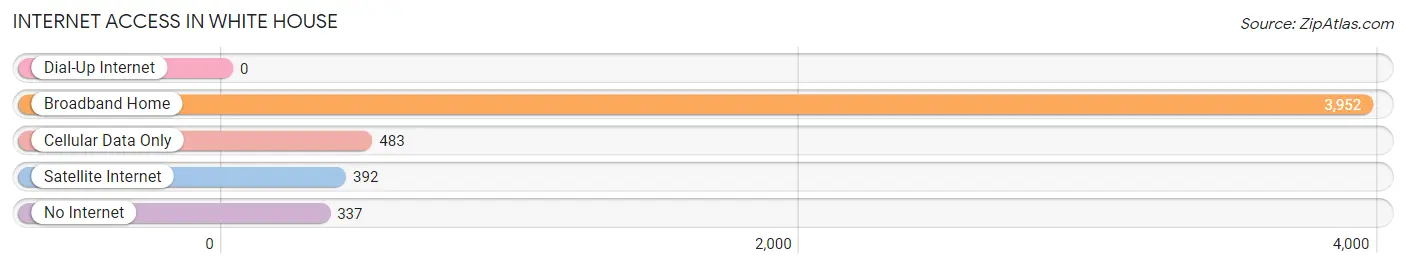
| Internet Type | # Households | % Households |
| Dial-Up Internet | 0 | 0.0% |
| Broadband Home | 3,952 | 78.4% |
| Cellular Data Only | 483 | 9.6% |
| Satellite Internet | 392 | 7.8% |
| No Internet | 337 | 6.7% |
| Total | 5,041 | 100.0% |
White House Summary
White House, Tennessee is a small city located in Robertson County, Tennessee. It is located about 25 miles north of Nashville and is part of the Nashville metropolitan area. The city has a population of approximately 8,000 people and is known for its small-town charm and friendly atmosphere.
History
White House was founded in 1820 by William White, a Revolutionary War veteran. The city was named after the white house that White built on the property. The city was incorporated in 1871 and has remained a small, rural community ever since.
The city was an important stop on the Nashville and Northwestern Railroad, which ran from Nashville to Clarksville. The railroad was a major factor in the growth of the city, as it allowed for the transportation of goods and people.
The city was also home to a number of important industries, including a cotton mill, a flour mill, and a brickyard. These industries helped to fuel the city’s growth and prosperity.
Geography
White House is located in Robertson County, Tennessee. It is situated on the Cumberland River, which is a major tributary of the Tennessee River. The city is located in a hilly area, with the highest point being just over 500 feet above sea level.
The city is located in a humid subtropical climate zone, with hot summers and mild winters. The average annual temperature is around 60 degrees Fahrenheit.
Economy
White House is a small city with a diverse economy. The city is home to a number of small businesses, including restaurants, retail stores, and professional services. The city is also home to a number of manufacturing companies, including a plastics manufacturer and a metal fabrication company.
The city is also home to a number of agricultural businesses, including a dairy farm and a number of vegetable farms. The city is also home to a number of wineries and distilleries.
Demographics
As of the 2010 census, the population of White House was 8,098. The racial makeup of the city was 87.3% White, 8.2% African American, 0.5% Native American, 0.7% Asian, 0.1% Pacific Islander, and 2.2% from other races. Hispanic or Latino of any race were 2.7% of the population.
The median household income in White House was $45,813, and the median family income was $51,919. The per capita income was $20,945. About 11.3% of families and 14.2% of the population were below the poverty line, including 19.2% of those under age 18 and 8.2% of those age 65 or over.
White House is a small city with a rich history and a diverse economy. The city is home to a number of small businesses and agricultural operations, and is a popular destination for tourists and outdoor enthusiasts. The city is known for its friendly atmosphere and small-town charm, and is a great place to live and work.
Common Questions
What is Per Capita Income in White House?
Per Capita income in White House is $41,424.
What is the Median Family Income in White House?
Median Family Income in White House is $94,454.
What is the Median Household income in White House?
Median Household Income in White House is $85,404.
What is Income or Wage Gap in White House?
Income or Wage Gap in White House is 33.9%.
Women in White House earn 66.1 cents for every dollar earned by a man.
What is Inequality or Gini Index in White House?
Inequality or Gini Index in White House is 0.38.
What is the Total Population of White House?
Total Population of White House is 13,305.
What is the Total Male Population of White House?
Total Male Population of White House is 6,609.
What is the Total Female Population of White House?
Total Female Population of White House is 6,696.
What is the Ratio of Males per 100 Females in White House?
There are 98.70 Males per 100 Females in White House.
What is the Ratio of Females per 100 Males in White House?
There are 101.32 Females per 100 Males in White House.
What is the Median Population Age in White House?
Median Population Age in White House is 36.5 Years.
What is the Average Family Size in White House
Average Family Size in White House is 3.0 People.
What is the Average Household Size in White House
Average Household Size in White House is 2.6 People.
How Large is the Labor Force in White House?
There are 7,676 People in the Labor Forcein in White House.
What is the Percentage of People in the Labor Force in White House?
71.8% of People are in the Labor Force in White House.
What is the Unemployment Rate in White House?
Unemployment Rate in White House is 2.5%.