Friendship, TN Map & Demographics
Friendship Map
Friendship Overview
$18,490
PER CAPITA INCOME
$41,932
AVG FAMILY INCOME
$33,036
AVG HOUSEHOLD INCOME
50.5%
WAGE / INCOME GAP [ % ]
49.5¢/ $1
WAGE / INCOME GAP [ $ ]
$13,542
FAMILY INCOME DEFICIT
0.47
INEQUALITY / GINI INDEX
672
TOTAL POPULATION
328
MALE POPULATION
344
FEMALE POPULATION
95.35
MALES / 100 FEMALES
104.88
FEMALES / 100 MALES
32.1
MEDIAN AGE
3.3
AVG FAMILY SIZE
2.3
AVG HOUSEHOLD SIZE
294
LABOR FORCE [ PEOPLE ]
58.0%
PERCENT IN LABOR FORCE
3.7%
UNEMPLOYMENT RATE
Friendship Zip Codes
Friendship Area Codes
Income in Friendship
Income Overview in Friendship
Per Capita Income in Friendship is $18,490, while median incomes of families and households are $41,932 and $33,036 respectively.
| Characteristic | Number | Measure |
| Per Capita Income | 672 | $18,490 |
| Median Family Income | 149 | $41,932 |
| Mean Family Income | 149 | $46,526 |
| Median Household Income | 285 | $33,036 |
| Mean Household Income | 285 | $40,401 |
| Income Deficit | 149 | $13,542 |
| Wage / Income Gap (%) | 672 | 50.52% |
| Wage / Income Gap ($) | 672 | 49.48¢ per $1 |
| Gini / Inequality Index | 672 | 0.47 |
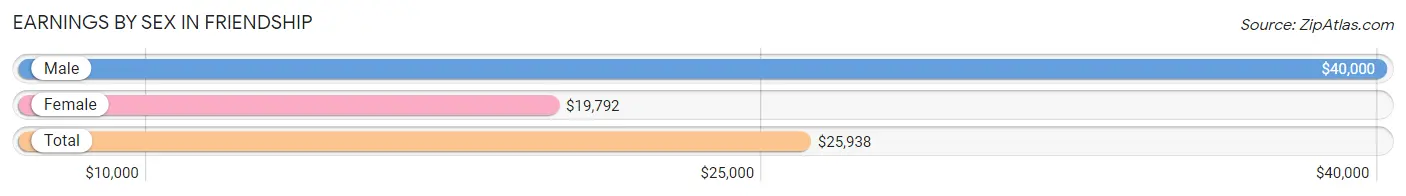
Earnings by Sex in Friendship
Average Earnings in Friendship are $25,938, $40,000 for men and $19,792 for women, a difference of 50.5%.
| Sex | Number | Average Earnings |
| Male | 152 (49.8%) | $40,000 |
| Female | 153 (50.2%) | $19,792 |
| Total | 305 (100.0%) | $25,938 |
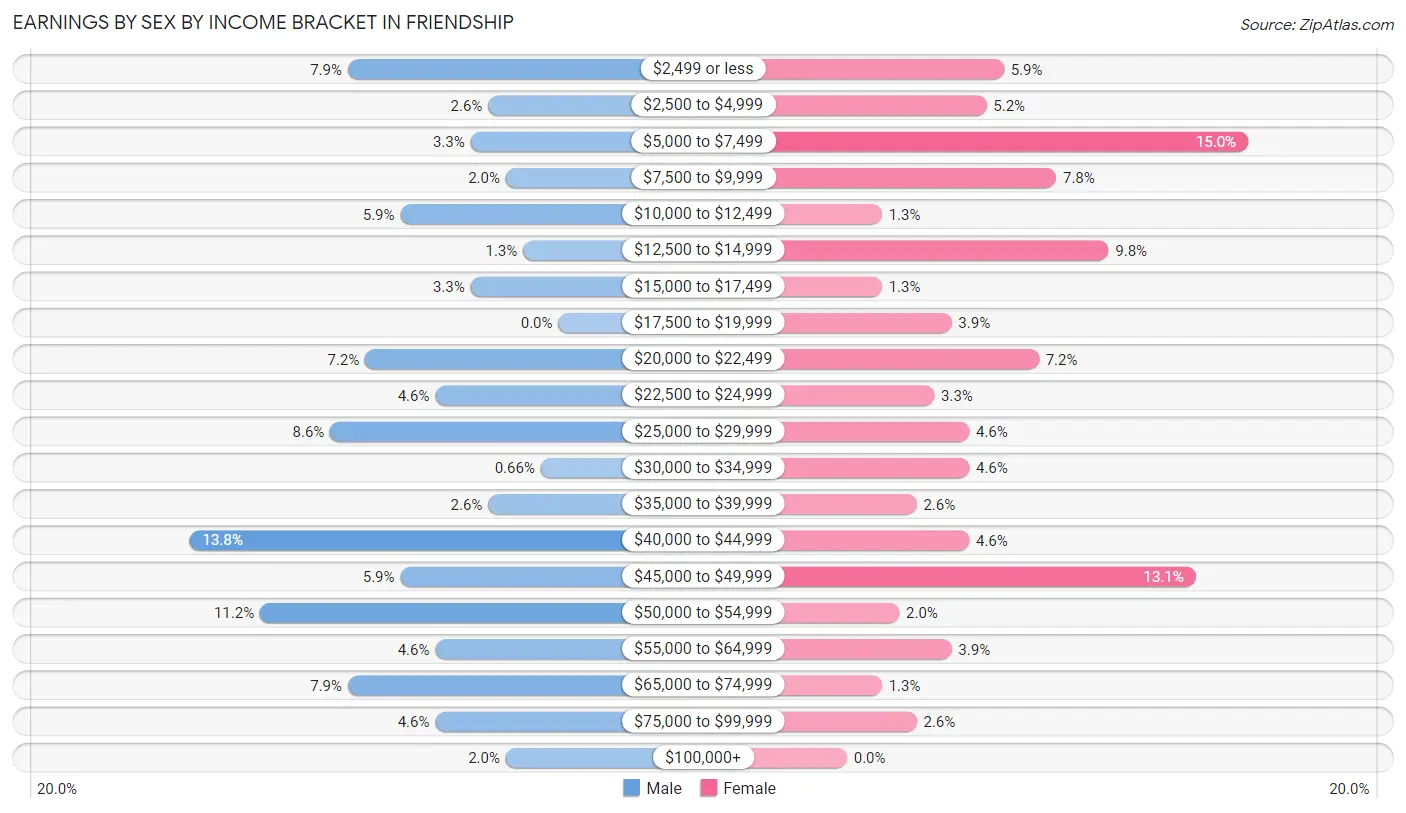
Earnings by Sex by Income Bracket in Friendship
The most common earnings brackets in Friendship are $40,000 to $44,999 for men (21 | 13.8%) and $5,000 to $7,499 for women (23 | 15.0%).
| Income | Male | Female |
| $2,499 or less | 12 (7.9%) | 9 (5.9%) |
| $2,500 to $4,999 | 4 (2.6%) | 8 (5.2%) |
| $5,000 to $7,499 | 5 (3.3%) | 23 (15.0%) |
| $7,500 to $9,999 | 3 (2.0%) | 12 (7.8%) |
| $10,000 to $12,499 | 9 (5.9%) | 2 (1.3%) |
| $12,500 to $14,999 | 2 (1.3%) | 15 (9.8%) |
| $15,000 to $17,499 | 5 (3.3%) | 2 (1.3%) |
| $17,500 to $19,999 | 0 (0.0%) | 6 (3.9%) |
| $20,000 to $22,499 | 11 (7.2%) | 11 (7.2%) |
| $22,500 to $24,999 | 7 (4.6%) | 5 (3.3%) |
| $25,000 to $29,999 | 13 (8.6%) | 7 (4.6%) |
| $30,000 to $34,999 | 1 (0.7%) | 7 (4.6%) |
| $35,000 to $39,999 | 4 (2.6%) | 4 (2.6%) |
| $40,000 to $44,999 | 21 (13.8%) | 7 (4.6%) |
| $45,000 to $49,999 | 9 (5.9%) | 20 (13.1%) |
| $50,000 to $54,999 | 17 (11.2%) | 3 (2.0%) |
| $55,000 to $64,999 | 7 (4.6%) | 6 (3.9%) |
| $65,000 to $74,999 | 12 (7.9%) | 2 (1.3%) |
| $75,000 to $99,999 | 7 (4.6%) | 4 (2.6%) |
| $100,000+ | 3 (2.0%) | 0 (0.0%) |
| Total | 152 (100.0%) | 153 (100.0%) |
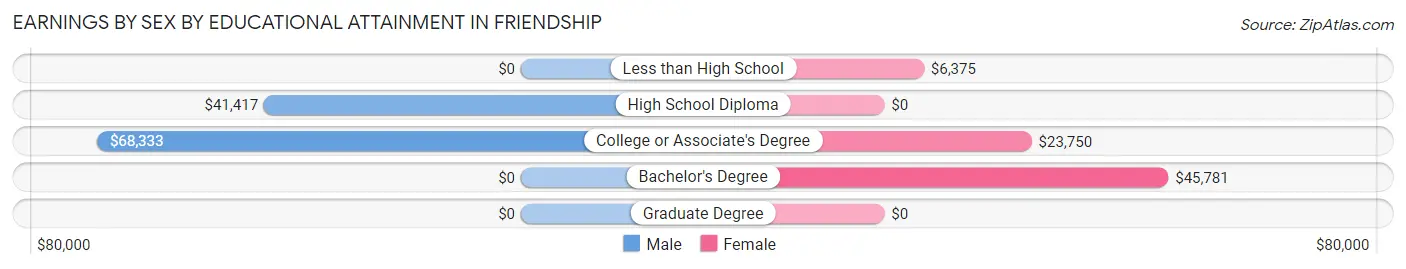
Earnings by Sex by Educational Attainment in Friendship
Average earnings in Friendship are $42,344 for men and $23,000 for women, a difference of 45.7%. Men with an educational attainment of college or associate's degree enjoy the highest average annual earnings of $68,333, while those with high school diploma education earn the least with $41,417. Women with an educational attainment of bachelor's degree earn the most with the average annual earnings of $45,781, while those with less than high school education have the smallest earnings of $6,375.
| Educational Attainment | Male Income | Female Income |
| Less than High School | - | - |
| High School Diploma | $41,417 | $0 |
| College or Associate's Degree | $68,333 | $23,750 |
| Bachelor's Degree | - | - |
| Graduate Degree | - | - |
| Total | $42,344 | $23,000 |
Family Income in Friendship
Family Income Brackets in Friendship
According to the Friendship family income data, there are 34 families falling into the $35,000 to $49,999 income range, which is the most common income bracket and makes up 22.8% of all families.
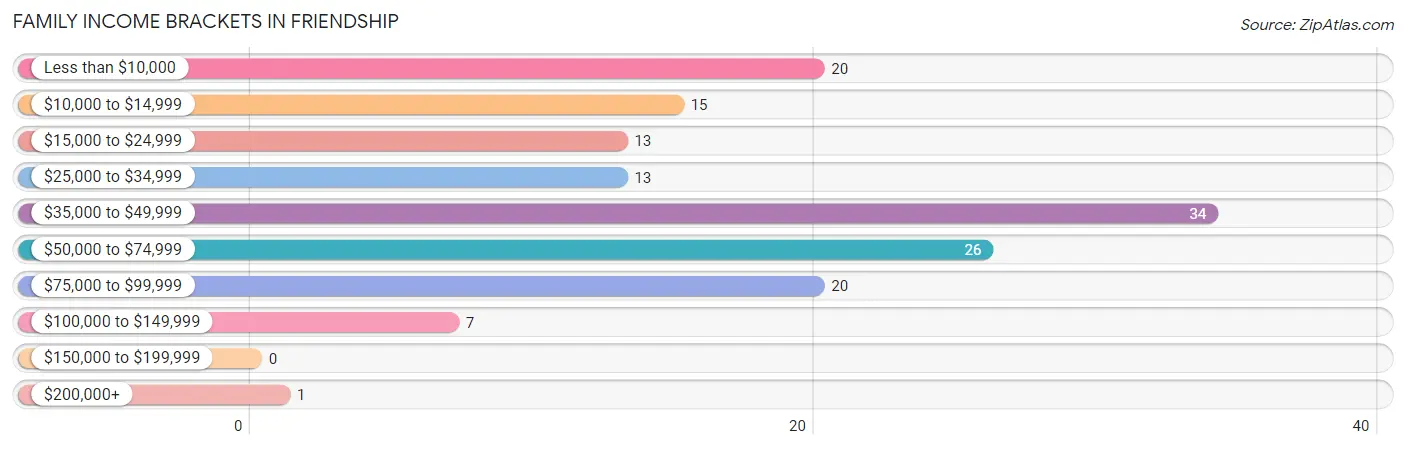
| Income Bracket | # Families | % Families |
| Less than $10,000 | 20 | 13.4% |
| $10,000 to $14,999 | 15 | 10.1% |
| $15,000 to $24,999 | 13 | 8.7% |
| $25,000 to $34,999 | 13 | 8.7% |
| $35,000 to $49,999 | 34 | 22.8% |
| $50,000 to $74,999 | 26 | 17.4% |
| $75,000 to $99,999 | 20 | 13.4% |
| $100,000 to $149,999 | 7 | 4.7% |
| $150,000 to $199,999 | 0 | 0.0% |
| $200,000+ | 1 | 0.7% |
Family Income by Famaliy Size in Friendship
3-person families (35 | 23.5%) account for the highest median family income in Friendship with $62,750 per family, while 2-person families (59 | 39.6%) have the highest median income of $23,820 per family member.
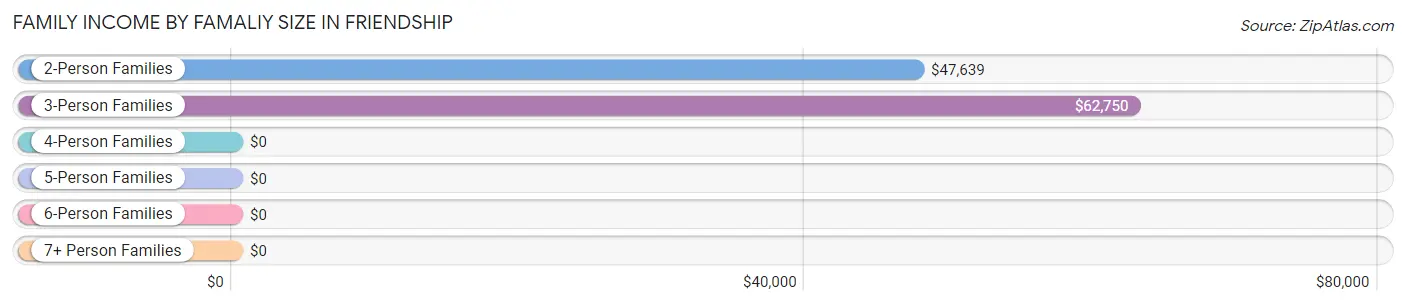
| Income Bracket | # Families | Median Income |
| 2-Person Families | 59 (39.6%) | $47,639 |
| 3-Person Families | 35 (23.5%) | $62,750 |
| 4-Person Families | 26 (17.4%) | $0 |
| 5-Person Families | 18 (12.1%) | $0 |
| 6-Person Families | 0 (0.0%) | $0 |
| 7+ Person Families | 11 (7.4%) | $0 |
| Total | 149 (100.0%) | $41,932 |
Family Income by Number of Earners in Friendship
The median family income in Friendship is $41,932, with families comprising 2 earners (32) having the highest median family income of $71,667, while families with no earners (32) have the lowest median family income of $10,938, accounting for 21.5% and 21.5% of families, respectively.
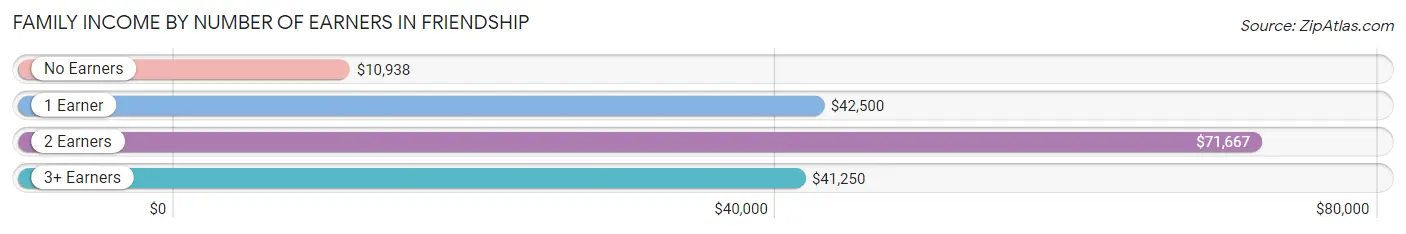
| Number of Earners | # Families | Median Income |
| No Earners | 32 (21.5%) | $10,938 |
| 1 Earner | 68 (45.6%) | $42,500 |
| 2 Earners | 32 (21.5%) | $71,667 |
| 3+ Earners | 17 (11.4%) | $41,250 |
| Total | 149 (100.0%) | $41,932 |
Household Income in Friendship
Household Income Brackets in Friendship
With 56 households falling in the category, the $35,000 to $49,999 income range is the most frequent in Friendship, accounting for 19.7% of all households.
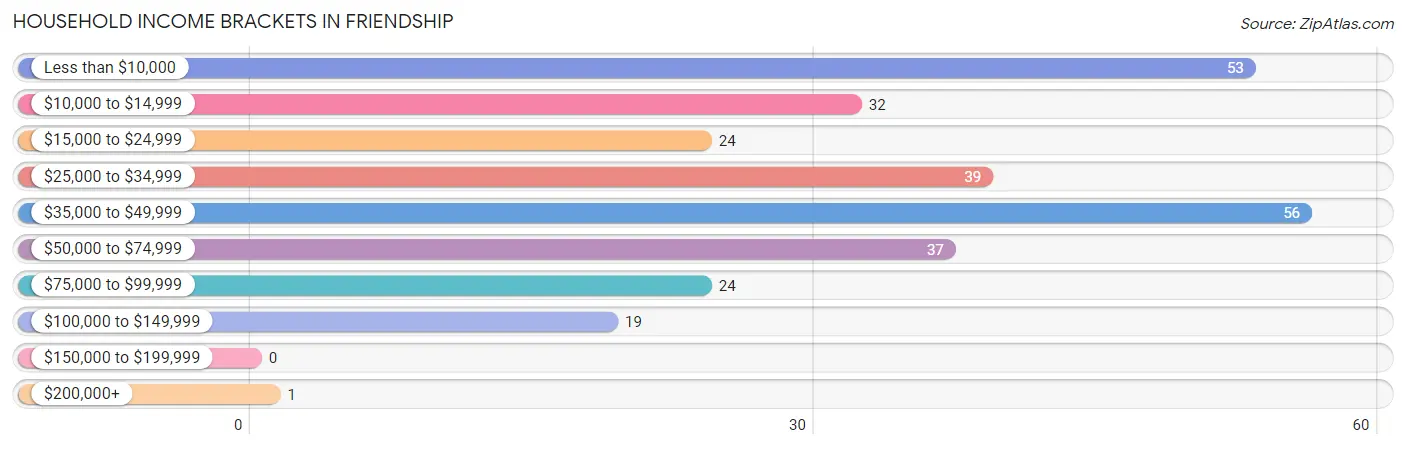
| Income Bracket | # Households | % Households |
| Less than $10,000 | 53 | 18.6% |
| $10,000 to $14,999 | 32 | 11.2% |
| $15,000 to $24,999 | 24 | 8.4% |
| $25,000 to $34,999 | 39 | 13.7% |
| $35,000 to $49,999 | 56 | 19.6% |
| $50,000 to $74,999 | 37 | 13.0% |
| $75,000 to $99,999 | 24 | 8.4% |
| $100,000 to $149,999 | 19 | 6.7% |
| $150,000 to $199,999 | 0 | 0.0% |
| $200,000+ | 1 | 0.4% |
Household Income by Householder Age in Friendship
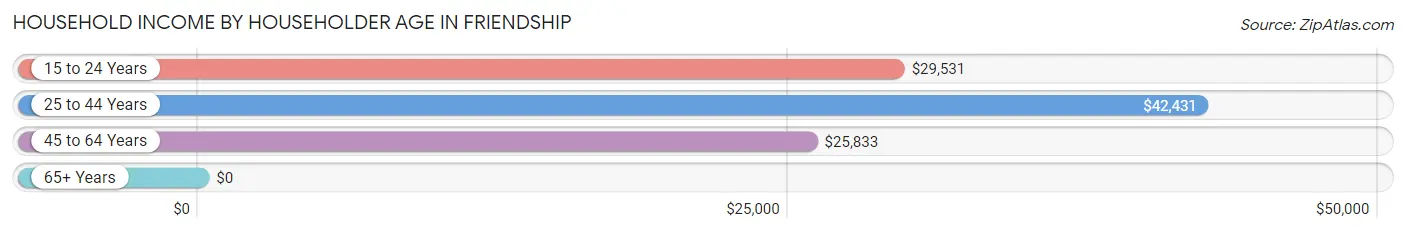
The median household income in Friendship is $33,036, with the highest median household income of $42,431 found in the 25 to 44 years age bracket for the primary householder. A total of 117 households (41.0%) fall into this category. Meanwhile, the 65+ years age bracket for the primary householder has the lowest median household income of $0, with 85 households (29.8%) in this group.
| Income Bracket | # Households | Median Income |
| 15 to 24 Years | 13 (4.6%) | $29,531 |
| 25 to 44 Years | 117 (41.0%) | $42,431 |
| 45 to 64 Years | 70 (24.6%) | $25,833 |
| 65+ Years | 85 (29.8%) | $0 |
| Total | 285 (100.0%) | $33,036 |
Poverty in Friendship
Income Below Poverty by Sex and Age in Friendship
With 32.3% poverty level for males and 52.3% for females among the residents of Friendship, 5 year old males and 16 and 17 year old females are the most vulnerable to poverty, with 2 males (100.0%) and 2 females (100.0%) in their respective age groups living below the poverty level.
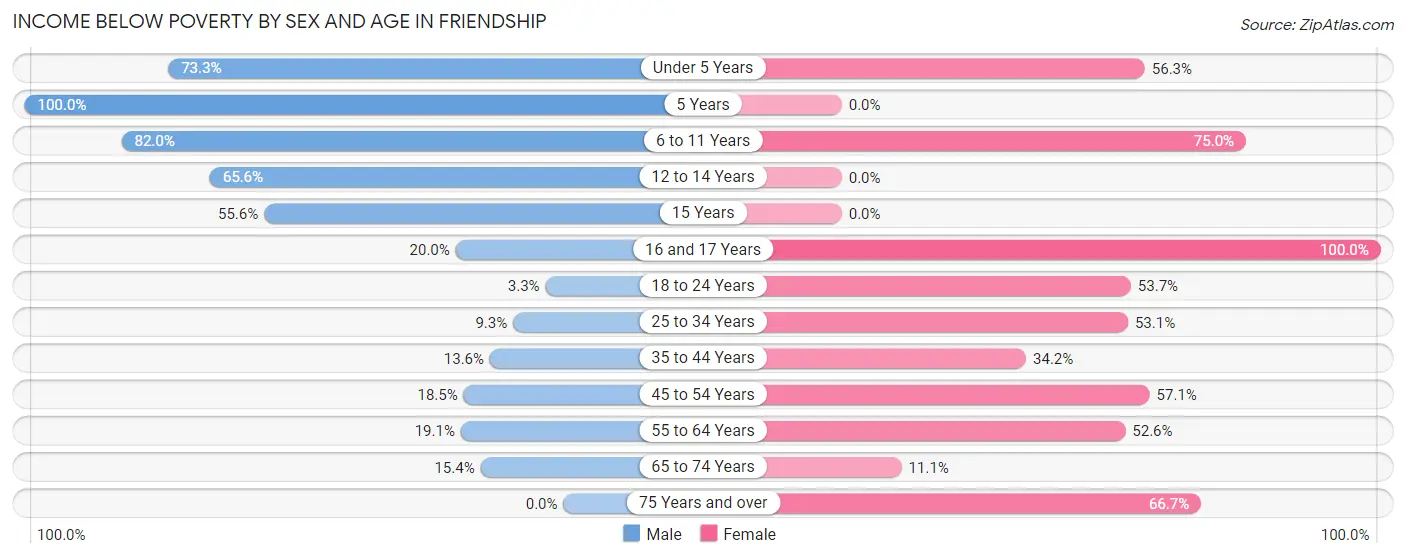
| Age Bracket | Male | Female |
| Under 5 Years | 11 (73.3%) | 9 (56.2%) |
| 5 Years | 2 (100.0%) | 0 (0.0%) |
| 6 to 11 Years | 41 (82.0%) | 24 (75.0%) |
| 12 to 14 Years | 21 (65.6%) | 0 (0.0%) |
| 15 Years | 5 (55.6%) | 0 (0.0%) |
| 16 and 17 Years | 2 (20.0%) | 2 (100.0%) |
| 18 to 24 Years | 1 (3.3%) | 22 (53.7%) |
| 25 to 34 Years | 7 (9.3%) | 34 (53.1%) |
| 35 to 44 Years | 3 (13.6%) | 13 (34.2%) |
| 45 to 54 Years | 5 (18.5%) | 20 (57.1%) |
| 55 to 64 Years | 4 (19.1%) | 20 (52.6%) |
| 65 to 74 Years | 4 (15.4%) | 2 (11.1%) |
| 75 Years and over | 0 (0.0%) | 34 (66.7%) |
| Total | 106 (32.3%) | 180 (52.3%) |
Income Above Poverty by Sex and Age in Friendship
According to the poverty statistics in Friendship, males aged 75 years and over and females aged 12 to 14 years are the age groups that are most secure financially, with 100.0% of males and 100.0% of females in these age groups living above the poverty line.
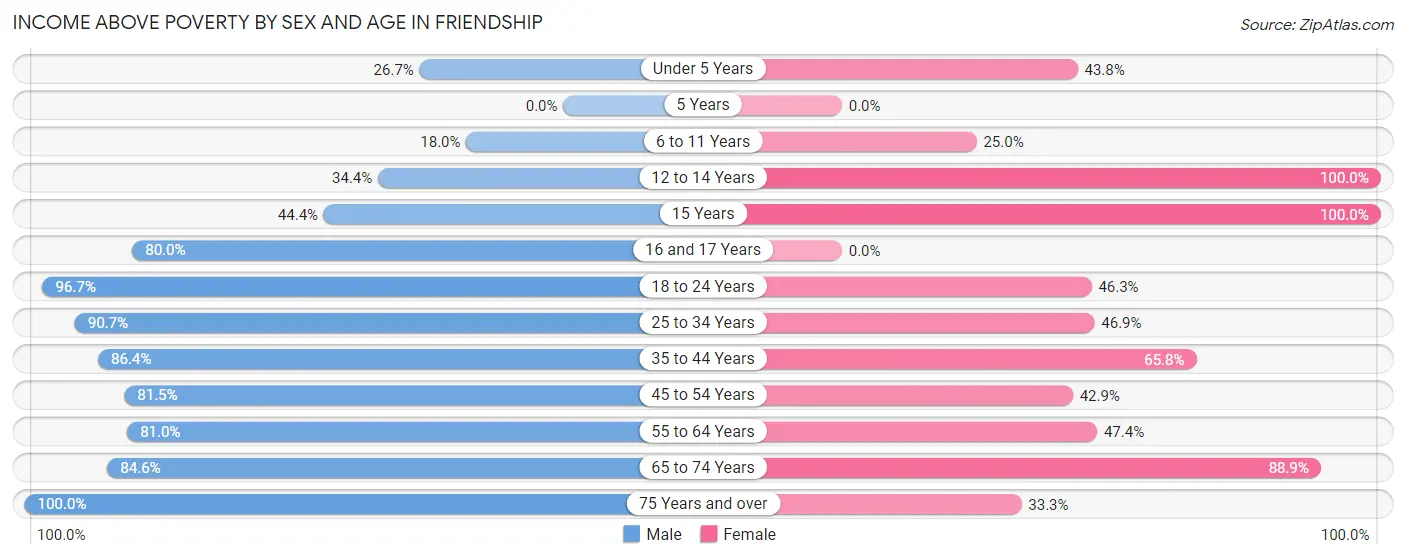
| Age Bracket | Male | Female |
| Under 5 Years | 4 (26.7%) | 7 (43.8%) |
| 5 Years | 0 (0.0%) | 0 (0.0%) |
| 6 to 11 Years | 9 (18.0%) | 8 (25.0%) |
| 12 to 14 Years | 11 (34.4%) | 8 (100.0%) |
| 15 Years | 4 (44.4%) | 1 (100.0%) |
| 16 and 17 Years | 8 (80.0%) | 0 (0.0%) |
| 18 to 24 Years | 29 (96.7%) | 19 (46.3%) |
| 25 to 34 Years | 68 (90.7%) | 30 (46.9%) |
| 35 to 44 Years | 19 (86.4%) | 25 (65.8%) |
| 45 to 54 Years | 22 (81.5%) | 15 (42.9%) |
| 55 to 64 Years | 17 (80.9%) | 18 (47.4%) |
| 65 to 74 Years | 22 (84.6%) | 16 (88.9%) |
| 75 Years and over | 9 (100.0%) | 17 (33.3%) |
| Total | 222 (67.7%) | 164 (47.7%) |
Income Below Poverty Among Married-Couple Families in Friendship
The poverty statistics for married-couple families in Friendship show that 20.0% or 11 of the total 55 families live below the poverty line. Families with 5 or more children have the highest poverty rate of 100.0%, comprising of 7 families. On the other hand, families with no children have the lowest poverty rate of 0.0%, which includes 0 families.
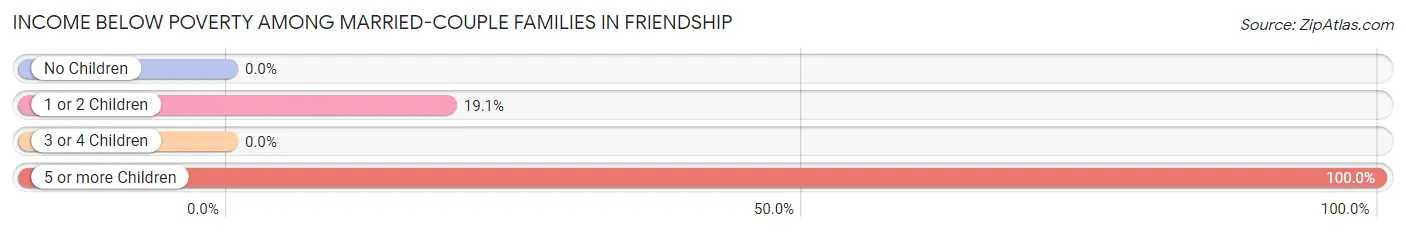
| Children | Above Poverty | Below Poverty |
| No Children | 24 (100.0%) | 0 (0.0%) |
| 1 or 2 Children | 17 (80.9%) | 4 (19.1%) |
| 3 or 4 Children | 3 (100.0%) | 0 (0.0%) |
| 5 or more Children | 0 (0.0%) | 7 (100.0%) |
| Total | 44 (80.0%) | 11 (20.0%) |
Income Below Poverty Among Single-Parent Households in Friendship
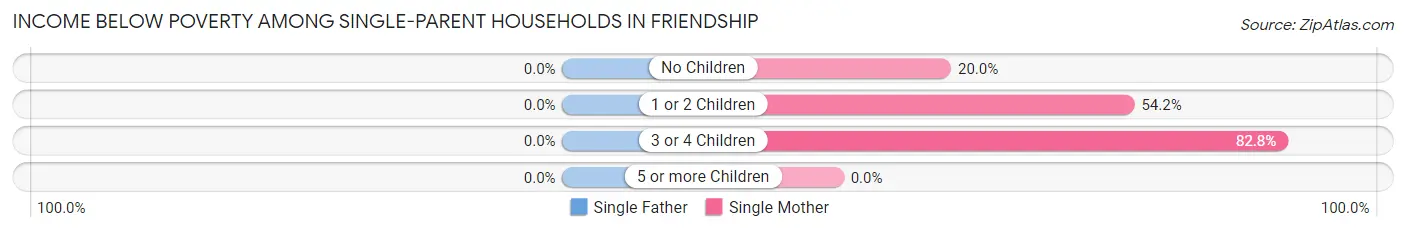
| Children | Single Father | Single Mother |
| No Children | 0 (0.0%) | 5 (20.0%) |
| 1 or 2 Children | 0 (0.0%) | 13 (54.2%) |
| 3 or 4 Children | 0 (0.0%) | 24 (82.8%) |
| 5 or more Children | 0 (0.0%) | 0 (0.0%) |
| Total | 0 (0.0%) | 42 (53.8%) |
Income Below Poverty Among Married-Couple vs Single-Parent Households in Friendship
The poverty data for Friendship shows that 11 of the married-couple family households (20.0%) and 42 of the single-parent households (44.7%) are living below the poverty level. Within the married-couple family households, those with 5 or more children have the highest poverty rate, with 7 households (100.0%) falling below the poverty line. Among the single-parent households, those with 3 or 4 children have the highest poverty rate, with 24 household (82.8%) living below poverty.
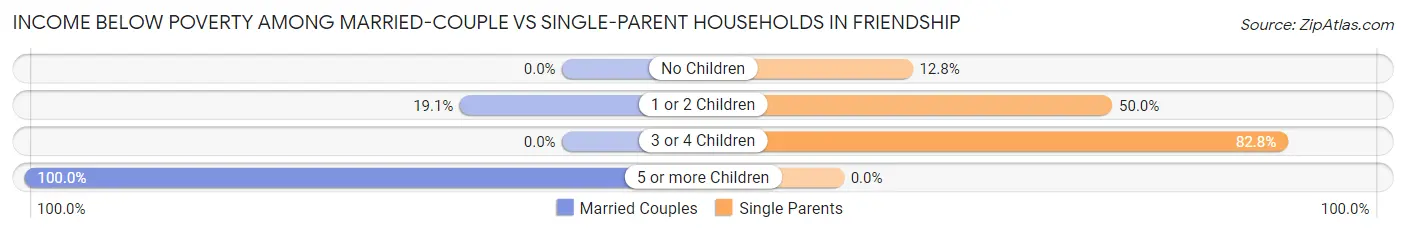
| Children | Married-Couple Families | Single-Parent Households |
| No Children | 0 (0.0%) | 5 (12.8%) |
| 1 or 2 Children | 4 (19.1%) | 13 (50.0%) |
| 3 or 4 Children | 0 (0.0%) | 24 (82.8%) |
| 5 or more Children | 7 (100.0%) | 0 (0.0%) |
| Total | 11 (20.0%) | 42 (44.7%) |
Race in Friendship
The most populous races in Friendship are White / Caucasian (442 | 65.8%), Two or more Races (96 | 14.3%), and Hispanic or Latino (63 | 9.4%).
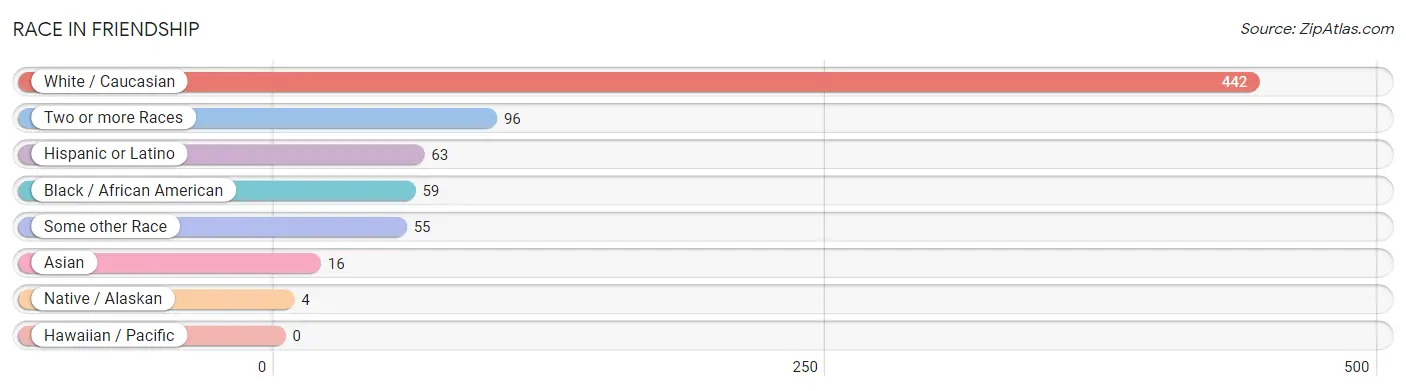
| Race | # Population | % Population |
| Asian | 16 | 2.4% |
| Black / African American | 59 | 8.8% |
| Hawaiian / Pacific | 0 | 0.0% |
| Hispanic or Latino | 63 | 9.4% |
| Native / Alaskan | 4 | 0.6% |
| White / Caucasian | 442 | 65.8% |
| Two or more Races | 96 | 14.3% |
| Some other Race | 55 | 8.2% |
| Total | 672 | 100.0% |
Ancestry in Friendship
The most populous ancestries reported in Friendship are Irish (81 | 12.0%), American (64 | 9.5%), Mexican (55 | 8.2%), Dutch (33 | 4.9%), and English (33 | 4.9%), together accounting for 39.6% of all Friendship residents.
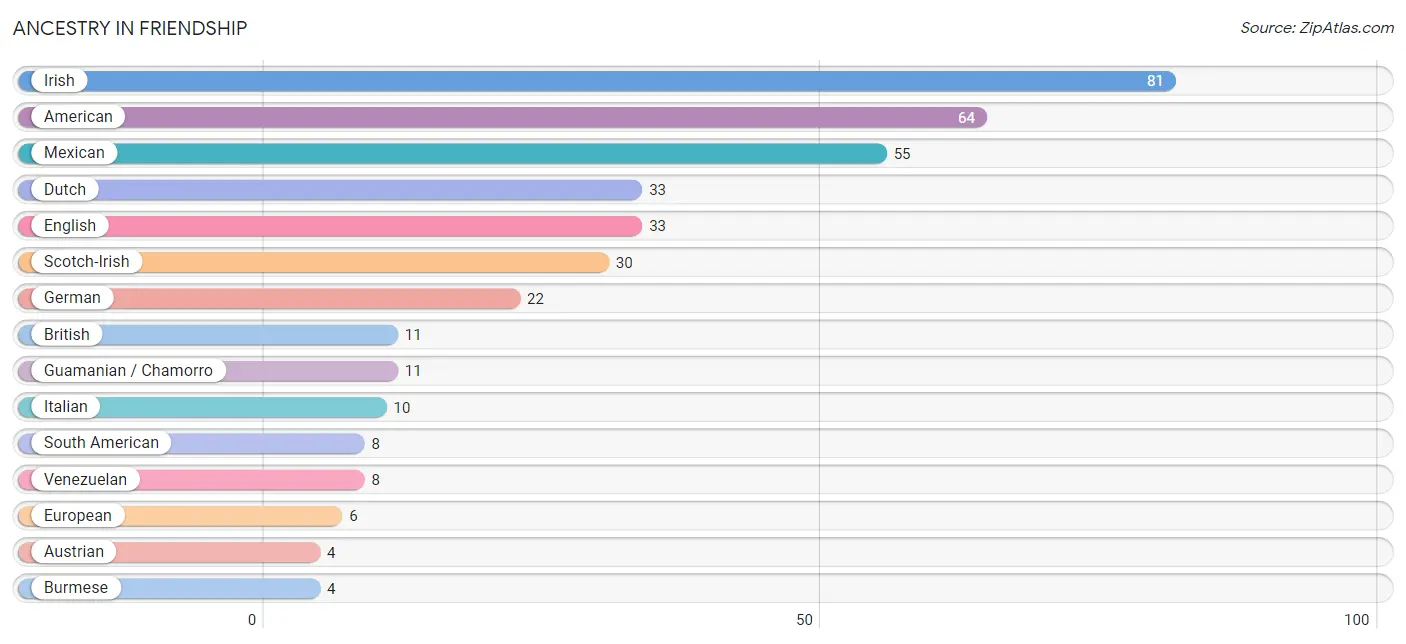
| Ancestry | # Population | % Population |
| American | 64 | 9.5% |
| Austrian | 4 | 0.6% |
| British | 11 | 1.6% |
| Burmese | 4 | 0.6% |
| Cherokee | 3 | 0.4% |
| Danish | 2 | 0.3% |
| Dutch | 33 | 4.9% |
| English | 33 | 4.9% |
| European | 6 | 0.9% |
| German | 22 | 3.3% |
| Guamanian / Chamorro | 11 | 1.6% |
| Indian (Asian) | 4 | 0.6% |
| Irish | 81 | 12.0% |
| Italian | 10 | 1.5% |
| Mexican | 55 | 8.2% |
| Northern European | 3 | 0.4% |
| Scotch-Irish | 30 | 4.5% |
| South American | 8 | 1.2% |
| Thai | 4 | 0.6% |
| Venezuelan | 8 | 1.2% | View All 20 Rows |
Immigrants in Friendship
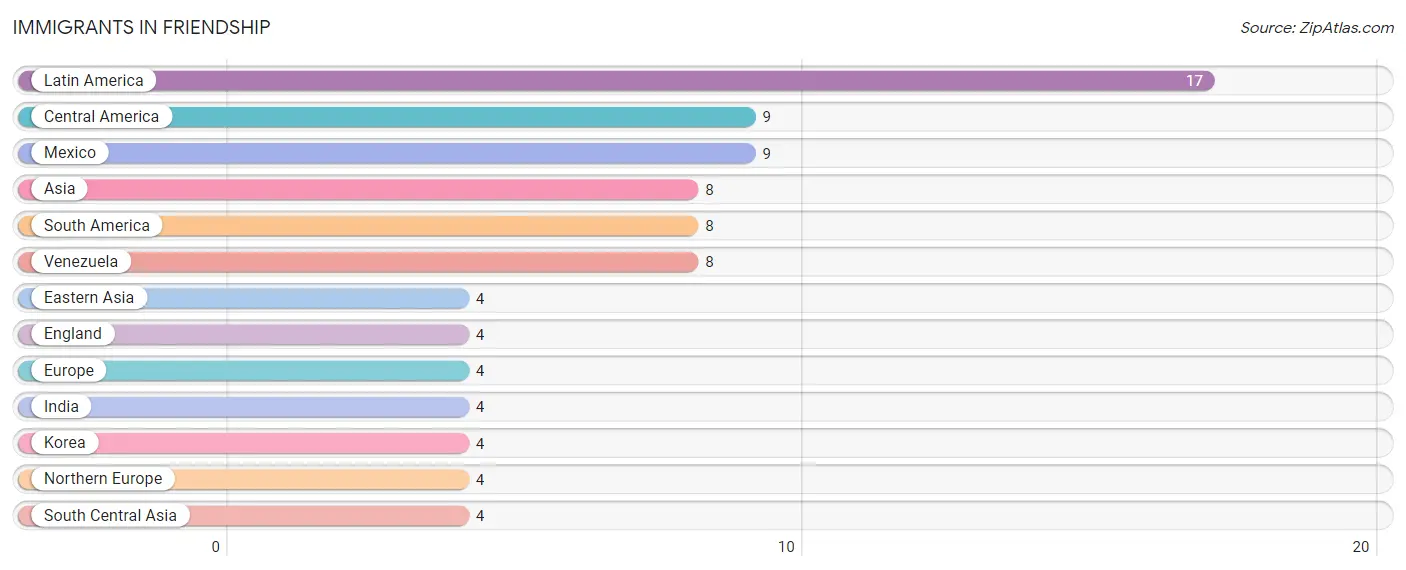
The most numerous immigrant groups reported in Friendship came from Latin America (17 | 2.5%), Central America (9 | 1.3%), Mexico (9 | 1.3%), Asia (8 | 1.2%), and South America (8 | 1.2%), together accounting for 7.6% of all Friendship residents.
| Immigration Origin | # Population | % Population |
| Asia | 8 | 1.2% |
| Central America | 9 | 1.3% |
| Eastern Asia | 4 | 0.6% |
| England | 4 | 0.6% |
| Europe | 4 | 0.6% |
| India | 4 | 0.6% |
| Korea | 4 | 0.6% |
| Latin America | 17 | 2.5% |
| Mexico | 9 | 1.3% |
| Northern Europe | 4 | 0.6% |
| South America | 8 | 1.2% |
| South Central Asia | 4 | 0.6% |
| Venezuela | 8 | 1.2% | View All 13 Rows |
Sex and Age in Friendship
Sex and Age in Friendship
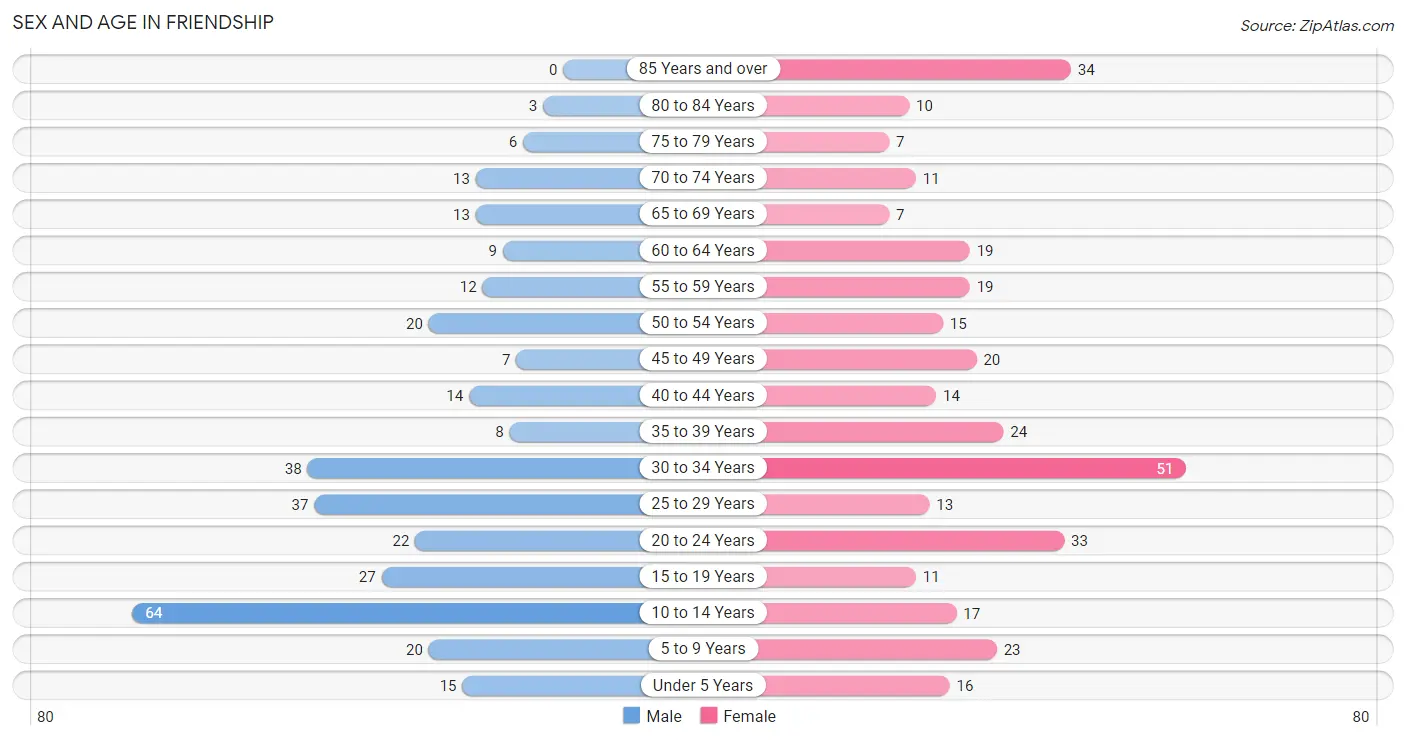
The most populous age groups in Friendship are 10 to 14 Years (64 | 19.5%) for men and 30 to 34 Years (51 | 14.8%) for women.
| Age Bracket | Male | Female |
| Under 5 Years | 15 (4.6%) | 16 (4.6%) |
| 5 to 9 Years | 20 (6.1%) | 23 (6.7%) |
| 10 to 14 Years | 64 (19.5%) | 17 (4.9%) |
| 15 to 19 Years | 27 (8.2%) | 11 (3.2%) |
| 20 to 24 Years | 22 (6.7%) | 33 (9.6%) |
| 25 to 29 Years | 37 (11.3%) | 13 (3.8%) |
| 30 to 34 Years | 38 (11.6%) | 51 (14.8%) |
| 35 to 39 Years | 8 (2.4%) | 24 (7.0%) |
| 40 to 44 Years | 14 (4.3%) | 14 (4.1%) |
| 45 to 49 Years | 7 (2.1%) | 20 (5.8%) |
| 50 to 54 Years | 20 (6.1%) | 15 (4.4%) |
| 55 to 59 Years | 12 (3.7%) | 19 (5.5%) |
| 60 to 64 Years | 9 (2.7%) | 19 (5.5%) |
| 65 to 69 Years | 13 (4.0%) | 7 (2.0%) |
| 70 to 74 Years | 13 (4.0%) | 11 (3.2%) |
| 75 to 79 Years | 6 (1.8%) | 7 (2.0%) |
| 80 to 84 Years | 3 (0.9%) | 10 (2.9%) |
| 85 Years and over | 0 (0.0%) | 34 (9.9%) |
| Total | 328 (100.0%) | 344 (100.0%) |
Families and Households in Friendship
Median Family Size in Friendship
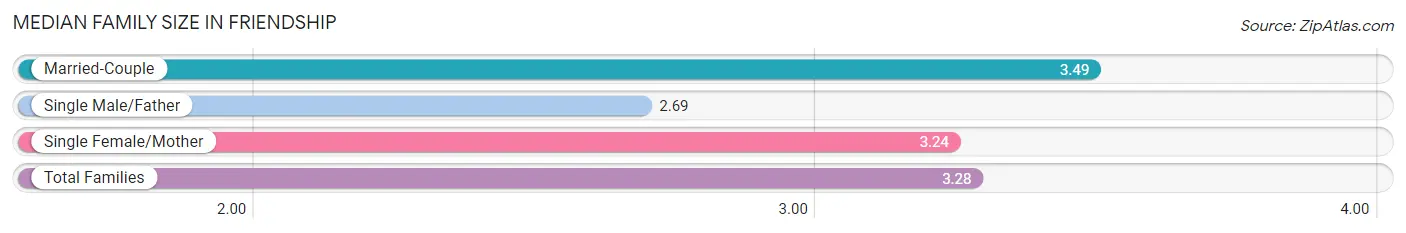
The median family size in Friendship is 3.28 persons per family, with married-couple families (55 | 36.9%) accounting for the largest median family size of 3.49 persons per family. On the other hand, single male/father families (16 | 10.7%) represent the smallest median family size with 2.69 persons per family.
| Family Type | # Families | Family Size |
| Married-Couple | 55 (36.9%) | 3.49 |
| Single Male/Father | 16 (10.7%) | 2.69 |
| Single Female/Mother | 78 (52.3%) | 3.24 |
| Total Families | 149 (100.0%) | 3.28 |
Median Household Size in Friendship
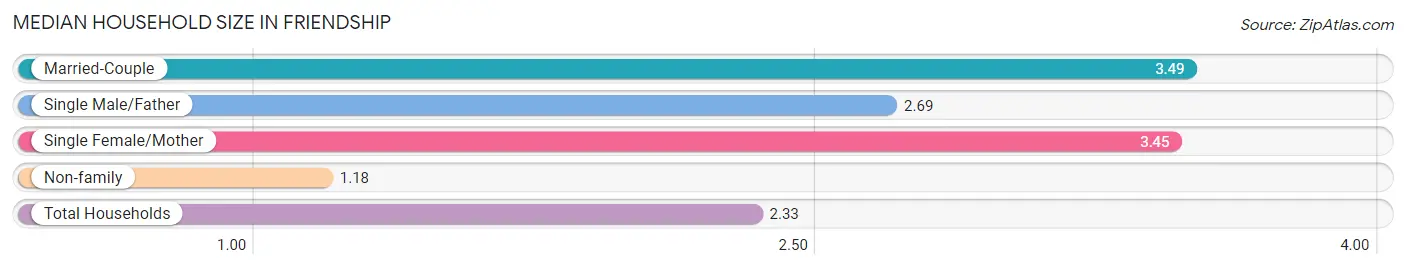
The median household size in Friendship is 2.33 persons per household, with married-couple households (55 | 19.3%) accounting for the largest median household size of 3.49 persons per household. non-family households (136 | 47.7%) represent the smallest median household size with 1.18 persons per household.
| Household Type | # Households | Household Size |
| Married-Couple | 55 (19.3%) | 3.49 |
| Single Male/Father | 16 (5.6%) | 2.69 |
| Single Female/Mother | 78 (27.4%) | 3.45 |
| Non-family | 136 (47.7%) | 1.18 |
| Total Households | 285 (100.0%) | 2.33 |
Household Size by Marriage Status in Friendship
Out of a total of 285 households in Friendship, 149 (52.3%) are family households, while 136 (47.7%) are nonfamily households. The most numerous type of family households are 2-person households, comprising 59, and the most common type of nonfamily households are 1-person households, comprising 112.
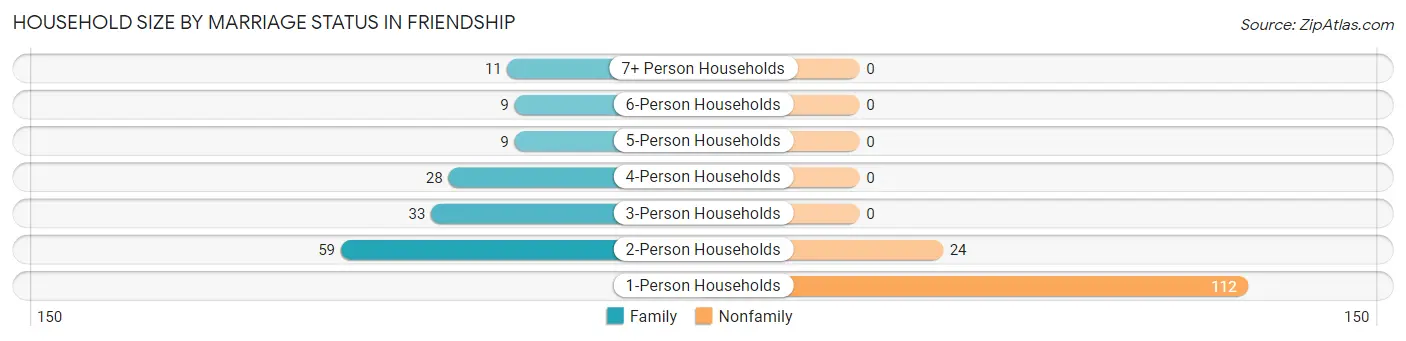
| Household Size | Family Households | Nonfamily Households |
| 1-Person Households | - | 112 (39.3%) |
| 2-Person Households | 59 (20.7%) | 24 (8.4%) |
| 3-Person Households | 33 (11.6%) | 0 (0.0%) |
| 4-Person Households | 28 (9.8%) | 0 (0.0%) |
| 5-Person Households | 9 (3.2%) | 0 (0.0%) |
| 6-Person Households | 9 (3.2%) | 0 (0.0%) |
| 7+ Person Households | 11 (3.9%) | 0 (0.0%) |
| Total | 149 (52.3%) | 136 (47.7%) |
Female Fertility in Friendship
Fertility by Age in Friendship
Average fertility rate in Friendship is 66.0 births per 1,000 women. Women in the age bracket of 20 to 34 years have the highest fertility rate with 113.0 births per 1,000 women. Women in the age bracket of 20 to 34 years acount for 100.0% of all women with births.
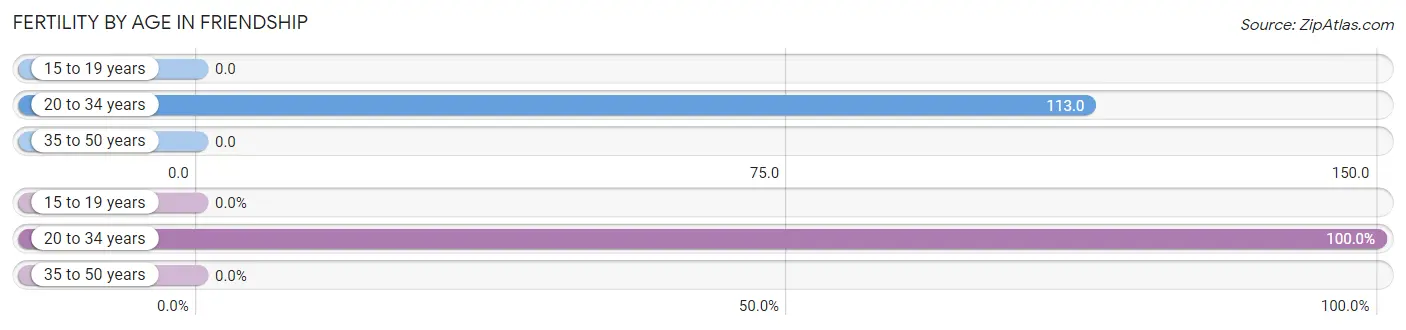
| Age Bracket | Women with Births | Births / 1,000 Women |
| 15 to 19 years | 0 (0.0%) | 0.0 |
| 20 to 34 years | 11 (100.0%) | 113.0 |
| 35 to 50 years | 0 (0.0%) | 0.0 |
| Total | 11 (100.0%) | 66.0 |
Fertility by Age by Marriage Status in Friendship
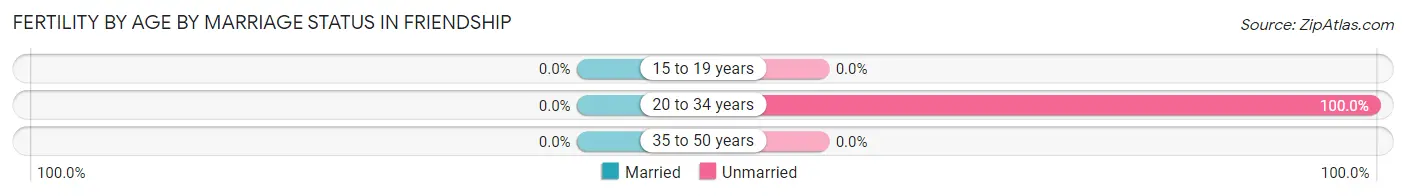
| Age Bracket | Married | Unmarried |
| 15 to 19 years | 0 (0.0%) | 0 (0.0%) |
| 20 to 34 years | 0 (0.0%) | 11 (100.0%) |
| 35 to 50 years | 0 (0.0%) | 0 (0.0%) |
| Total | 0 (0.0%) | 11 (100.0%) |
Fertility by Education in Friendship
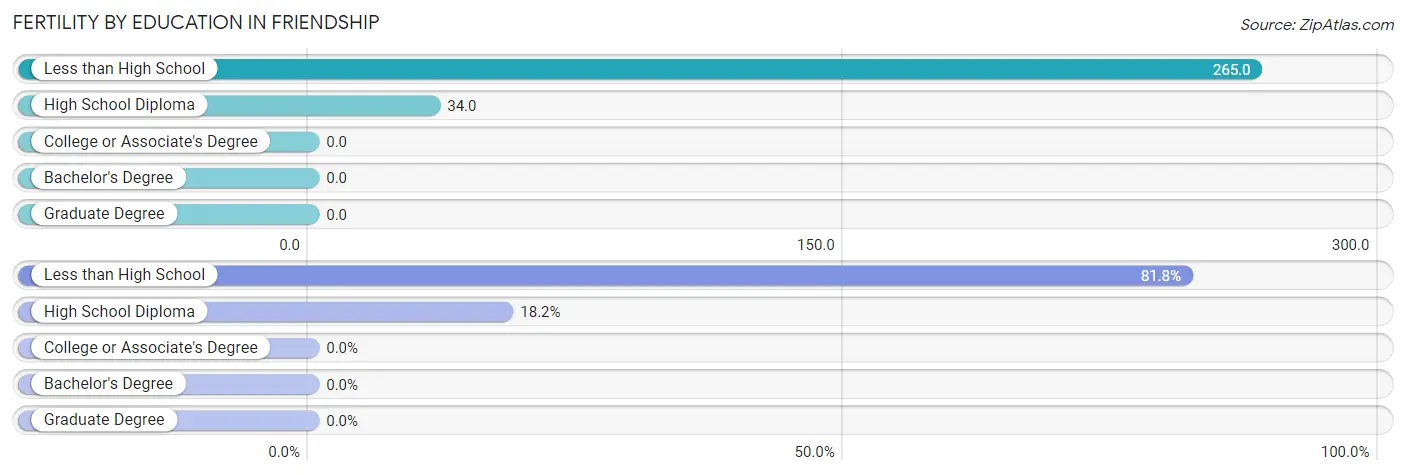
| Educational Attainment | Women with Births | Births / 1,000 Women |
| Less than High School | 9 (81.8%) | 265.0 |
| High School Diploma | 2 (18.2%) | 34.0 |
| College or Associate's Degree | 0 (0.0%) | 0.0 |
| Bachelor's Degree | 0 (0.0%) | 0.0 |
| Graduate Degree | 0 (0.0%) | 0.0 |
| Total | 11 (100.0%) | 66.0 |
Fertility by Education by Marriage Status in Friendship
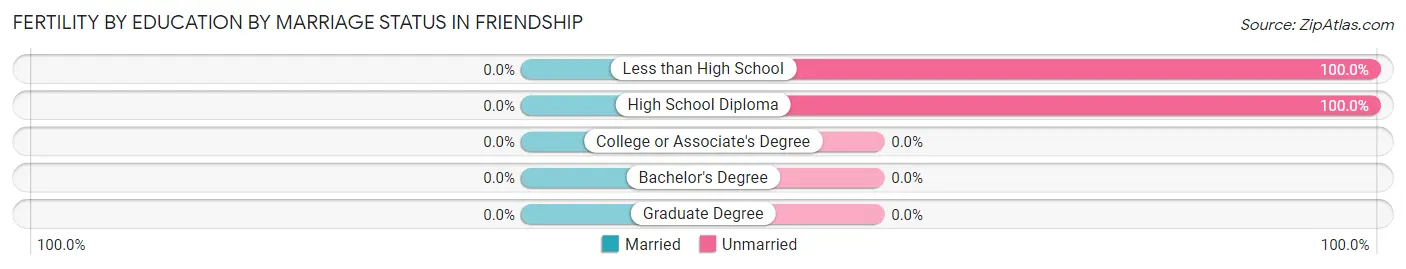
| Educational Attainment | Married | Unmarried |
| Less than High School | 0 (0.0%) | 9 (100.0%) |
| High School Diploma | 0 (0.0%) | 2 (100.0%) |
| College or Associate's Degree | 0 (0.0%) | 0 (0.0%) |
| Bachelor's Degree | 0 (0.0%) | 0 (0.0%) |
| Graduate Degree | 0 (0.0%) | 0 (0.0%) |
| Total | 0 (0.0%) | 11 (100.0%) |
Employment Characteristics in Friendship
Employment by Class of Employer in Friendship
Among the 280 employed individuals in Friendship, private company employees (189 | 67.5%), not-for-profit organizations (31 | 11.1%), and state government employees (28 | 10.0%) make up the most common classes of employment.
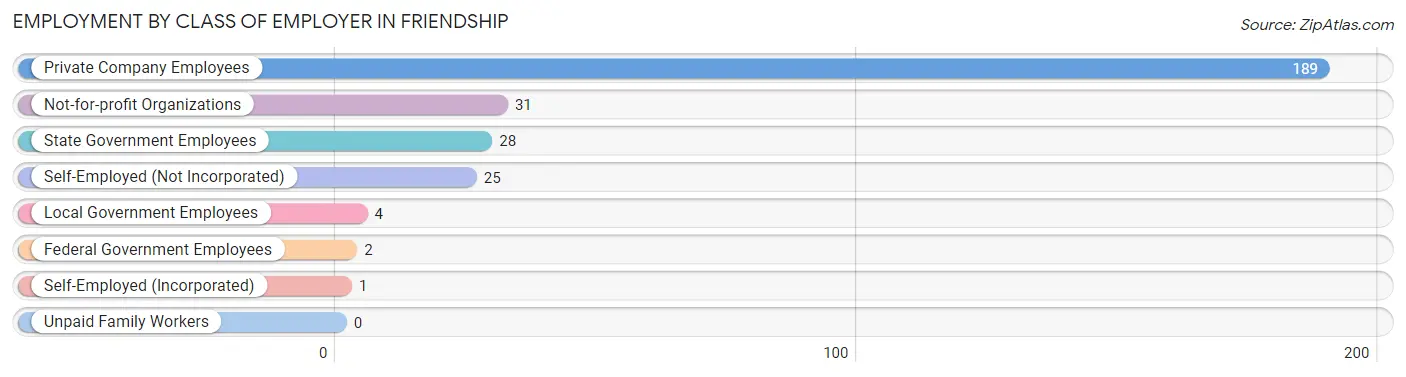
| Employer Class | # Employees | % Employees |
| Private Company Employees | 189 | 67.5% |
| Self-Employed (Incorporated) | 1 | 0.4% |
| Self-Employed (Not Incorporated) | 25 | 8.9% |
| Not-for-profit Organizations | 31 | 11.1% |
| Local Government Employees | 4 | 1.4% |
| State Government Employees | 28 | 10.0% |
| Federal Government Employees | 2 | 0.7% |
| Unpaid Family Workers | 0 | 0.0% |
| Total | 280 | 100.0% |
Employment Status by Age in Friendship
According to the labor force statistics for Friendship, out of the total population over 16 years of age (507), 58.0% or 294 individuals are in the labor force, with 3.7% or 11 of them unemployed. The age group with the highest labor force participation rate is 25 to 29 years, with 94.0% or 47 individuals in the labor force. Within the labor force, the 25 to 29 years age range has the highest percentage of unemployed individuals, with 8.5% or 4 of them being unemployed.
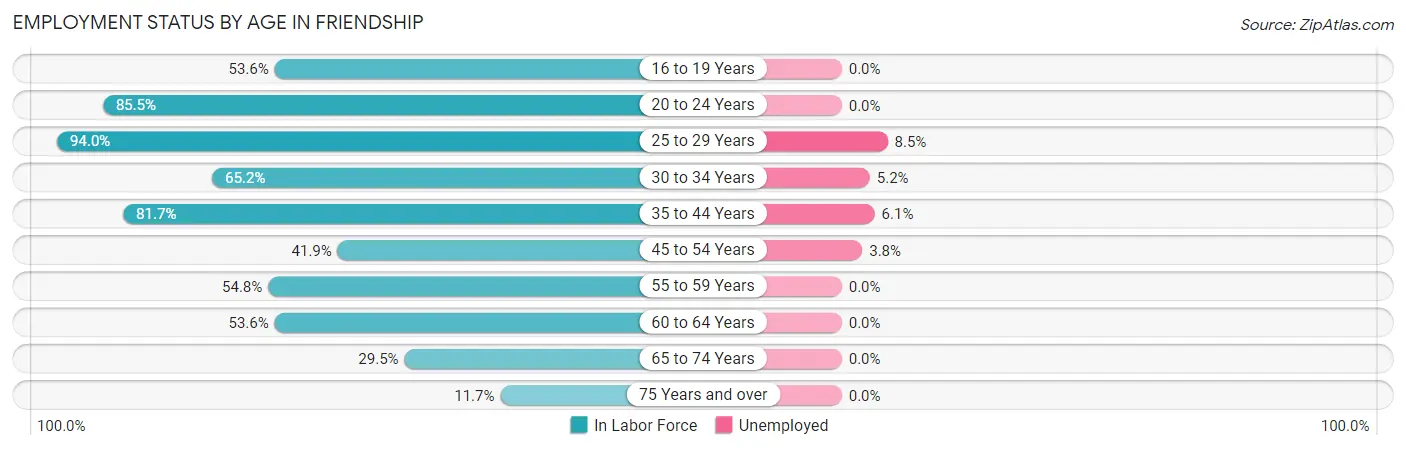
| Age Bracket | In Labor Force | Unemployed |
| 16 to 19 Years | 15 (53.6%) | 0 (0.0%) |
| 20 to 24 Years | 47 (85.5%) | 0 (0.0%) |
| 25 to 29 Years | 47 (94.0%) | 4 (8.5%) |
| 30 to 34 Years | 58 (65.2%) | 3 (5.2%) |
| 35 to 44 Years | 49 (81.7%) | 3 (6.1%) |
| 45 to 54 Years | 26 (41.9%) | 1 (3.8%) |
| 55 to 59 Years | 17 (54.8%) | 0 (0.0%) |
| 60 to 64 Years | 15 (53.6%) | 0 (0.0%) |
| 65 to 74 Years | 13 (29.5%) | 0 (0.0%) |
| 75 Years and over | 7 (11.7%) | 0 (0.0%) |
| Total | 294 (58.0%) | 11 (3.7%) |
Employment Status by Educational Attainment in Friendship
According to labor force statistics for Friendship, 66.3% of individuals (212) out of the total population between 25 and 64 years of age (320) are in the labor force, with 5.2% or 11 of them being unemployed. The group with the highest labor force participation rate are those with the educational attainment of bachelor's degree or higher, with 100.0% or 34 individuals in the labor force. Within the labor force, individuals with high school diploma education have the highest percentage of unemployment, with 6.4% or 7 of them being unemployed.
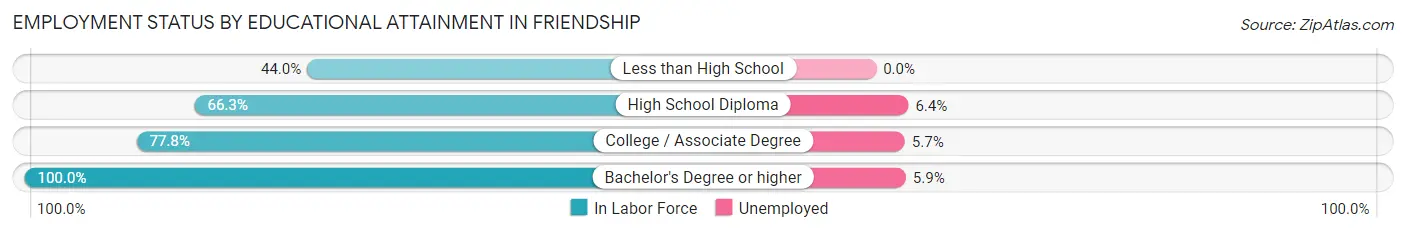
| Educational Attainment | In Labor Force | Unemployed |
| Less than High School | 33 (44.0%) | 0 (0.0%) |
| High School Diploma | 110 (66.3%) | 11 (6.4%) |
| College / Associate Degree | 35 (77.8%) | 3 (5.7%) |
| Bachelor's Degree or higher | 34 (100.0%) | 2 (5.9%) |
| Total | 212 (66.3%) | 17 (5.2%) |
Employment Occupations by Sex in Friendship
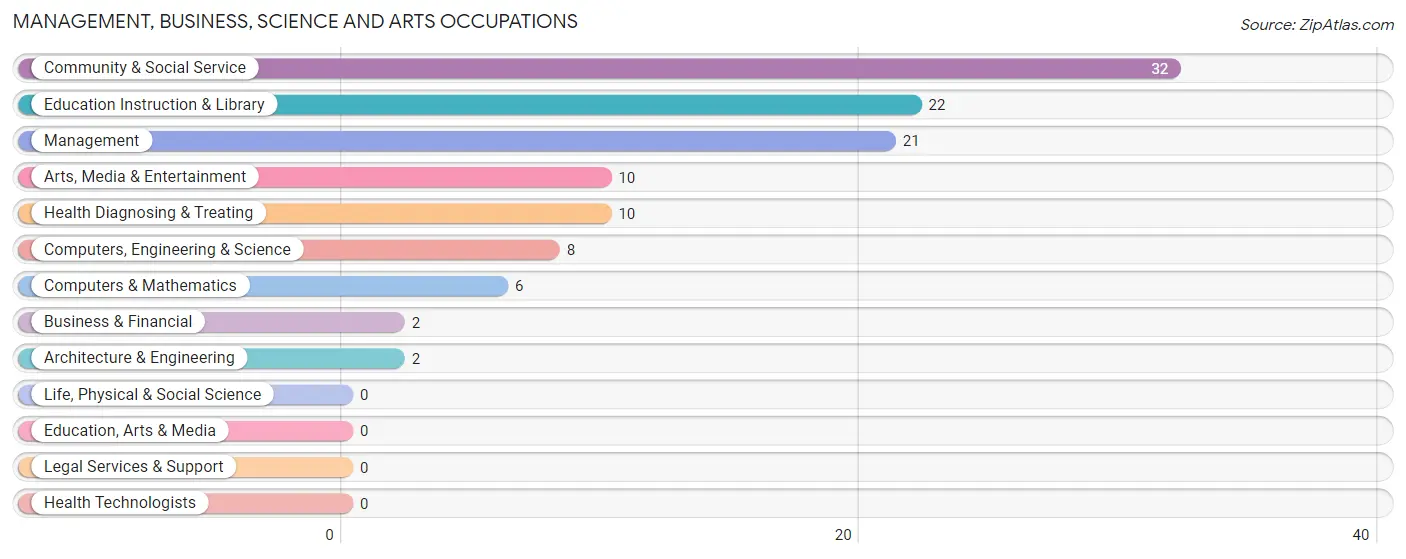
Management, Business, Science and Arts Occupations
The most common Management, Business, Science and Arts occupations in Friendship are Community & Social Service (32 | 11.3%), Education Instruction & Library (22 | 7.8%), Management (21 | 7.4%), Arts, Media & Entertainment (10 | 3.5%), and Health Diagnosing & Treating (10 | 3.5%).
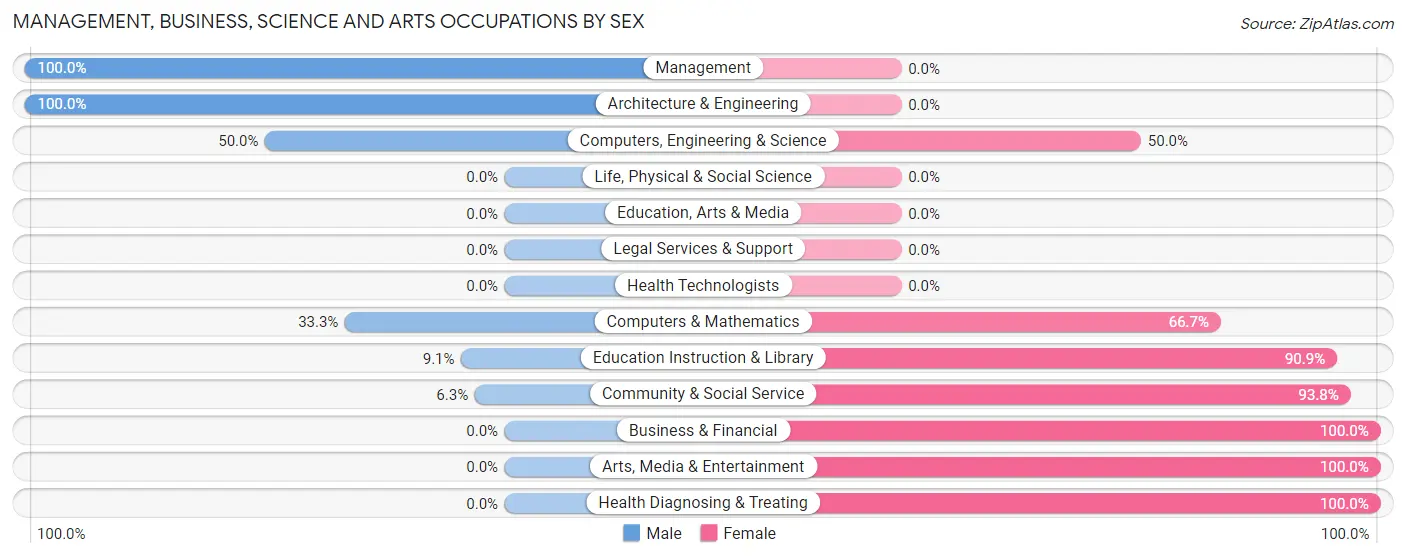
Management, Business, Science and Arts Occupations by Sex
Within the Management, Business, Science and Arts occupations in Friendship, the most male-oriented occupations are Management (100.0%), Architecture & Engineering (100.0%), and Computers, Engineering & Science (50.0%), while the most female-oriented occupations are Business & Financial (100.0%), Arts, Media & Entertainment (100.0%), and Health Diagnosing & Treating (100.0%).
| Occupation | Male | Female |
| Management | 21 (100.0%) | 0 (0.0%) |
| Business & Financial | 0 (0.0%) | 2 (100.0%) |
| Computers, Engineering & Science | 4 (50.0%) | 4 (50.0%) |
| Computers & Mathematics | 2 (33.3%) | 4 (66.7%) |
| Architecture & Engineering | 2 (100.0%) | 0 (0.0%) |
| Life, Physical & Social Science | 0 (0.0%) | 0 (0.0%) |
| Community & Social Service | 2 (6.2%) | 30 (93.8%) |
| Education, Arts & Media | 0 (0.0%) | 0 (0.0%) |
| Legal Services & Support | 0 (0.0%) | 0 (0.0%) |
| Education Instruction & Library | 2 (9.1%) | 20 (90.9%) |
| Arts, Media & Entertainment | 0 (0.0%) | 10 (100.0%) |
| Health Diagnosing & Treating | 0 (0.0%) | 10 (100.0%) |
| Health Technologists | 0 (0.0%) | 0 (0.0%) |
| Total (Category) | 27 (37.0%) | 46 (63.0%) |
| Total (Overall) | 137 (48.4%) | 146 (51.6%) |
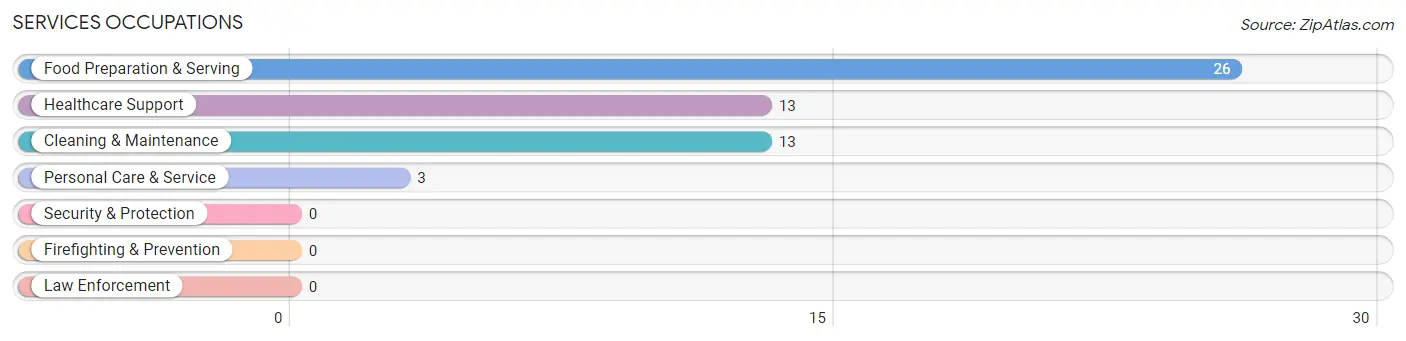
Services Occupations
The most common Services occupations in Friendship are Food Preparation & Serving (26 | 9.2%), Healthcare Support (13 | 4.6%), Cleaning & Maintenance (13 | 4.6%), and Personal Care & Service (3 | 1.1%).
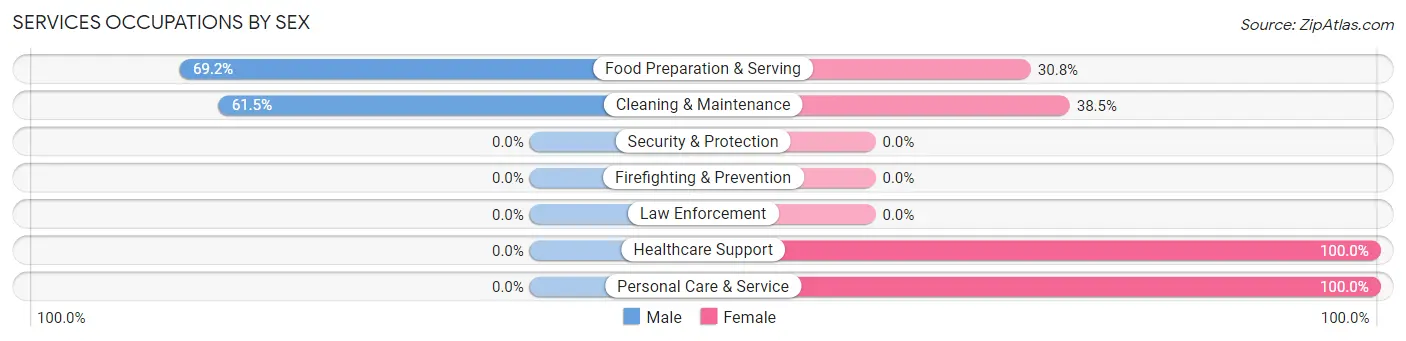
Services Occupations by Sex
Within the Services occupations in Friendship, the most male-oriented occupations are Food Preparation & Serving (69.2%), and Cleaning & Maintenance (61.5%), while the most female-oriented occupations are Healthcare Support (100.0%), Personal Care & Service (100.0%), and Cleaning & Maintenance (38.5%).
| Occupation | Male | Female |
| Healthcare Support | 0 (0.0%) | 13 (100.0%) |
| Security & Protection | 0 (0.0%) | 0 (0.0%) |
| Firefighting & Prevention | 0 (0.0%) | 0 (0.0%) |
| Law Enforcement | 0 (0.0%) | 0 (0.0%) |
| Food Preparation & Serving | 18 (69.2%) | 8 (30.8%) |
| Cleaning & Maintenance | 8 (61.5%) | 5 (38.5%) |
| Personal Care & Service | 0 (0.0%) | 3 (100.0%) |
| Total (Category) | 26 (47.3%) | 29 (52.7%) |
| Total (Overall) | 137 (48.4%) | 146 (51.6%) |
Sales and Office Occupations
The most common Sales and Office occupations in Friendship are Sales & Related (46 | 16.3%), and Office & Administration (16 | 5.7%).
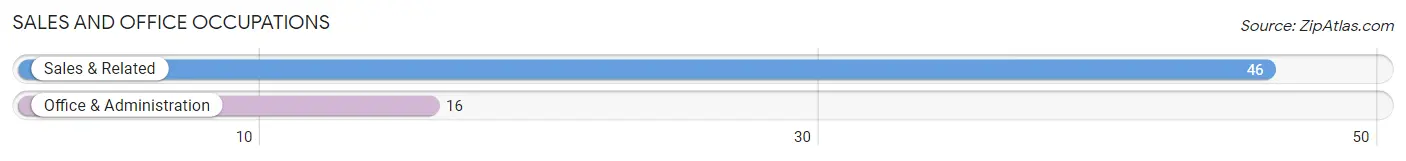
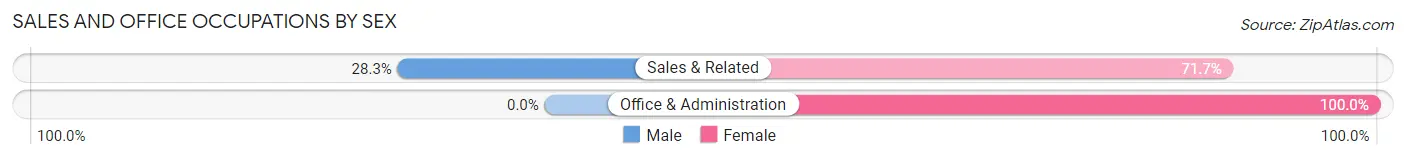
Sales and Office Occupations by Sex
| Occupation | Male | Female |
| Sales & Related | 13 (28.3%) | 33 (71.7%) |
| Office & Administration | 0 (0.0%) | 16 (100.0%) |
| Total (Category) | 13 (21.0%) | 49 (79.0%) |
| Total (Overall) | 137 (48.4%) | 146 (51.6%) |
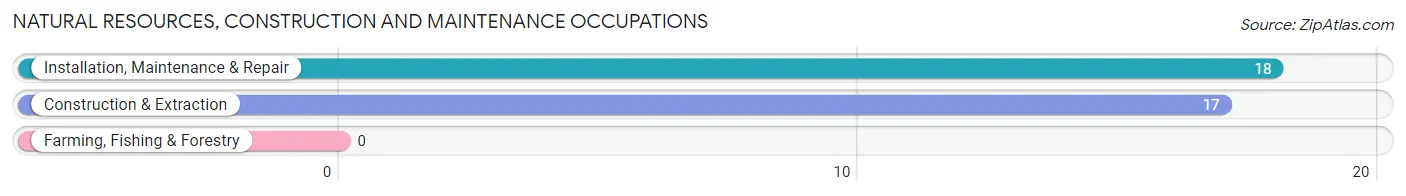
Natural Resources, Construction and Maintenance Occupations
The most common Natural Resources, Construction and Maintenance occupations in Friendship are Installation, Maintenance & Repair (18 | 6.4%), and Construction & Extraction (17 | 6.0%).
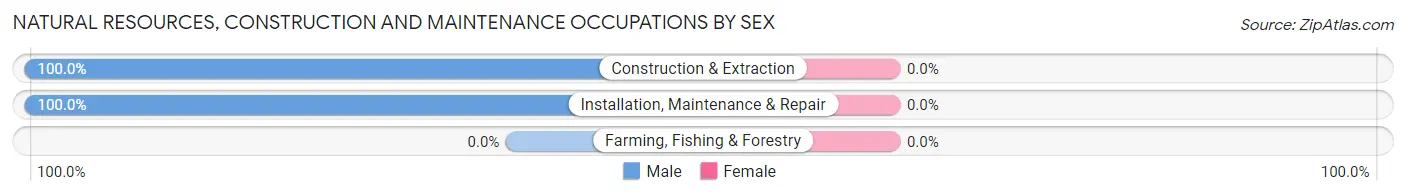
Natural Resources, Construction and Maintenance Occupations by Sex
| Occupation | Male | Female |
| Farming, Fishing & Forestry | 0 (0.0%) | 0 (0.0%) |
| Construction & Extraction | 17 (100.0%) | 0 (0.0%) |
| Installation, Maintenance & Repair | 18 (100.0%) | 0 (0.0%) |
| Total (Category) | 35 (100.0%) | 0 (0.0%) |
| Total (Overall) | 137 (48.4%) | 146 (51.6%) |
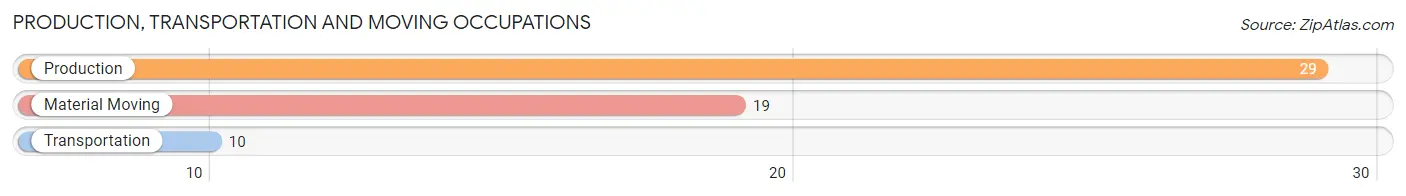
Production, Transportation and Moving Occupations
The most common Production, Transportation and Moving occupations in Friendship are Production (29 | 10.2%), Material Moving (19 | 6.7%), and Transportation (10 | 3.5%).
Production, Transportation and Moving Occupations by Sex
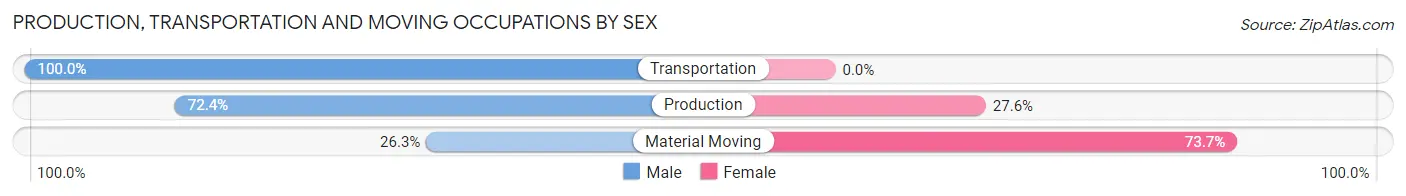
| Occupation | Male | Female |
| Production | 21 (72.4%) | 8 (27.6%) |
| Transportation | 10 (100.0%) | 0 (0.0%) |
| Material Moving | 5 (26.3%) | 14 (73.7%) |
| Total (Category) | 36 (62.1%) | 22 (37.9%) |
| Total (Overall) | 137 (48.4%) | 146 (51.6%) |
Employment Industries by Sex in Friendship
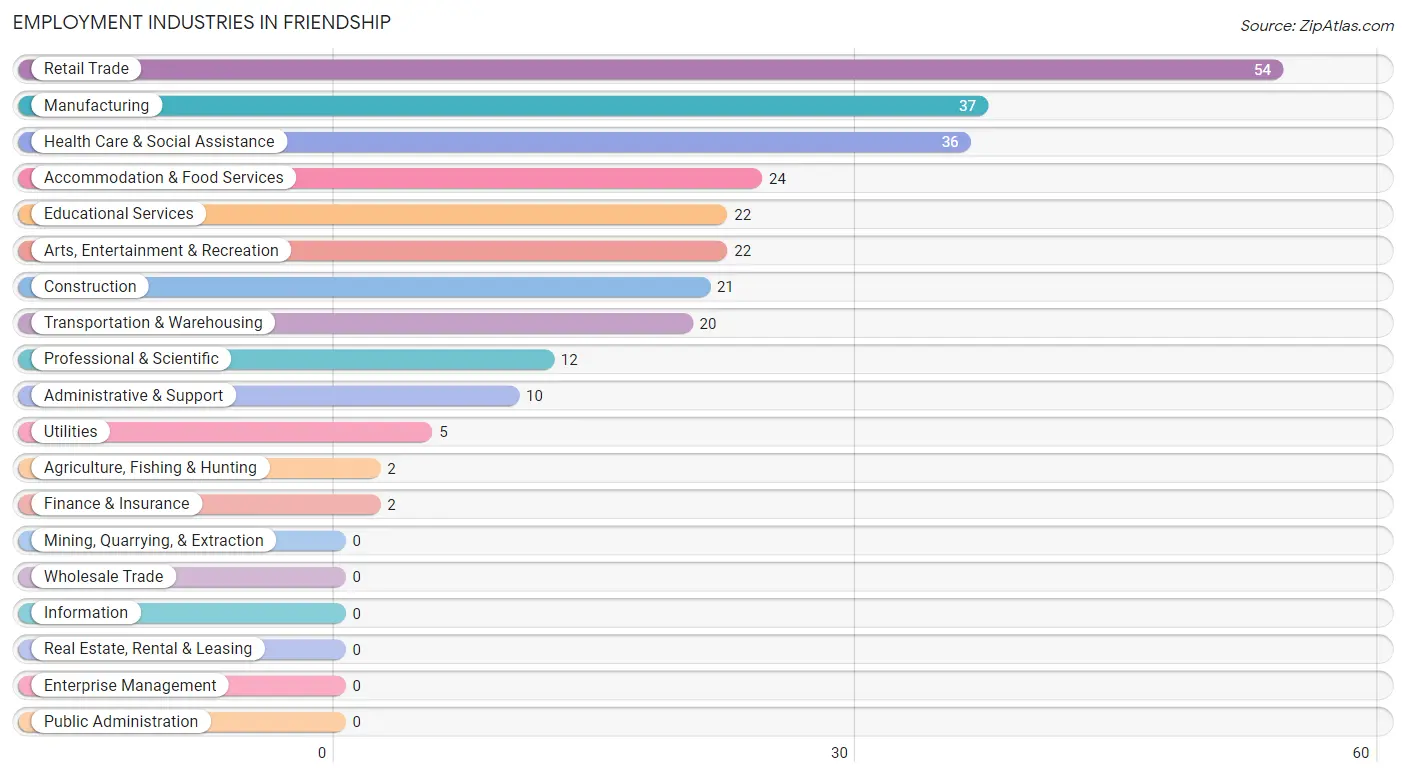
Employment Industries in Friendship
The major employment industries in Friendship include Retail Trade (54 | 19.1%), Manufacturing (37 | 13.1%), Health Care & Social Assistance (36 | 12.7%), Accommodation & Food Services (24 | 8.5%), and Educational Services (22 | 7.8%).
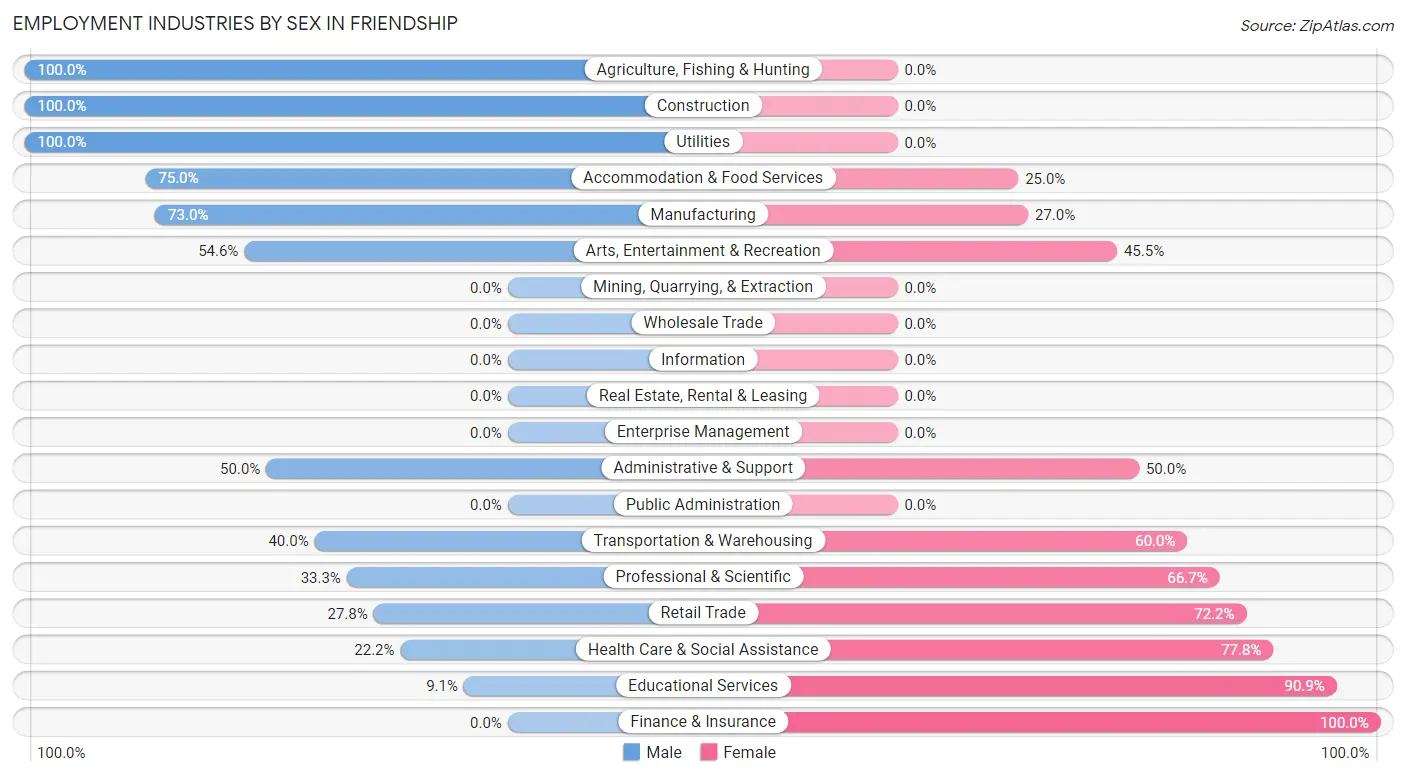
Employment Industries by Sex in Friendship
The Friendship industries that see more men than women are Agriculture, Fishing & Hunting (100.0%), Construction (100.0%), and Utilities (100.0%), whereas the industries that tend to have a higher number of women are Finance & Insurance (100.0%), Educational Services (90.9%), and Health Care & Social Assistance (77.8%).
| Industry | Male | Female |
| Agriculture, Fishing & Hunting | 2 (100.0%) | 0 (0.0%) |
| Mining, Quarrying, & Extraction | 0 (0.0%) | 0 (0.0%) |
| Construction | 21 (100.0%) | 0 (0.0%) |
| Manufacturing | 27 (73.0%) | 10 (27.0%) |
| Wholesale Trade | 0 (0.0%) | 0 (0.0%) |
| Retail Trade | 15 (27.8%) | 39 (72.2%) |
| Transportation & Warehousing | 8 (40.0%) | 12 (60.0%) |
| Utilities | 5 (100.0%) | 0 (0.0%) |
| Information | 0 (0.0%) | 0 (0.0%) |
| Finance & Insurance | 0 (0.0%) | 2 (100.0%) |
| Real Estate, Rental & Leasing | 0 (0.0%) | 0 (0.0%) |
| Professional & Scientific | 4 (33.3%) | 8 (66.7%) |
| Enterprise Management | 0 (0.0%) | 0 (0.0%) |
| Administrative & Support | 5 (50.0%) | 5 (50.0%) |
| Educational Services | 2 (9.1%) | 20 (90.9%) |
| Health Care & Social Assistance | 8 (22.2%) | 28 (77.8%) |
| Arts, Entertainment & Recreation | 12 (54.5%) | 10 (45.5%) |
| Accommodation & Food Services | 18 (75.0%) | 6 (25.0%) |
| Public Administration | 0 (0.0%) | 0 (0.0%) |
| Total | 137 (48.4%) | 146 (51.6%) |
Education in Friendship
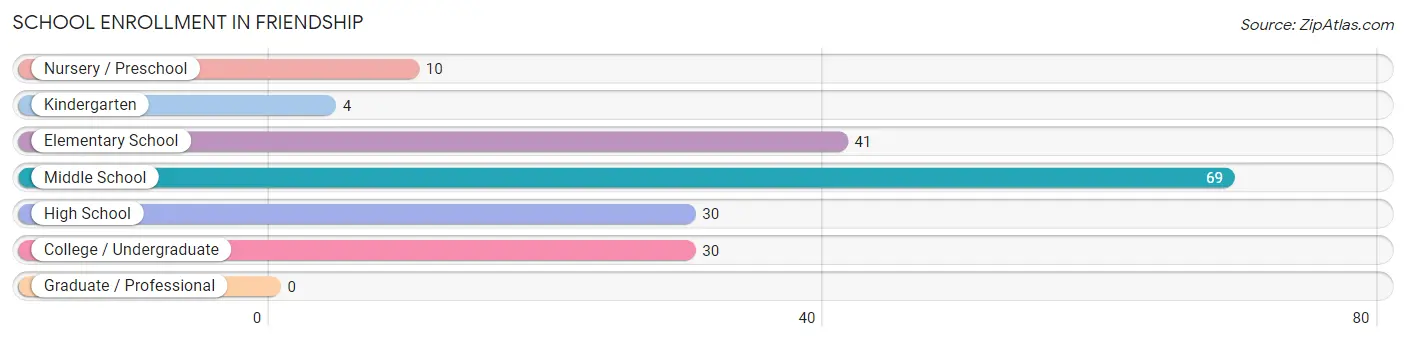
School Enrollment in Friendship
The most common levels of schooling among the 184 students in Friendship are middle school (69 | 37.5%), elementary school (41 | 22.3%), and high school (30 | 16.3%).
| School Level | # Students | % Students |
| Nursery / Preschool | 10 | 5.4% |
| Kindergarten | 4 | 2.2% |
| Elementary School | 41 | 22.3% |
| Middle School | 69 | 37.5% |
| High School | 30 | 16.3% |
| College / Undergraduate | 30 | 16.3% |
| Graduate / Professional | 0 | 0.0% |
| Total | 184 | 100.0% |
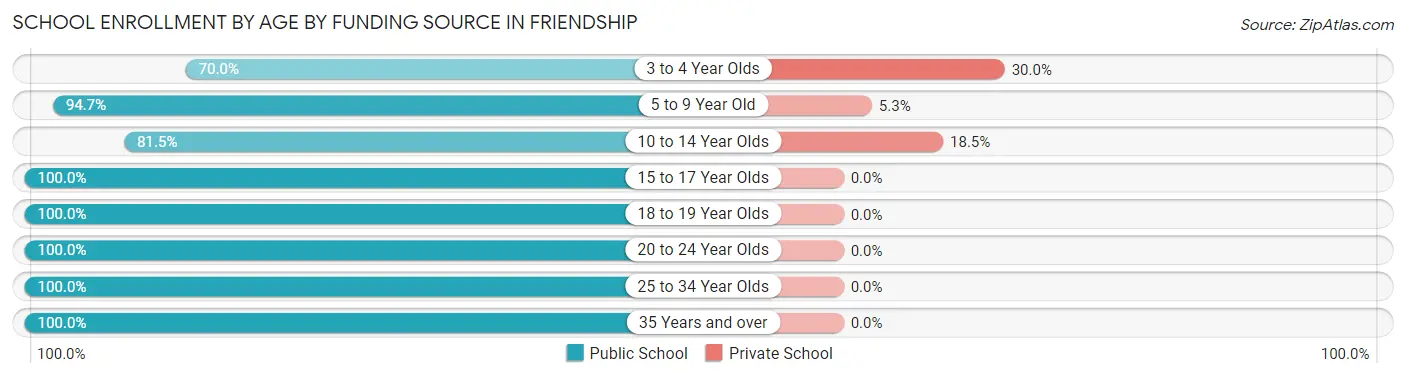
School Enrollment by Age by Funding Source in Friendship
Out of a total of 184 students who are enrolled in schools in Friendship, 20 (10.9%) attend a private institution, while the remaining 164 (89.1%) are enrolled in public schools. The age group of 3 to 4 year olds has the highest likelihood of being enrolled in private schools, with 3 (30.0% in the age bracket) enrolled. Conversely, the age group of 15 to 17 year olds has the lowest likelihood of being enrolled in a private school, with 22 (100.0% in the age bracket) attending a public institution.
| Age Bracket | Public School | Private School |
| 3 to 4 Year Olds | 7 (70.0%) | 3 (30.0%) |
| 5 to 9 Year Old | 36 (94.7%) | 2 (5.3%) |
| 10 to 14 Year Olds | 66 (81.5%) | 15 (18.5%) |
| 15 to 17 Year Olds | 22 (100.0%) | 0 (0.0%) |
| 18 to 19 Year Olds | 8 (100.0%) | 0 (0.0%) |
| 20 to 24 Year Olds | 20 (100.0%) | 0 (0.0%) |
| 25 to 34 Year Olds | 3 (100.0%) | 0 (0.0%) |
| 35 Years and over | 2 (100.0%) | 0 (0.0%) |
| Total | 164 (89.1%) | 20 (10.9%) |
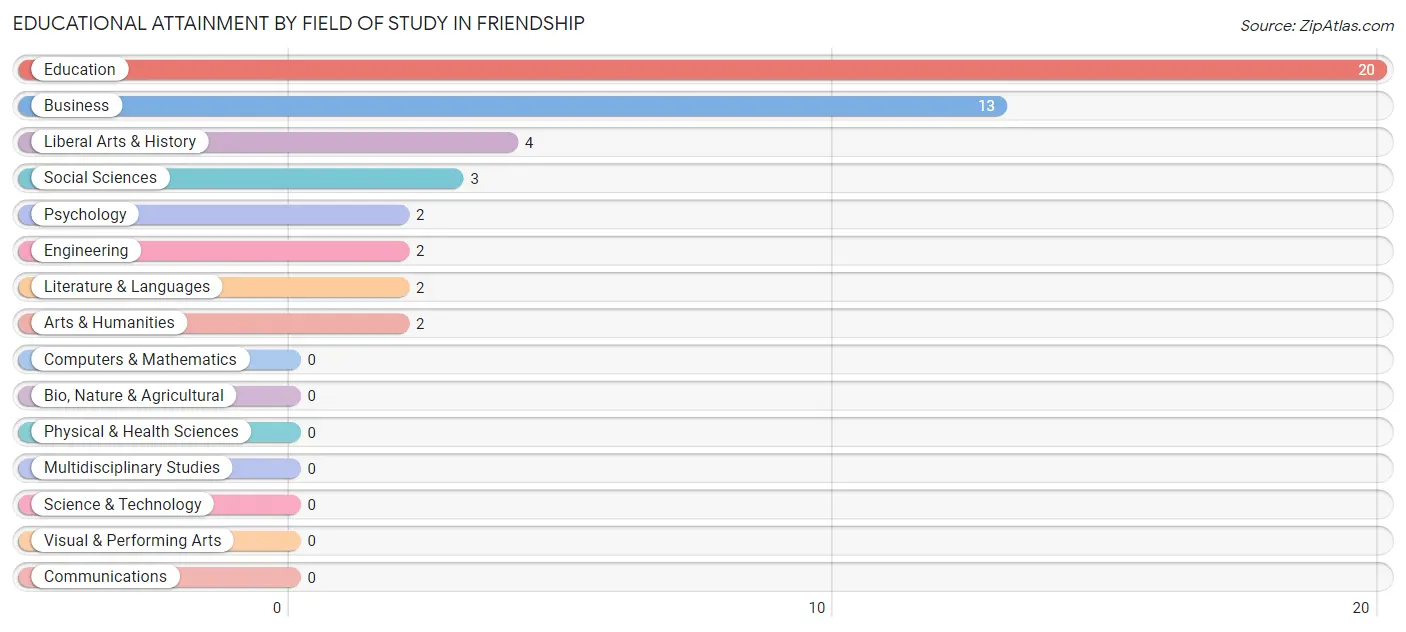
Educational Attainment by Field of Study in Friendship
Education (20 | 41.7%), business (13 | 27.1%), liberal arts & history (4 | 8.3%), social sciences (3 | 6.2%), and psychology (2 | 4.2%) are the most common fields of study among 48 individuals in Friendship who have obtained a bachelor's degree or higher.
| Field of Study | # Graduates | % Graduates |
| Computers & Mathematics | 0 | 0.0% |
| Bio, Nature & Agricultural | 0 | 0.0% |
| Physical & Health Sciences | 0 | 0.0% |
| Psychology | 2 | 4.2% |
| Social Sciences | 3 | 6.2% |
| Engineering | 2 | 4.2% |
| Multidisciplinary Studies | 0 | 0.0% |
| Science & Technology | 0 | 0.0% |
| Business | 13 | 27.1% |
| Education | 20 | 41.7% |
| Literature & Languages | 2 | 4.2% |
| Liberal Arts & History | 4 | 8.3% |
| Visual & Performing Arts | 0 | 0.0% |
| Communications | 0 | 0.0% |
| Arts & Humanities | 2 | 4.2% |
| Total | 48 | 100.0% |
Transportation & Commute in Friendship
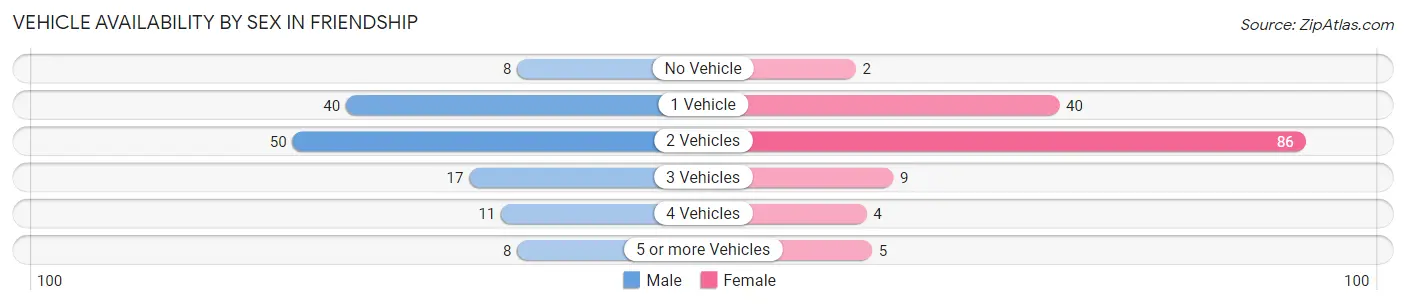
Vehicle Availability by Sex in Friendship
The most prevalent vehicle ownership categories in Friendship are males with 2 vehicles (50, accounting for 37.3%) and females with 2 vehicles (86, making up 34.3%).
| Vehicles Available | Male | Female |
| No Vehicle | 8 (6.0%) | 2 (1.4%) |
| 1 Vehicle | 40 (29.8%) | 40 (27.4%) |
| 2 Vehicles | 50 (37.3%) | 86 (58.9%) |
| 3 Vehicles | 17 (12.7%) | 9 (6.2%) |
| 4 Vehicles | 11 (8.2%) | 4 (2.7%) |
| 5 or more Vehicles | 8 (6.0%) | 5 (3.4%) |
| Total | 134 (100.0%) | 146 (100.0%) |
Commute Time in Friendship
The most frequently occuring commute durations in Friendship are 20 to 24 minutes (101 commuters, 38.1%), 30 to 34 minutes (43 commuters, 16.2%), and 40 to 44 minutes (23 commuters, 8.7%).
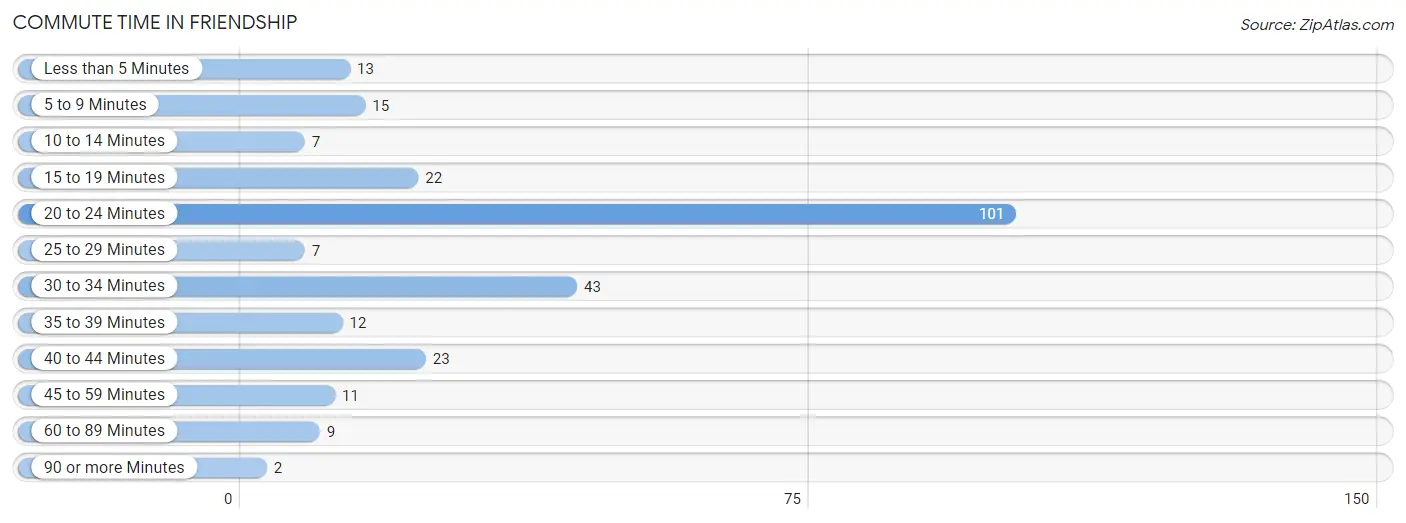
| Commute Time | # Commuters | % Commuters |
| Less than 5 Minutes | 13 | 4.9% |
| 5 to 9 Minutes | 15 | 5.7% |
| 10 to 14 Minutes | 7 | 2.6% |
| 15 to 19 Minutes | 22 | 8.3% |
| 20 to 24 Minutes | 101 | 38.1% |
| 25 to 29 Minutes | 7 | 2.6% |
| 30 to 34 Minutes | 43 | 16.2% |
| 35 to 39 Minutes | 12 | 4.5% |
| 40 to 44 Minutes | 23 | 8.7% |
| 45 to 59 Minutes | 11 | 4.2% |
| 60 to 89 Minutes | 9 | 3.4% |
| 90 or more Minutes | 2 | 0.7% |
Commute Time by Sex in Friendship
The most common commute times in Friendship are 20 to 24 minutes (60 commuters, 44.8%) for males and 20 to 24 minutes (41 commuters, 31.3%) for females.
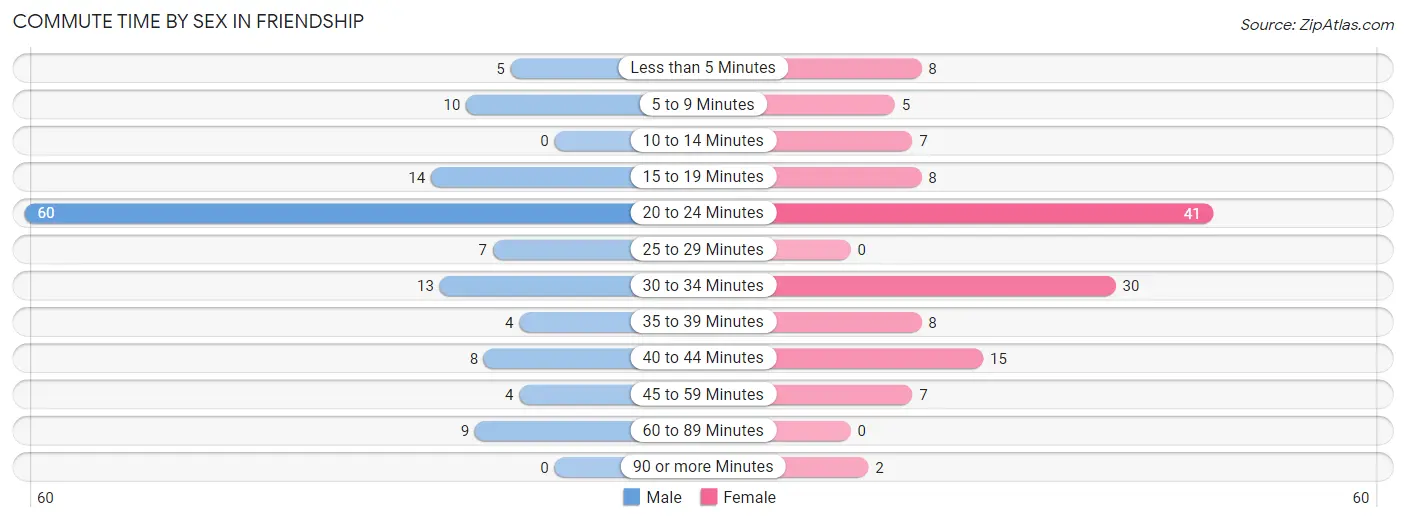
| Commute Time | Male | Female |
| Less than 5 Minutes | 5 (3.7%) | 8 (6.1%) |
| 5 to 9 Minutes | 10 (7.5%) | 5 (3.8%) |
| 10 to 14 Minutes | 0 (0.0%) | 7 (5.3%) |
| 15 to 19 Minutes | 14 (10.4%) | 8 (6.1%) |
| 20 to 24 Minutes | 60 (44.8%) | 41 (31.3%) |
| 25 to 29 Minutes | 7 (5.2%) | 0 (0.0%) |
| 30 to 34 Minutes | 13 (9.7%) | 30 (22.9%) |
| 35 to 39 Minutes | 4 (3.0%) | 8 (6.1%) |
| 40 to 44 Minutes | 8 (6.0%) | 15 (11.5%) |
| 45 to 59 Minutes | 4 (3.0%) | 7 (5.3%) |
| 60 to 89 Minutes | 9 (6.7%) | 0 (0.0%) |
| 90 or more Minutes | 0 (0.0%) | 2 (1.5%) |
Time of Departure to Work by Sex in Friendship
The most frequent times of departure to work in Friendship are 5:00 AM to 5:29 AM (21, 15.7%) for males and 7:00 AM to 7:29 AM (38, 29.0%) for females.
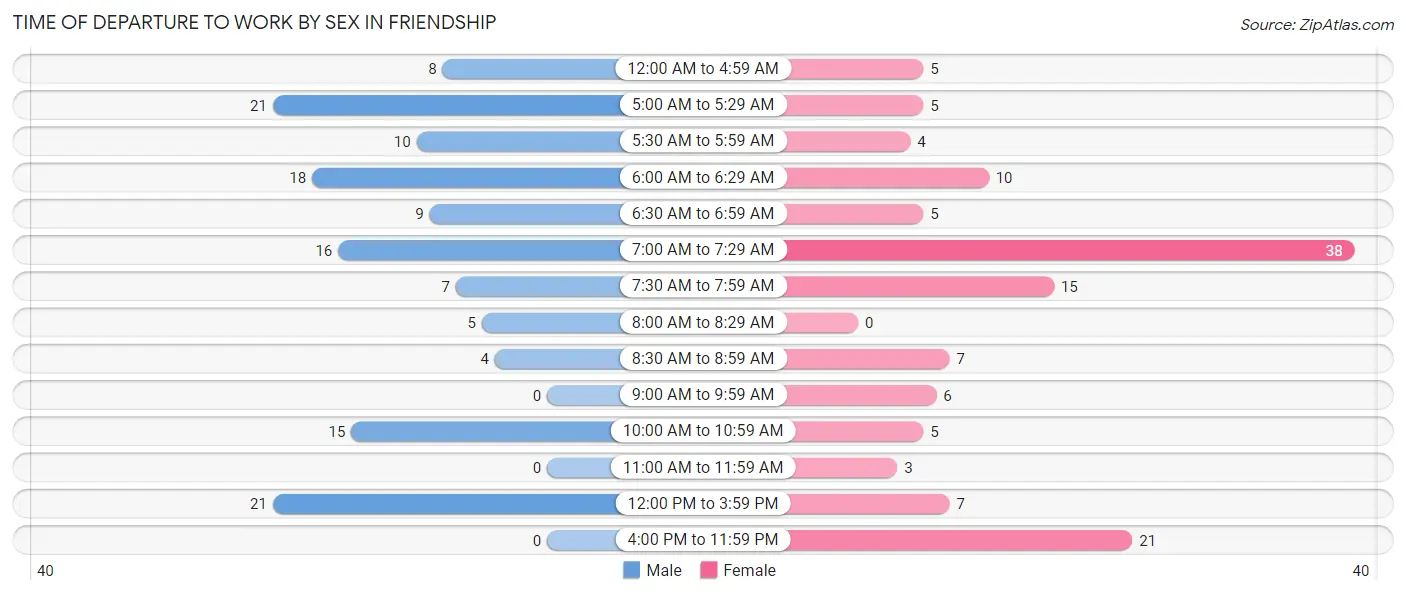
| Time of Departure | Male | Female |
| 12:00 AM to 4:59 AM | 8 (6.0%) | 5 (3.8%) |
| 5:00 AM to 5:29 AM | 21 (15.7%) | 5 (3.8%) |
| 5:30 AM to 5:59 AM | 10 (7.5%) | 4 (3.0%) |
| 6:00 AM to 6:29 AM | 18 (13.4%) | 10 (7.6%) |
| 6:30 AM to 6:59 AM | 9 (6.7%) | 5 (3.8%) |
| 7:00 AM to 7:29 AM | 16 (11.9%) | 38 (29.0%) |
| 7:30 AM to 7:59 AM | 7 (5.2%) | 15 (11.5%) |
| 8:00 AM to 8:29 AM | 5 (3.7%) | 0 (0.0%) |
| 8:30 AM to 8:59 AM | 4 (3.0%) | 7 (5.3%) |
| 9:00 AM to 9:59 AM | 0 (0.0%) | 6 (4.6%) |
| 10:00 AM to 10:59 AM | 15 (11.2%) | 5 (3.8%) |
| 11:00 AM to 11:59 AM | 0 (0.0%) | 3 (2.3%) |
| 12:00 PM to 3:59 PM | 21 (15.7%) | 7 (5.3%) |
| 4:00 PM to 11:59 PM | 0 (0.0%) | 21 (16.0%) |
| Total | 134 (100.0%) | 131 (100.0%) |
Housing Occupancy in Friendship
Occupancy by Ownership in Friendship
Of the total 285 dwellings in Friendship, owner-occupied units account for 169 (59.3%), while renter-occupied units make up 116 (40.7%).
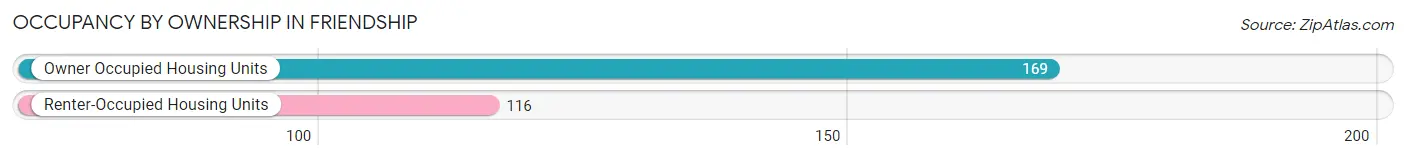
| Occupancy | # Housing Units | % Housing Units |
| Owner Occupied Housing Units | 169 | 59.3% |
| Renter-Occupied Housing Units | 116 | 40.7% |
| Total Occupied Housing Units | 285 | 100.0% |
Occupancy by Household Size in Friendship
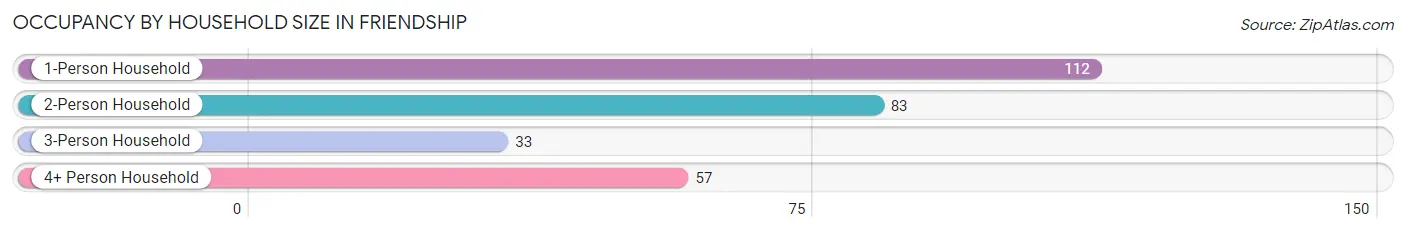
| Household Size | # Housing Units | % Housing Units |
| 1-Person Household | 112 | 39.3% |
| 2-Person Household | 83 | 29.1% |
| 3-Person Household | 33 | 11.6% |
| 4+ Person Household | 57 | 20.0% |
| Total Housing Units | 285 | 100.0% |
Occupancy by Ownership by Household Size in Friendship
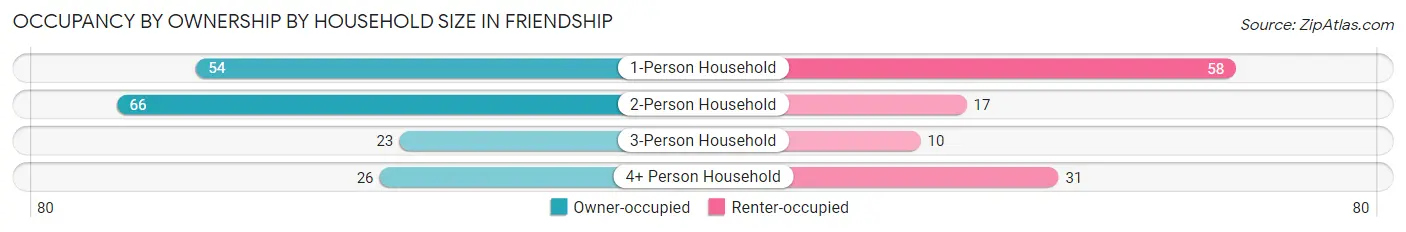
| Household Size | Owner-occupied | Renter-occupied |
| 1-Person Household | 54 (48.2%) | 58 (51.8%) |
| 2-Person Household | 66 (79.5%) | 17 (20.5%) |
| 3-Person Household | 23 (69.7%) | 10 (30.3%) |
| 4+ Person Household | 26 (45.6%) | 31 (54.4%) |
| Total Housing Units | 169 (59.3%) | 116 (40.7%) |
Occupancy by Educational Attainment in Friendship
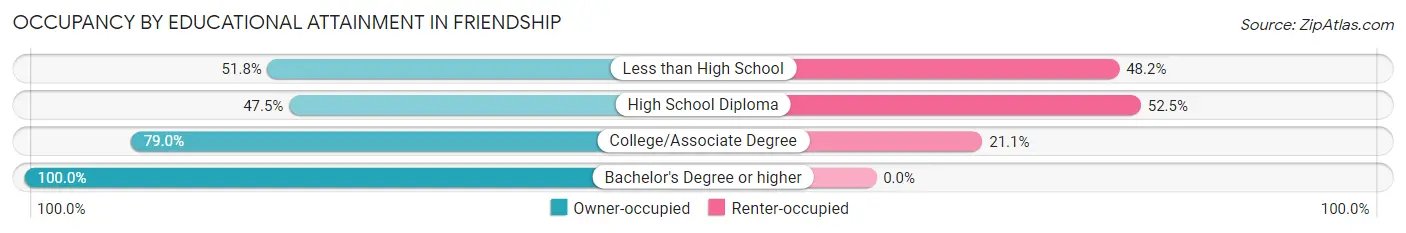
| Household Size | Owner-occupied | Renter-occupied |
| Less than High School | 43 (51.8%) | 40 (48.2%) |
| High School Diploma | 58 (47.5%) | 64 (52.5%) |
| College/Associate Degree | 45 (78.9%) | 12 (21.0%) |
| Bachelor's Degree or higher | 23 (100.0%) | 0 (0.0%) |
Occupancy by Age of Householder in Friendship
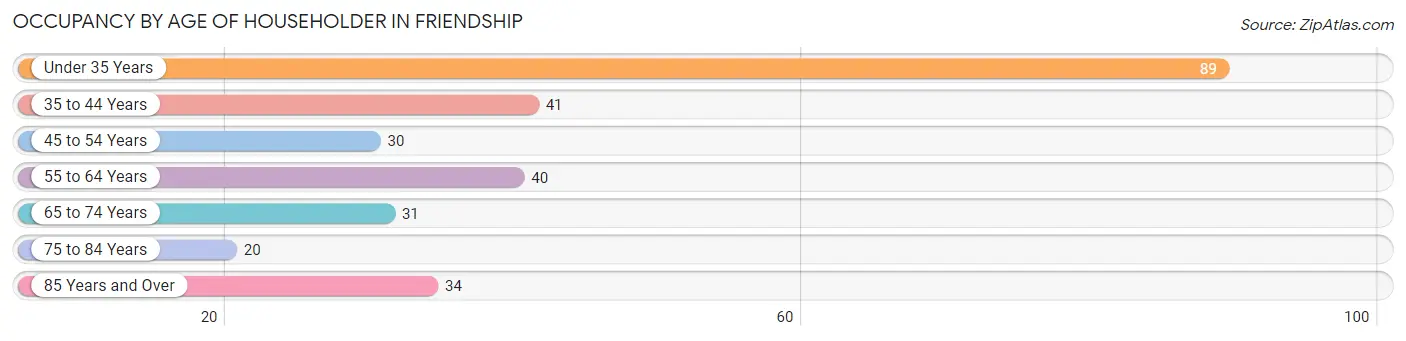
| Age Bracket | # Households | % Households |
| Under 35 Years | 89 | 31.2% |
| 35 to 44 Years | 41 | 14.4% |
| 45 to 54 Years | 30 | 10.5% |
| 55 to 64 Years | 40 | 14.0% |
| 65 to 74 Years | 31 | 10.9% |
| 75 to 84 Years | 20 | 7.0% |
| 85 Years and Over | 34 | 11.9% |
| Total | 285 | 100.0% |
Housing Finances in Friendship
Median Income by Occupancy in Friendship
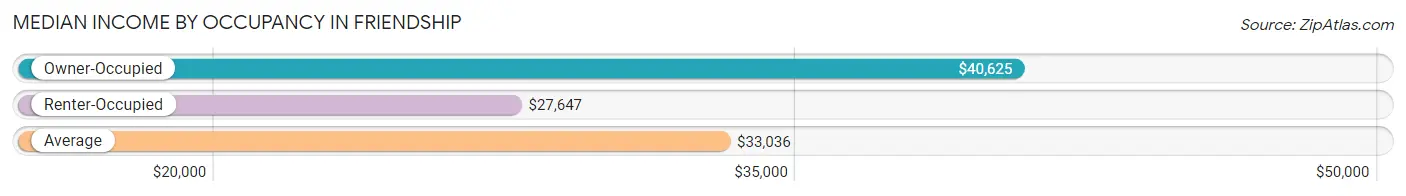
| Occupancy Type | # Households | Median Income |
| Owner-Occupied | 169 (59.3%) | $40,625 |
| Renter-Occupied | 116 (40.7%) | $27,647 |
| Average | 285 (100.0%) | $33,036 |
Occupancy by Householder Income Bracket in Friendship
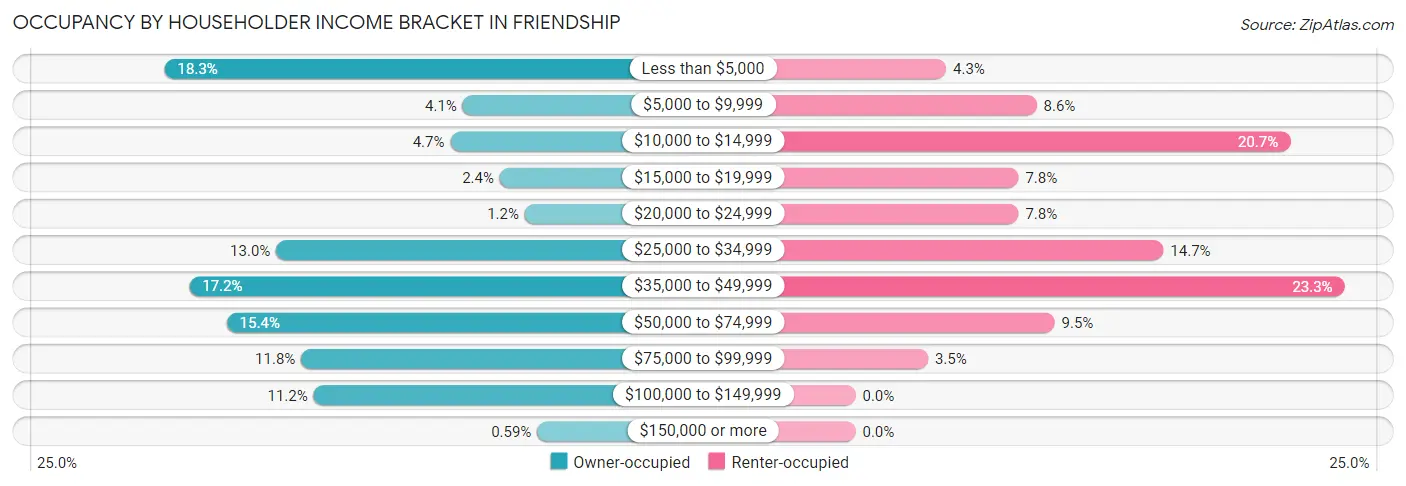
| Income Bracket | Owner-occupied | Renter-occupied |
| Less than $5,000 | 31 (18.3%) | 5 (4.3%) |
| $5,000 to $9,999 | 7 (4.1%) | 10 (8.6%) |
| $10,000 to $14,999 | 8 (4.7%) | 24 (20.7%) |
| $15,000 to $19,999 | 4 (2.4%) | 9 (7.8%) |
| $20,000 to $24,999 | 2 (1.2%) | 9 (7.8%) |
| $25,000 to $34,999 | 22 (13.0%) | 17 (14.7%) |
| $35,000 to $49,999 | 29 (17.2%) | 27 (23.3%) |
| $50,000 to $74,999 | 26 (15.4%) | 11 (9.5%) |
| $75,000 to $99,999 | 20 (11.8%) | 4 (3.5%) |
| $100,000 to $149,999 | 19 (11.2%) | 0 (0.0%) |
| $150,000 or more | 1 (0.6%) | 0 (0.0%) |
| Total | 169 (100.0%) | 116 (100.0%) |
Monthly Housing Cost Tiers in Friendship
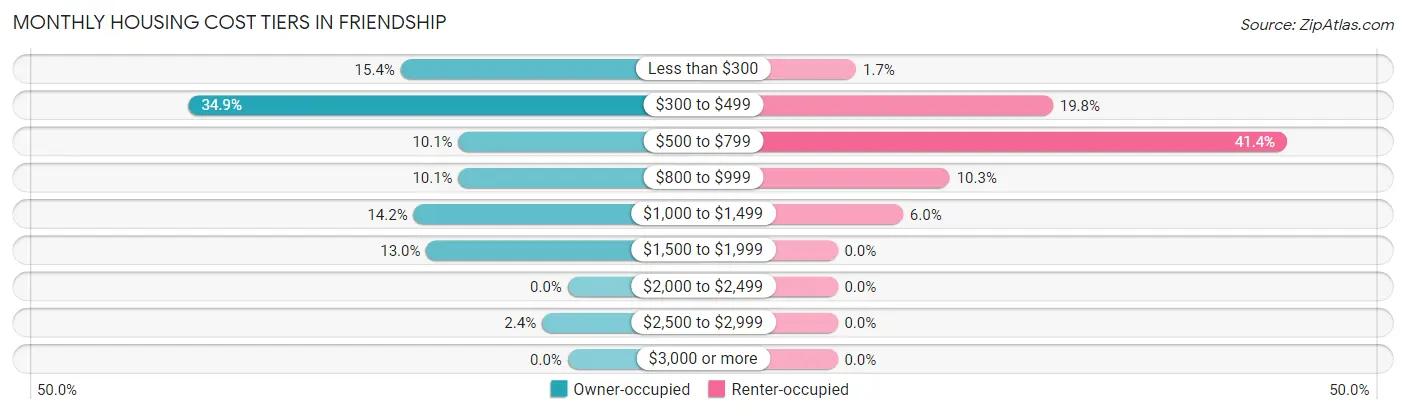
| Monthly Cost | Owner-occupied | Renter-occupied |
| Less than $300 | 26 (15.4%) | 2 (1.7%) |
| $300 to $499 | 59 (34.9%) | 23 (19.8%) |
| $500 to $799 | 17 (10.1%) | 48 (41.4%) |
| $800 to $999 | 17 (10.1%) | 12 (10.3%) |
| $1,000 to $1,499 | 24 (14.2%) | 7 (6.0%) |
| $1,500 to $1,999 | 22 (13.0%) | 0 (0.0%) |
| $2,000 to $2,499 | 0 (0.0%) | 0 (0.0%) |
| $2,500 to $2,999 | 4 (2.4%) | 0 (0.0%) |
| $3,000 or more | 0 (0.0%) | 0 (0.0%) |
| Total | 169 (100.0%) | 116 (100.0%) |
Physical Housing Characteristics in Friendship
Housing Structures in Friendship
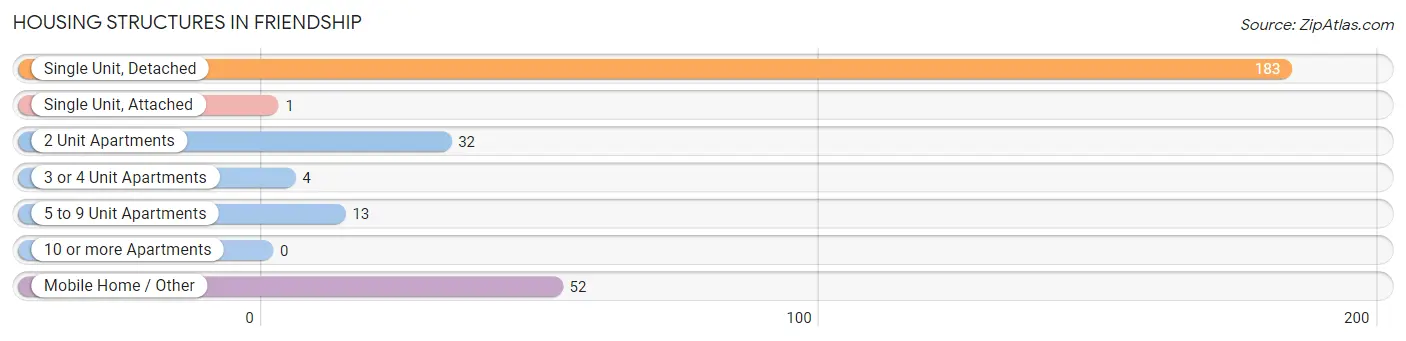
| Structure Type | # Housing Units | % Housing Units |
| Single Unit, Detached | 183 | 64.2% |
| Single Unit, Attached | 1 | 0.4% |
| 2 Unit Apartments | 32 | 11.2% |
| 3 or 4 Unit Apartments | 4 | 1.4% |
| 5 to 9 Unit Apartments | 13 | 4.6% |
| 10 or more Apartments | 0 | 0.0% |
| Mobile Home / Other | 52 | 18.2% |
| Total | 285 | 100.0% |
Housing Structures by Occupancy in Friendship
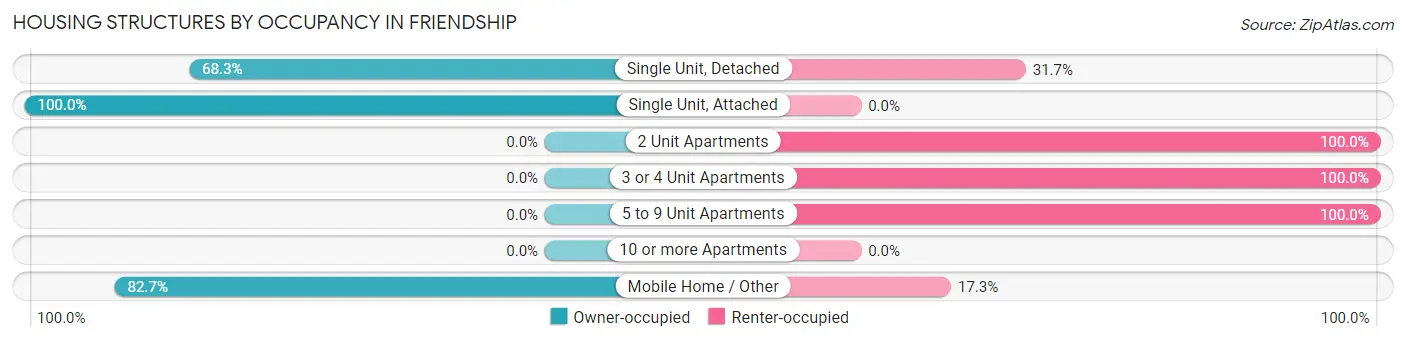
| Structure Type | Owner-occupied | Renter-occupied |
| Single Unit, Detached | 125 (68.3%) | 58 (31.7%) |
| Single Unit, Attached | 1 (100.0%) | 0 (0.0%) |
| 2 Unit Apartments | 0 (0.0%) | 32 (100.0%) |
| 3 or 4 Unit Apartments | 0 (0.0%) | 4 (100.0%) |
| 5 to 9 Unit Apartments | 0 (0.0%) | 13 (100.0%) |
| 10 or more Apartments | 0 (0.0%) | 0 (0.0%) |
| Mobile Home / Other | 43 (82.7%) | 9 (17.3%) |
| Total | 169 (59.3%) | 116 (40.7%) |
Housing Structures by Number of Rooms in Friendship
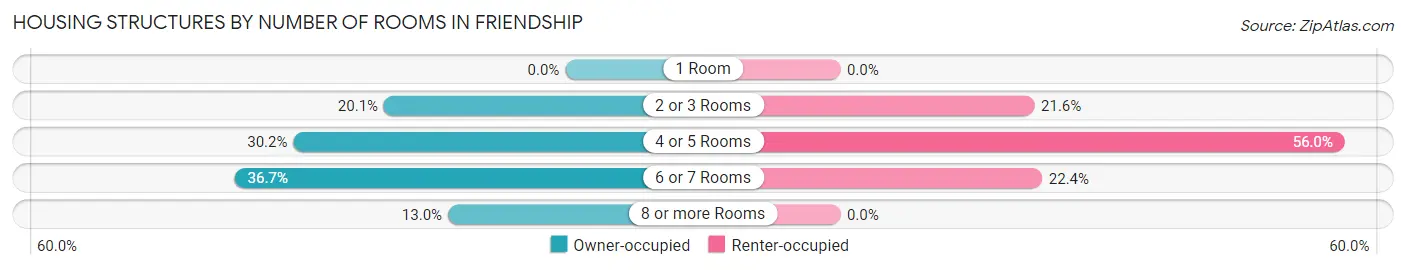
| Number of Rooms | Owner-occupied | Renter-occupied |
| 1 Room | 0 (0.0%) | 0 (0.0%) |
| 2 or 3 Rooms | 34 (20.1%) | 25 (21.5%) |
| 4 or 5 Rooms | 51 (30.2%) | 65 (56.0%) |
| 6 or 7 Rooms | 62 (36.7%) | 26 (22.4%) |
| 8 or more Rooms | 22 (13.0%) | 0 (0.0%) |
| Total | 169 (100.0%) | 116 (100.0%) |
Housing Structure by Heating Type in Friendship
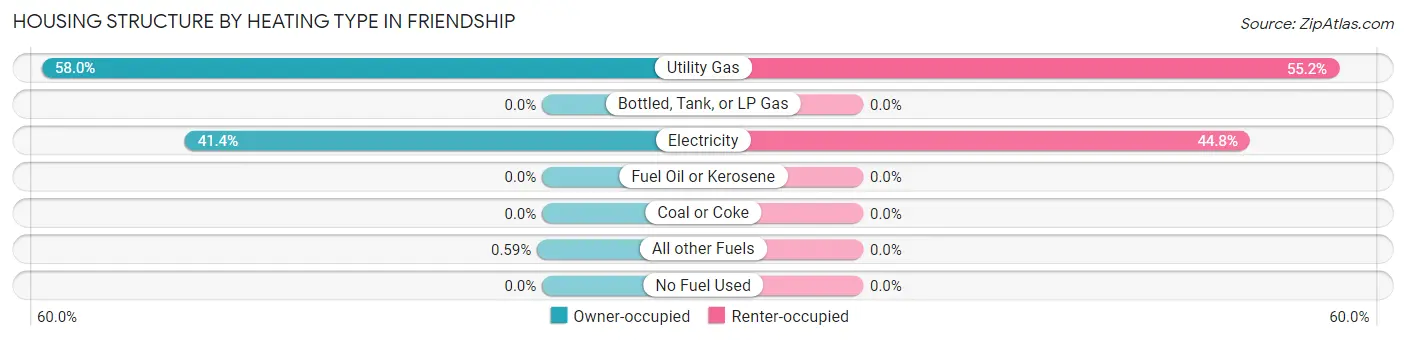
| Heating Type | Owner-occupied | Renter-occupied |
| Utility Gas | 98 (58.0%) | 64 (55.2%) |
| Bottled, Tank, or LP Gas | 0 (0.0%) | 0 (0.0%) |
| Electricity | 70 (41.4%) | 52 (44.8%) |
| Fuel Oil or Kerosene | 0 (0.0%) | 0 (0.0%) |
| Coal or Coke | 0 (0.0%) | 0 (0.0%) |
| All other Fuels | 1 (0.6%) | 0 (0.0%) |
| No Fuel Used | 0 (0.0%) | 0 (0.0%) |
| Total | 169 (100.0%) | 116 (100.0%) |
Household Vehicle Usage in Friendship
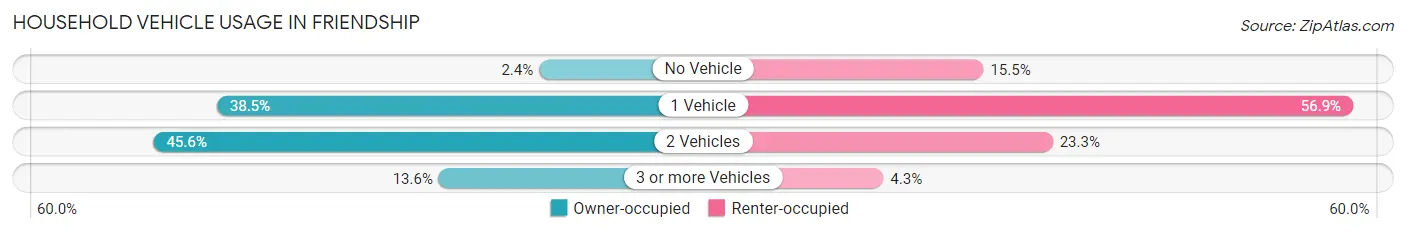
| Vehicles per Household | Owner-occupied | Renter-occupied |
| No Vehicle | 4 (2.4%) | 18 (15.5%) |
| 1 Vehicle | 65 (38.5%) | 66 (56.9%) |
| 2 Vehicles | 77 (45.6%) | 27 (23.3%) |
| 3 or more Vehicles | 23 (13.6%) | 5 (4.3%) |
| Total | 169 (100.0%) | 116 (100.0%) |
Real Estate & Mortgages in Friendship
Real Estate and Mortgage Overview in Friendship
| Characteristic | Without Mortgage | With Mortgage |
| Housing Units | 92 | 77 |
| Median Property Value | $48,300 | $116,100 |
| Median Household Income | - | - |
| Monthly Housing Costs | $322 | $0 |
| Real Estate Taxes | - | - |
Property Value by Mortgage Status in Friendship
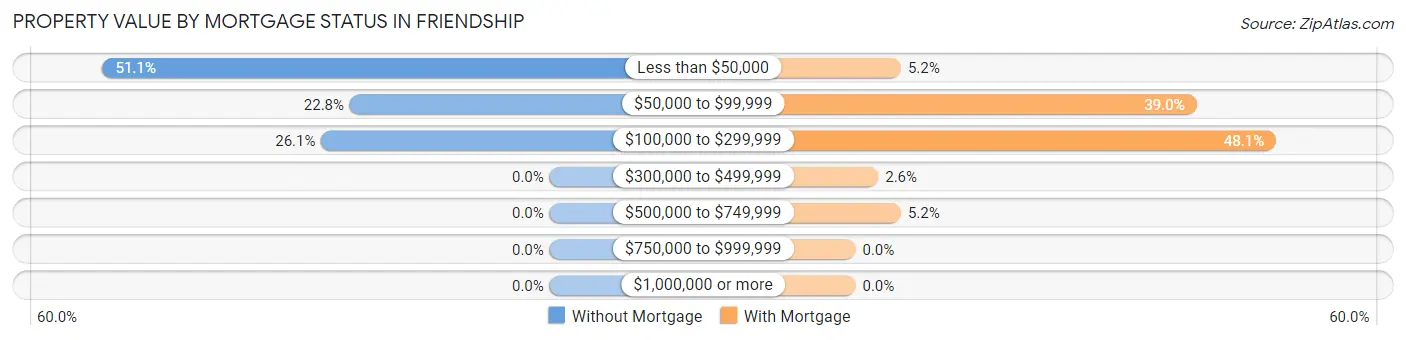
| Property Value | Without Mortgage | With Mortgage |
| Less than $50,000 | 47 (51.1%) | 4 (5.2%) |
| $50,000 to $99,999 | 21 (22.8%) | 30 (39.0%) |
| $100,000 to $299,999 | 24 (26.1%) | 37 (48.0%) |
| $300,000 to $499,999 | 0 (0.0%) | 2 (2.6%) |
| $500,000 to $749,999 | 0 (0.0%) | 4 (5.2%) |
| $750,000 to $999,999 | 0 (0.0%) | 0 (0.0%) |
| $1,000,000 or more | 0 (0.0%) | 0 (0.0%) |
| Total | 92 (100.0%) | 77 (100.0%) |
Household Income by Mortgage Status in Friendship
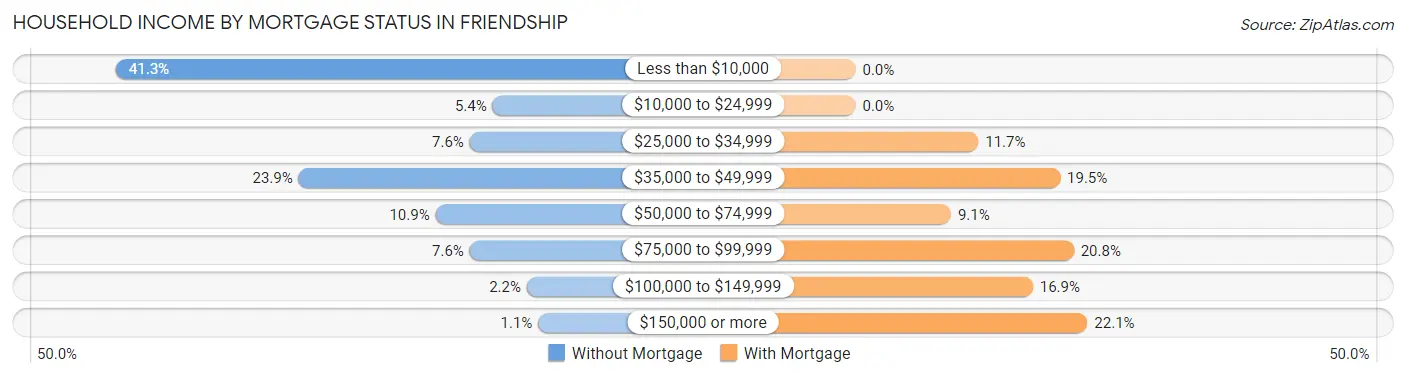
| Household Income | Without Mortgage | With Mortgage |
| Less than $10,000 | 38 (41.3%) | 0 (0.0%) |
| $10,000 to $24,999 | 5 (5.4%) | 0 (0.0%) |
| $25,000 to $34,999 | 7 (7.6%) | 9 (11.7%) |
| $35,000 to $49,999 | 22 (23.9%) | 15 (19.5%) |
| $50,000 to $74,999 | 10 (10.9%) | 7 (9.1%) |
| $75,000 to $99,999 | 7 (7.6%) | 16 (20.8%) |
| $100,000 to $149,999 | 2 (2.2%) | 13 (16.9%) |
| $150,000 or more | 1 (1.1%) | 17 (22.1%) |
| Total | 92 (100.0%) | 77 (100.0%) |
Property Value to Household Income Ratio in Friendship
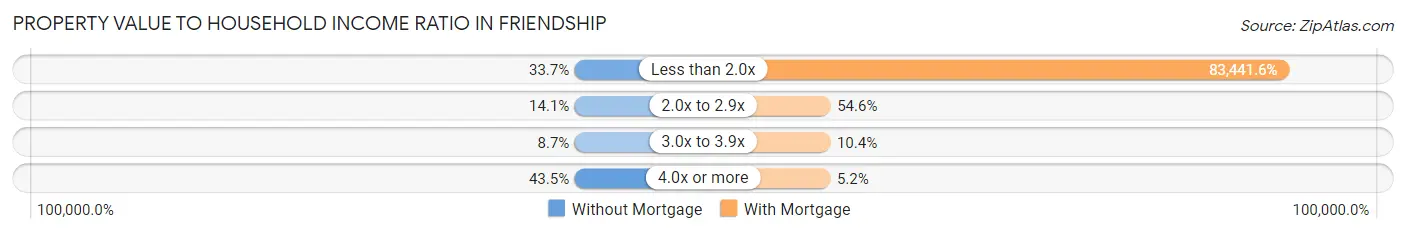
| Value-to-Income Ratio | Without Mortgage | With Mortgage |
| Less than 2.0x | 31 (33.7%) | 64,250 (83,441.6%) |
| 2.0x to 2.9x | 13 (14.1%) | 42 (54.5%) |
| 3.0x to 3.9x | 8 (8.7%) | 8 (10.4%) |
| 4.0x or more | 40 (43.5%) | 4 (5.2%) |
| Total | 92 (100.0%) | 77 (100.0%) |
Real Estate Taxes by Mortgage Status in Friendship
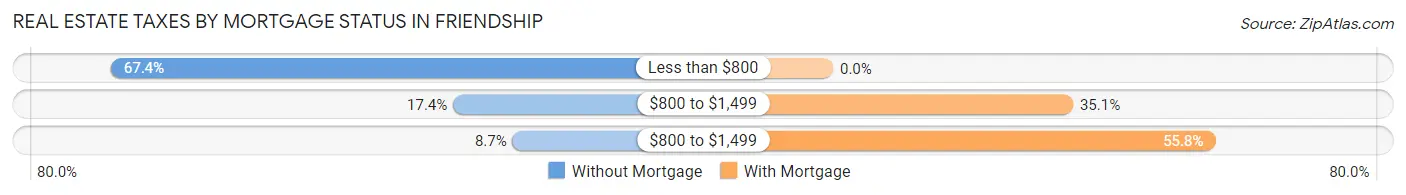
| Property Taxes | Without Mortgage | With Mortgage |
| Less than $800 | 62 (67.4%) | 0 (0.0%) |
| $800 to $1,499 | 16 (17.4%) | 27 (35.1%) |
| $800 to $1,499 | 8 (8.7%) | 43 (55.8%) |
| Total | 92 (100.0%) | 77 (100.0%) |
Health & Disability in Friendship
Health Insurance Coverage by Age in Friendship
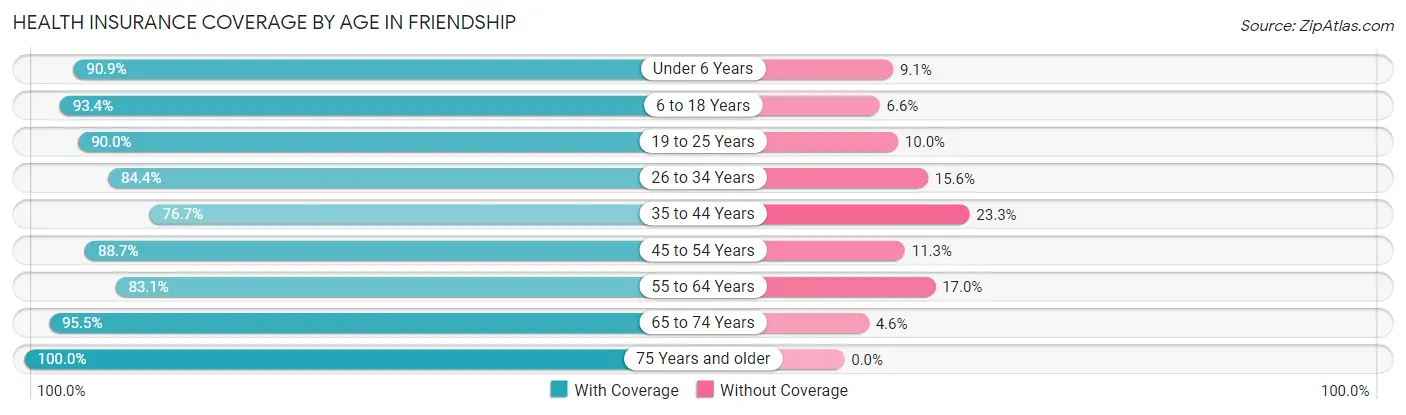
| Age Bracket | With Coverage | Without Coverage |
| Under 6 Years | 30 (90.9%) | 3 (9.1%) |
| 6 to 18 Years | 142 (93.4%) | 10 (6.6%) |
| 19 to 25 Years | 72 (90.0%) | 8 (10.0%) |
| 26 to 34 Years | 103 (84.4%) | 19 (15.6%) |
| 35 to 44 Years | 46 (76.7%) | 14 (23.3%) |
| 45 to 54 Years | 55 (88.7%) | 7 (11.3%) |
| 55 to 64 Years | 49 (83.1%) | 10 (17.0%) |
| 65 to 74 Years | 42 (95.5%) | 2 (4.5%) |
| 75 Years and older | 60 (100.0%) | 0 (0.0%) |
| Total | 599 (89.1%) | 73 (10.9%) |
Health Insurance Coverage by Citizenship Status in Friendship
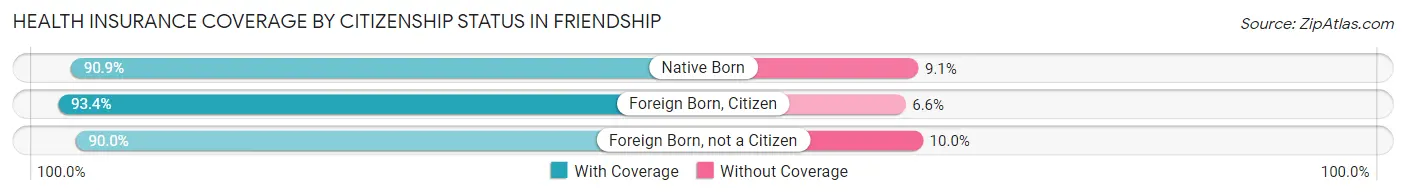
| Citizenship Status | With Coverage | Without Coverage |
| Native Born | 30 (90.9%) | 3 (9.1%) |
| Foreign Born, Citizen | 142 (93.4%) | 10 (6.6%) |
| Foreign Born, not a Citizen | 72 (90.0%) | 8 (10.0%) |
Health Insurance Coverage by Household Income in Friendship
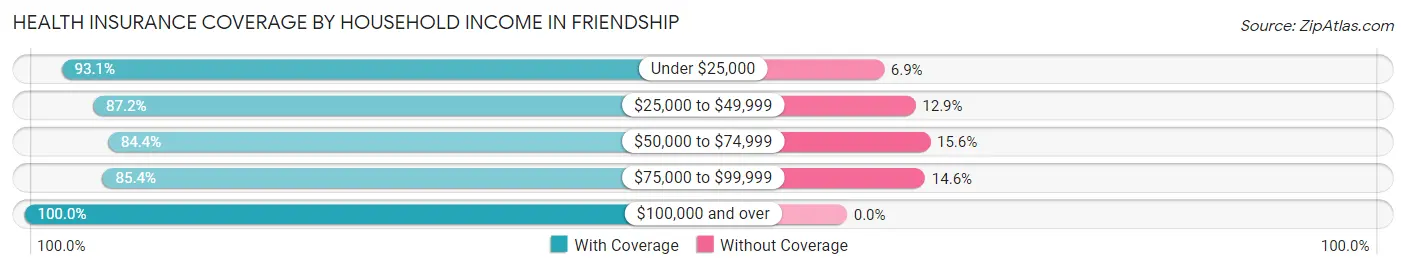
| Household Income | With Coverage | Without Coverage |
| Under $25,000 | 161 (93.1%) | 12 (6.9%) |
| $25,000 to $49,999 | 217 (87.2%) | 32 (12.9%) |
| $50,000 to $74,999 | 92 (84.4%) | 17 (15.6%) |
| $75,000 to $99,999 | 70 (85.4%) | 12 (14.6%) |
| $100,000 and over | 52 (100.0%) | 0 (0.0%) |
Public vs Private Health Insurance Coverage by Age in Friendship
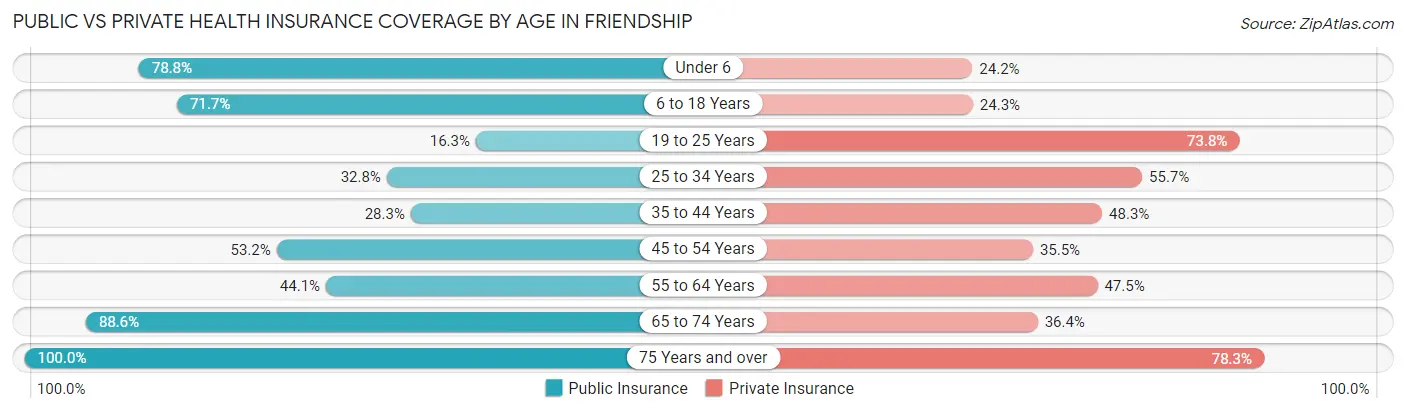
| Age Bracket | Public Insurance | Private Insurance |
| Under 6 | 26 (78.8%) | 8 (24.2%) |
| 6 to 18 Years | 109 (71.7%) | 37 (24.3%) |
| 19 to 25 Years | 13 (16.3%) | 59 (73.8%) |
| 25 to 34 Years | 40 (32.8%) | 68 (55.7%) |
| 35 to 44 Years | 17 (28.3%) | 29 (48.3%) |
| 45 to 54 Years | 33 (53.2%) | 22 (35.5%) |
| 55 to 64 Years | 26 (44.1%) | 28 (47.5%) |
| 65 to 74 Years | 39 (88.6%) | 16 (36.4%) |
| 75 Years and over | 60 (100.0%) | 47 (78.3%) |
| Total | 363 (54.0%) | 314 (46.7%) |
Disability Status by Sex by Age in Friendship
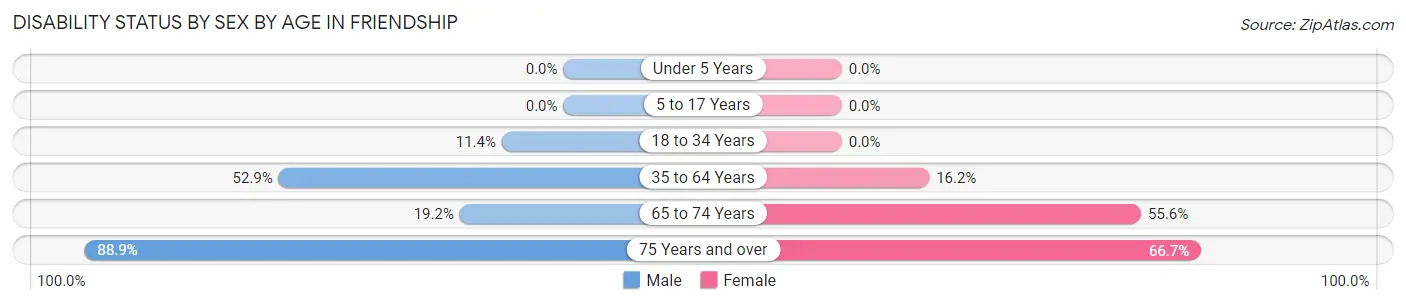
| Age Bracket | Male | Female |
| Under 5 Years | 0 (0.0%) | 0 (0.0%) |
| 5 to 17 Years | 0 (0.0%) | 0 (0.0%) |
| 18 to 34 Years | 12 (11.4%) | 0 (0.0%) |
| 35 to 64 Years | 37 (52.9%) | 18 (16.2%) |
| 65 to 74 Years | 5 (19.2%) | 10 (55.6%) |
| 75 Years and over | 8 (88.9%) | 34 (66.7%) |
Disability Class by Sex by Age in Friendship
Disability Class: Hearing Difficulty
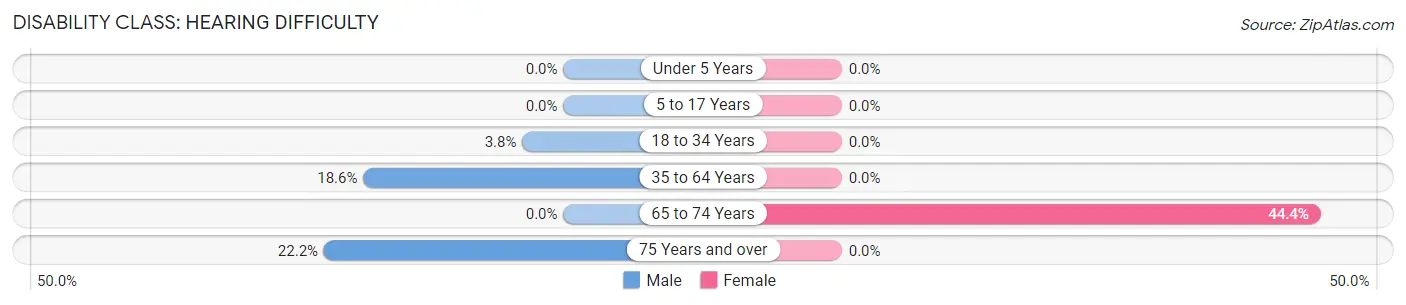
| Age Bracket | Male | Female |
| Under 5 Years | 0 (0.0%) | 0 (0.0%) |
| 5 to 17 Years | 0 (0.0%) | 0 (0.0%) |
| 18 to 34 Years | 4 (3.8%) | 0 (0.0%) |
| 35 to 64 Years | 13 (18.6%) | 0 (0.0%) |
| 65 to 74 Years | 0 (0.0%) | 8 (44.4%) |
| 75 Years and over | 2 (22.2%) | 0 (0.0%) |
Disability Class: Vision Difficulty
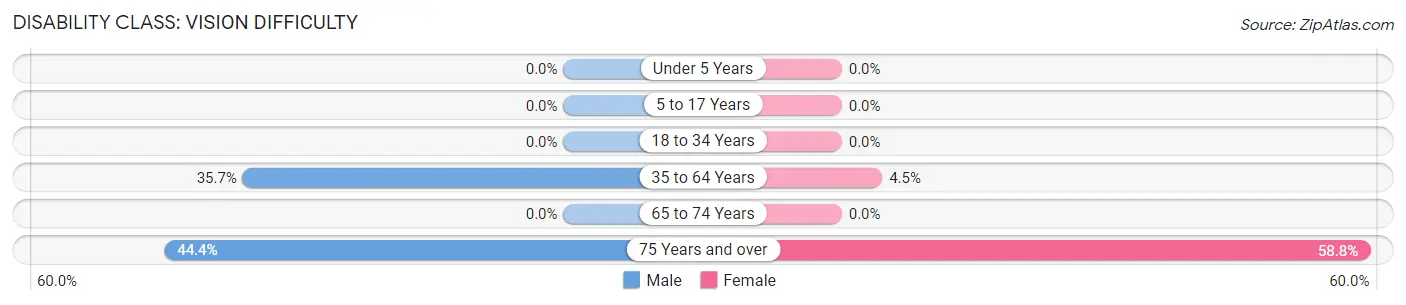
| Age Bracket | Male | Female |
| Under 5 Years | 0 (0.0%) | 0 (0.0%) |
| 5 to 17 Years | 0 (0.0%) | 0 (0.0%) |
| 18 to 34 Years | 0 (0.0%) | 0 (0.0%) |
| 35 to 64 Years | 25 (35.7%) | 5 (4.5%) |
| 65 to 74 Years | 0 (0.0%) | 0 (0.0%) |
| 75 Years and over | 4 (44.4%) | 30 (58.8%) |
Disability Class: Cognitive Difficulty
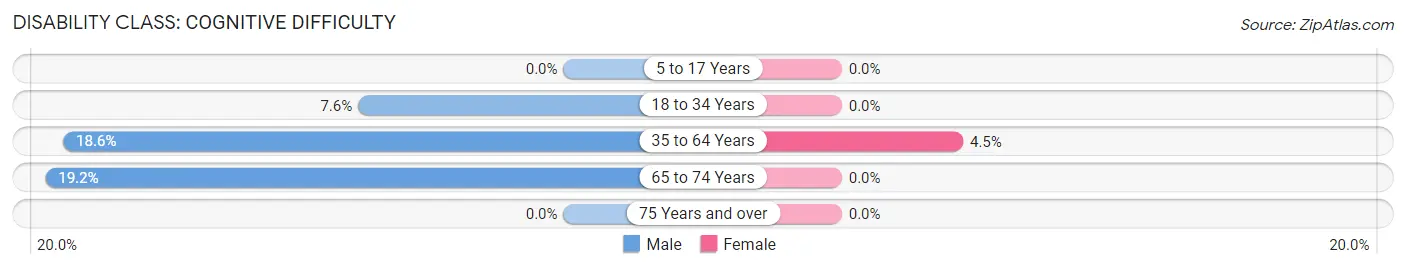
| Age Bracket | Male | Female |
| 5 to 17 Years | 0 (0.0%) | 0 (0.0%) |
| 18 to 34 Years | 8 (7.6%) | 0 (0.0%) |
| 35 to 64 Years | 13 (18.6%) | 5 (4.5%) |
| 65 to 74 Years | 5 (19.2%) | 0 (0.0%) |
| 75 Years and over | 0 (0.0%) | 0 (0.0%) |
Disability Class: Ambulatory Difficulty
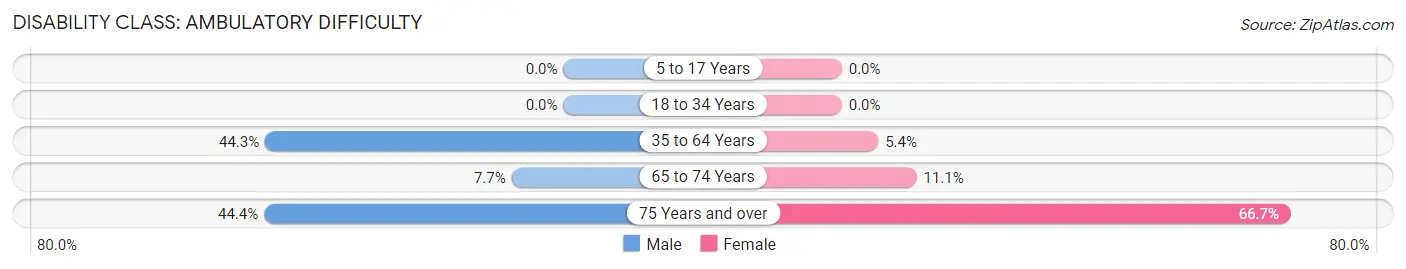
| Age Bracket | Male | Female |
| 5 to 17 Years | 0 (0.0%) | 0 (0.0%) |
| 18 to 34 Years | 0 (0.0%) | 0 (0.0%) |
| 35 to 64 Years | 31 (44.3%) | 6 (5.4%) |
| 65 to 74 Years | 2 (7.7%) | 2 (11.1%) |
| 75 Years and over | 4 (44.4%) | 34 (66.7%) |
Disability Class: Self-Care Difficulty
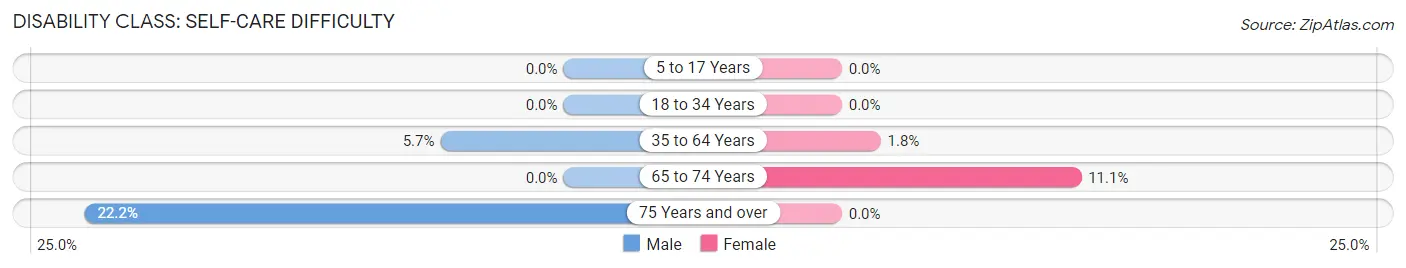
| Age Bracket | Male | Female |
| 5 to 17 Years | 0 (0.0%) | 0 (0.0%) |
| 18 to 34 Years | 0 (0.0%) | 0 (0.0%) |
| 35 to 64 Years | 4 (5.7%) | 2 (1.8%) |
| 65 to 74 Years | 0 (0.0%) | 2 (11.1%) |
| 75 Years and over | 2 (22.2%) | 0 (0.0%) |
Technology Access in Friendship
Computing Device Access in Friendship
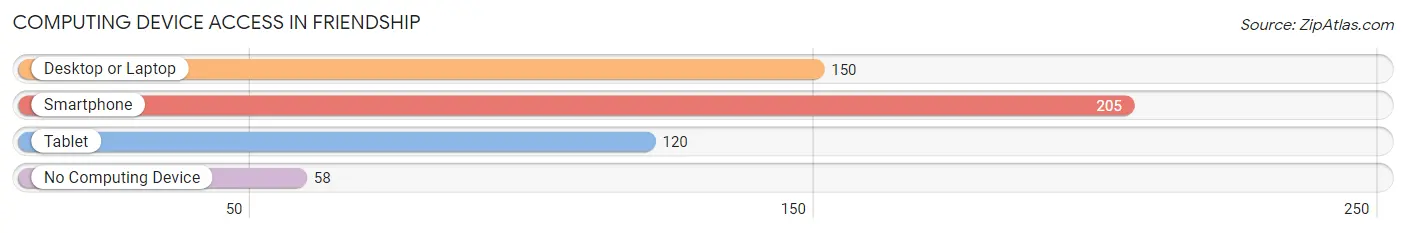
| Device Type | # Households | % Households |
| Desktop or Laptop | 150 | 52.6% |
| Smartphone | 205 | 71.9% |
| Tablet | 120 | 42.1% |
| No Computing Device | 58 | 20.3% |
| Total | 285 | 100.0% |
Internet Access in Friendship
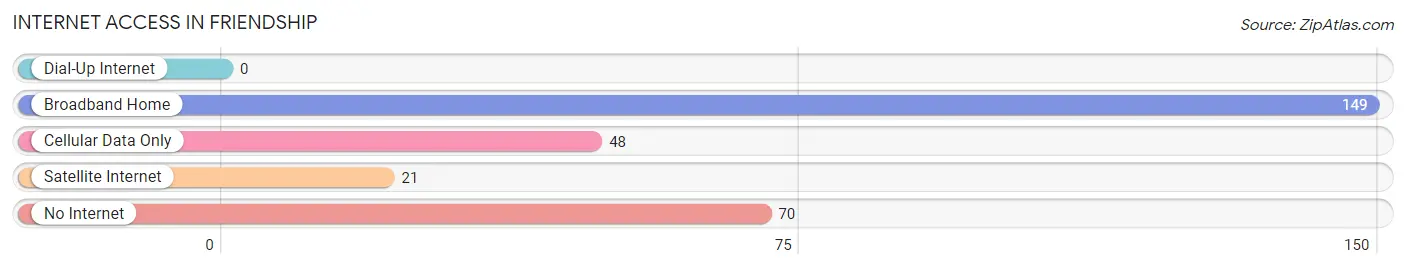
| Internet Type | # Households | % Households |
| Dial-Up Internet | 0 | 0.0% |
| Broadband Home | 149 | 52.3% |
| Cellular Data Only | 48 | 16.8% |
| Satellite Internet | 21 | 7.4% |
| No Internet | 70 | 24.6% |
| Total | 285 | 100.0% |
Friendship Summary
Friendship is a small town located in Crockett County, Tennessee. It is situated in the western part of the state, about halfway between Memphis and Nashville. The town was founded in 1845 and has a population of approximately 1,000 people.
Geography
Friendship is located in the western part of Tennessee, about halfway between Memphis and Nashville. The town is situated in the foothills of the Appalachian Mountains, and is surrounded by rolling hills and forests. The town is located on the banks of the Hatchie River, which is a tributary of the Mississippi River. The town is also located near the Hatchie National Wildlife Refuge, which is a popular destination for birdwatchers and nature lovers.
Economy
Friendship’s economy is largely based on agriculture. The town is home to several farms, which produce a variety of crops, including corn, soybeans, cotton, and wheat. The town also has a few small businesses, including a grocery store, a hardware store, and a few restaurants.
Demographics
As of the 2010 census, the population of Friendship was 1,000 people. The town is predominantly white, with a small African American population. The median household income in Friendship is $35,000, and the median age is 40 years old.
History
Friendship was founded in 1845 by a group of settlers from North Carolina. The town was named after the Friendship Baptist Church, which was established in the area in 1844. The town grew slowly over the years, and by the early 1900s, it had become a thriving agricultural community.
In the 1950s, Friendship experienced a period of growth and development. The town was connected to the nearby cities of Memphis and Nashville by a new highway, and the town’s population began to grow. In the late 1970s, the town was hit hard by the recession, and many of the businesses in town closed. However, the town has since recovered, and today it is a thriving community.
Conclusion
Friendship is a small town located in Crockett County, Tennessee. It is situated in the western part of the state, about halfway between Memphis and Nashville. The town was founded in 1845 and has a population of approximately 1,000 people. The town’s economy is largely based on agriculture, and it is home to several farms, small businesses, and restaurants. The town is predominantly white, with a small African American population. Friendship has a rich history and is a thriving community today.
Common Questions
What is Per Capita Income in Friendship?
Per Capita income in Friendship is $18,490.
What is the Median Family Income in Friendship?
Median Family Income in Friendship is $41,932.
What is the Median Household income in Friendship?
Median Household Income in Friendship is $33,036.
What is Income or Wage Gap in Friendship?
Income or Wage Gap in Friendship is 50.5%.
Women in Friendship earn 49.5 cents for every dollar earned by a man.
What is Family Income Deficit in Friendship?
Family Income Deficit in Friendship is $13,542.
Families that are below poverty line in Friendship earn $13,542 less on average than the poverty threshold level.
What is Inequality or Gini Index in Friendship?
Inequality or Gini Index in Friendship is 0.47.
What is the Total Population of Friendship?
Total Population of Friendship is 672.
What is the Total Male Population of Friendship?
Total Male Population of Friendship is 328.
What is the Total Female Population of Friendship?
Total Female Population of Friendship is 344.
What is the Ratio of Males per 100 Females in Friendship?
There are 95.35 Males per 100 Females in Friendship.
What is the Ratio of Females per 100 Males in Friendship?
There are 104.88 Females per 100 Males in Friendship.
What is the Median Population Age in Friendship?
Median Population Age in Friendship is 32.1 Years.
What is the Average Family Size in Friendship
Average Family Size in Friendship is 3.3 People.
What is the Average Household Size in Friendship
Average Household Size in Friendship is 2.3 People.
How Large is the Labor Force in Friendship?
There are 294 People in the Labor Forcein in Friendship.
What is the Percentage of People in the Labor Force in Friendship?
58.0% of People are in the Labor Force in Friendship.
What is the Unemployment Rate in Friendship?
Unemployment Rate in Friendship is 3.7%.