Centerville, TN Map & Demographics
Centerville Map
Centerville Overview
$24,643
PER CAPITA INCOME
$54,880
AVG FAMILY INCOME
$46,719
AVG HOUSEHOLD INCOME
12.3%
WAGE / INCOME GAP [ % ]
87.7¢/ $1
WAGE / INCOME GAP [ $ ]
0.41
INEQUALITY / GINI INDEX
3,515
TOTAL POPULATION
1,679
MALE POPULATION
1,836
FEMALE POPULATION
91.45
MALES / 100 FEMALES
109.35
FEMALES / 100 MALES
46.8
MEDIAN AGE
2.9
AVG FAMILY SIZE
2.4
AVG HOUSEHOLD SIZE
1,302
LABOR FORCE [ PEOPLE ]
43.6%
PERCENT IN LABOR FORCE
5.0%
UNEMPLOYMENT RATE
Centerville Zip Codes
Centerville Area Codes
Income in Centerville
Income Overview in Centerville
Per Capita Income in Centerville is $24,643, while median incomes of families and households are $54,880 and $46,719 respectively.
| Characteristic | Number | Measure |
| Per Capita Income | 3,515 | $24,643 |
| Median Family Income | 933 | $54,880 |
| Mean Family Income | 933 | $71,139 |
| Median Household Income | 1,383 | $46,719 |
| Mean Household Income | 1,383 | $59,671 |
| Income Deficit | 933 | $0 |
| Wage / Income Gap (%) | 3,515 | 12.33% |
| Wage / Income Gap ($) | 3,515 | 87.67¢ per $1 |
| Gini / Inequality Index | 3,515 | 0.41 |
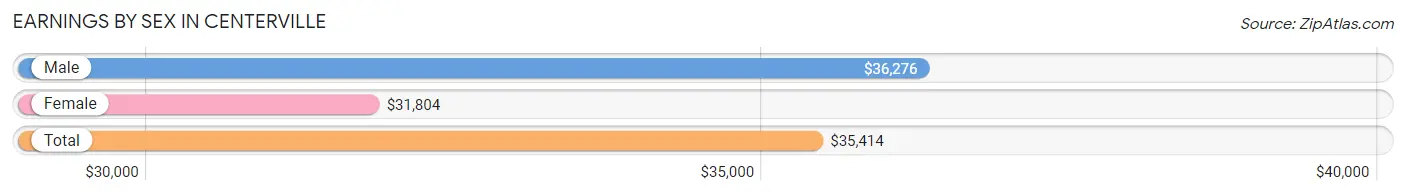
Earnings by Sex in Centerville
Average Earnings in Centerville are $35,414, $36,276 for men and $31,804 for women, a difference of 12.3%.
| Sex | Number | Average Earnings |
| Male | 857 (60.5%) | $36,276 |
| Female | 559 (39.5%) | $31,804 |
| Total | 1,416 (100.0%) | $35,414 |
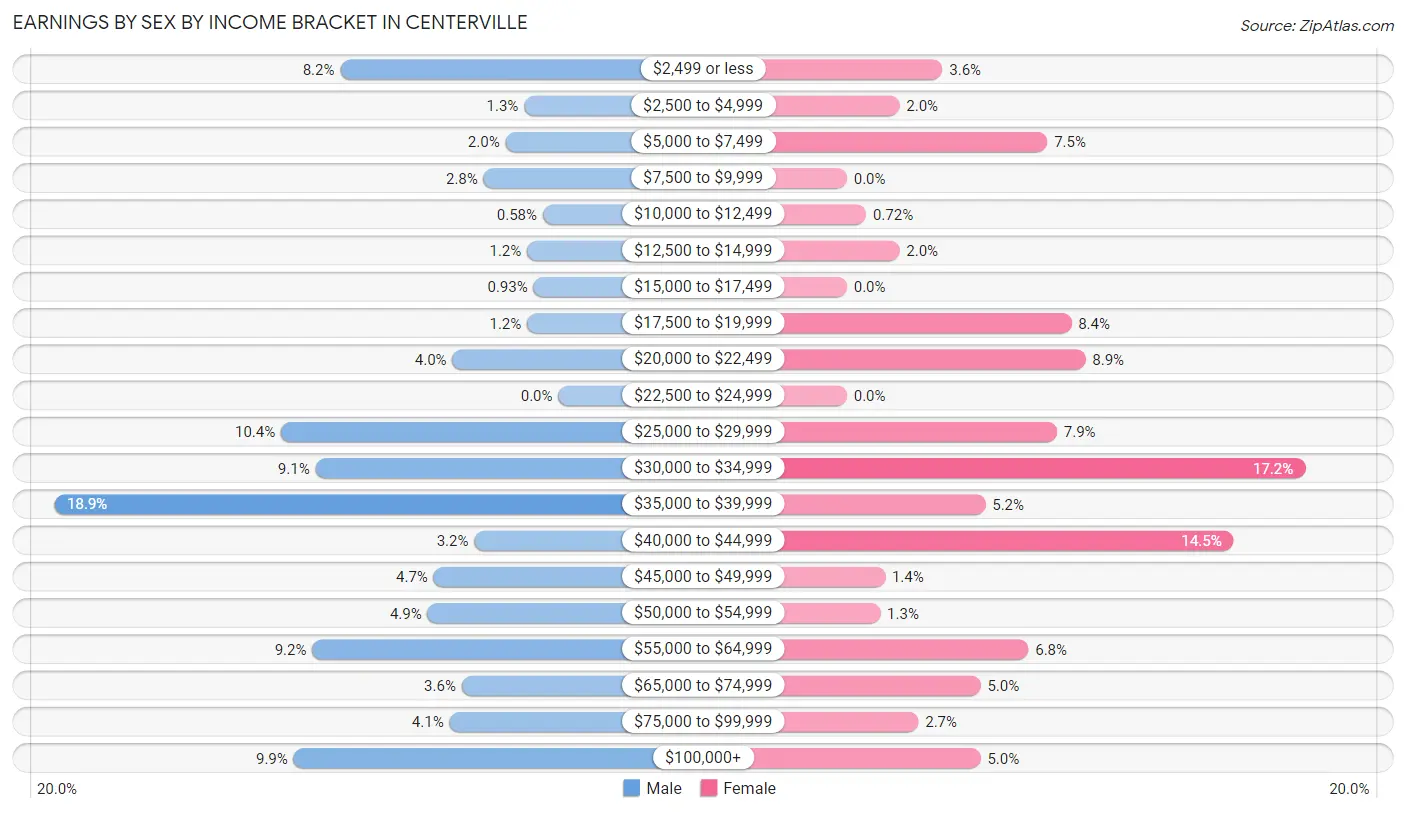
Earnings by Sex by Income Bracket in Centerville
The most common earnings brackets in Centerville are $35,000 to $39,999 for men (162 | 18.9%) and $30,000 to $34,999 for women (96 | 17.2%).
| Income | Male | Female |
| $2,499 or less | 70 (8.2%) | 20 (3.6%) |
| $2,500 to $4,999 | 11 (1.3%) | 11 (2.0%) |
| $5,000 to $7,499 | 17 (2.0%) | 42 (7.5%) |
| $7,500 to $9,999 | 24 (2.8%) | 0 (0.0%) |
| $10,000 to $12,499 | 5 (0.6%) | 4 (0.7%) |
| $12,500 to $14,999 | 10 (1.2%) | 11 (2.0%) |
| $15,000 to $17,499 | 8 (0.9%) | 0 (0.0%) |
| $17,500 to $19,999 | 10 (1.2%) | 47 (8.4%) |
| $20,000 to $22,499 | 34 (4.0%) | 50 (8.9%) |
| $22,500 to $24,999 | 0 (0.0%) | 0 (0.0%) |
| $25,000 to $29,999 | 89 (10.4%) | 44 (7.9%) |
| $30,000 to $34,999 | 78 (9.1%) | 96 (17.2%) |
| $35,000 to $39,999 | 162 (18.9%) | 29 (5.2%) |
| $40,000 to $44,999 | 27 (3.2%) | 81 (14.5%) |
| $45,000 to $49,999 | 40 (4.7%) | 8 (1.4%) |
| $50,000 to $54,999 | 42 (4.9%) | 7 (1.3%) |
| $55,000 to $64,999 | 79 (9.2%) | 38 (6.8%) |
| $65,000 to $74,999 | 31 (3.6%) | 28 (5.0%) |
| $75,000 to $99,999 | 35 (4.1%) | 15 (2.7%) |
| $100,000+ | 85 (9.9%) | 28 (5.0%) |
| Total | 857 (100.0%) | 559 (100.0%) |
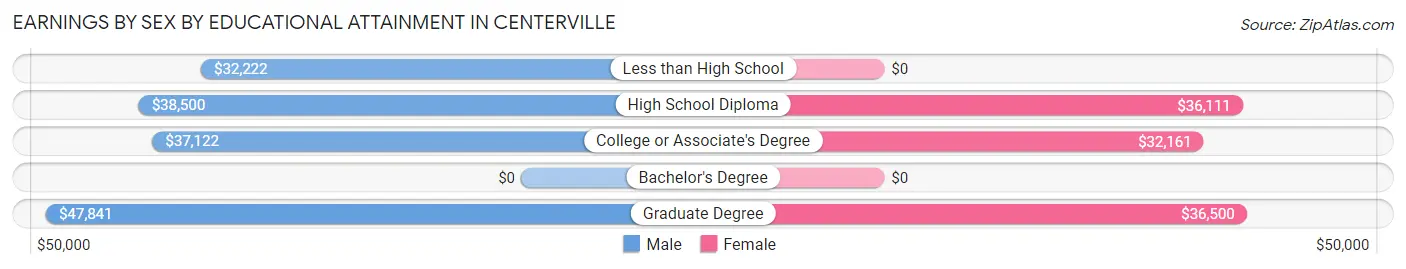
Earnings by Sex by Educational Attainment in Centerville
Average earnings in Centerville are $36,859 for men and $32,054 for women, a difference of 13.0%. Men with an educational attainment of graduate degree enjoy the highest average annual earnings of $47,841, while those with less than high school education earn the least with $32,222. Women with an educational attainment of graduate degree earn the most with the average annual earnings of $36,500, while those with college or associate's degree education have the smallest earnings of $32,161.
| Educational Attainment | Male Income | Female Income |
| Less than High School | $32,222 | $0 |
| High School Diploma | $38,500 | $36,111 |
| College or Associate's Degree | $37,122 | $32,161 |
| Bachelor's Degree | - | - |
| Graduate Degree | $47,841 | $36,500 |
| Total | $36,859 | $32,054 |
Family Income in Centerville
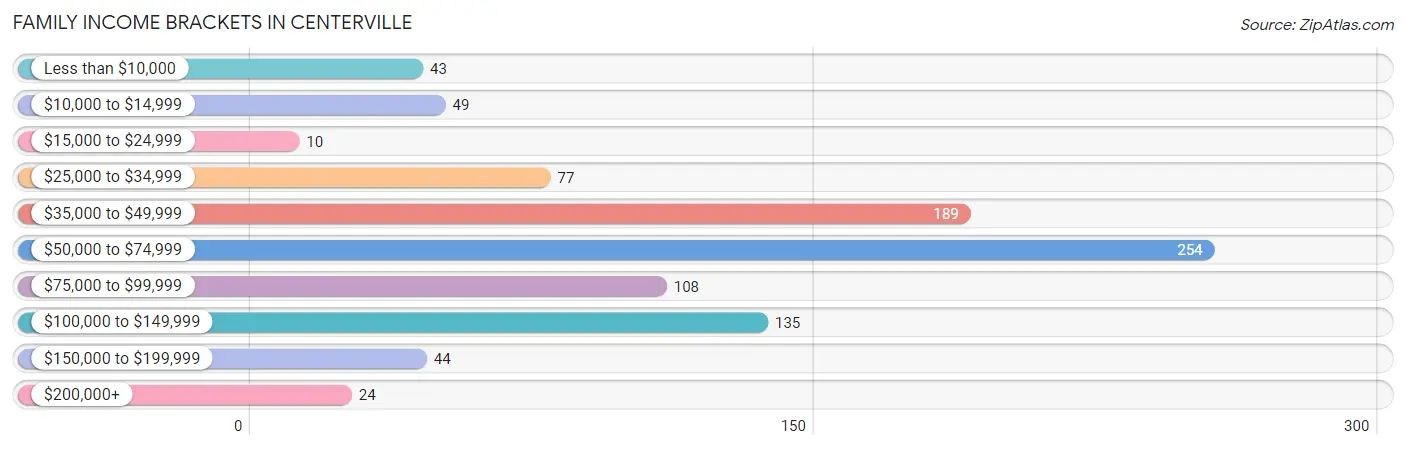
Family Income Brackets in Centerville
According to the Centerville family income data, there are 254 families falling into the $50,000 to $74,999 income range, which is the most common income bracket and makes up 27.2% of all families. Conversely, the $15,000 to $24,999 income bracket is the least frequent group with only 10 families (1.1%) belonging to this category.
| Income Bracket | # Families | % Families |
| Less than $10,000 | 43 | 4.6% |
| $10,000 to $14,999 | 49 | 5.3% |
| $15,000 to $24,999 | 10 | 1.1% |
| $25,000 to $34,999 | 77 | 8.3% |
| $35,000 to $49,999 | 189 | 20.3% |
| $50,000 to $74,999 | 254 | 27.2% |
| $75,000 to $99,999 | 108 | 11.6% |
| $100,000 to $149,999 | 135 | 14.5% |
| $150,000 to $199,999 | 44 | 4.7% |
| $200,000+ | 24 | 2.6% |
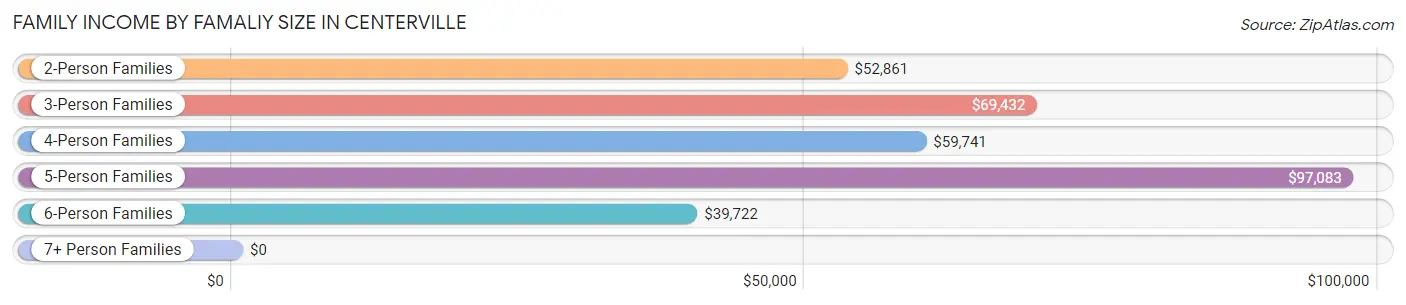
Family Income by Famaliy Size in Centerville
5-person families (54 | 5.8%) account for the highest median family income in Centerville with $97,083 per family, while 2-person families (570 | 61.1%) have the highest median income of $26,430 per family member.
| Income Bracket | # Families | Median Income |
| 2-Person Families | 570 (61.1%) | $52,861 |
| 3-Person Families | 122 (13.1%) | $69,432 |
| 4-Person Families | 140 (15.0%) | $59,741 |
| 5-Person Families | 54 (5.8%) | $97,083 |
| 6-Person Families | 32 (3.4%) | $39,722 |
| 7+ Person Families | 15 (1.6%) | $0 |
| Total | 933 (100.0%) | $54,880 |
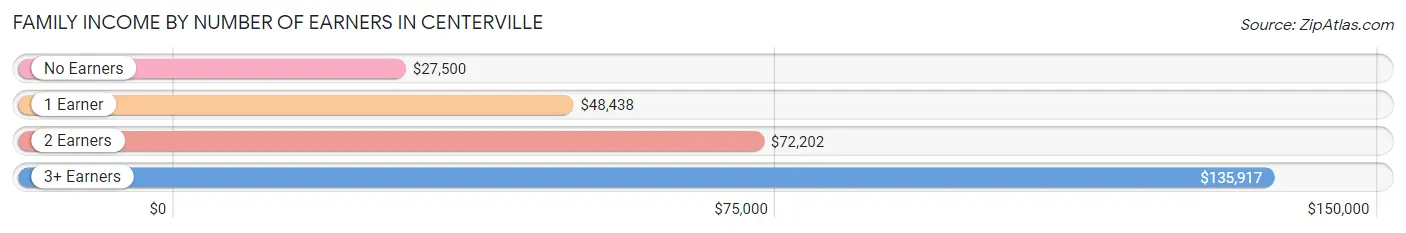
Family Income by Number of Earners in Centerville
The median family income in Centerville is $54,880, with families comprising 3+ earners (85) having the highest median family income of $135,917, while families with no earners (202) have the lowest median family income of $27,500, accounting for 9.1% and 21.6% of families, respectively.
| Number of Earners | # Families | Median Income |
| No Earners | 202 (21.6%) | $27,500 |
| 1 Earner | 341 (36.5%) | $48,438 |
| 2 Earners | 305 (32.7%) | $72,202 |
| 3+ Earners | 85 (9.1%) | $135,917 |
| Total | 933 (100.0%) | $54,880 |
Household Income in Centerville
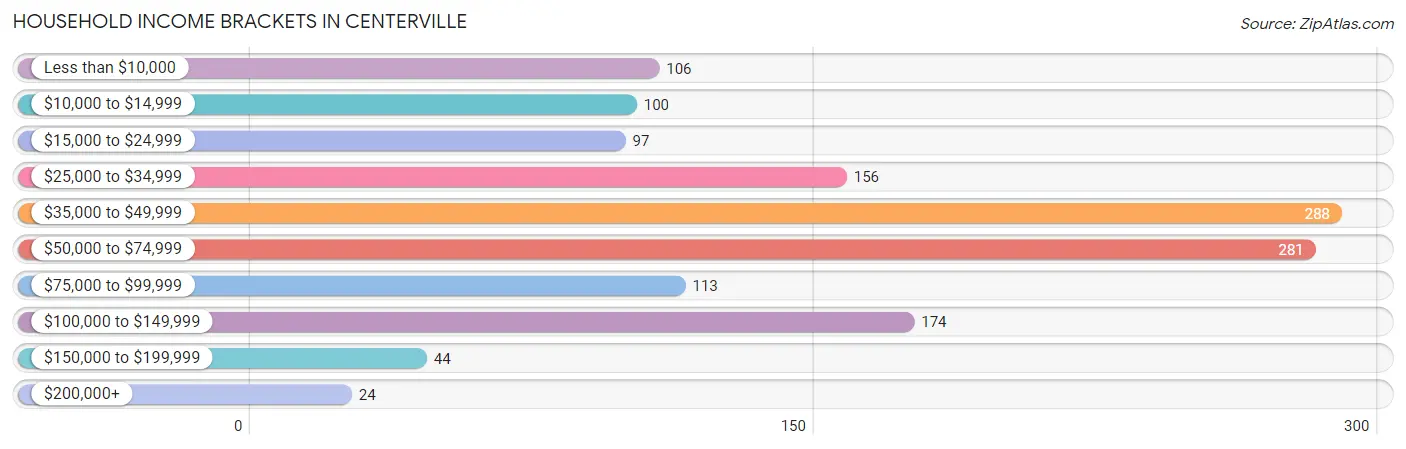
Household Income Brackets in Centerville
With 288 households falling in the category, the $35,000 to $49,999 income range is the most frequent in Centerville, accounting for 20.8% of all households. In contrast, only 24 households (1.7%) fall into the $200,000+ income bracket, making it the least populous group.
| Income Bracket | # Households | % Households |
| Less than $10,000 | 106 | 7.7% |
| $10,000 to $14,999 | 100 | 7.2% |
| $15,000 to $24,999 | 97 | 7.0% |
| $25,000 to $34,999 | 156 | 11.3% |
| $35,000 to $49,999 | 288 | 20.8% |
| $50,000 to $74,999 | 281 | 20.3% |
| $75,000 to $99,999 | 113 | 8.2% |
| $100,000 to $149,999 | 174 | 12.6% |
| $150,000 to $199,999 | 44 | 3.2% |
| $200,000+ | 24 | 1.7% |
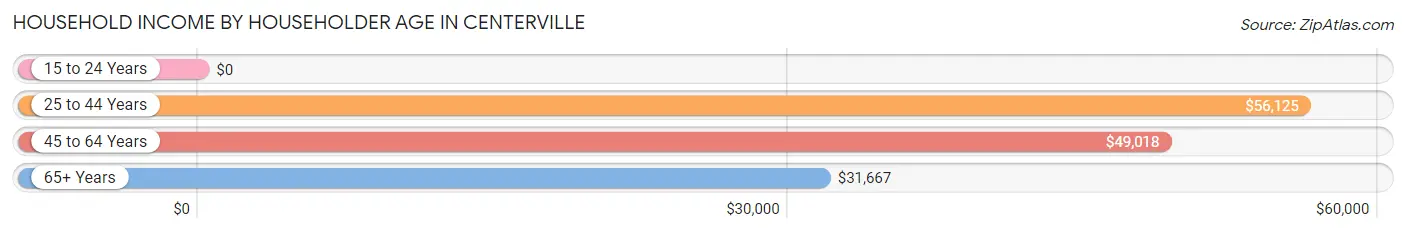
Household Income by Householder Age in Centerville
The median household income in Centerville is $46,719, with the highest median household income of $56,125 found in the 25 to 44 years age bracket for the primary householder. A total of 343 households (24.8%) fall into this category. Meanwhile, the 15 to 24 years age bracket for the primary householder has the lowest median household income of $0, with 26 households (1.9%) in this group.
| Income Bracket | # Households | Median Income |
| 15 to 24 Years | 26 (1.9%) | $0 |
| 25 to 44 Years | 343 (24.8%) | $56,125 |
| 45 to 64 Years | 568 (41.1%) | $49,018 |
| 65+ Years | 446 (32.3%) | $31,667 |
| Total | 1,383 (100.0%) | $46,719 |
Poverty in Centerville
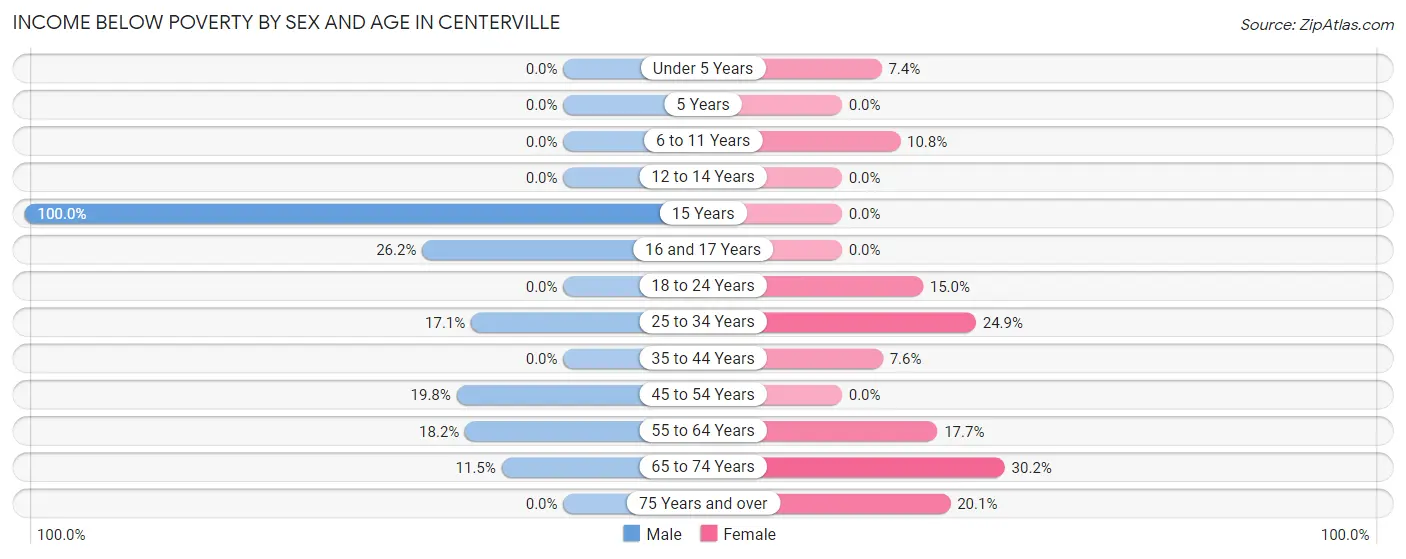
Income Below Poverty by Sex and Age in Centerville
With 12.2% poverty level for males and 14.7% for females among the residents of Centerville, 15 year old males and 65 to 74 year old females are the most vulnerable to poverty, with 11 males (100.0%) and 65 females (30.2%) in their respective age groups living below the poverty level.
| Age Bracket | Male | Female |
| Under 5 Years | 0 (0.0%) | 14 (7.4%) |
| 5 Years | 0 (0.0%) | 0 (0.0%) |
| 6 to 11 Years | 0 (0.0%) | 8 (10.8%) |
| 12 to 14 Years | 0 (0.0%) | 0 (0.0%) |
| 15 Years | 11 (100.0%) | 0 (0.0%) |
| 16 and 17 Years | 11 (26.2%) | 0 (0.0%) |
| 18 to 24 Years | 0 (0.0%) | 23 (15.0%) |
| 25 to 34 Years | 50 (17.1%) | 52 (24.9%) |
| 35 to 44 Years | 0 (0.0%) | 12 (7.6%) |
| 45 to 54 Years | 64 (19.8%) | 0 (0.0%) |
| 55 to 64 Years | 37 (18.2%) | 48 (17.7%) |
| 65 to 74 Years | 18 (11.5%) | 65 (30.2%) |
| 75 Years and over | 0 (0.0%) | 32 (20.1%) |
| Total | 191 (12.2%) | 254 (14.7%) |
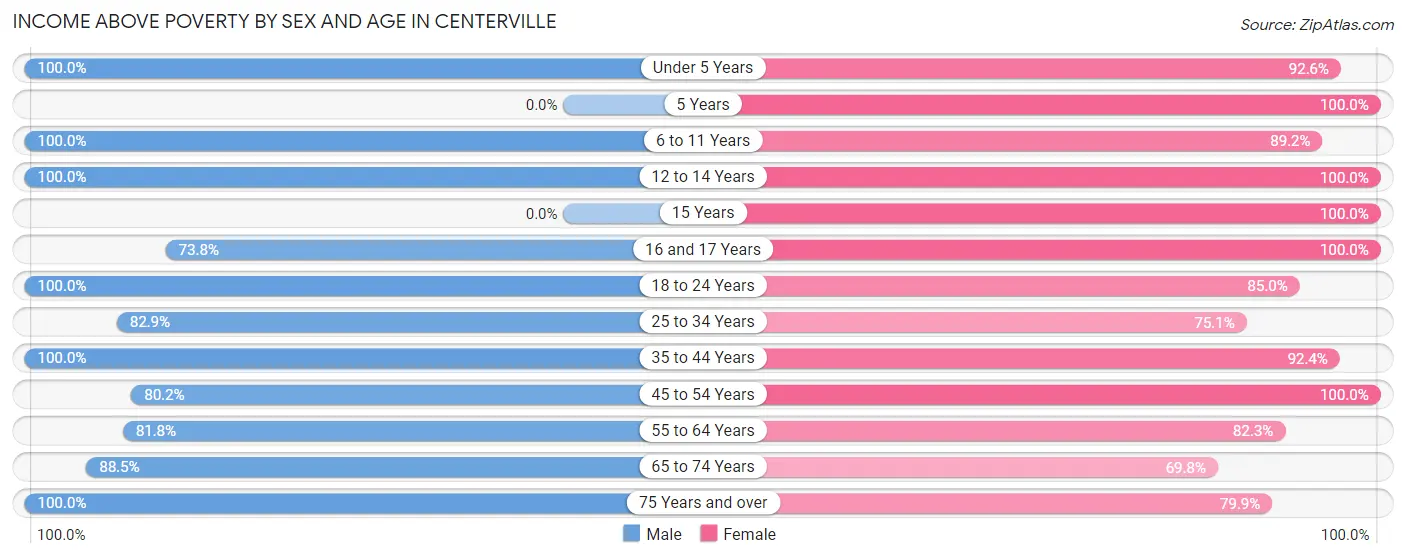
Income Above Poverty by Sex and Age in Centerville
According to the poverty statistics in Centerville, males aged under 5 years and females aged 5 years are the age groups that are most secure financially, with 100.0% of males and 100.0% of females in these age groups living above the poverty line.
| Age Bracket | Male | Female |
| Under 5 Years | 39 (100.0%) | 176 (92.6%) |
| 5 Years | 0 (0.0%) | 68 (100.0%) |
| 6 to 11 Years | 88 (100.0%) | 66 (89.2%) |
| 12 to 14 Years | 30 (100.0%) | 15 (100.0%) |
| 15 Years | 0 (0.0%) | 13 (100.0%) |
| 16 and 17 Years | 31 (73.8%) | 37 (100.0%) |
| 18 to 24 Years | 80 (100.0%) | 130 (85.0%) |
| 25 to 34 Years | 242 (82.9%) | 157 (75.1%) |
| 35 to 44 Years | 148 (100.0%) | 146 (92.4%) |
| 45 to 54 Years | 259 (80.2%) | 165 (100.0%) |
| 55 to 64 Years | 166 (81.8%) | 223 (82.3%) |
| 65 to 74 Years | 139 (88.5%) | 150 (69.8%) |
| 75 Years and over | 153 (100.0%) | 127 (79.9%) |
| Total | 1,375 (87.8%) | 1,473 (85.3%) |
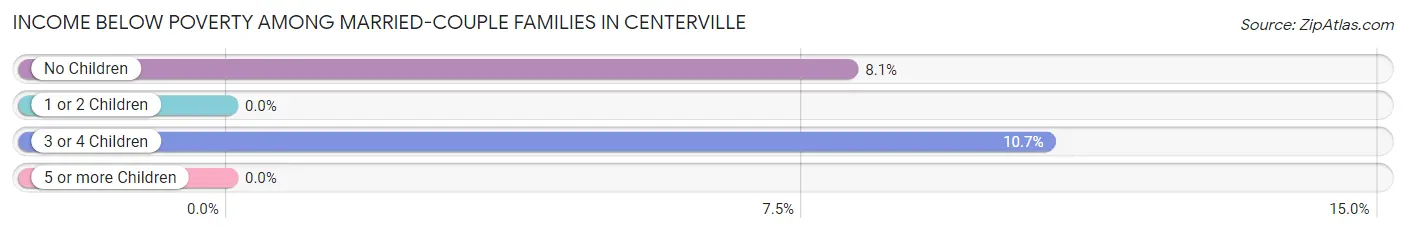
Income Below Poverty Among Married-Couple Families in Centerville
The poverty statistics for married-couple families in Centerville show that 6.7% or 48 of the total 713 families live below the poverty line. Families with 3 or 4 children have the highest poverty rate of 10.7%, comprising of 8 families. On the other hand, families with 1 or 2 children have the lowest poverty rate of 0.0%, which includes 0 families.
| Children | Above Poverty | Below Poverty |
| No Children | 454 (91.9%) | 40 (8.1%) |
| 1 or 2 Children | 144 (100.0%) | 0 (0.0%) |
| 3 or 4 Children | 67 (89.3%) | 8 (10.7%) |
| 5 or more Children | 0 (0.0%) | 0 (0.0%) |
| Total | 665 (93.3%) | 48 (6.7%) |
Income Below Poverty Among Single-Parent Households in Centerville
According to the poverty data in Centerville, 35.7% or 45 single-father households and 7.4% or 7 single-mother households are living below the poverty line. Among single-father households, those with no children have the highest poverty rate, with 45 households (38.5%) experiencing poverty. Likewise, among single-mother households, those with 1 or 2 children have the highest poverty rate, with 7 households (43.8%) falling below the poverty line.
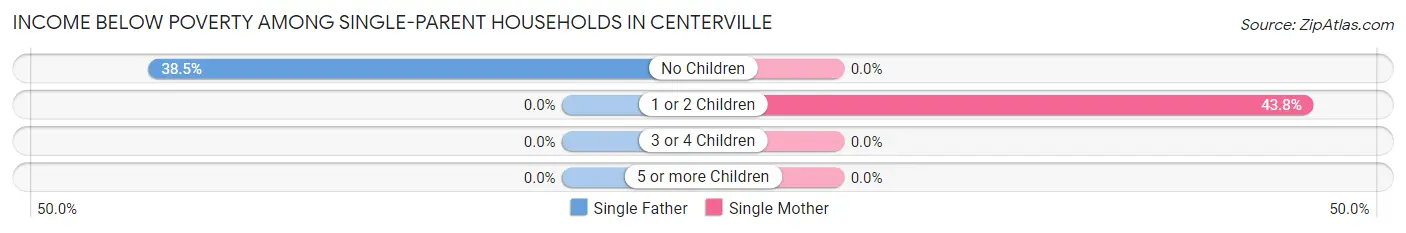
| Children | Single Father | Single Mother |
| No Children | 45 (38.5%) | 0 (0.0%) |
| 1 or 2 Children | 0 (0.0%) | 7 (43.8%) |
| 3 or 4 Children | 0 (0.0%) | 0 (0.0%) |
| 5 or more Children | 0 (0.0%) | 0 (0.0%) |
| Total | 45 (35.7%) | 7 (7.4%) |
Income Below Poverty Among Married-Couple vs Single-Parent Households in Centerville
The poverty data for Centerville shows that 48 of the married-couple family households (6.7%) and 52 of the single-parent households (23.6%) are living below the poverty level. Within the married-couple family households, those with 3 or 4 children have the highest poverty rate, with 8 households (10.7%) falling below the poverty line. Among the single-parent households, those with 1 or 2 children have the highest poverty rate, with 7 household (28.0%) living below poverty.
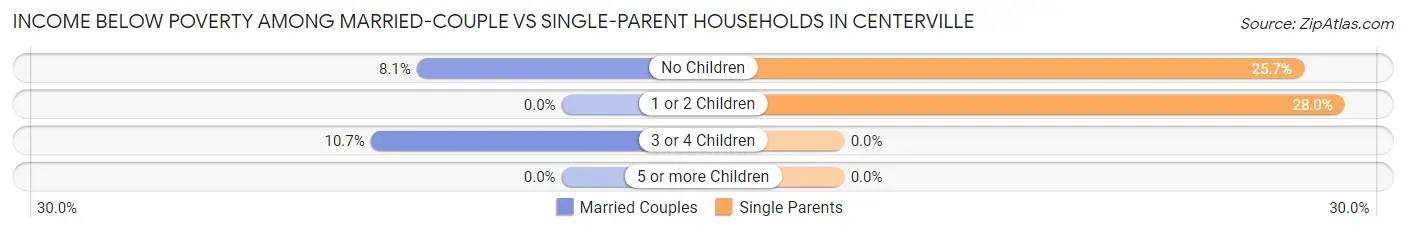
| Children | Married-Couple Families | Single-Parent Households |
| No Children | 40 (8.1%) | 45 (25.7%) |
| 1 or 2 Children | 0 (0.0%) | 7 (28.0%) |
| 3 or 4 Children | 8 (10.7%) | 0 (0.0%) |
| 5 or more Children | 0 (0.0%) | 0 (0.0%) |
| Total | 48 (6.7%) | 52 (23.6%) |
Race in Centerville
The most populous races in Centerville are White / Caucasian (3,284 | 93.4%), Hispanic or Latino (195 | 5.6%), and Black / African American (125 | 3.6%).
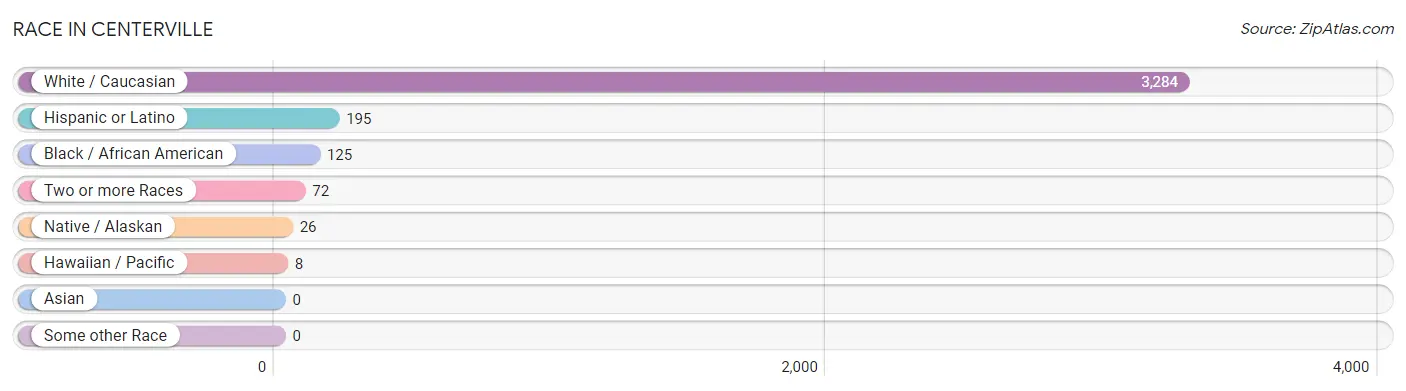
| Race | # Population | % Population |
| Asian | 0 | 0.0% |
| Black / African American | 125 | 3.6% |
| Hawaiian / Pacific | 8 | 0.2% |
| Hispanic or Latino | 195 | 5.6% |
| Native / Alaskan | 26 | 0.7% |
| White / Caucasian | 3,284 | 93.4% |
| Two or more Races | 72 | 2.1% |
| Some other Race | 0 | 0.0% |
| Total | 3,515 | 100.0% |
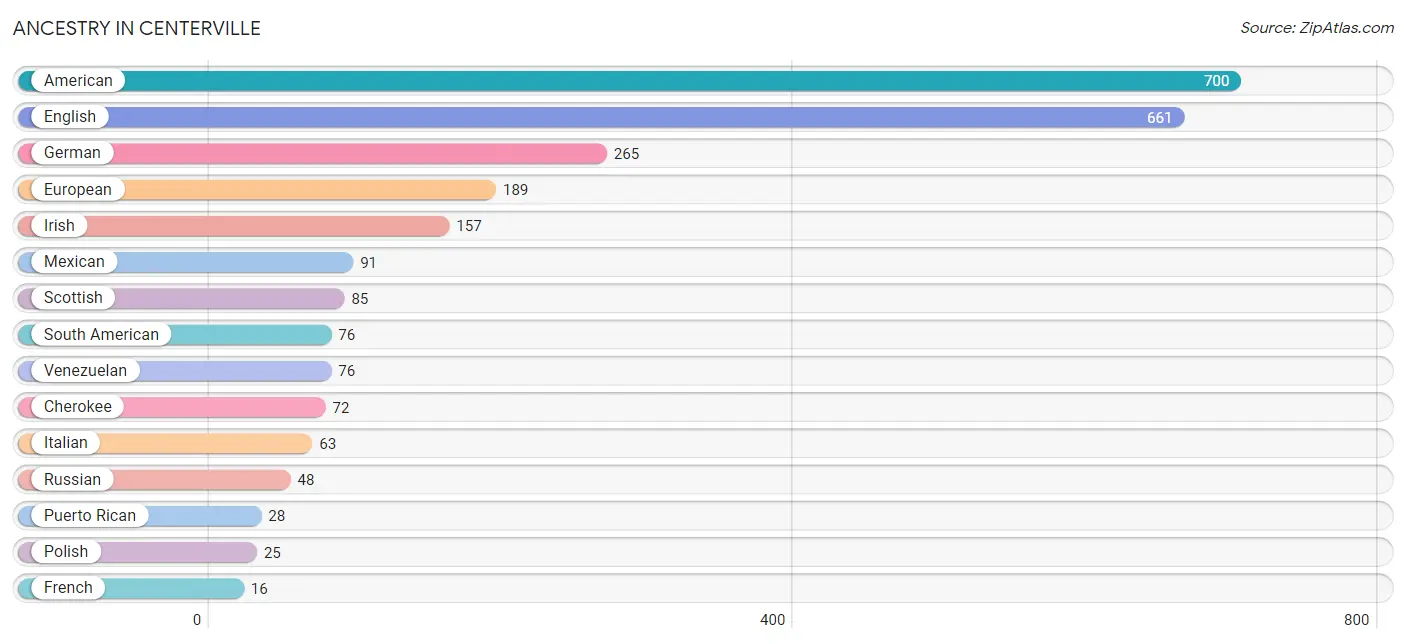
Ancestry in Centerville
The most populous ancestries reported in Centerville are American (700 | 19.9%), English (661 | 18.8%), German (265 | 7.5%), European (189 | 5.4%), and Irish (157 | 4.5%), together accounting for 56.1% of all Centerville residents.
| Ancestry | # Population | % Population |
| American | 700 | 19.9% |
| Austrian | 13 | 0.4% |
| British | 10 | 0.3% |
| Cajun | 12 | 0.3% |
| Celtic | 9 | 0.3% |
| Cherokee | 72 | 2.1% |
| Delaware | 5 | 0.1% |
| Dutch | 3 | 0.1% |
| English | 661 | 18.8% |
| European | 189 | 5.4% |
| French | 16 | 0.5% |
| German | 265 | 7.5% |
| Irish | 157 | 4.5% |
| Italian | 63 | 1.8% |
| Mexican | 91 | 2.6% |
| Native Hawaiian | 8 | 0.2% |
| Polish | 25 | 0.7% |
| Puerto Rican | 28 | 0.8% |
| Russian | 48 | 1.4% |
| Scotch-Irish | 12 | 0.3% |
| Scottish | 85 | 2.4% |
| South American | 76 | 2.2% |
| Swiss | 2 | 0.1% |
| Venezuelan | 76 | 2.2% |
| Welsh | 8 | 0.2% | View All 25 Rows |
Immigrants in Centerville
The most numerous immigrant groups reported in Centerville came from Europe (6 | 0.2%), and Northern Europe (6 | 0.2%), together accounting for 0.3% of all Centerville residents.

| Immigration Origin | # Population | % Population |
| Europe | 6 | 0.2% |
| Northern Europe | 6 | 0.2% | View All 2 Rows |
Sex and Age in Centerville
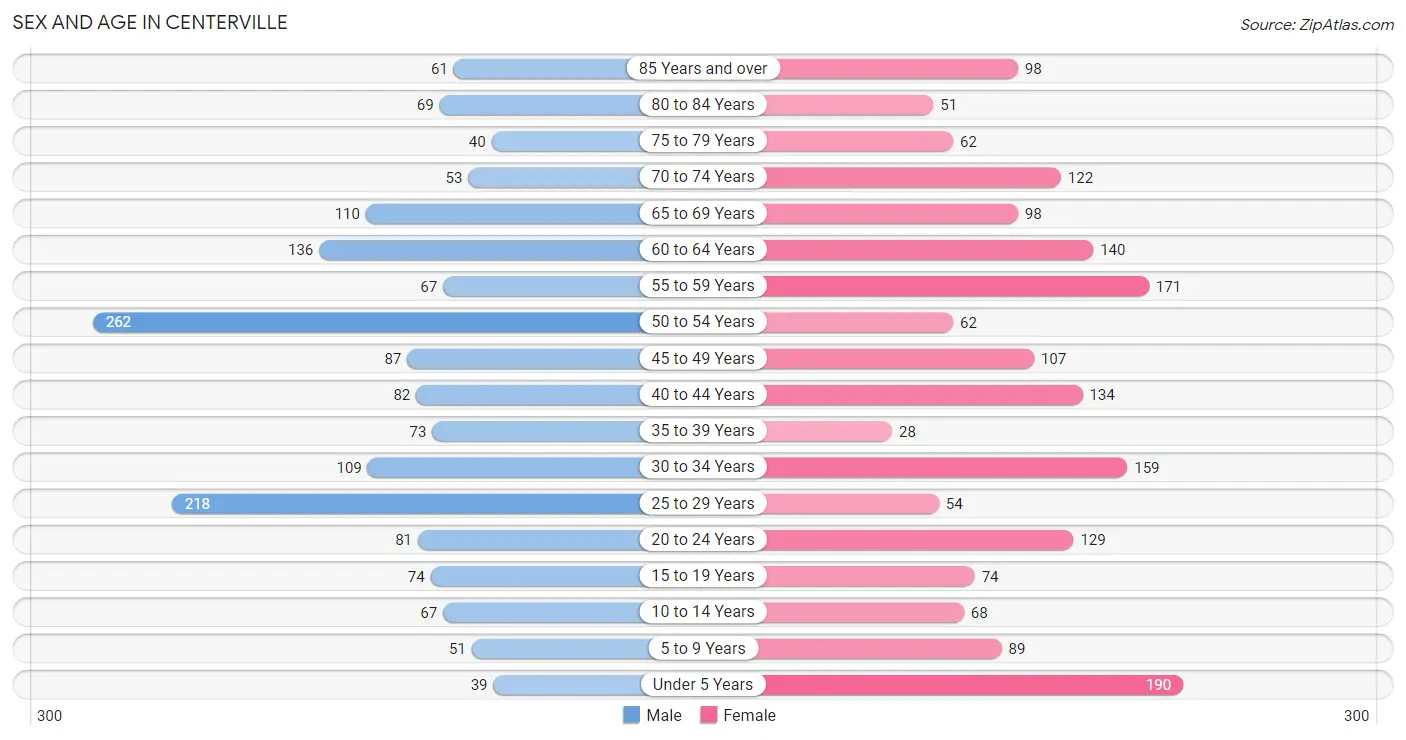
Sex and Age in Centerville
The most populous age groups in Centerville are 50 to 54 Years (262 | 15.6%) for men and Under 5 Years (190 | 10.3%) for women.
| Age Bracket | Male | Female |
| Under 5 Years | 39 (2.3%) | 190 (10.3%) |
| 5 to 9 Years | 51 (3.0%) | 89 (4.9%) |
| 10 to 14 Years | 67 (4.0%) | 68 (3.7%) |
| 15 to 19 Years | 74 (4.4%) | 74 (4.0%) |
| 20 to 24 Years | 81 (4.8%) | 129 (7.0%) |
| 25 to 29 Years | 218 (13.0%) | 54 (2.9%) |
| 30 to 34 Years | 109 (6.5%) | 159 (8.7%) |
| 35 to 39 Years | 73 (4.3%) | 28 (1.5%) |
| 40 to 44 Years | 82 (4.9%) | 134 (7.3%) |
| 45 to 49 Years | 87 (5.2%) | 107 (5.8%) |
| 50 to 54 Years | 262 (15.6%) | 62 (3.4%) |
| 55 to 59 Years | 67 (4.0%) | 171 (9.3%) |
| 60 to 64 Years | 136 (8.1%) | 140 (7.6%) |
| 65 to 69 Years | 110 (6.6%) | 98 (5.3%) |
| 70 to 74 Years | 53 (3.2%) | 122 (6.6%) |
| 75 to 79 Years | 40 (2.4%) | 62 (3.4%) |
| 80 to 84 Years | 69 (4.1%) | 51 (2.8%) |
| 85 Years and over | 61 (3.6%) | 98 (5.3%) |
| Total | 1,679 (100.0%) | 1,836 (100.0%) |
Families and Households in Centerville
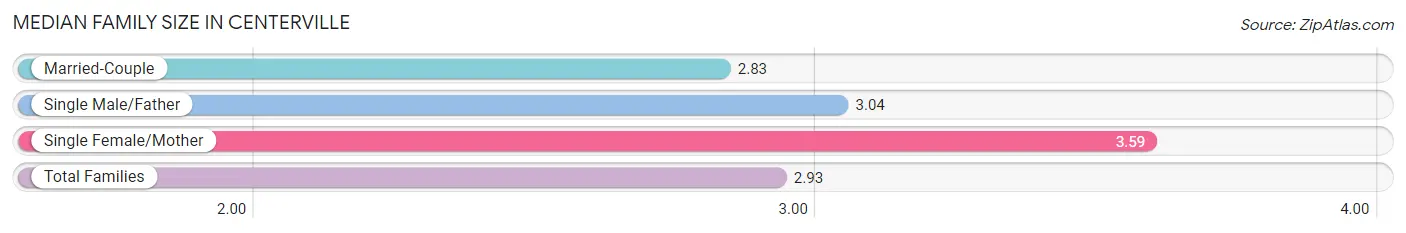
Median Family Size in Centerville
The median family size in Centerville is 2.93 persons per family, with single female/mother families (94 | 10.1%) accounting for the largest median family size of 3.59 persons per family. On the other hand, married-couple families (713 | 76.4%) represent the smallest median family size with 2.83 persons per family.
| Family Type | # Families | Family Size |
| Married-Couple | 713 (76.4%) | 2.83 |
| Single Male/Father | 126 (13.5%) | 3.04 |
| Single Female/Mother | 94 (10.1%) | 3.59 |
| Total Families | 933 (100.0%) | 2.93 |
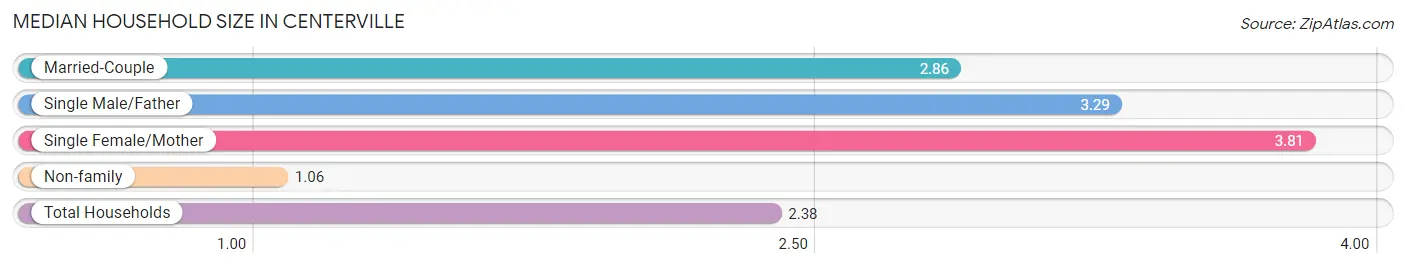
Median Household Size in Centerville
The median household size in Centerville is 2.38 persons per household, with single female/mother households (94 | 6.8%) accounting for the largest median household size of 3.81 persons per household. non-family households (450 | 32.5%) represent the smallest median household size with 1.06 persons per household.
| Household Type | # Households | Household Size |
| Married-Couple | 713 (51.5%) | 2.86 |
| Single Male/Father | 126 (9.1%) | 3.29 |
| Single Female/Mother | 94 (6.8%) | 3.81 |
| Non-family | 450 (32.5%) | 1.06 |
| Total Households | 1,383 (100.0%) | 2.38 |
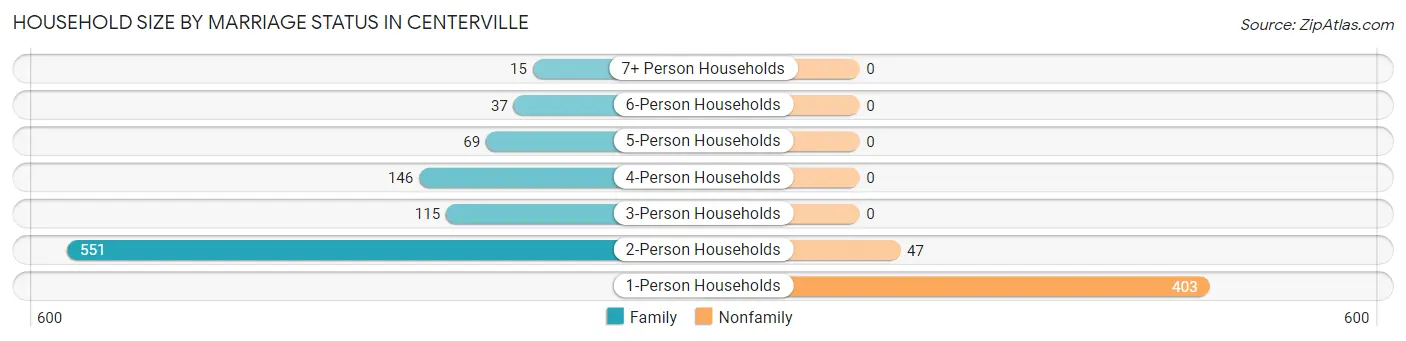
Household Size by Marriage Status in Centerville
Out of a total of 1,383 households in Centerville, 933 (67.5%) are family households, while 450 (32.5%) are nonfamily households. The most numerous type of family households are 2-person households, comprising 551, and the most common type of nonfamily households are 1-person households, comprising 403.
| Household Size | Family Households | Nonfamily Households |
| 1-Person Households | - | 403 (29.1%) |
| 2-Person Households | 551 (39.8%) | 47 (3.4%) |
| 3-Person Households | 115 (8.3%) | 0 (0.0%) |
| 4-Person Households | 146 (10.6%) | 0 (0.0%) |
| 5-Person Households | 69 (5.0%) | 0 (0.0%) |
| 6-Person Households | 37 (2.7%) | 0 (0.0%) |
| 7+ Person Households | 15 (1.1%) | 0 (0.0%) |
| Total | 933 (67.5%) | 450 (32.5%) |
Female Fertility in Centerville
Fertility by Age in Centerville
Average fertility rate in Centerville is 82.0 births per 1,000 women. Women in the age bracket of 15 to 19 years have the highest fertility rate with 122.0 births per 1,000 women. Women in the age bracket of 20 to 34 years acount for 69.6% of all women with births.
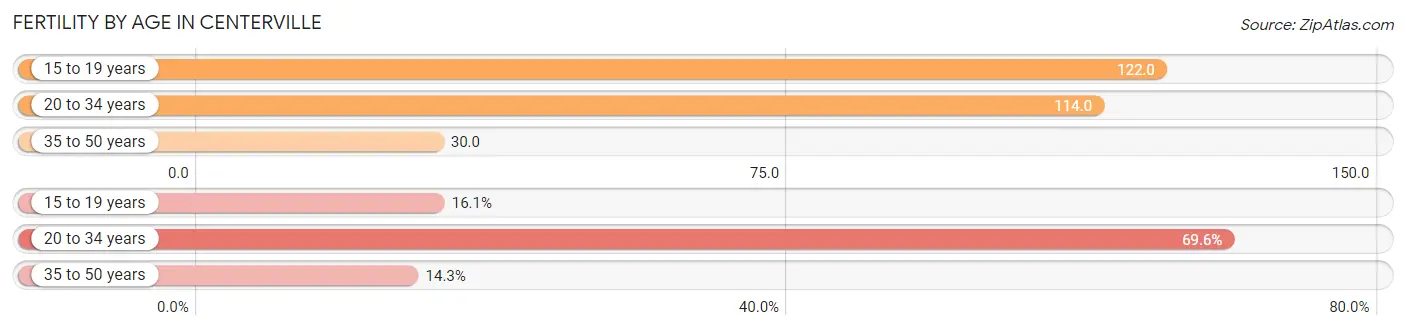
| Age Bracket | Women with Births | Births / 1,000 Women |
| 15 to 19 years | 9 (16.1%) | 122.0 |
| 20 to 34 years | 39 (69.6%) | 114.0 |
| 35 to 50 years | 8 (14.3%) | 30.0 |
| Total | 56 (100.0%) | 82.0 |
Fertility by Age by Marriage Status in Centerville
83.9% of women with births (56) in Centerville are married. The highest percentage of unmarried women with births falls into 15 to 19 years age bracket with 100.0% of them unmarried at the time of birth, while the lowest percentage of unmarried women with births belong to 20 to 34 years age bracket with 0.0% of them unmarried.
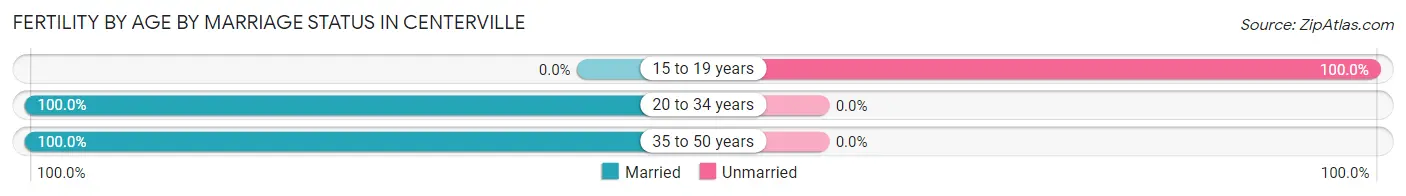
| Age Bracket | Married | Unmarried |
| 15 to 19 years | 0 (0.0%) | 9 (100.0%) |
| 20 to 34 years | 39 (100.0%) | 0 (0.0%) |
| 35 to 50 years | 8 (100.0%) | 0 (0.0%) |
| Total | 47 (83.9%) | 9 (16.1%) |
Fertility by Education in Centerville
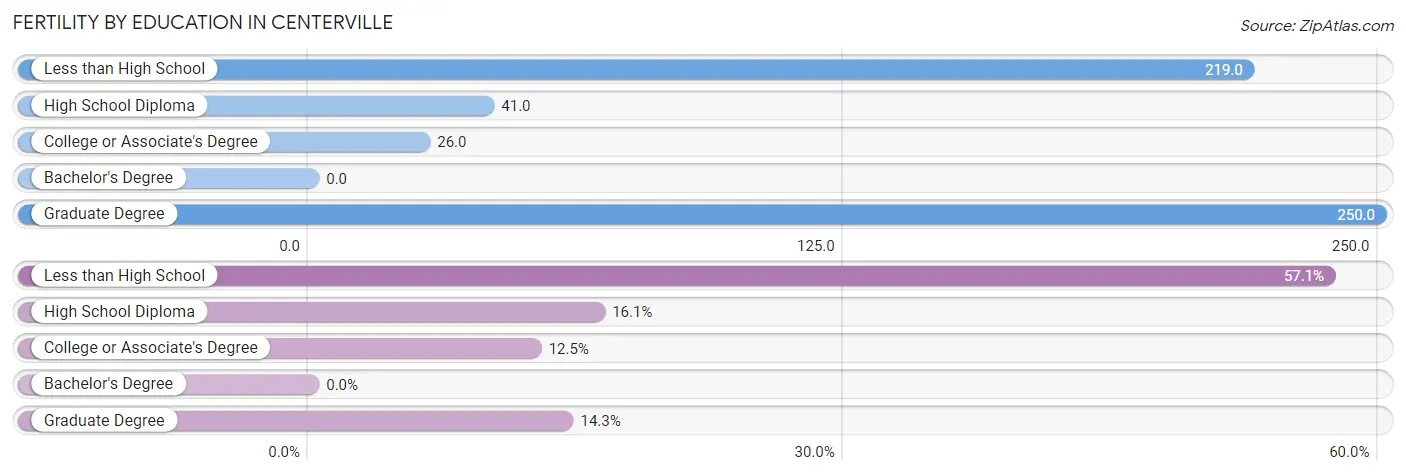
| Educational Attainment | Women with Births | Births / 1,000 Women |
| Less than High School | 32 (57.1%) | 219.0 |
| High School Diploma | 9 (16.1%) | 41.0 |
| College or Associate's Degree | 7 (12.5%) | 26.0 |
| Bachelor's Degree | 0 (0.0%) | 0.0 |
| Graduate Degree | 8 (14.3%) | 250.0 |
| Total | 56 (100.0%) | 82.0 |
Fertility by Education by Marriage Status in Centerville
16.1% of women with births in Centerville are unmarried. Women with the educational attainment of less than high school are most likely to be married with 100.0% of them married at childbirth, while women with the educational attainment of high school diploma are least likely to be married with 100.0% of them unmarried at childbirth.
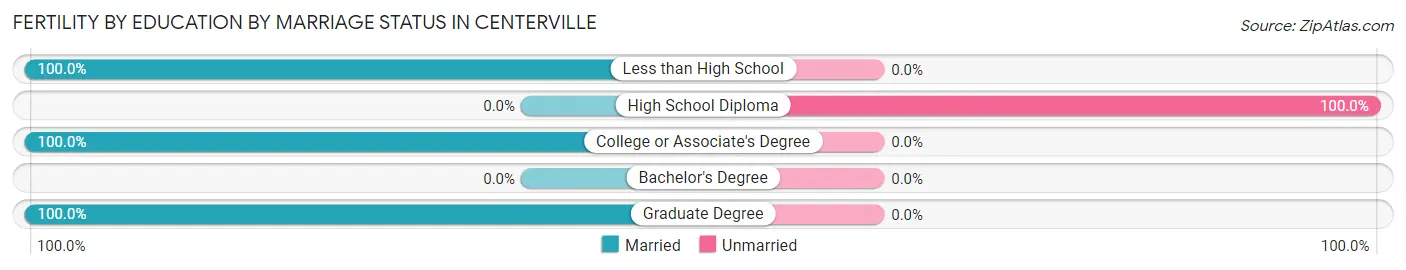
| Educational Attainment | Married | Unmarried |
| Less than High School | 32 (100.0%) | 0 (0.0%) |
| High School Diploma | 0 (0.0%) | 9 (100.0%) |
| College or Associate's Degree | 7 (100.0%) | 0 (0.0%) |
| Bachelor's Degree | 0 (0.0%) | 0 (0.0%) |
| Graduate Degree | 8 (100.0%) | 0 (0.0%) |
| Total | 47 (83.9%) | 9 (16.1%) |
Employment Characteristics in Centerville
Employment by Class of Employer in Centerville
Among the 1,223 employed individuals in Centerville, private company employees (879 | 71.9%), local government employees (221 | 18.1%), and not-for-profit organizations (62 | 5.1%) make up the most common classes of employment.
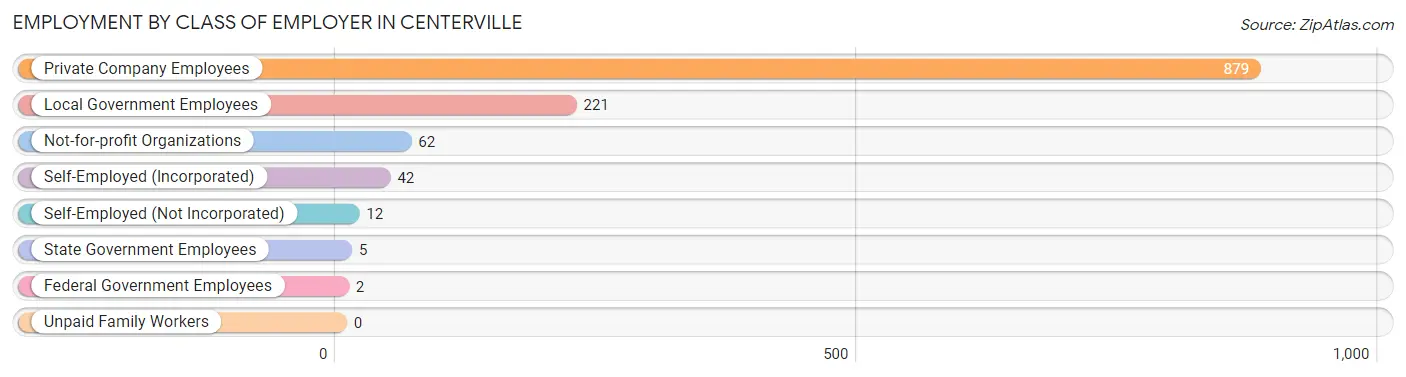
| Employer Class | # Employees | % Employees |
| Private Company Employees | 879 | 71.9% |
| Self-Employed (Incorporated) | 42 | 3.4% |
| Self-Employed (Not Incorporated) | 12 | 1.0% |
| Not-for-profit Organizations | 62 | 5.1% |
| Local Government Employees | 221 | 18.1% |
| State Government Employees | 5 | 0.4% |
| Federal Government Employees | 2 | 0.2% |
| Unpaid Family Workers | 0 | 0.0% |
| Total | 1,223 | 100.0% |
Employment Status by Age in Centerville
According to the labor force statistics for Centerville, out of the total population over 16 years of age (2,987), 43.6% or 1,302 individuals are in the labor force, with 5.0% or 65 of them unemployed. The age group with the highest labor force participation rate is 25 to 29 years, with 84.6% or 230 individuals in the labor force. Within the labor force, the 35 to 44 years age range has the highest percentage of unemployed individuals, with 14.5% or 32 of them being unemployed.
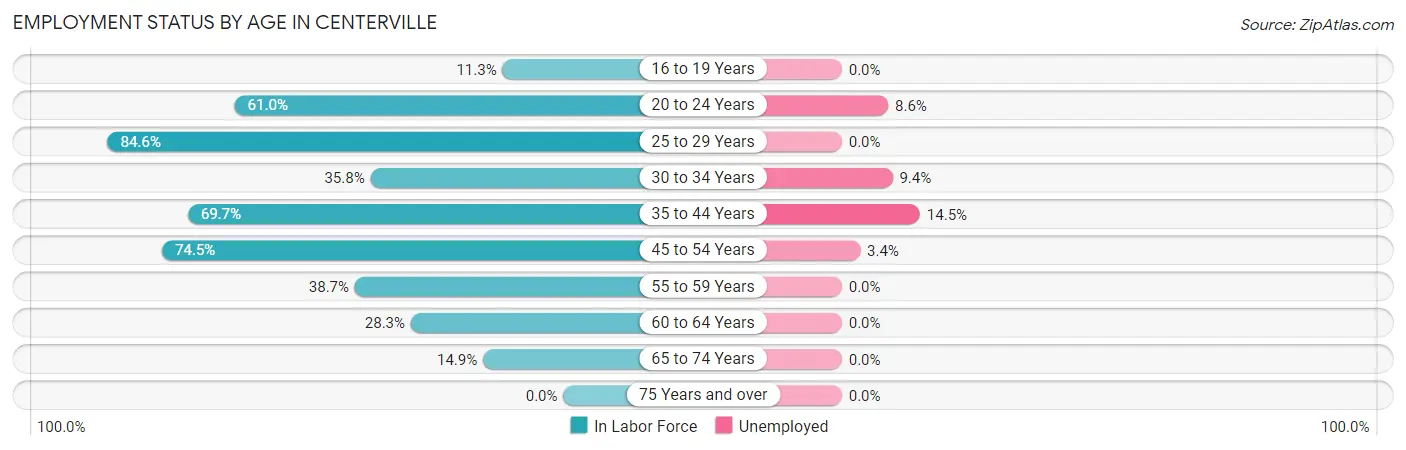
| Age Bracket | In Labor Force | Unemployed |
| 16 to 19 Years | 14 (11.3%) | 0 (0.0%) |
| 20 to 24 Years | 128 (61.0%) | 11 (8.6%) |
| 25 to 29 Years | 230 (84.6%) | 0 (0.0%) |
| 30 to 34 Years | 96 (35.8%) | 9 (9.4%) |
| 35 to 44 Years | 221 (69.7%) | 32 (14.5%) |
| 45 to 54 Years | 386 (74.5%) | 13 (3.4%) |
| 55 to 59 Years | 92 (38.7%) | 0 (0.0%) |
| 60 to 64 Years | 78 (28.3%) | 0 (0.0%) |
| 65 to 74 Years | 57 (14.9%) | 0 (0.0%) |
| 75 Years and over | 0 (0.0%) | 0 (0.0%) |
| Total | 1,302 (43.6%) | 65 (5.0%) |
Employment Status by Educational Attainment in Centerville
According to labor force statistics for Centerville, 58.4% of individuals (1,103) out of the total population between 25 and 64 years of age (1,889) are in the labor force, with 4.9% or 54 of them being unemployed. The group with the highest labor force participation rate are those with the educational attainment of bachelor's degree or higher, with 79.3% or 153 individuals in the labor force. Within the labor force, individuals with less than high school education have the highest percentage of unemployment, with 10.4% or 15 of them being unemployed.
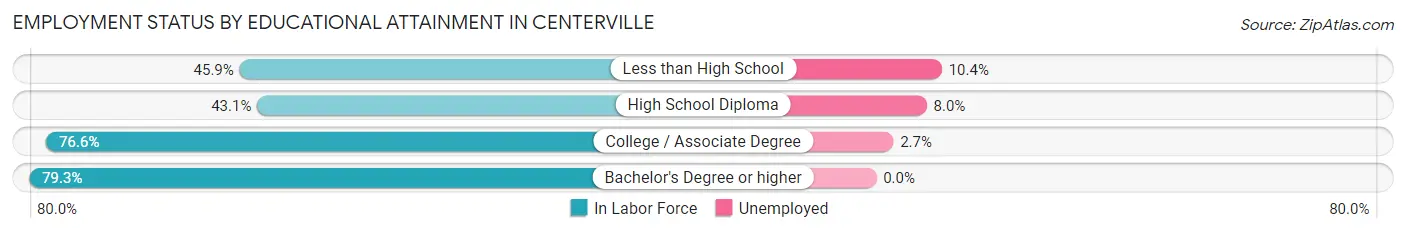
| Educational Attainment | In Labor Force | Unemployed |
| Less than High School | 144 (45.9%) | 33 (10.4%) |
| High School Diploma | 325 (43.1%) | 60 (8.0%) |
| College / Associate Degree | 481 (76.6%) | 17 (2.7%) |
| Bachelor's Degree or higher | 153 (79.3%) | 0 (0.0%) |
| Total | 1,103 (58.4%) | 93 (4.9%) |
Employment Occupations by Sex in Centerville
Management, Business, Science and Arts Occupations
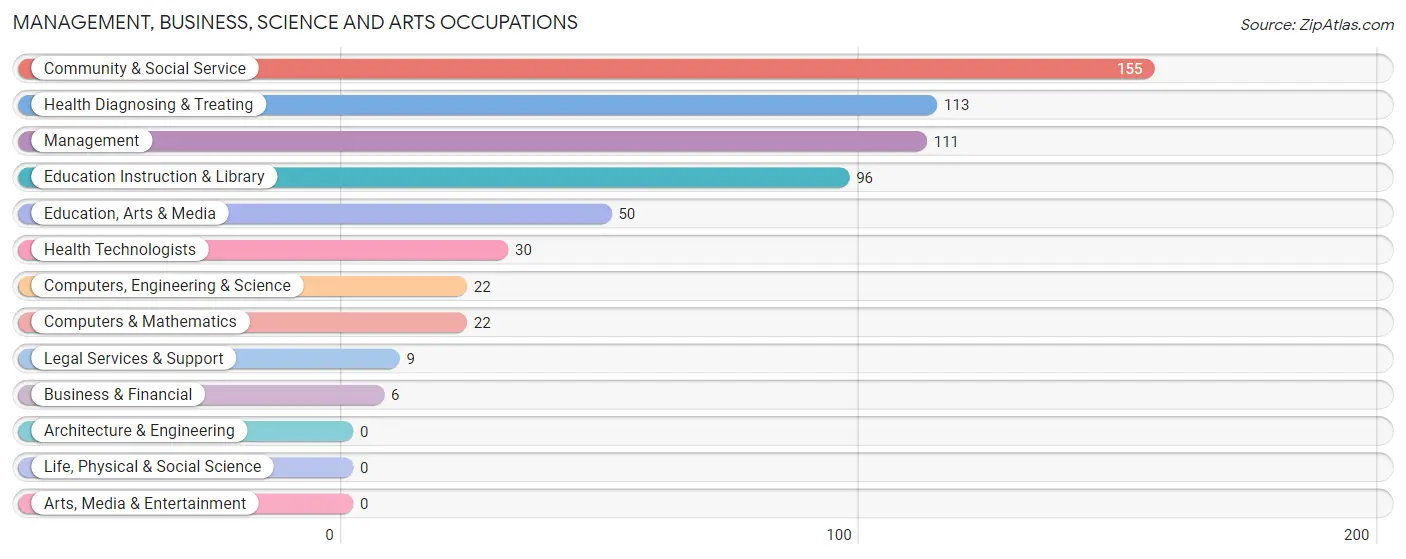
The most common Management, Business, Science and Arts occupations in Centerville are Community & Social Service (155 | 12.5%), Health Diagnosing & Treating (113 | 9.1%), Management (111 | 9.0%), Education Instruction & Library (96 | 7.8%), and Education, Arts & Media (50 | 4.0%).
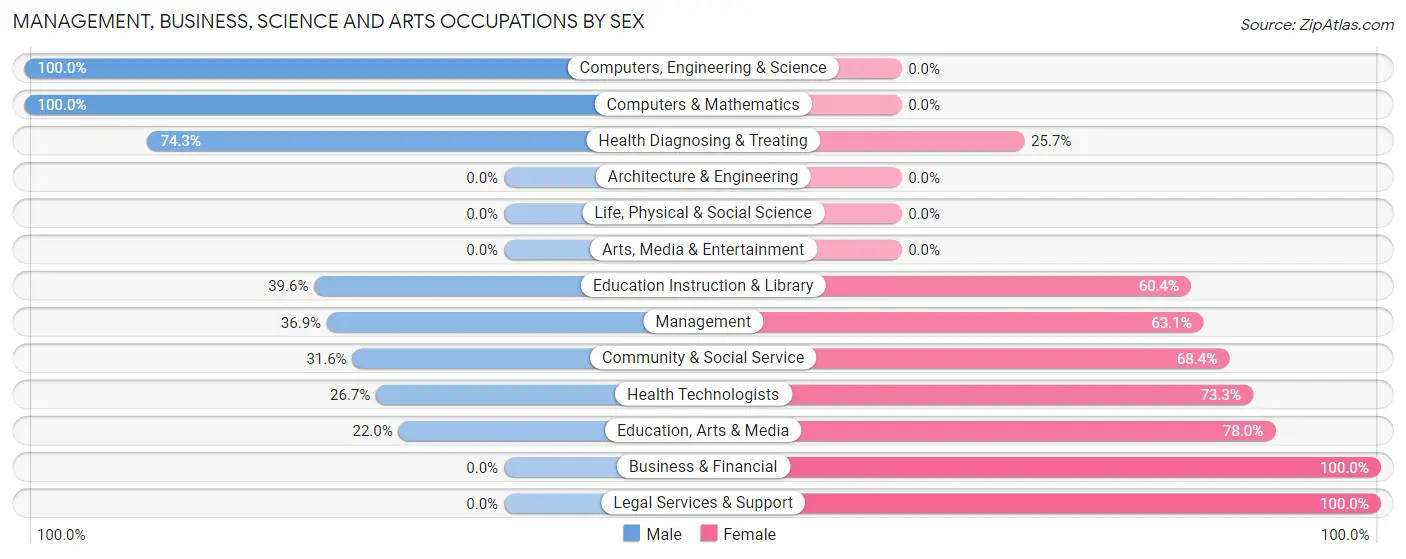
Management, Business, Science and Arts Occupations by Sex
Within the Management, Business, Science and Arts occupations in Centerville, the most male-oriented occupations are Computers, Engineering & Science (100.0%), Computers & Mathematics (100.0%), and Health Diagnosing & Treating (74.3%), while the most female-oriented occupations are Business & Financial (100.0%), Legal Services & Support (100.0%), and Education, Arts & Media (78.0%).
| Occupation | Male | Female |
| Management | 41 (36.9%) | 70 (63.1%) |
| Business & Financial | 0 (0.0%) | 6 (100.0%) |
| Computers, Engineering & Science | 22 (100.0%) | 0 (0.0%) |
| Computers & Mathematics | 22 (100.0%) | 0 (0.0%) |
| Architecture & Engineering | 0 (0.0%) | 0 (0.0%) |
| Life, Physical & Social Science | 0 (0.0%) | 0 (0.0%) |
| Community & Social Service | 49 (31.6%) | 106 (68.4%) |
| Education, Arts & Media | 11 (22.0%) | 39 (78.0%) |
| Legal Services & Support | 0 (0.0%) | 9 (100.0%) |
| Education Instruction & Library | 38 (39.6%) | 58 (60.4%) |
| Arts, Media & Entertainment | 0 (0.0%) | 0 (0.0%) |
| Health Diagnosing & Treating | 84 (74.3%) | 29 (25.7%) |
| Health Technologists | 8 (26.7%) | 22 (73.3%) |
| Total (Category) | 196 (48.2%) | 211 (51.8%) |
| Total (Overall) | 756 (61.1%) | 481 (38.9%) |
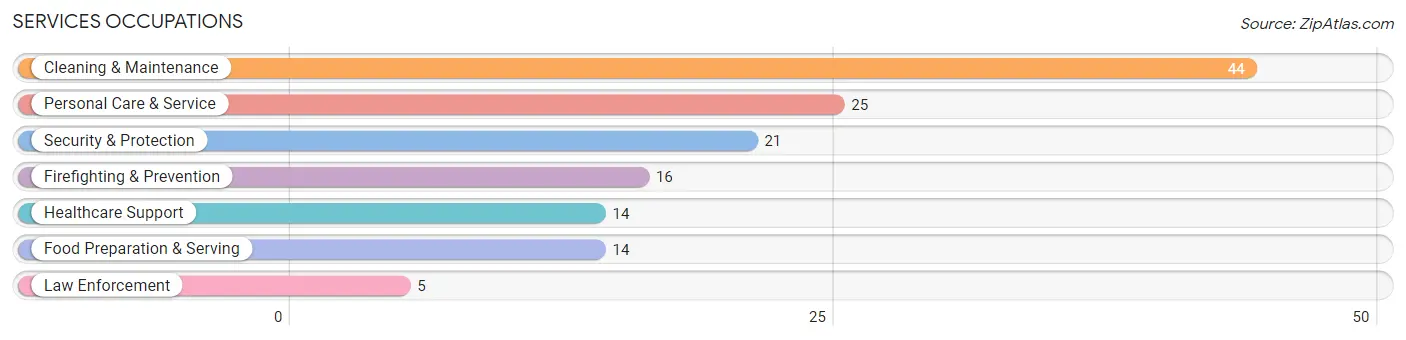
Services Occupations
The most common Services occupations in Centerville are Cleaning & Maintenance (44 | 3.6%), Personal Care & Service (25 | 2.0%), Security & Protection (21 | 1.7%), Firefighting & Prevention (16 | 1.3%), and Healthcare Support (14 | 1.1%).
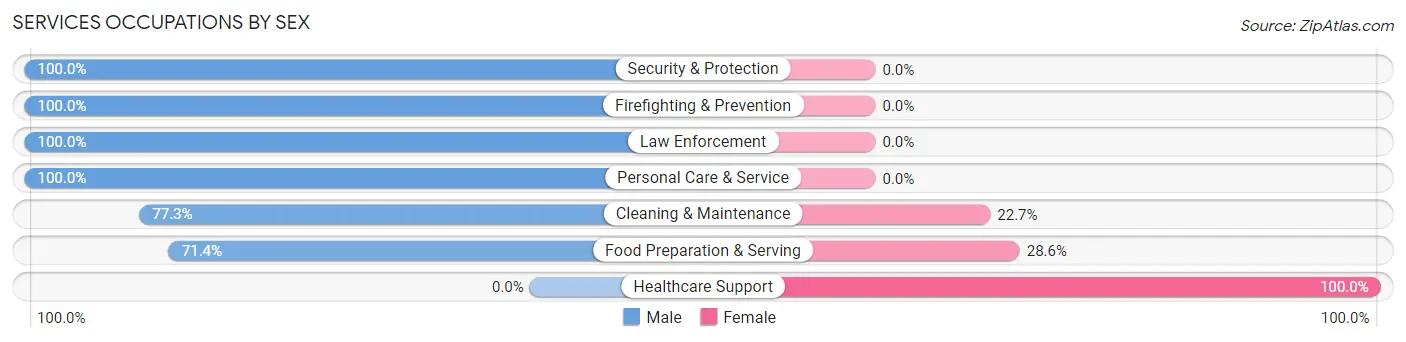
Services Occupations by Sex
Within the Services occupations in Centerville, the most male-oriented occupations are Security & Protection (100.0%), Firefighting & Prevention (100.0%), and Law Enforcement (100.0%), while the most female-oriented occupations are Healthcare Support (100.0%), Food Preparation & Serving (28.6%), and Cleaning & Maintenance (22.7%).
| Occupation | Male | Female |
| Healthcare Support | 0 (0.0%) | 14 (100.0%) |
| Security & Protection | 21 (100.0%) | 0 (0.0%) |
| Firefighting & Prevention | 16 (100.0%) | 0 (0.0%) |
| Law Enforcement | 5 (100.0%) | 0 (0.0%) |
| Food Preparation & Serving | 10 (71.4%) | 4 (28.6%) |
| Cleaning & Maintenance | 34 (77.3%) | 10 (22.7%) |
| Personal Care & Service | 25 (100.0%) | 0 (0.0%) |
| Total (Category) | 90 (76.3%) | 28 (23.7%) |
| Total (Overall) | 756 (61.1%) | 481 (38.9%) |
Sales and Office Occupations
The most common Sales and Office occupations in Centerville are Office & Administration (146 | 11.8%), and Sales & Related (102 | 8.3%).

Sales and Office Occupations by Sex

| Occupation | Male | Female |
| Sales & Related | 14 (13.7%) | 88 (86.3%) |
| Office & Administration | 32 (21.9%) | 114 (78.1%) |
| Total (Category) | 46 (18.5%) | 202 (81.5%) |
| Total (Overall) | 756 (61.1%) | 481 (38.9%) |
Natural Resources, Construction and Maintenance Occupations
The most common Natural Resources, Construction and Maintenance occupations in Centerville are Construction & Extraction (145 | 11.7%), and Installation, Maintenance & Repair (142 | 11.5%).

Natural Resources, Construction and Maintenance Occupations by Sex

| Occupation | Male | Female |
| Farming, Fishing & Forestry | 0 (0.0%) | 0 (0.0%) |
| Construction & Extraction | 105 (72.4%) | 40 (27.6%) |
| Installation, Maintenance & Repair | 142 (100.0%) | 0 (0.0%) |
| Total (Category) | 247 (86.1%) | 40 (13.9%) |
| Total (Overall) | 756 (61.1%) | 481 (38.9%) |
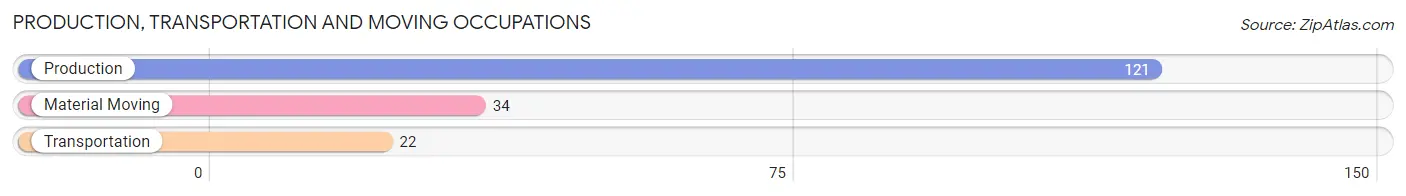
Production, Transportation and Moving Occupations
The most common Production, Transportation and Moving occupations in Centerville are Production (121 | 9.8%), Material Moving (34 | 2.8%), and Transportation (22 | 1.8%).
Production, Transportation and Moving Occupations by Sex

| Occupation | Male | Female |
| Production | 121 (100.0%) | 0 (0.0%) |
| Transportation | 22 (100.0%) | 0 (0.0%) |
| Material Moving | 34 (100.0%) | 0 (0.0%) |
| Total (Category) | 177 (100.0%) | 0 (0.0%) |
| Total (Overall) | 756 (61.1%) | 481 (38.9%) |
Employment Industries by Sex in Centerville
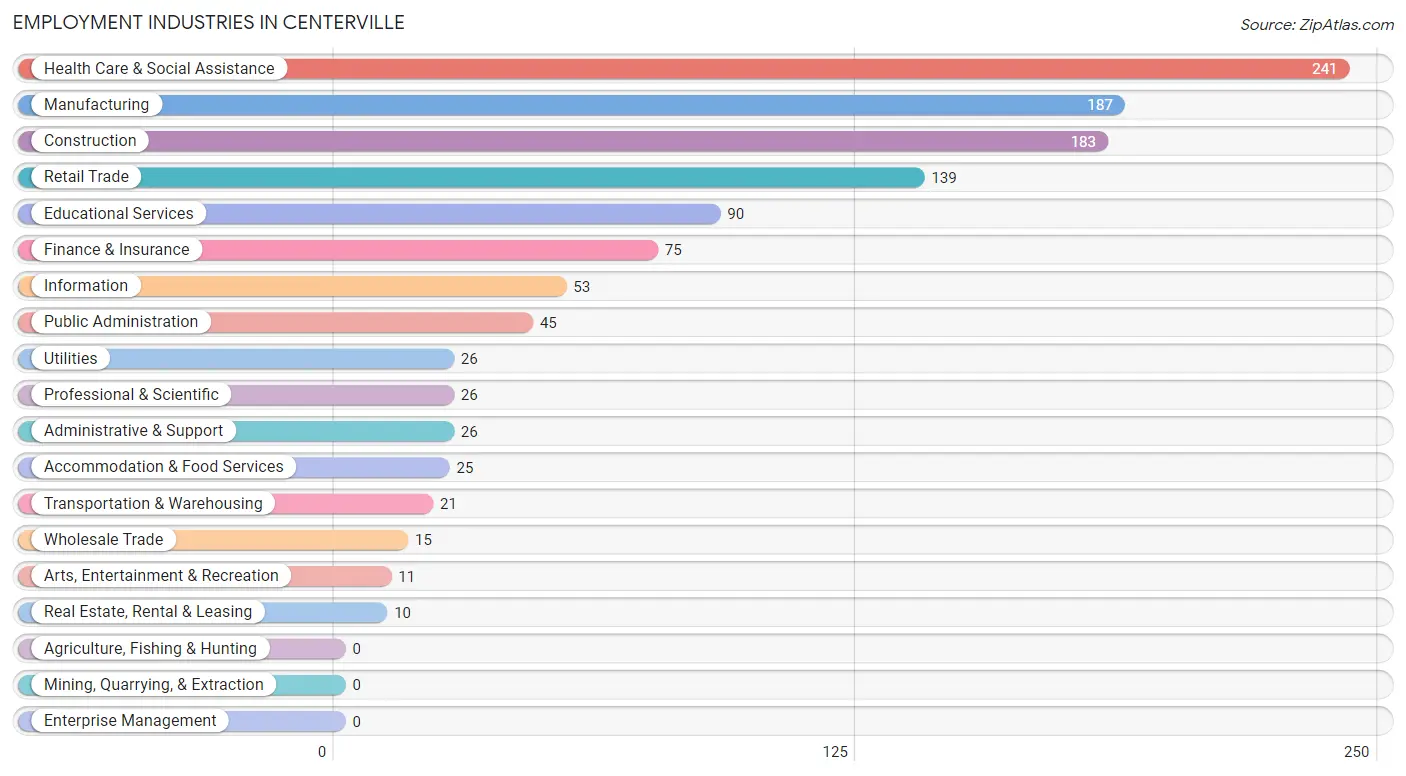
Employment Industries in Centerville
The major employment industries in Centerville include Health Care & Social Assistance (241 | 19.5%), Manufacturing (187 | 15.1%), Construction (183 | 14.8%), Retail Trade (139 | 11.2%), and Educational Services (90 | 7.3%).
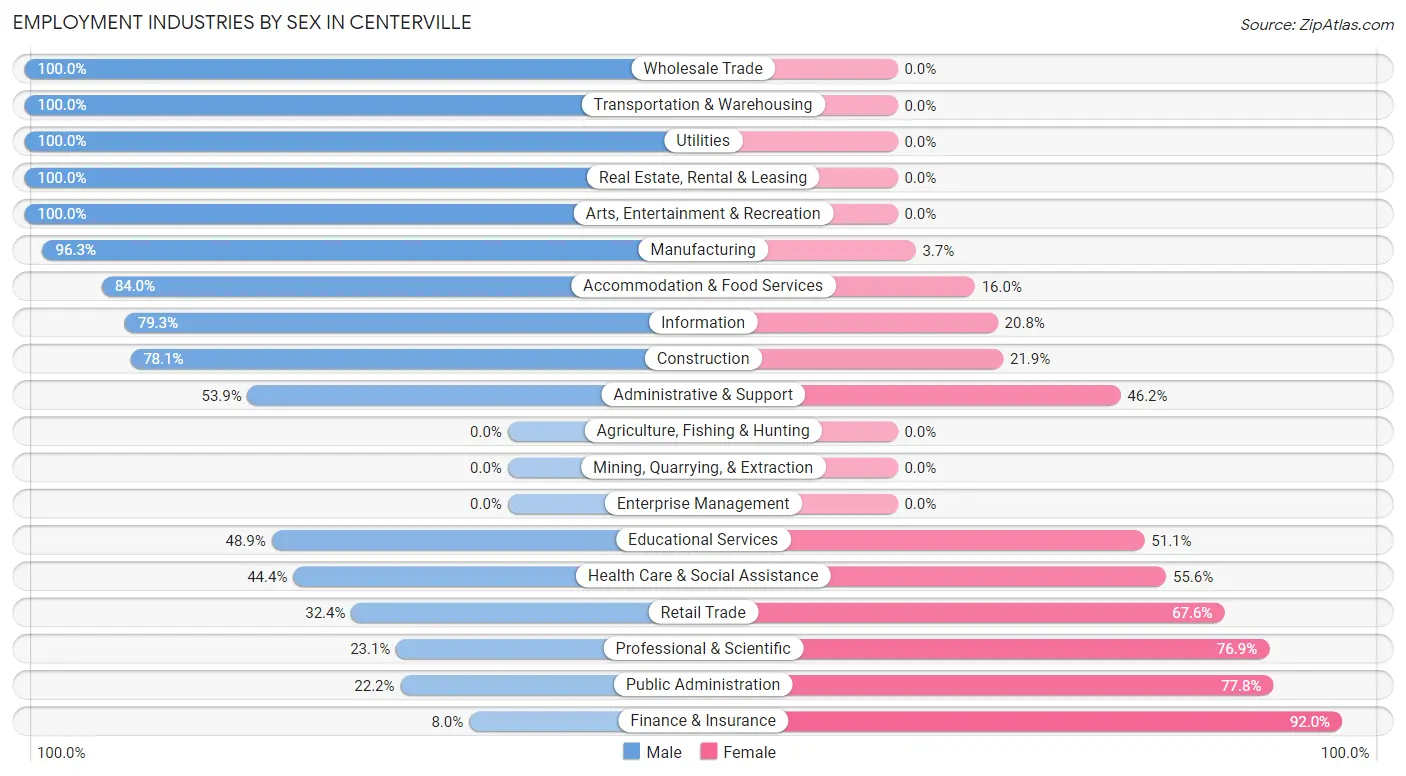
Employment Industries by Sex in Centerville
The Centerville industries that see more men than women are Wholesale Trade (100.0%), Transportation & Warehousing (100.0%), and Utilities (100.0%), whereas the industries that tend to have a higher number of women are Finance & Insurance (92.0%), Public Administration (77.8%), and Professional & Scientific (76.9%).
| Industry | Male | Female |
| Agriculture, Fishing & Hunting | 0 (0.0%) | 0 (0.0%) |
| Mining, Quarrying, & Extraction | 0 (0.0%) | 0 (0.0%) |
| Construction | 143 (78.1%) | 40 (21.9%) |
| Manufacturing | 180 (96.3%) | 7 (3.7%) |
| Wholesale Trade | 15 (100.0%) | 0 (0.0%) |
| Retail Trade | 45 (32.4%) | 94 (67.6%) |
| Transportation & Warehousing | 21 (100.0%) | 0 (0.0%) |
| Utilities | 26 (100.0%) | 0 (0.0%) |
| Information | 42 (79.2%) | 11 (20.7%) |
| Finance & Insurance | 6 (8.0%) | 69 (92.0%) |
| Real Estate, Rental & Leasing | 10 (100.0%) | 0 (0.0%) |
| Professional & Scientific | 6 (23.1%) | 20 (76.9%) |
| Enterprise Management | 0 (0.0%) | 0 (0.0%) |
| Administrative & Support | 14 (53.8%) | 12 (46.2%) |
| Educational Services | 44 (48.9%) | 46 (51.1%) |
| Health Care & Social Assistance | 107 (44.4%) | 134 (55.6%) |
| Arts, Entertainment & Recreation | 11 (100.0%) | 0 (0.0%) |
| Accommodation & Food Services | 21 (84.0%) | 4 (16.0%) |
| Public Administration | 10 (22.2%) | 35 (77.8%) |
| Total | 756 (61.1%) | 481 (38.9%) |
Education in Centerville
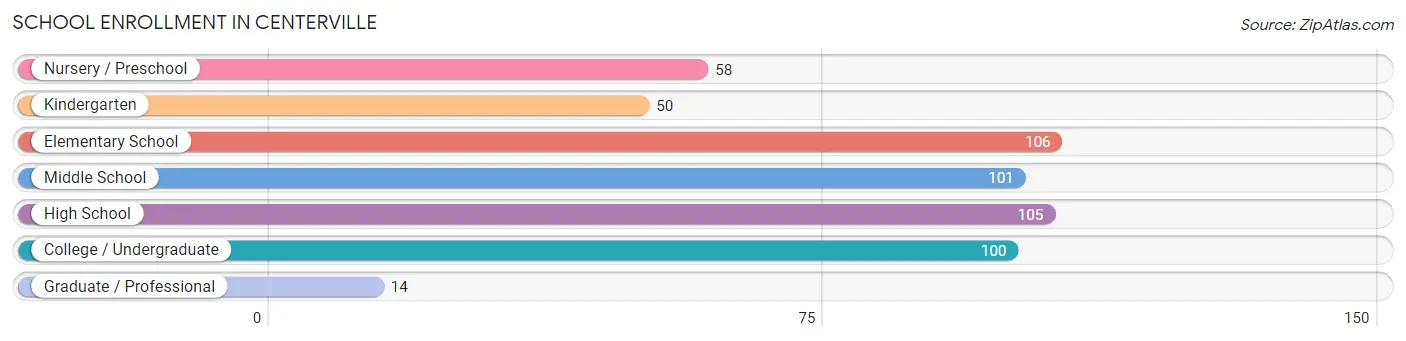
School Enrollment in Centerville
The most common levels of schooling among the 534 students in Centerville are elementary school (106 | 19.9%), high school (105 | 19.7%), and middle school (101 | 18.9%).
| School Level | # Students | % Students |
| Nursery / Preschool | 58 | 10.9% |
| Kindergarten | 50 | 9.4% |
| Elementary School | 106 | 19.9% |
| Middle School | 101 | 18.9% |
| High School | 105 | 19.7% |
| College / Undergraduate | 100 | 18.7% |
| Graduate / Professional | 14 | 2.6% |
| Total | 534 | 100.0% |
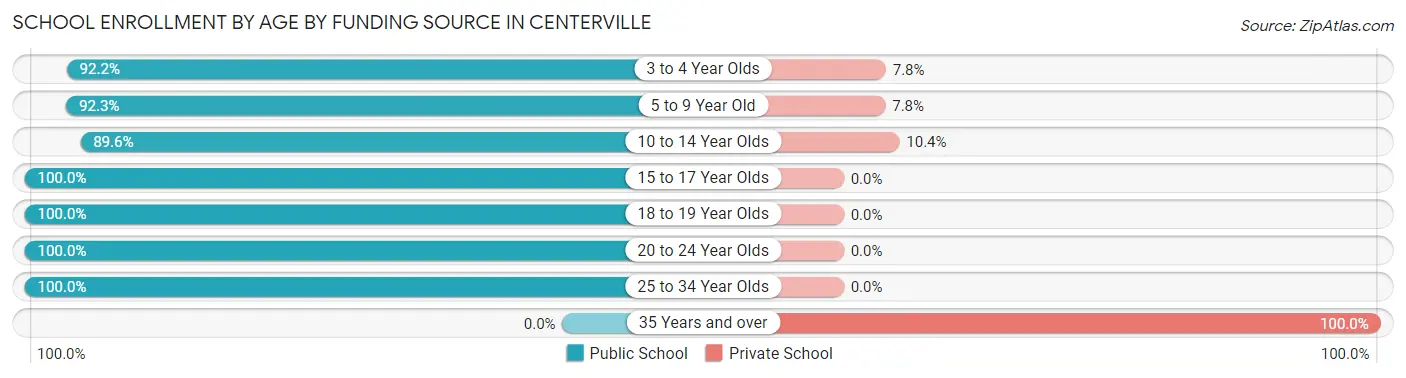
School Enrollment by Age by Funding Source in Centerville
Out of a total of 534 students who are enrolled in schools in Centerville, 47 (8.8%) attend a private institution, while the remaining 487 (91.2%) are enrolled in public schools. The age group of 35 years and over has the highest likelihood of being enrolled in private schools, with 19 (100.0% in the age bracket) enrolled. Conversely, the age group of 15 to 17 year olds has the lowest likelihood of being enrolled in a private school, with 94 (100.0% in the age bracket) attending a public institution.
| Age Bracket | Public School | Private School |
| 3 to 4 Year Olds | 47 (92.2%) | 4 (7.8%) |
| 5 to 9 Year Old | 119 (92.2%) | 10 (7.7%) |
| 10 to 14 Year Olds | 121 (89.6%) | 14 (10.4%) |
| 15 to 17 Year Olds | 94 (100.0%) | 0 (0.0%) |
| 18 to 19 Year Olds | 6 (100.0%) | 0 (0.0%) |
| 20 to 24 Year Olds | 78 (100.0%) | 0 (0.0%) |
| 25 to 34 Year Olds | 22 (100.0%) | 0 (0.0%) |
| 35 Years and over | 0 (0.0%) | 19 (100.0%) |
| Total | 487 (91.2%) | 47 (8.8%) |
Educational Attainment by Field of Study in Centerville
Education (138 | 51.9%), bio, nature & agricultural (35 | 13.2%), business (27 | 10.2%), liberal arts & history (19 | 7.1%), and arts & humanities (14 | 5.3%) are the most common fields of study among 266 individuals in Centerville who have obtained a bachelor's degree or higher.
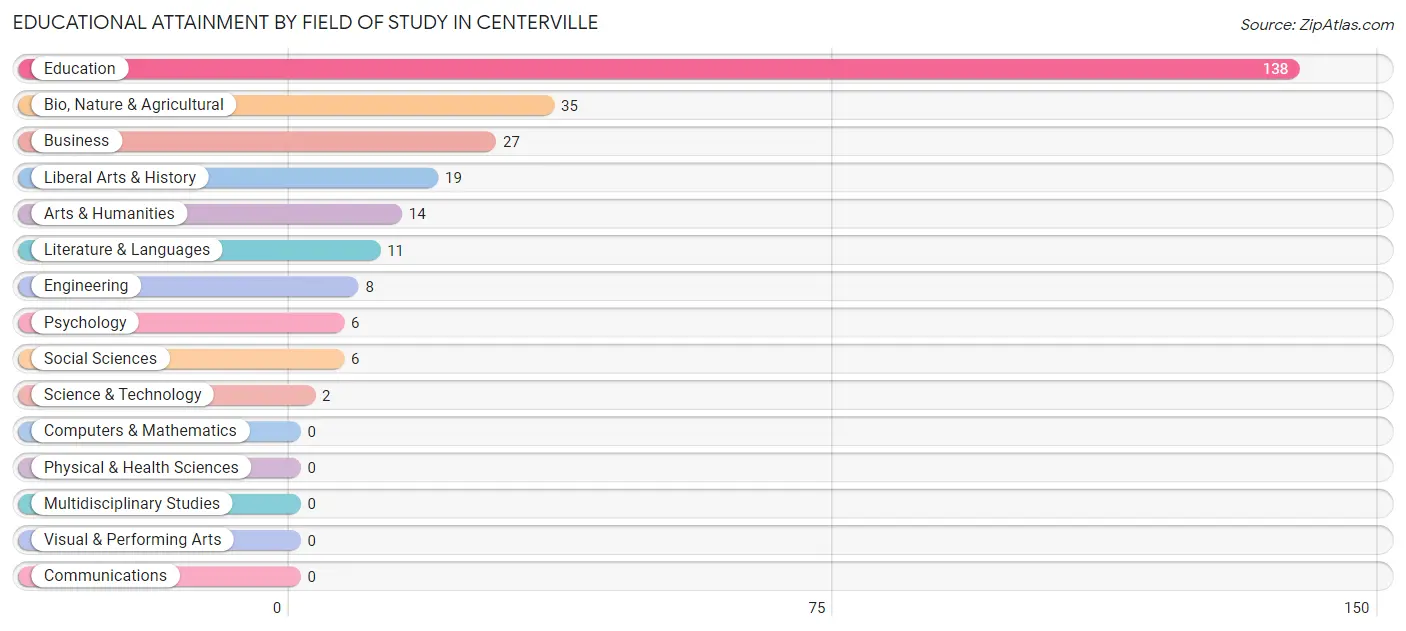
| Field of Study | # Graduates | % Graduates |
| Computers & Mathematics | 0 | 0.0% |
| Bio, Nature & Agricultural | 35 | 13.2% |
| Physical & Health Sciences | 0 | 0.0% |
| Psychology | 6 | 2.3% |
| Social Sciences | 6 | 2.3% |
| Engineering | 8 | 3.0% |
| Multidisciplinary Studies | 0 | 0.0% |
| Science & Technology | 2 | 0.7% |
| Business | 27 | 10.2% |
| Education | 138 | 51.9% |
| Literature & Languages | 11 | 4.1% |
| Liberal Arts & History | 19 | 7.1% |
| Visual & Performing Arts | 0 | 0.0% |
| Communications | 0 | 0.0% |
| Arts & Humanities | 14 | 5.3% |
| Total | 266 | 100.0% |
Transportation & Commute in Centerville
Vehicle Availability by Sex in Centerville
The most prevalent vehicle ownership categories in Centerville are males with 2 vehicles (308, accounting for 41.2%) and females with 2 vehicles (237, making up 64.7%).
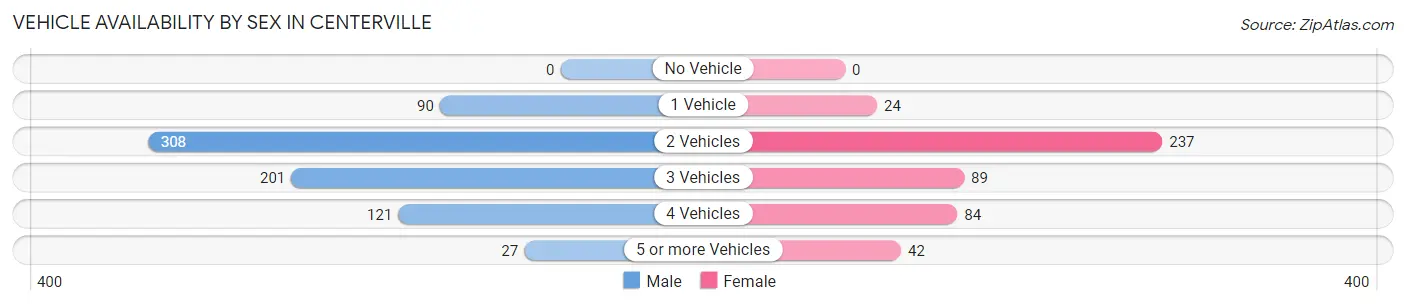
| Vehicles Available | Male | Female |
| No Vehicle | 0 (0.0%) | 0 (0.0%) |
| 1 Vehicle | 90 (12.0%) | 24 (5.0%) |
| 2 Vehicles | 308 (41.2%) | 237 (49.8%) |
| 3 Vehicles | 201 (26.9%) | 89 (18.7%) |
| 4 Vehicles | 121 (16.2%) | 84 (17.6%) |
| 5 or more Vehicles | 27 (3.6%) | 42 (8.8%) |
| Total | 747 (100.0%) | 476 (100.0%) |
Commute Time in Centerville
The most frequently occuring commute durations in Centerville are 60 to 89 minutes (317 commuters, 27.9%), 45 to 59 minutes (177 commuters, 15.5%), and 10 to 14 minutes (172 commuters, 15.1%).
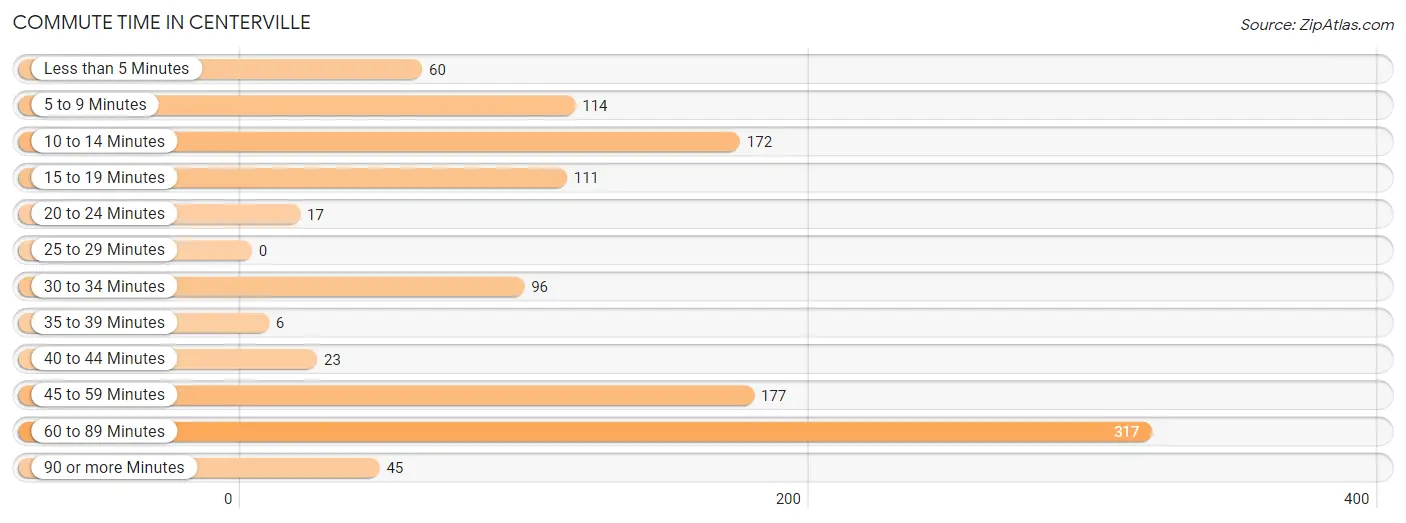
| Commute Time | # Commuters | % Commuters |
| Less than 5 Minutes | 60 | 5.3% |
| 5 to 9 Minutes | 114 | 10.0% |
| 10 to 14 Minutes | 172 | 15.1% |
| 15 to 19 Minutes | 111 | 9.8% |
| 20 to 24 Minutes | 17 | 1.5% |
| 25 to 29 Minutes | 0 | 0.0% |
| 30 to 34 Minutes | 96 | 8.4% |
| 35 to 39 Minutes | 6 | 0.5% |
| 40 to 44 Minutes | 23 | 2.0% |
| 45 to 59 Minutes | 177 | 15.5% |
| 60 to 89 Minutes | 317 | 27.9% |
| 90 or more Minutes | 45 | 4.0% |
Commute Time by Sex in Centerville
The most common commute times in Centerville are 60 to 89 minutes (147 commuters, 20.3%) for males and 60 to 89 minutes (170 commuters, 41.0%) for females.
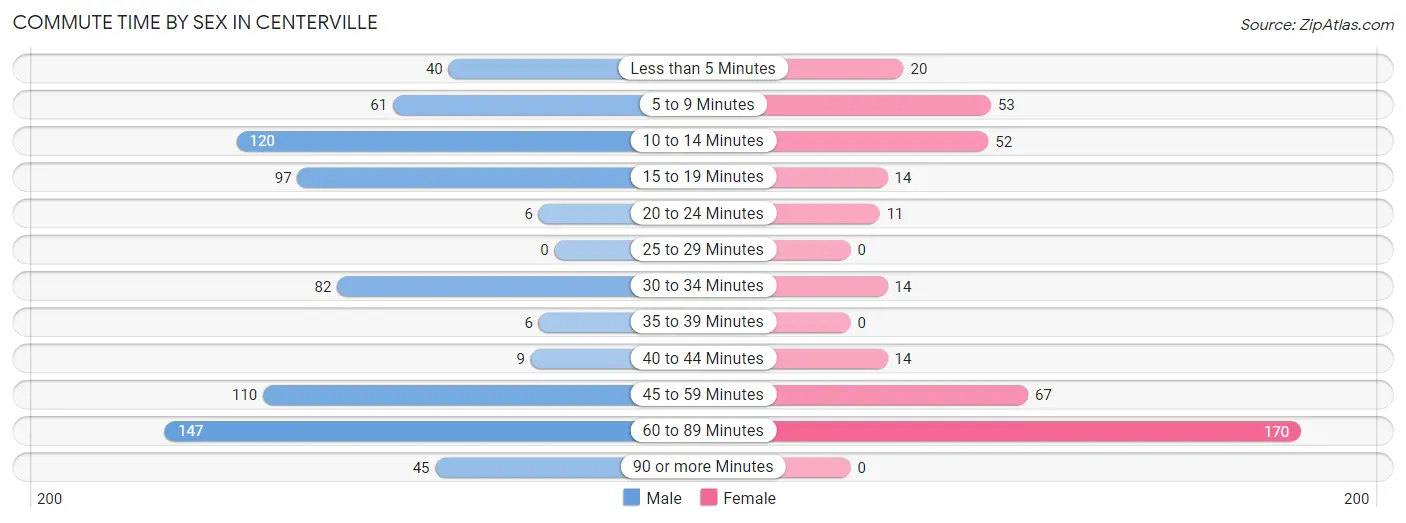
| Commute Time | Male | Female |
| Less than 5 Minutes | 40 (5.5%) | 20 (4.8%) |
| 5 to 9 Minutes | 61 (8.4%) | 53 (12.8%) |
| 10 to 14 Minutes | 120 (16.6%) | 52 (12.5%) |
| 15 to 19 Minutes | 97 (13.4%) | 14 (3.4%) |
| 20 to 24 Minutes | 6 (0.8%) | 11 (2.6%) |
| 25 to 29 Minutes | 0 (0.0%) | 0 (0.0%) |
| 30 to 34 Minutes | 82 (11.3%) | 14 (3.4%) |
| 35 to 39 Minutes | 6 (0.8%) | 0 (0.0%) |
| 40 to 44 Minutes | 9 (1.2%) | 14 (3.4%) |
| 45 to 59 Minutes | 110 (15.2%) | 67 (16.1%) |
| 60 to 89 Minutes | 147 (20.3%) | 170 (41.0%) |
| 90 or more Minutes | 45 (6.2%) | 0 (0.0%) |
Time of Departure to Work by Sex in Centerville
The most frequent times of departure to work in Centerville are 7:00 AM to 7:29 AM (194, 26.8%) for males and 6:30 AM to 6:59 AM (107, 25.8%) for females.
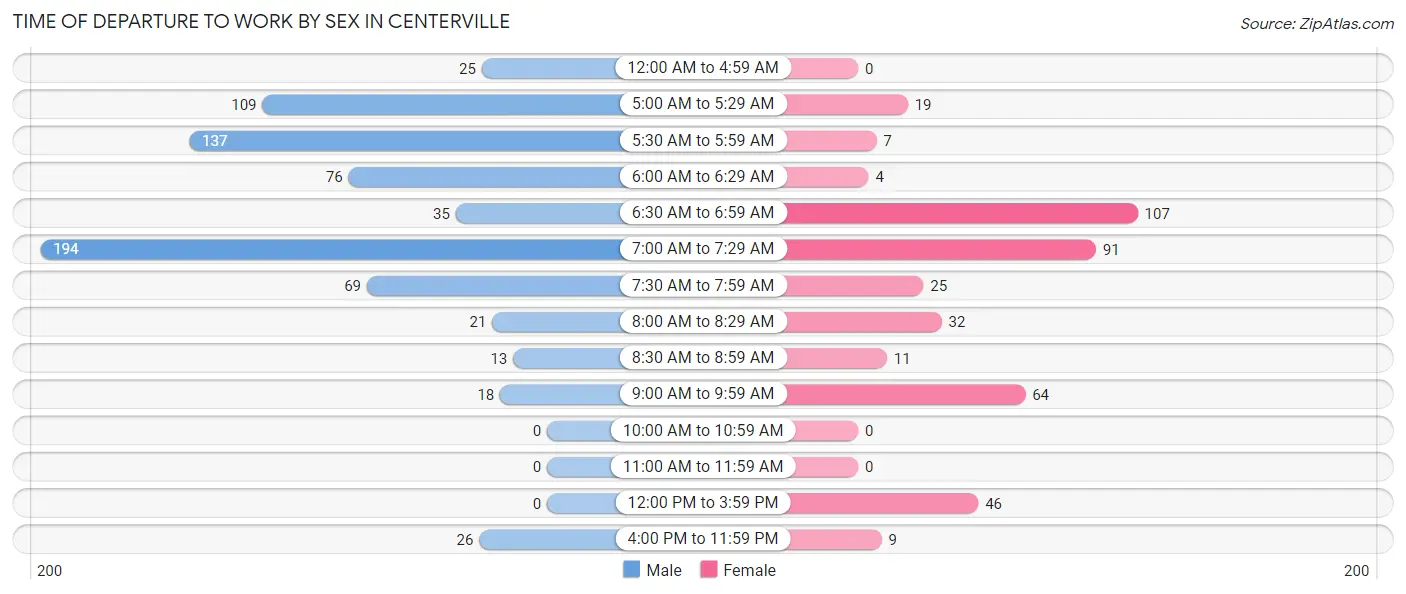
| Time of Departure | Male | Female |
| 12:00 AM to 4:59 AM | 25 (3.5%) | 0 (0.0%) |
| 5:00 AM to 5:29 AM | 109 (15.1%) | 19 (4.6%) |
| 5:30 AM to 5:59 AM | 137 (19.0%) | 7 (1.7%) |
| 6:00 AM to 6:29 AM | 76 (10.5%) | 4 (1.0%) |
| 6:30 AM to 6:59 AM | 35 (4.8%) | 107 (25.8%) |
| 7:00 AM to 7:29 AM | 194 (26.8%) | 91 (21.9%) |
| 7:30 AM to 7:59 AM | 69 (9.5%) | 25 (6.0%) |
| 8:00 AM to 8:29 AM | 21 (2.9%) | 32 (7.7%) |
| 8:30 AM to 8:59 AM | 13 (1.8%) | 11 (2.6%) |
| 9:00 AM to 9:59 AM | 18 (2.5%) | 64 (15.4%) |
| 10:00 AM to 10:59 AM | 0 (0.0%) | 0 (0.0%) |
| 11:00 AM to 11:59 AM | 0 (0.0%) | 0 (0.0%) |
| 12:00 PM to 3:59 PM | 0 (0.0%) | 46 (11.1%) |
| 4:00 PM to 11:59 PM | 26 (3.6%) | 9 (2.2%) |
| Total | 723 (100.0%) | 415 (100.0%) |
Housing Occupancy in Centerville
Occupancy by Ownership in Centerville
Of the total 1,383 dwellings in Centerville, owner-occupied units account for 799 (57.8%), while renter-occupied units make up 584 (42.2%).
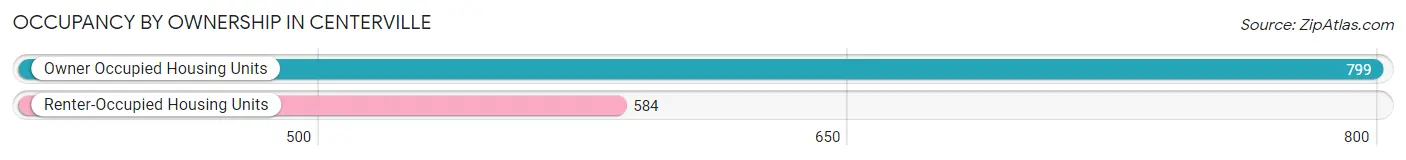
| Occupancy | # Housing Units | % Housing Units |
| Owner Occupied Housing Units | 799 | 57.8% |
| Renter-Occupied Housing Units | 584 | 42.2% |
| Total Occupied Housing Units | 1,383 | 100.0% |
Occupancy by Household Size in Centerville
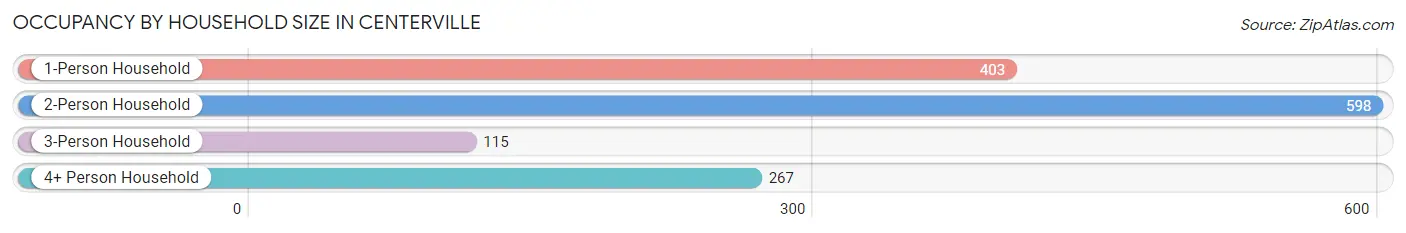
| Household Size | # Housing Units | % Housing Units |
| 1-Person Household | 403 | 29.1% |
| 2-Person Household | 598 | 43.2% |
| 3-Person Household | 115 | 8.3% |
| 4+ Person Household | 267 | 19.3% |
| Total Housing Units | 1,383 | 100.0% |
Occupancy by Ownership by Household Size in Centerville
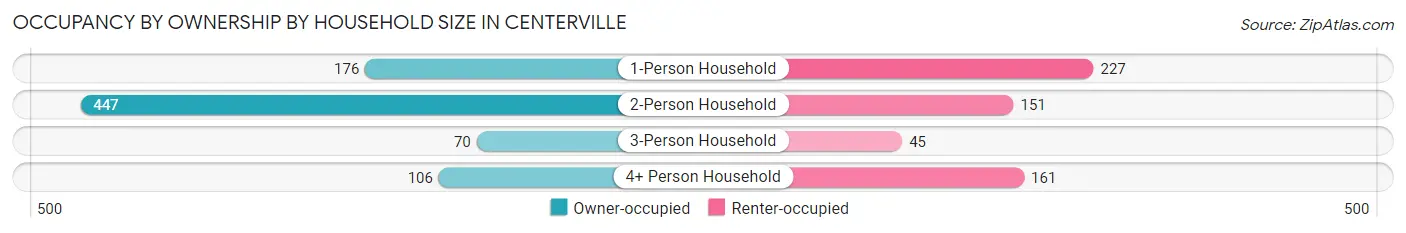
| Household Size | Owner-occupied | Renter-occupied |
| 1-Person Household | 176 (43.7%) | 227 (56.3%) |
| 2-Person Household | 447 (74.8%) | 151 (25.3%) |
| 3-Person Household | 70 (60.9%) | 45 (39.1%) |
| 4+ Person Household | 106 (39.7%) | 161 (60.3%) |
| Total Housing Units | 799 (57.8%) | 584 (42.2%) |
Occupancy by Educational Attainment in Centerville
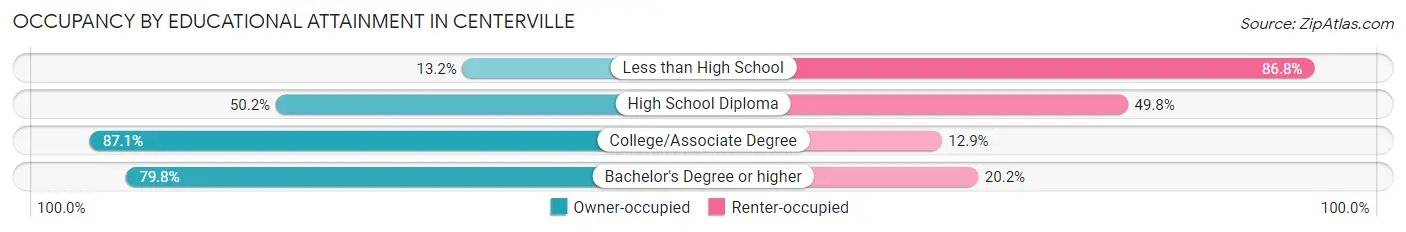
| Household Size | Owner-occupied | Renter-occupied |
| Less than High School | 32 (13.2%) | 211 (86.8%) |
| High School Diploma | 295 (50.2%) | 293 (49.8%) |
| College/Associate Degree | 377 (87.1%) | 56 (12.9%) |
| Bachelor's Degree or higher | 95 (79.8%) | 24 (20.2%) |
Occupancy by Age of Householder in Centerville
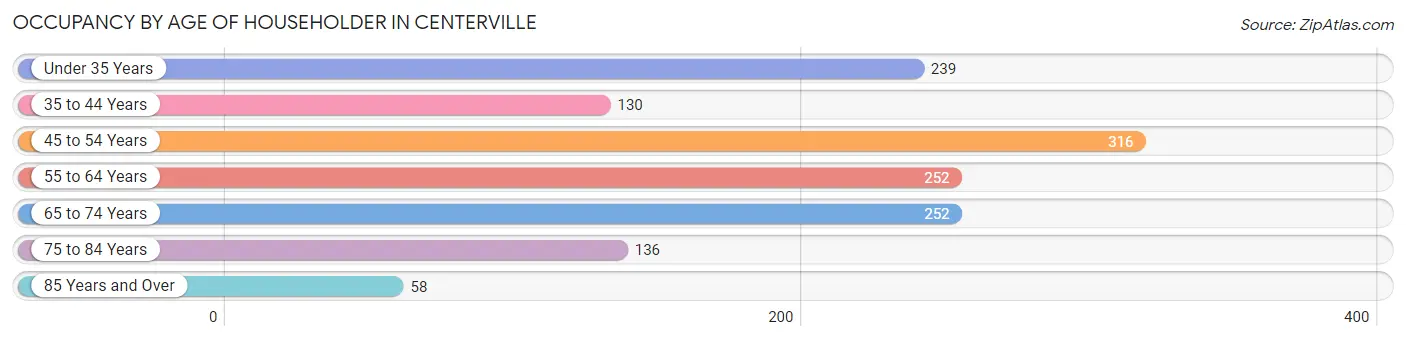
| Age Bracket | # Households | % Households |
| Under 35 Years | 239 | 17.3% |
| 35 to 44 Years | 130 | 9.4% |
| 45 to 54 Years | 316 | 22.9% |
| 55 to 64 Years | 252 | 18.2% |
| 65 to 74 Years | 252 | 18.2% |
| 75 to 84 Years | 136 | 9.8% |
| 85 Years and Over | 58 | 4.2% |
| Total | 1,383 | 100.0% |
Housing Finances in Centerville
Median Income by Occupancy in Centerville
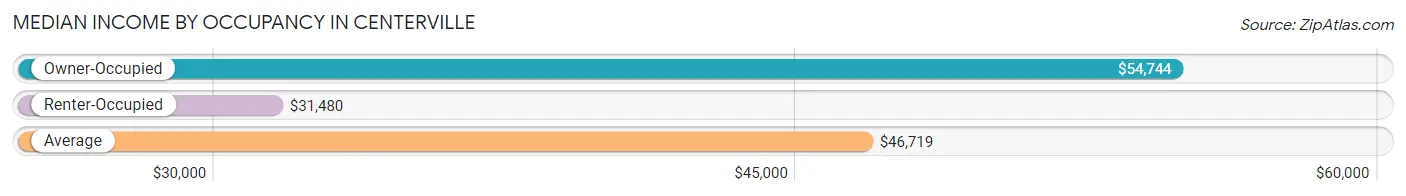
| Occupancy Type | # Households | Median Income |
| Owner-Occupied | 799 (57.8%) | $54,744 |
| Renter-Occupied | 584 (42.2%) | $31,480 |
| Average | 1,383 (100.0%) | $46,719 |
Occupancy by Householder Income Bracket in Centerville
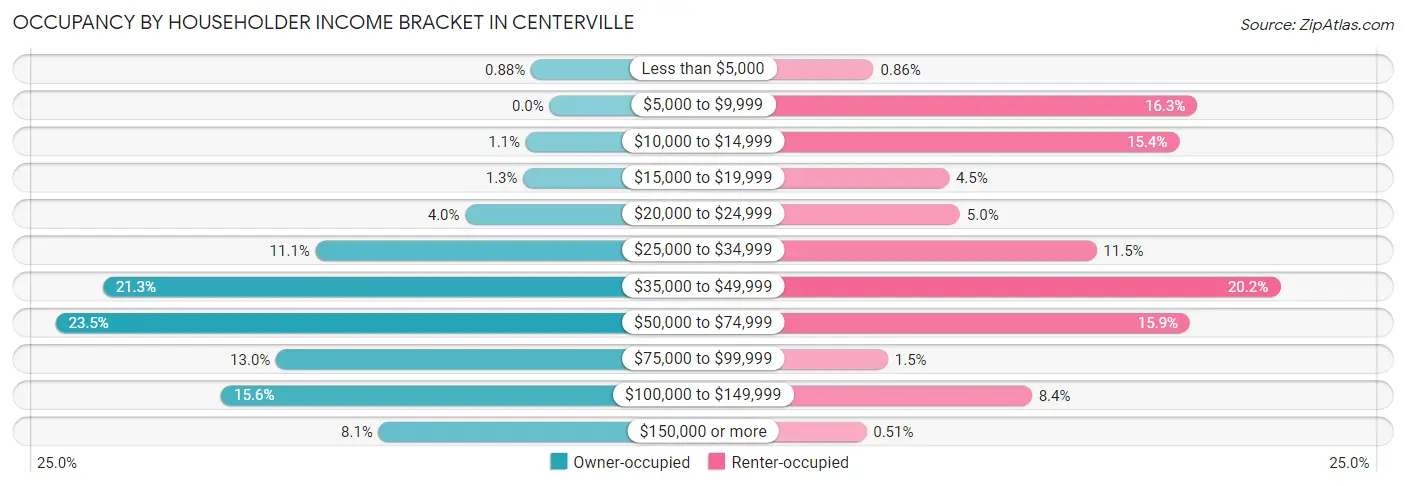
| Income Bracket | Owner-occupied | Renter-occupied |
| Less than $5,000 | 7 (0.9%) | 5 (0.9%) |
| $5,000 to $9,999 | 0 (0.0%) | 95 (16.3%) |
| $10,000 to $14,999 | 9 (1.1%) | 90 (15.4%) |
| $15,000 to $19,999 | 10 (1.3%) | 26 (4.4%) |
| $20,000 to $24,999 | 32 (4.0%) | 29 (5.0%) |
| $25,000 to $34,999 | 89 (11.1%) | 67 (11.5%) |
| $35,000 to $49,999 | 170 (21.3%) | 118 (20.2%) |
| $50,000 to $74,999 | 188 (23.5%) | 93 (15.9%) |
| $75,000 to $99,999 | 104 (13.0%) | 9 (1.5%) |
| $100,000 to $149,999 | 125 (15.6%) | 49 (8.4%) |
| $150,000 or more | 65 (8.1%) | 3 (0.5%) |
| Total | 799 (100.0%) | 584 (100.0%) |
Monthly Housing Cost Tiers in Centerville
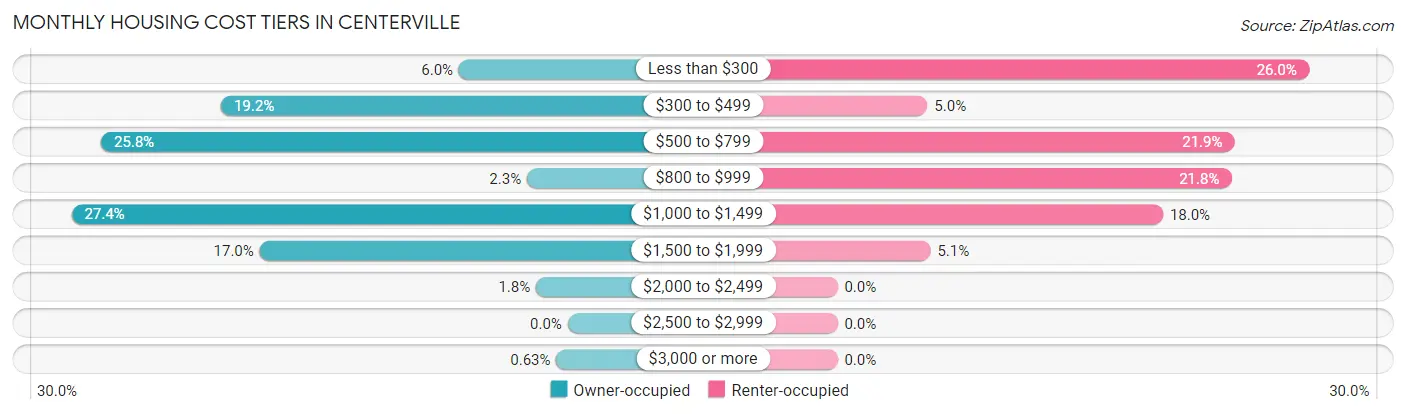
| Monthly Cost | Owner-occupied | Renter-occupied |
| Less than $300 | 48 (6.0%) | 152 (26.0%) |
| $300 to $499 | 153 (19.2%) | 29 (5.0%) |
| $500 to $799 | 206 (25.8%) | 128 (21.9%) |
| $800 to $999 | 18 (2.2%) | 127 (21.7%) |
| $1,000 to $1,499 | 219 (27.4%) | 105 (18.0%) |
| $1,500 to $1,999 | 136 (17.0%) | 30 (5.1%) |
| $2,000 to $2,499 | 14 (1.8%) | 0 (0.0%) |
| $2,500 to $2,999 | 0 (0.0%) | 0 (0.0%) |
| $3,000 or more | 5 (0.6%) | 0 (0.0%) |
| Total | 799 (100.0%) | 584 (100.0%) |
Physical Housing Characteristics in Centerville
Housing Structures in Centerville
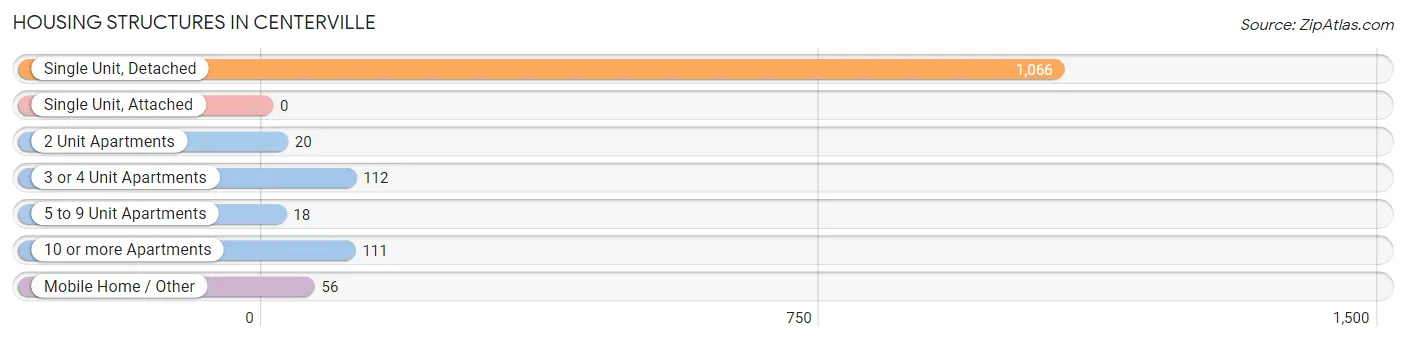
| Structure Type | # Housing Units | % Housing Units |
| Single Unit, Detached | 1,066 | 77.1% |
| Single Unit, Attached | 0 | 0.0% |
| 2 Unit Apartments | 20 | 1.5% |
| 3 or 4 Unit Apartments | 112 | 8.1% |
| 5 to 9 Unit Apartments | 18 | 1.3% |
| 10 or more Apartments | 111 | 8.0% |
| Mobile Home / Other | 56 | 4.1% |
| Total | 1,383 | 100.0% |
Housing Structures by Occupancy in Centerville
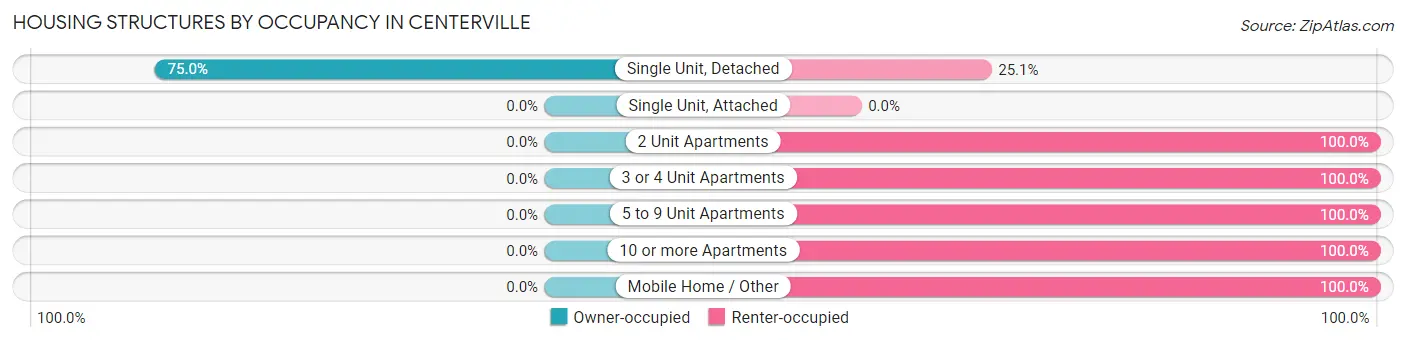
| Structure Type | Owner-occupied | Renter-occupied |
| Single Unit, Detached | 799 (75.0%) | 267 (25.1%) |
| Single Unit, Attached | 0 (0.0%) | 0 (0.0%) |
| 2 Unit Apartments | 0 (0.0%) | 20 (100.0%) |
| 3 or 4 Unit Apartments | 0 (0.0%) | 112 (100.0%) |
| 5 to 9 Unit Apartments | 0 (0.0%) | 18 (100.0%) |
| 10 or more Apartments | 0 (0.0%) | 111 (100.0%) |
| Mobile Home / Other | 0 (0.0%) | 56 (100.0%) |
| Total | 799 (57.8%) | 584 (42.2%) |
Housing Structures by Number of Rooms in Centerville
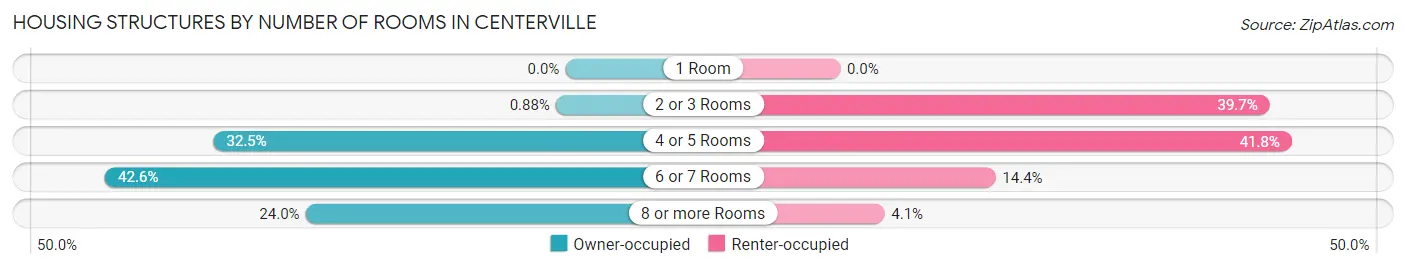
| Number of Rooms | Owner-occupied | Renter-occupied |
| 1 Room | 0 (0.0%) | 0 (0.0%) |
| 2 or 3 Rooms | 7 (0.9%) | 232 (39.7%) |
| 4 or 5 Rooms | 260 (32.5%) | 244 (41.8%) |
| 6 or 7 Rooms | 340 (42.5%) | 84 (14.4%) |
| 8 or more Rooms | 192 (24.0%) | 24 (4.1%) |
| Total | 799 (100.0%) | 584 (100.0%) |
Housing Structure by Heating Type in Centerville
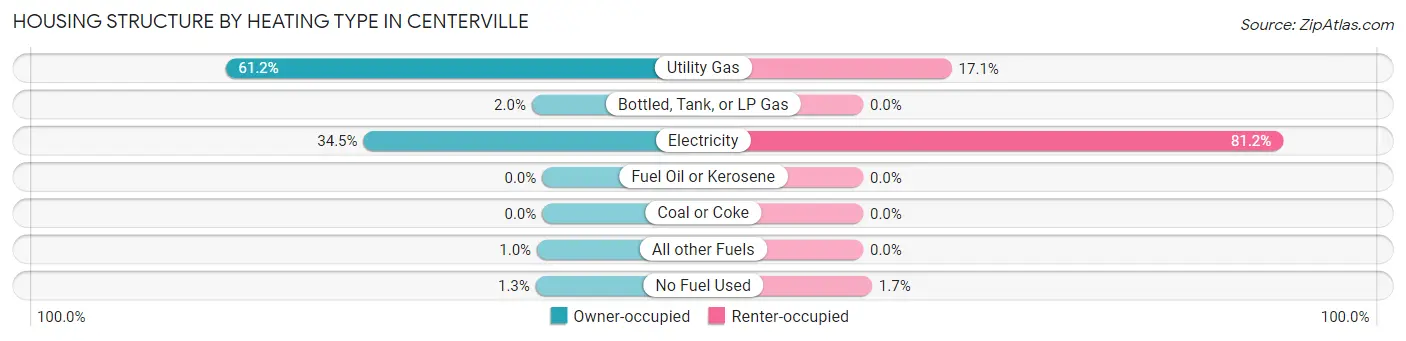
| Heating Type | Owner-occupied | Renter-occupied |
| Utility Gas | 489 (61.2%) | 100 (17.1%) |
| Bottled, Tank, or LP Gas | 16 (2.0%) | 0 (0.0%) |
| Electricity | 276 (34.5%) | 474 (81.2%) |
| Fuel Oil or Kerosene | 0 (0.0%) | 0 (0.0%) |
| Coal or Coke | 0 (0.0%) | 0 (0.0%) |
| All other Fuels | 8 (1.0%) | 0 (0.0%) |
| No Fuel Used | 10 (1.3%) | 10 (1.7%) |
| Total | 799 (100.0%) | 584 (100.0%) |
Household Vehicle Usage in Centerville
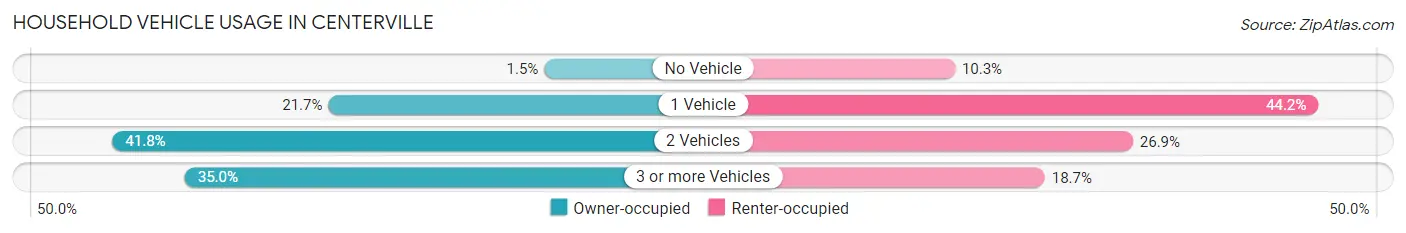
| Vehicles per Household | Owner-occupied | Renter-occupied |
| No Vehicle | 12 (1.5%) | 60 (10.3%) |
| 1 Vehicle | 173 (21.6%) | 258 (44.2%) |
| 2 Vehicles | 334 (41.8%) | 157 (26.9%) |
| 3 or more Vehicles | 280 (35.0%) | 109 (18.7%) |
| Total | 799 (100.0%) | 584 (100.0%) |
Real Estate & Mortgages in Centerville
Real Estate and Mortgage Overview in Centerville
| Characteristic | Without Mortgage | With Mortgage |
| Housing Units | 319 | 480 |
| Median Property Value | $172,500 | $180,300 |
| Median Household Income | $51,094 | $39 |
| Monthly Housing Costs | $446 | $5 |
| Real Estate Taxes | $1,335 | $0 |
Property Value by Mortgage Status in Centerville
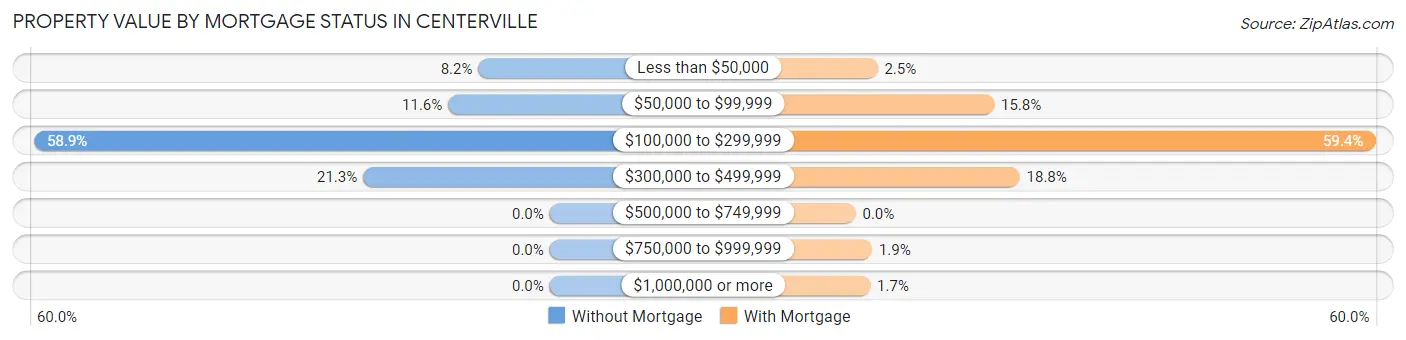
| Property Value | Without Mortgage | With Mortgage |
| Less than $50,000 | 26 (8.2%) | 12 (2.5%) |
| $50,000 to $99,999 | 37 (11.6%) | 76 (15.8%) |
| $100,000 to $299,999 | 188 (58.9%) | 285 (59.4%) |
| $300,000 to $499,999 | 68 (21.3%) | 90 (18.8%) |
| $500,000 to $749,999 | 0 (0.0%) | 0 (0.0%) |
| $750,000 to $999,999 | 0 (0.0%) | 9 (1.9%) |
| $1,000,000 or more | 0 (0.0%) | 8 (1.7%) |
| Total | 319 (100.0%) | 480 (100.0%) |
Household Income by Mortgage Status in Centerville
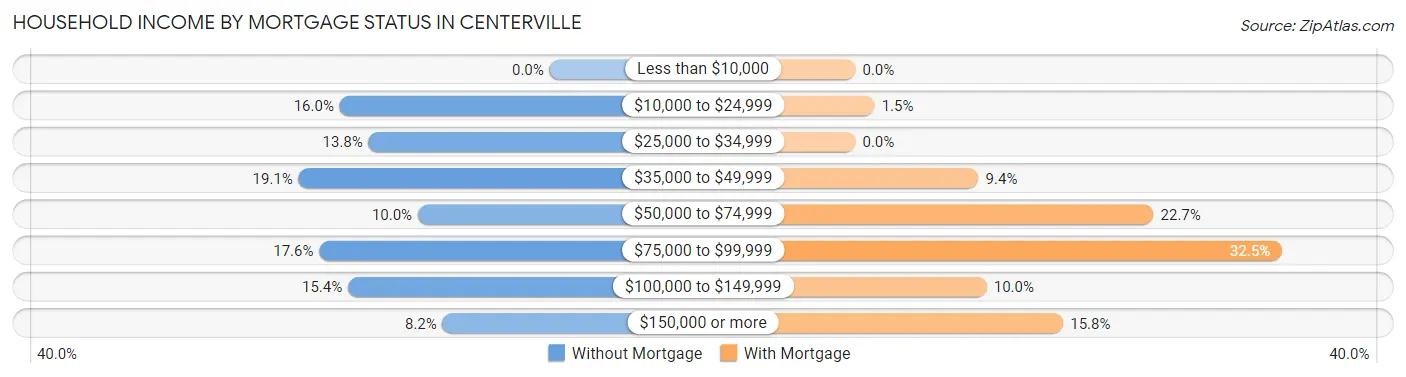
| Household Income | Without Mortgage | With Mortgage |
| Less than $10,000 | 0 (0.0%) | 0 (0.0%) |
| $10,000 to $24,999 | 51 (16.0%) | 7 (1.5%) |
| $25,000 to $34,999 | 44 (13.8%) | 0 (0.0%) |
| $35,000 to $49,999 | 61 (19.1%) | 45 (9.4%) |
| $50,000 to $74,999 | 32 (10.0%) | 109 (22.7%) |
| $75,000 to $99,999 | 56 (17.5%) | 156 (32.5%) |
| $100,000 to $149,999 | 49 (15.4%) | 48 (10.0%) |
| $150,000 or more | 26 (8.2%) | 76 (15.8%) |
| Total | 319 (100.0%) | 480 (100.0%) |
Property Value to Household Income Ratio in Centerville

| Value-to-Income Ratio | Without Mortgage | With Mortgage |
| Less than 2.0x | 100 (31.4%) | 55,160 (11,491.7%) |
| 2.0x to 2.9x | 37 (11.6%) | 170 (35.4%) |
| 3.0x to 3.9x | 71 (22.3%) | 104 (21.7%) |
| 4.0x or more | 111 (34.8%) | 62 (12.9%) |
| Total | 319 (100.0%) | 480 (100.0%) |
Real Estate Taxes by Mortgage Status in Centerville

| Property Taxes | Without Mortgage | With Mortgage |
| Less than $800 | 48 (15.0%) | 7 (1.5%) |
| $800 to $1,499 | 154 (48.3%) | 98 (20.4%) |
| $800 to $1,499 | 110 (34.5%) | 245 (51.0%) |
| Total | 319 (100.0%) | 480 (100.0%) |
Health & Disability in Centerville
Health Insurance Coverage by Age in Centerville
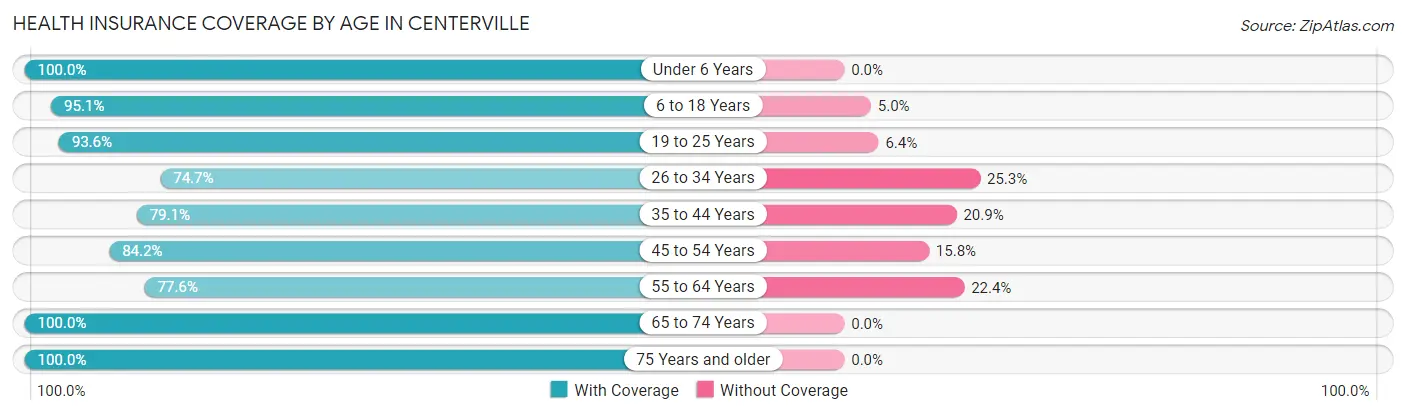
| Age Bracket | With Coverage | Without Coverage |
| Under 6 Years | 297 (100.0%) | 0 (0.0%) |
| 6 to 18 Years | 307 (95.1%) | 16 (5.0%) |
| 19 to 25 Years | 220 (93.6%) | 15 (6.4%) |
| 26 to 34 Years | 363 (74.7%) | 123 (25.3%) |
| 35 to 44 Years | 242 (79.1%) | 64 (20.9%) |
| 45 to 54 Years | 411 (84.2%) | 77 (15.8%) |
| 55 to 64 Years | 368 (77.6%) | 106 (22.4%) |
| 65 to 74 Years | 372 (100.0%) | 0 (0.0%) |
| 75 Years and older | 312 (100.0%) | 0 (0.0%) |
| Total | 2,892 (87.8%) | 401 (12.2%) |
Health Insurance Coverage by Citizenship Status in Centerville

| Citizenship Status | With Coverage | Without Coverage |
| Native Born | 297 (100.0%) | 0 (0.0%) |
| Foreign Born, Citizen | 307 (95.1%) | 16 (5.0%) |
| Foreign Born, not a Citizen | 220 (93.6%) | 15 (6.4%) |
Health Insurance Coverage by Household Income in Centerville
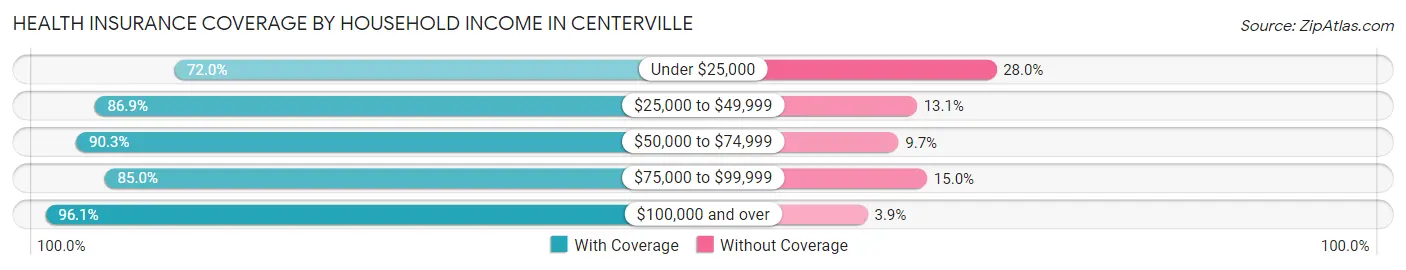
| Household Income | With Coverage | Without Coverage |
| Under $25,000 | 319 (72.0%) | 124 (28.0%) |
| $25,000 to $49,999 | 816 (86.9%) | 123 (13.1%) |
| $50,000 to $74,999 | 636 (90.3%) | 68 (9.7%) |
| $75,000 to $99,999 | 300 (85.0%) | 53 (15.0%) |
| $100,000 and over | 817 (96.1%) | 33 (3.9%) |
Public vs Private Health Insurance Coverage by Age in Centerville
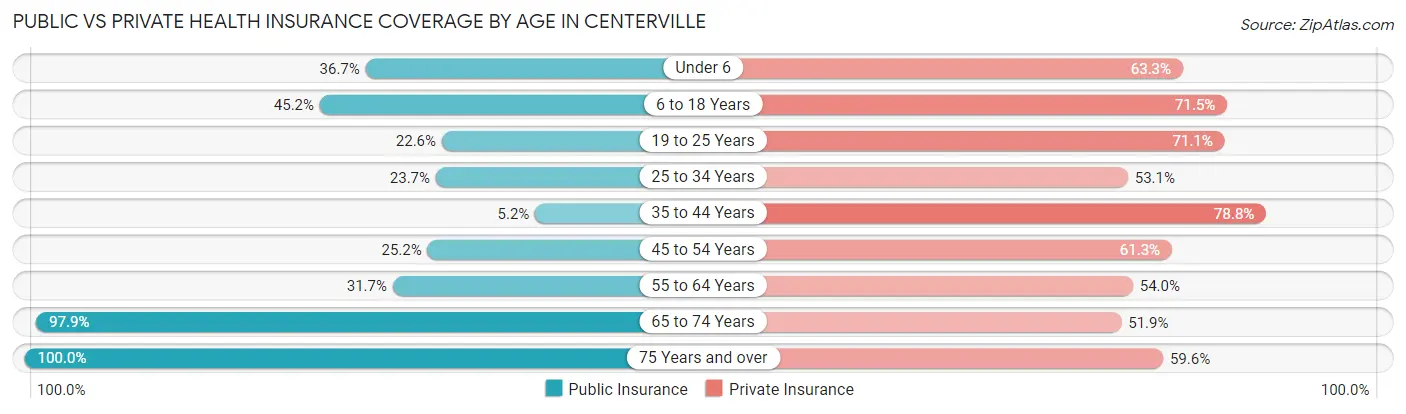
| Age Bracket | Public Insurance | Private Insurance |
| Under 6 | 109 (36.7%) | 188 (63.3%) |
| 6 to 18 Years | 146 (45.2%) | 231 (71.5%) |
| 19 to 25 Years | 53 (22.6%) | 167 (71.1%) |
| 25 to 34 Years | 115 (23.7%) | 258 (53.1%) |
| 35 to 44 Years | 16 (5.2%) | 241 (78.8%) |
| 45 to 54 Years | 123 (25.2%) | 299 (61.3%) |
| 55 to 64 Years | 150 (31.7%) | 256 (54.0%) |
| 65 to 74 Years | 364 (97.9%) | 193 (51.9%) |
| 75 Years and over | 312 (100.0%) | 186 (59.6%) |
| Total | 1,388 (42.1%) | 2,019 (61.3%) |
Disability Status by Sex by Age in Centerville
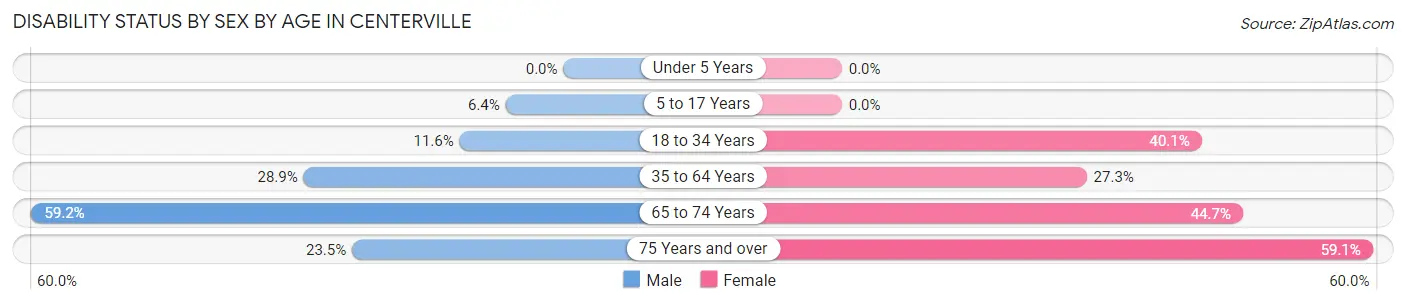
| Age Bracket | Male | Female |
| Under 5 Years | 0 (0.0%) | 0 (0.0%) |
| 5 to 17 Years | 11 (6.4%) | 0 (0.0%) |
| 18 to 34 Years | 43 (11.6%) | 145 (40.1%) |
| 35 to 64 Years | 195 (28.9%) | 162 (27.3%) |
| 65 to 74 Years | 93 (59.2%) | 96 (44.7%) |
| 75 Years and over | 36 (23.5%) | 94 (59.1%) |
Disability Class by Sex by Age in Centerville
Disability Class: Hearing Difficulty
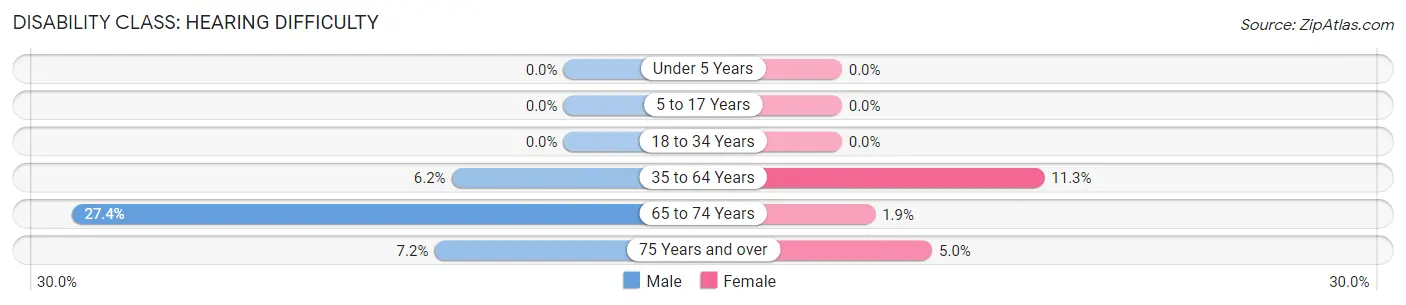
| Age Bracket | Male | Female |
| Under 5 Years | 0 (0.0%) | 0 (0.0%) |
| 5 to 17 Years | 0 (0.0%) | 0 (0.0%) |
| 18 to 34 Years | 0 (0.0%) | 0 (0.0%) |
| 35 to 64 Years | 42 (6.2%) | 67 (11.3%) |
| 65 to 74 Years | 43 (27.4%) | 4 (1.9%) |
| 75 Years and over | 11 (7.2%) | 8 (5.0%) |
Disability Class: Vision Difficulty
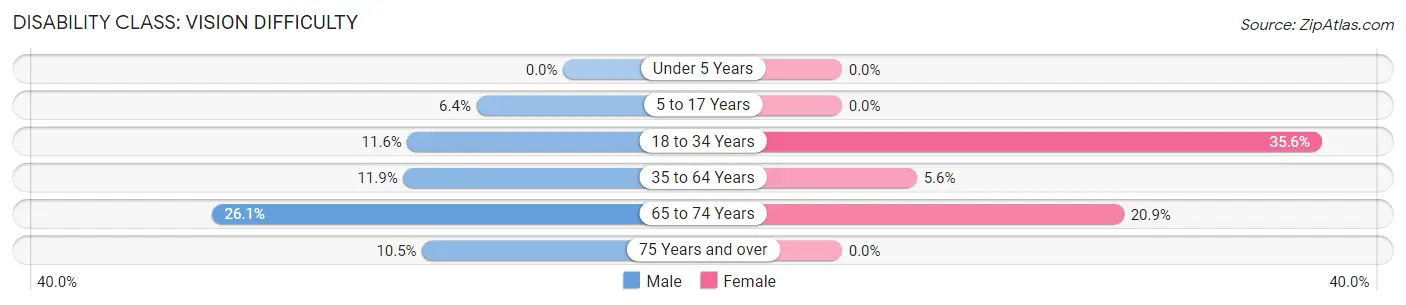
| Age Bracket | Male | Female |
| Under 5 Years | 0 (0.0%) | 0 (0.0%) |
| 5 to 17 Years | 11 (6.4%) | 0 (0.0%) |
| 18 to 34 Years | 43 (11.6%) | 129 (35.6%) |
| 35 to 64 Years | 80 (11.9%) | 33 (5.6%) |
| 65 to 74 Years | 41 (26.1%) | 45 (20.9%) |
| 75 Years and over | 16 (10.5%) | 0 (0.0%) |
Disability Class: Cognitive Difficulty
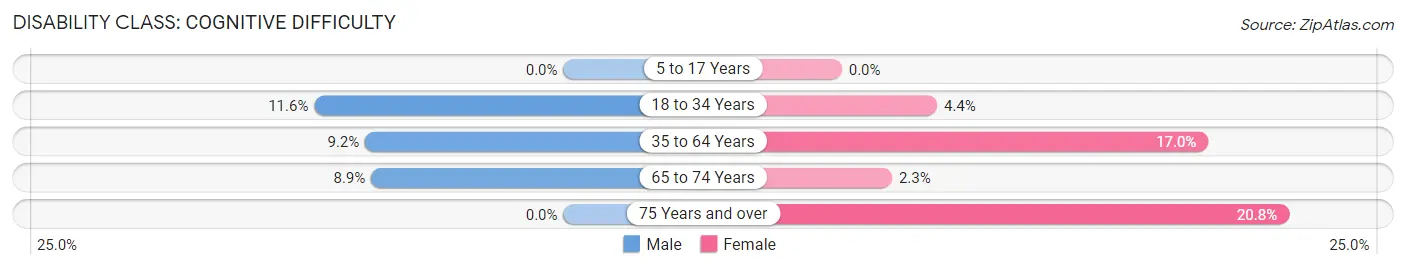
| Age Bracket | Male | Female |
| 5 to 17 Years | 0 (0.0%) | 0 (0.0%) |
| 18 to 34 Years | 43 (11.6%) | 16 (4.4%) |
| 35 to 64 Years | 62 (9.2%) | 101 (17.0%) |
| 65 to 74 Years | 14 (8.9%) | 5 (2.3%) |
| 75 Years and over | 0 (0.0%) | 33 (20.7%) |
Disability Class: Ambulatory Difficulty
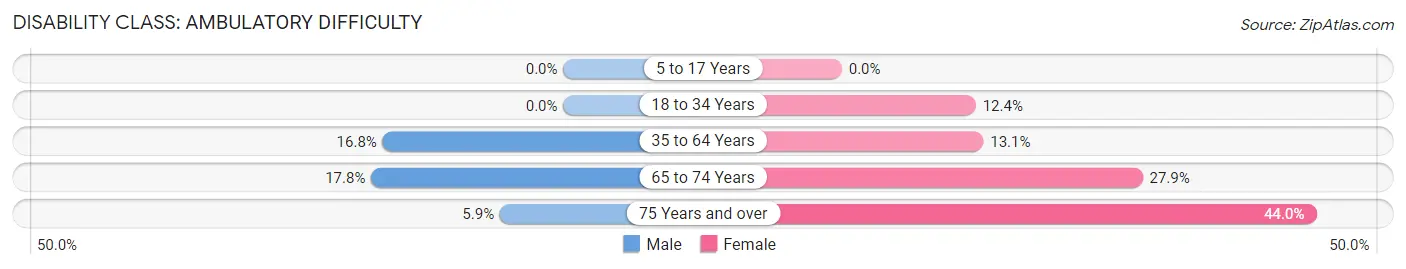
| Age Bracket | Male | Female |
| 5 to 17 Years | 0 (0.0%) | 0 (0.0%) |
| 18 to 34 Years | 0 (0.0%) | 45 (12.4%) |
| 35 to 64 Years | 113 (16.8%) | 78 (13.1%) |
| 65 to 74 Years | 28 (17.8%) | 60 (27.9%) |
| 75 Years and over | 9 (5.9%) | 70 (44.0%) |
Disability Class: Self-Care Difficulty
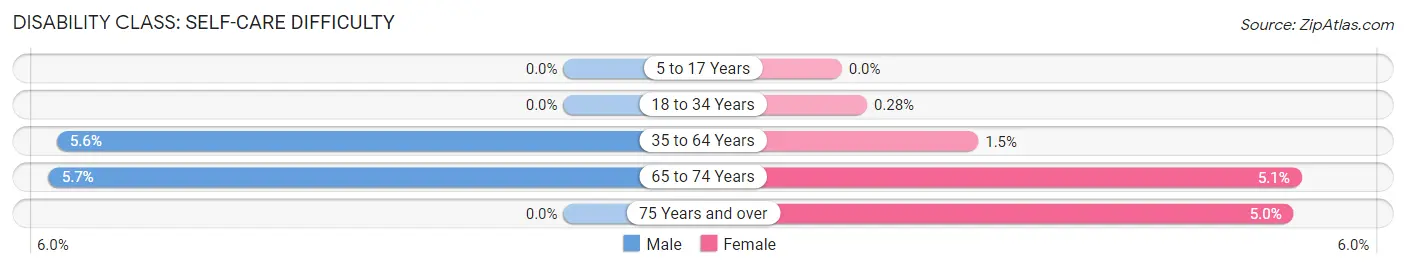
| Age Bracket | Male | Female |
| 5 to 17 Years | 0 (0.0%) | 0 (0.0%) |
| 18 to 34 Years | 0 (0.0%) | 1 (0.3%) |
| 35 to 64 Years | 38 (5.6%) | 9 (1.5%) |
| 65 to 74 Years | 9 (5.7%) | 11 (5.1%) |
| 75 Years and over | 0 (0.0%) | 8 (5.0%) |
Technology Access in Centerville
Computing Device Access in Centerville
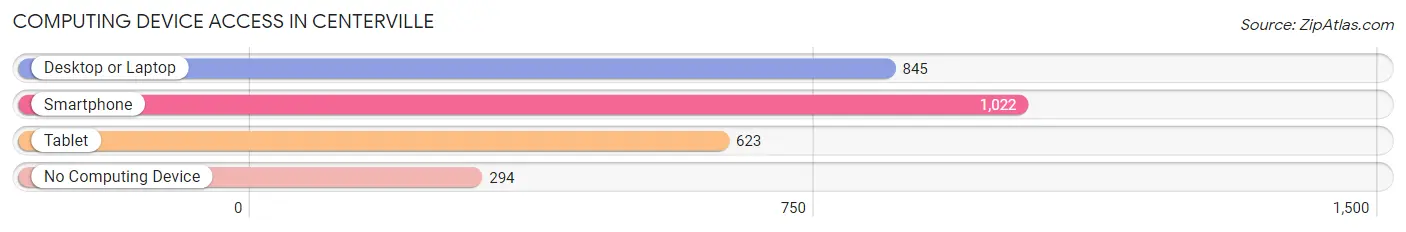
| Device Type | # Households | % Households |
| Desktop or Laptop | 845 | 61.1% |
| Smartphone | 1,022 | 73.9% |
| Tablet | 623 | 45.1% |
| No Computing Device | 294 | 21.3% |
| Total | 1,383 | 100.0% |
Internet Access in Centerville
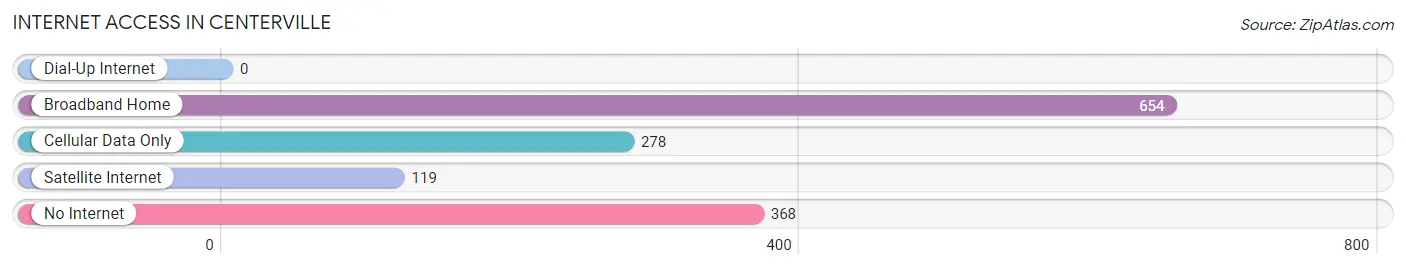
| Internet Type | # Households | % Households |
| Dial-Up Internet | 0 | 0.0% |
| Broadband Home | 654 | 47.3% |
| Cellular Data Only | 278 | 20.1% |
| Satellite Internet | 119 | 8.6% |
| No Internet | 368 | 26.6% |
| Total | 1,383 | 100.0% |
Centerville Summary
Centerville, Tennessee is a small town located in Hickman County, Tennessee. It is situated about 30 miles south of Nashville and is part of the Nashville metropolitan area. The town has a population of approximately 5,000 people and is known for its rural charm and friendly atmosphere.
History
Centerville was founded in 1810 by a group of settlers from North Carolina. The town was originally called Hickman Court House, but the name was changed to Centerville in 1817. The town was named after the nearby Centerville Creek, which was named for its location at the center of Hickman County.
The town grew slowly but steadily over the years, and by the mid-1800s, it had become a thriving agricultural center. The town was home to several cotton gins, a grist mill, and a sawmill. In 1871, the town was incorporated and the first mayor was elected.
In the early 1900s, the town began to experience a period of growth and development. The railroad arrived in Centerville in 1906, and the town soon became a major shipping center for the surrounding area. The town also became a popular tourist destination, with several hotels and resorts opening up in the area.
Geography
Centerville is located in the rolling hills of Hickman County, Tennessee. The town is situated at the intersection of two major highways, US Highway 31 and State Highway 50. The town is surrounded by farmland and is located about 30 miles south of Nashville.
The town is situated on the banks of the Duck River, which is a major tributary of the Tennessee River. The Duck River is a popular destination for fishing and canoeing. The town is also home to several parks and recreational areas, including the Centerville City Park and the Centerville Nature Center.
Economy
Centerville’s economy is largely based on agriculture and tourism. The town is home to several farms, which produce a variety of crops, including corn, soybeans, and cotton. The town is also home to several tourist attractions, including the Centerville City Park and the Centerville Nature Center.
The town is also home to several small businesses, including restaurants, retail stores, and service providers. The town is also home to several manufacturing companies, including a furniture factory and a plastics factory.
Demographics
As of the 2010 census, the population of Centerville was 5,000. The town is predominantly white, with about 90% of the population being Caucasian. The town also has a small African American population, with about 5% of the population being African American.
The median household income in Centerville is $41,000, and the median home value is $125,000. The town has a low unemployment rate, with only about 4% of the population being unemployed.
Conclusion
Centerville, Tennessee is a small town located in Hickman County, Tennessee. It is situated about 30 miles south of Nashville and is part of the Nashville metropolitan area. The town has a population of approximately 5,000 people and is known for its rural charm and friendly atmosphere. The town’s economy is largely based on agriculture and tourism, and the town is home to several small businesses, manufacturing companies, and tourist attractions. The town is predominantly white, with about 90% of the population being Caucasian. The median household income in Centerville is $41,000, and the median home value is $125,000.
Common Questions
What is Per Capita Income in Centerville?
Per Capita income in Centerville is $24,643.
What is the Median Family Income in Centerville?
Median Family Income in Centerville is $54,880.
What is the Median Household income in Centerville?
Median Household Income in Centerville is $46,719.
What is Income or Wage Gap in Centerville?
Income or Wage Gap in Centerville is 12.3%.
Women in Centerville earn 87.7 cents for every dollar earned by a man.
What is Inequality or Gini Index in Centerville?
Inequality or Gini Index in Centerville is 0.41.
What is the Total Population of Centerville?
Total Population of Centerville is 3,515.
What is the Total Male Population of Centerville?
Total Male Population of Centerville is 1,679.
What is the Total Female Population of Centerville?
Total Female Population of Centerville is 1,836.
What is the Ratio of Males per 100 Females in Centerville?
There are 91.45 Males per 100 Females in Centerville.
What is the Ratio of Females per 100 Males in Centerville?
There are 109.35 Females per 100 Males in Centerville.
What is the Median Population Age in Centerville?
Median Population Age in Centerville is 46.8 Years.
What is the Average Family Size in Centerville
Average Family Size in Centerville is 2.9 People.
What is the Average Household Size in Centerville
Average Household Size in Centerville is 2.4 People.
How Large is the Labor Force in Centerville?
There are 1,302 People in the Labor Forcein in Centerville.
What is the Percentage of People in the Labor Force in Centerville?
43.6% of People are in the Labor Force in Centerville.
What is the Unemployment Rate in Centerville?
Unemployment Rate in Centerville is 5.0%.