Westmoreland, TN Map & Demographics
Westmoreland Map
Westmoreland Overview
$26,295
PER CAPITA INCOME
$60,350
AVG FAMILY INCOME
$58,194
AVG HOUSEHOLD INCOME
12.5%
WAGE / INCOME GAP [ % ]
87.5¢/ $1
WAGE / INCOME GAP [ $ ]
0.42
INEQUALITY / GINI INDEX
2,711
TOTAL POPULATION
1,214
MALE POPULATION
1,497
FEMALE POPULATION
81.10
MALES / 100 FEMALES
123.31
FEMALES / 100 MALES
36.8
MEDIAN AGE
3.2
AVG FAMILY SIZE
2.8
AVG HOUSEHOLD SIZE
1,268
LABOR FORCE [ PEOPLE ]
62.5%
PERCENT IN LABOR FORCE
6.0%
UNEMPLOYMENT RATE
Westmoreland Zip Codes
Westmoreland Area Codes
Income in Westmoreland
Income Overview in Westmoreland
Per Capita Income in Westmoreland is $26,295, while median incomes of families and households are $60,350 and $58,194 respectively.
| Characteristic | Number | Measure |
| Per Capita Income | 2,711 | $26,295 |
| Median Family Income | 671 | $60,350 |
| Mean Family Income | 671 | $80,073 |
| Median Household Income | 929 | $58,194 |
| Mean Household Income | 929 | $74,029 |
| Income Deficit | 671 | $0 |
| Wage / Income Gap (%) | 2,711 | 12.47% |
| Wage / Income Gap ($) | 2,711 | 87.53¢ per $1 |
| Gini / Inequality Index | 2,711 | 0.42 |
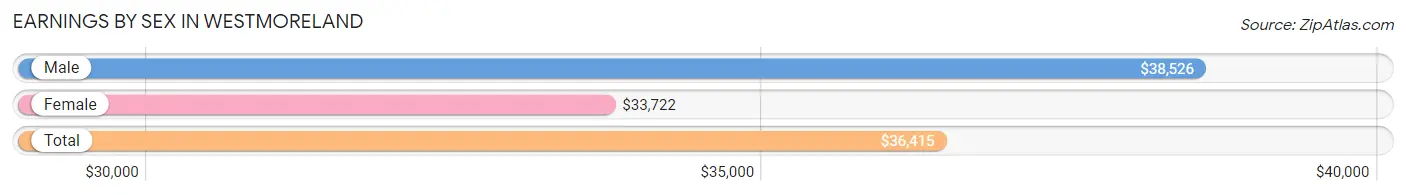
Earnings by Sex in Westmoreland
Average Earnings in Westmoreland are $36,415, $38,526 for men and $33,722 for women, a difference of 12.5%.
| Sex | Number | Average Earnings |
| Male | 660 (50.9%) | $38,526 |
| Female | 637 (49.1%) | $33,722 |
| Total | 1,297 (100.0%) | $36,415 |
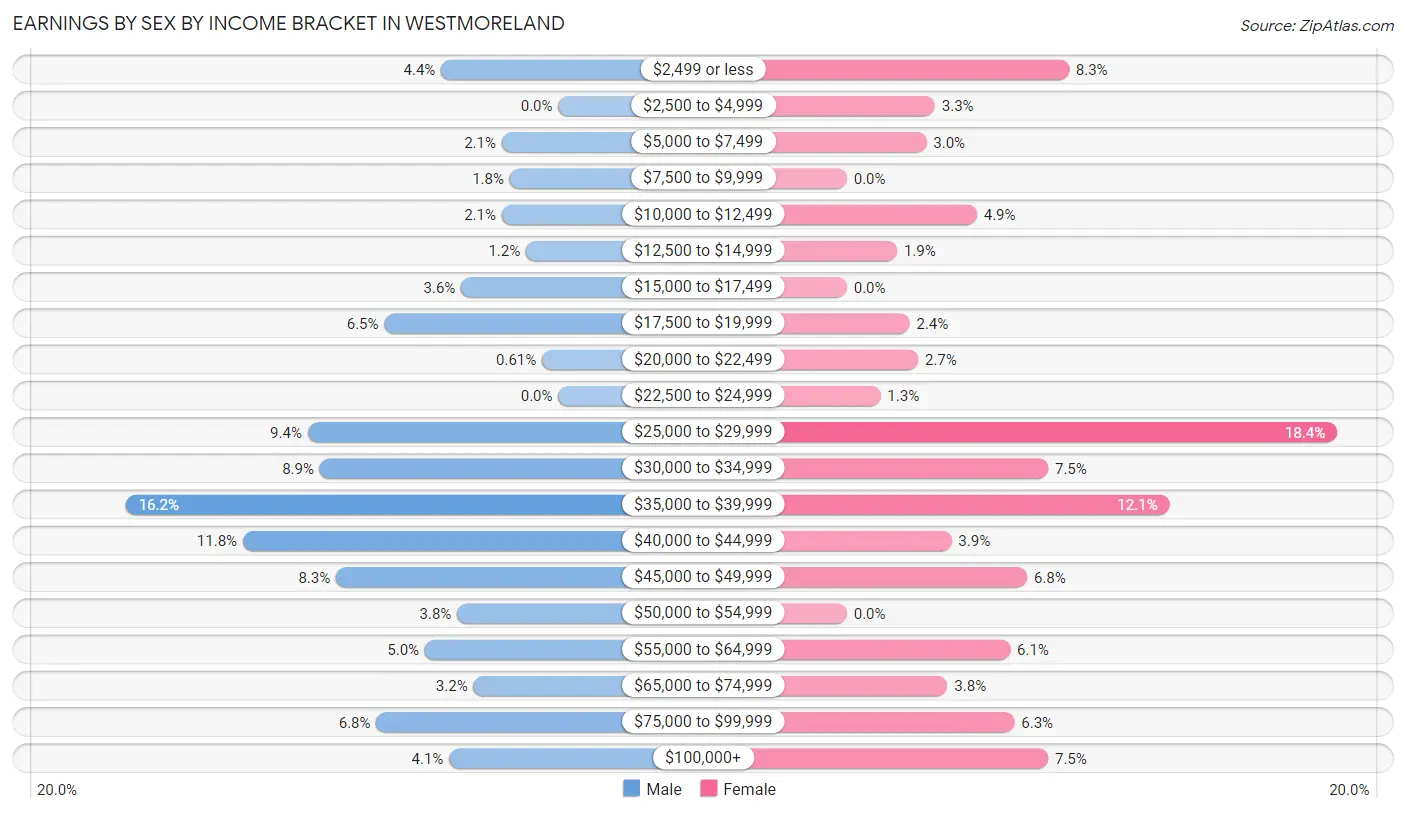
Earnings by Sex by Income Bracket in Westmoreland
The most common earnings brackets in Westmoreland are $35,000 to $39,999 for men (107 | 16.2%) and $25,000 to $29,999 for women (117 | 18.4%).
| Income | Male | Female |
| $2,499 or less | 29 (4.4%) | 53 (8.3%) |
| $2,500 to $4,999 | 0 (0.0%) | 21 (3.3%) |
| $5,000 to $7,499 | 14 (2.1%) | 19 (3.0%) |
| $7,500 to $9,999 | 12 (1.8%) | 0 (0.0%) |
| $10,000 to $12,499 | 14 (2.1%) | 31 (4.9%) |
| $12,500 to $14,999 | 8 (1.2%) | 12 (1.9%) |
| $15,000 to $17,499 | 24 (3.6%) | 0 (0.0%) |
| $17,500 to $19,999 | 43 (6.5%) | 15 (2.4%) |
| $20,000 to $22,499 | 4 (0.6%) | 17 (2.7%) |
| $22,500 to $24,999 | 0 (0.0%) | 8 (1.3%) |
| $25,000 to $29,999 | 62 (9.4%) | 117 (18.4%) |
| $30,000 to $34,999 | 59 (8.9%) | 48 (7.5%) |
| $35,000 to $39,999 | 107 (16.2%) | 77 (12.1%) |
| $40,000 to $44,999 | 78 (11.8%) | 25 (3.9%) |
| $45,000 to $49,999 | 55 (8.3%) | 43 (6.8%) |
| $50,000 to $54,999 | 25 (3.8%) | 0 (0.0%) |
| $55,000 to $64,999 | 33 (5.0%) | 39 (6.1%) |
| $65,000 to $74,999 | 21 (3.2%) | 24 (3.8%) |
| $75,000 to $99,999 | 45 (6.8%) | 40 (6.3%) |
| $100,000+ | 27 (4.1%) | 48 (7.5%) |
| Total | 660 (100.0%) | 637 (100.0%) |
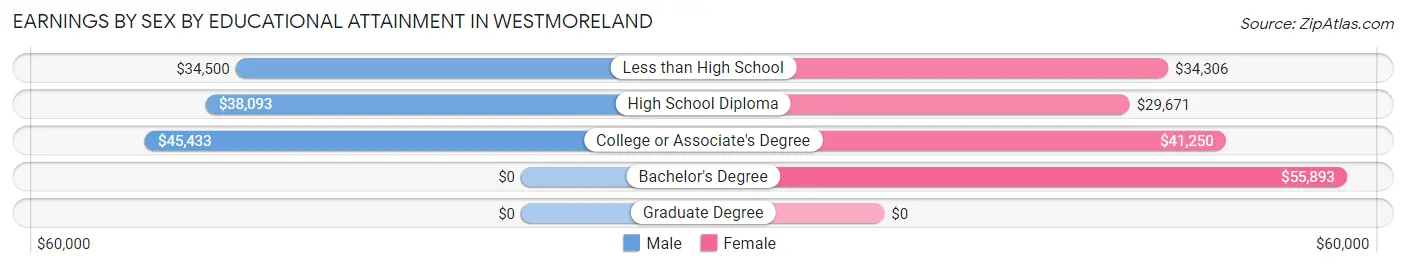
Earnings by Sex by Educational Attainment in Westmoreland
Average earnings in Westmoreland are $38,942 for men and $36,680 for women, a difference of 5.8%. Men with an educational attainment of college or associate's degree enjoy the highest average annual earnings of $45,433, while those with less than high school education earn the least with $34,500. Women with an educational attainment of bachelor's degree earn the most with the average annual earnings of $55,893, while those with high school diploma education have the smallest earnings of $29,671.
| Educational Attainment | Male Income | Female Income |
| Less than High School | $34,500 | $34,306 |
| High School Diploma | $38,093 | $29,671 |
| College or Associate's Degree | $45,433 | $41,250 |
| Bachelor's Degree | - | - |
| Graduate Degree | - | - |
| Total | $38,942 | $36,680 |
Family Income in Westmoreland
Family Income Brackets in Westmoreland
According to the Westmoreland family income data, there are 156 families falling into the $50,000 to $74,999 income range, which is the most common income bracket and makes up 23.3% of all families. Conversely, the $15,000 to $24,999 income bracket is the least frequent group with only 14 families (2.1%) belonging to this category.
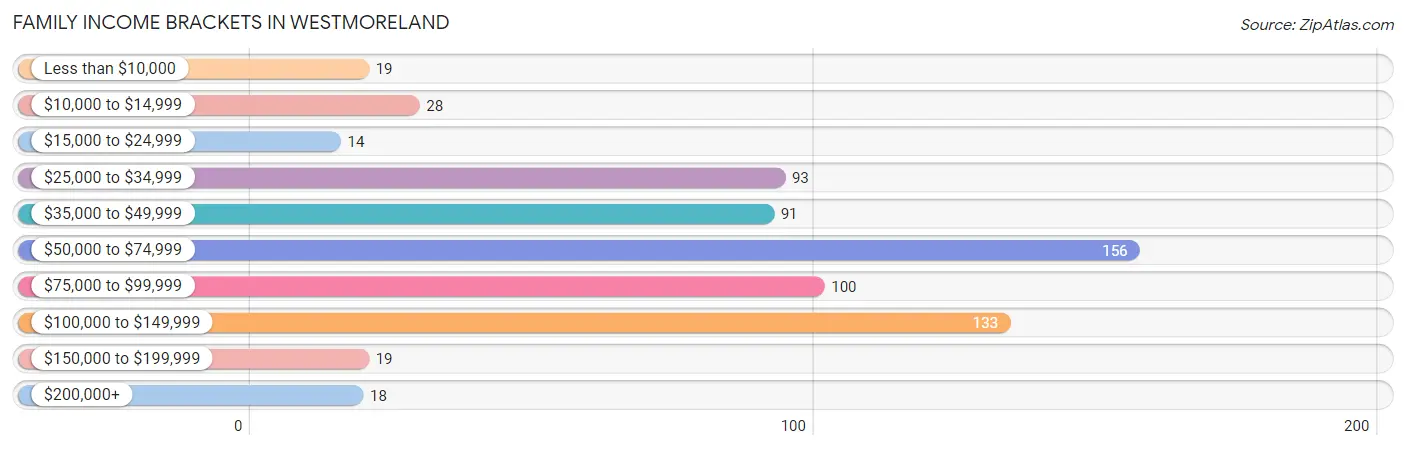
| Income Bracket | # Families | % Families |
| Less than $10,000 | 19 | 2.8% |
| $10,000 to $14,999 | 28 | 4.2% |
| $15,000 to $24,999 | 14 | 2.1% |
| $25,000 to $34,999 | 93 | 13.9% |
| $35,000 to $49,999 | 91 | 13.6% |
| $50,000 to $74,999 | 156 | 23.2% |
| $75,000 to $99,999 | 100 | 14.9% |
| $100,000 to $149,999 | 133 | 19.8% |
| $150,000 to $199,999 | 19 | 2.8% |
| $200,000+ | 18 | 2.7% |
Family Income by Famaliy Size in Westmoreland
4-person families (156 | 23.3%) account for the highest median family income in Westmoreland with $71,979 per family, while 2-person families (237 | 35.3%) have the highest median income of $30,775 per family member.
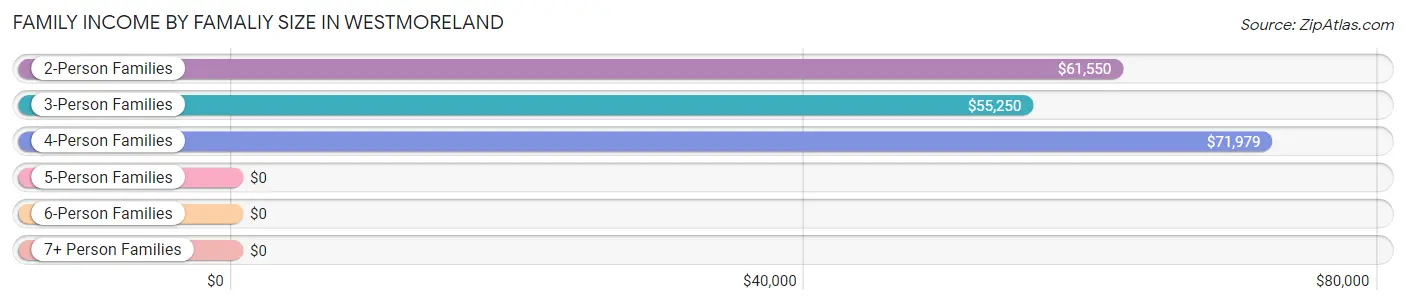
| Income Bracket | # Families | Median Income |
| 2-Person Families | 237 (35.3%) | $61,550 |
| 3-Person Families | 182 (27.1%) | $55,250 |
| 4-Person Families | 156 (23.3%) | $71,979 |
| 5-Person Families | 74 (11.0%) | $0 |
| 6-Person Families | 16 (2.4%) | $0 |
| 7+ Person Families | 6 (0.9%) | $0 |
| Total | 671 (100.0%) | $60,350 |
Family Income by Number of Earners in Westmoreland
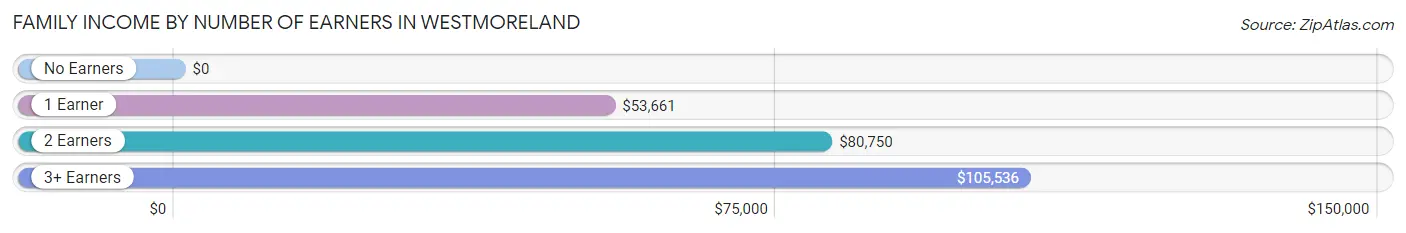
| Number of Earners | # Families | Median Income |
| No Earners | 86 (12.8%) | $0 |
| 1 Earner | 253 (37.7%) | $53,661 |
| 2 Earners | 260 (38.8%) | $80,750 |
| 3+ Earners | 72 (10.7%) | $105,536 |
| Total | 671 (100.0%) | $60,350 |
Household Income in Westmoreland
Household Income Brackets in Westmoreland
With 193 households falling in the category, the $50,000 to $74,999 income range is the most frequent in Westmoreland, accounting for 20.8% of all households. In contrast, only 18 households (1.9%) fall into the $200,000+ income bracket, making it the least populous group.
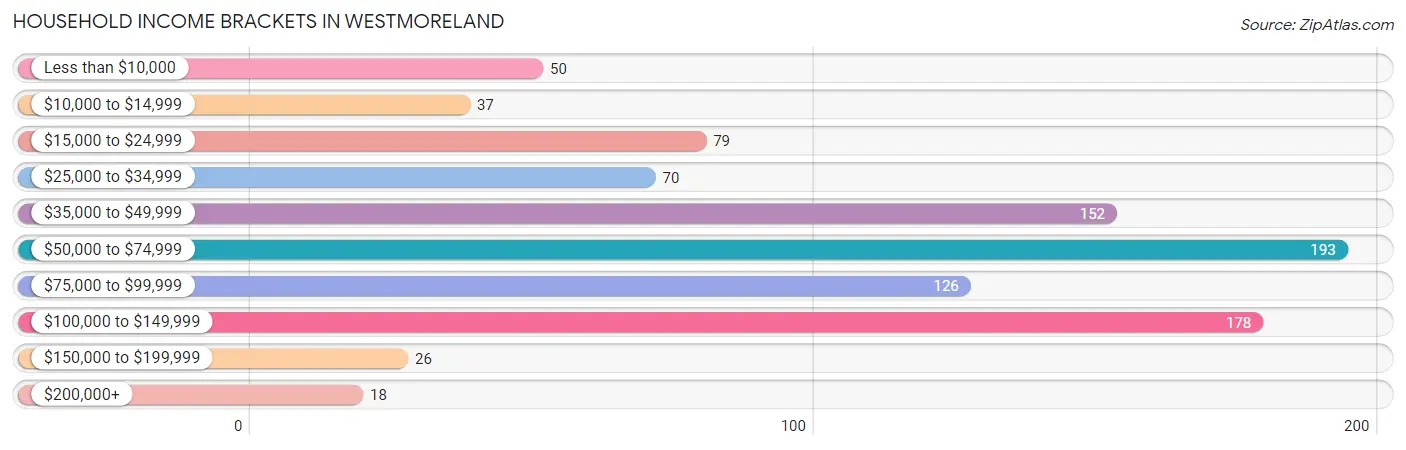
| Income Bracket | # Households | % Households |
| Less than $10,000 | 50 | 5.4% |
| $10,000 to $14,999 | 37 | 4.0% |
| $15,000 to $24,999 | 79 | 8.5% |
| $25,000 to $34,999 | 70 | 7.5% |
| $35,000 to $49,999 | 152 | 16.4% |
| $50,000 to $74,999 | 193 | 20.8% |
| $75,000 to $99,999 | 126 | 13.6% |
| $100,000 to $149,999 | 178 | 19.2% |
| $150,000 to $199,999 | 26 | 2.8% |
| $200,000+ | 18 | 1.9% |
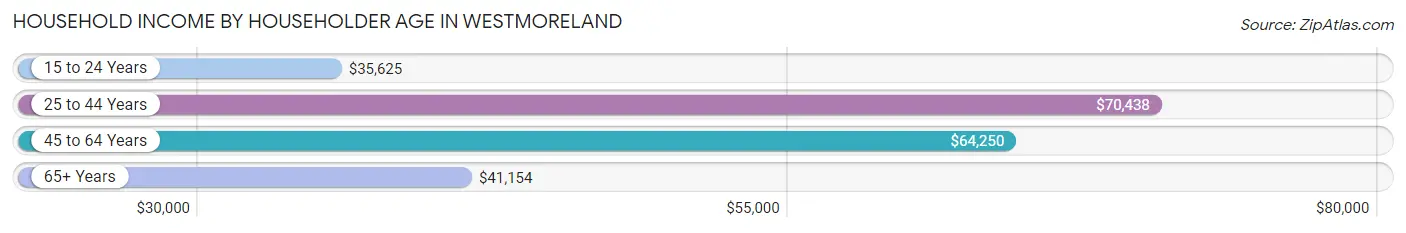
Household Income by Householder Age in Westmoreland
The median household income in Westmoreland is $58,194, with the highest median household income of $70,438 found in the 25 to 44 years age bracket for the primary householder. A total of 415 households (44.7%) fall into this category. Meanwhile, the 15 to 24 years age bracket for the primary householder has the lowest median household income of $35,625, with 51 households (5.5%) in this group.
| Income Bracket | # Households | Median Income |
| 15 to 24 Years | 51 (5.5%) | $35,625 |
| 25 to 44 Years | 415 (44.7%) | $70,438 |
| 45 to 64 Years | 253 (27.2%) | $64,250 |
| 65+ Years | 210 (22.6%) | $41,154 |
| Total | 929 (100.0%) | $58,194 |
Poverty in Westmoreland
Income Below Poverty by Sex and Age in Westmoreland
With 10.7% poverty level for males and 11.1% for females among the residents of Westmoreland, 5 year old males and 15 year old females are the most vulnerable to poverty, with 6 males (46.2%) and 10 females (62.5%) in their respective age groups living below the poverty level.
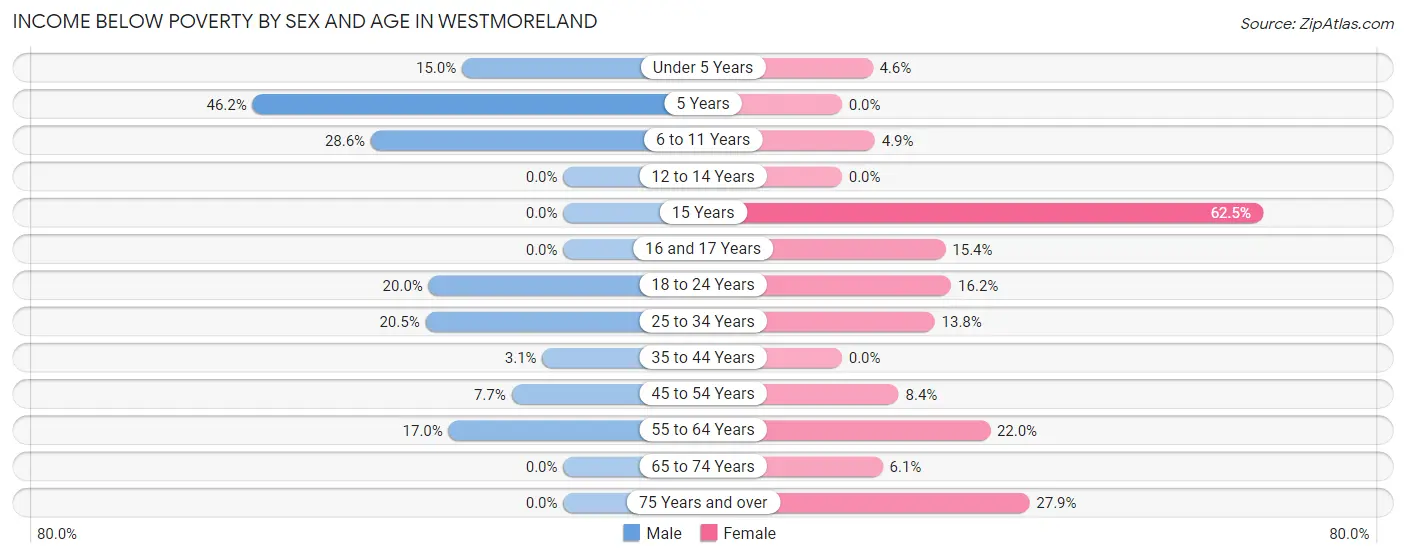
| Age Bracket | Male | Female |
| Under 5 Years | 17 (15.0%) | 8 (4.5%) |
| 5 Years | 6 (46.2%) | 0 (0.0%) |
| 6 to 11 Years | 22 (28.6%) | 7 (4.9%) |
| 12 to 14 Years | 0 (0.0%) | 0 (0.0%) |
| 15 Years | 0 (0.0%) | 10 (62.5%) |
| 16 and 17 Years | 0 (0.0%) | 4 (15.4%) |
| 18 to 24 Years | 13 (20.0%) | 19 (16.2%) |
| 25 to 34 Years | 26 (20.5%) | 31 (13.8%) |
| 35 to 44 Years | 8 (3.1%) | 0 (0.0%) |
| 45 to 54 Years | 11 (7.7%) | 7 (8.4%) |
| 55 to 64 Years | 23 (17.0%) | 44 (22.0%) |
| 65 to 74 Years | 0 (0.0%) | 6 (6.1%) |
| 75 Years and over | 0 (0.0%) | 22 (27.9%) |
| Total | 126 (10.7%) | 158 (11.1%) |
Income Above Poverty by Sex and Age in Westmoreland
According to the poverty statistics in Westmoreland, males aged 12 to 14 years and females aged 5 years are the age groups that are most secure financially, with 100.0% of males and 100.0% of females in these age groups living above the poverty line.
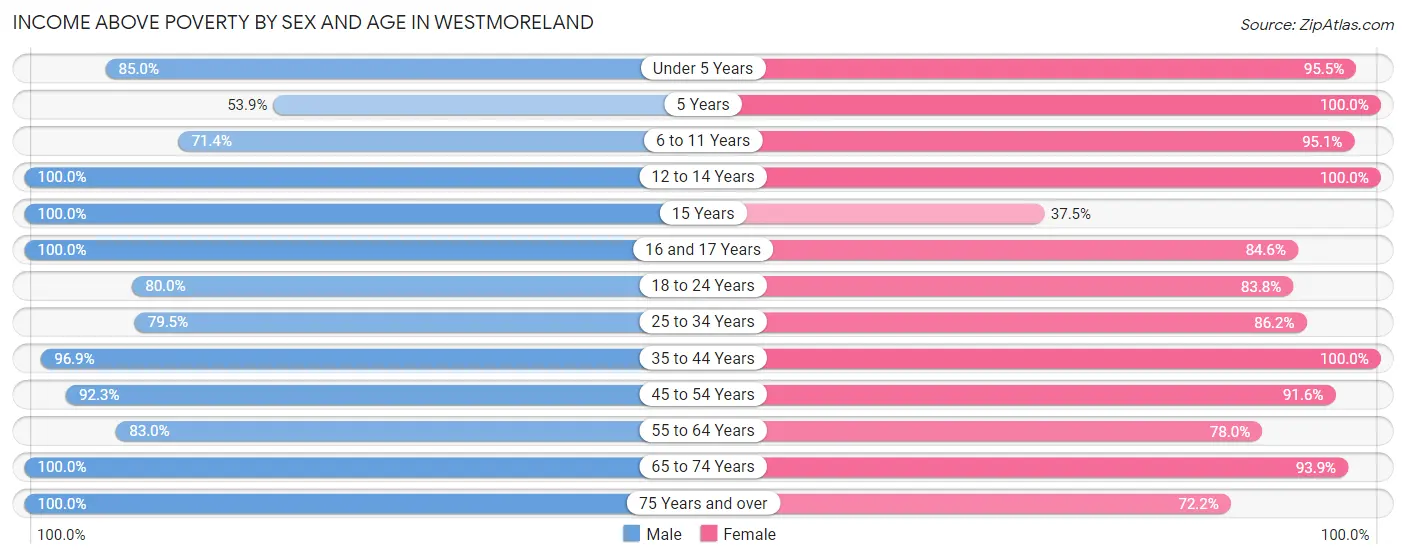
| Age Bracket | Male | Female |
| Under 5 Years | 96 (85.0%) | 168 (95.5%) |
| 5 Years | 7 (53.8%) | 29 (100.0%) |
| 6 to 11 Years | 55 (71.4%) | 136 (95.1%) |
| 12 to 14 Years | 60 (100.0%) | 28 (100.0%) |
| 15 Years | 27 (100.0%) | 6 (37.5%) |
| 16 and 17 Years | 52 (100.0%) | 22 (84.6%) |
| 18 to 24 Years | 52 (80.0%) | 98 (83.8%) |
| 25 to 34 Years | 101 (79.5%) | 194 (86.2%) |
| 35 to 44 Years | 249 (96.9%) | 200 (100.0%) |
| 45 to 54 Years | 132 (92.3%) | 76 (91.6%) |
| 55 to 64 Years | 112 (83.0%) | 156 (78.0%) |
| 65 to 74 Years | 98 (100.0%) | 93 (93.9%) |
| 75 Years and over | 15 (100.0%) | 57 (72.2%) |
| Total | 1,056 (89.3%) | 1,263 (88.9%) |
Income Below Poverty Among Married-Couple Families in Westmoreland
The poverty statistics for married-couple families in Westmoreland show that 8.2% or 42 of the total 515 families live below the poverty line. Families with 1 or 2 children have the highest poverty rate of 17.3%, comprising of 42 families. On the other hand, families with no children have the lowest poverty rate of 0.0%, which includes 0 families.
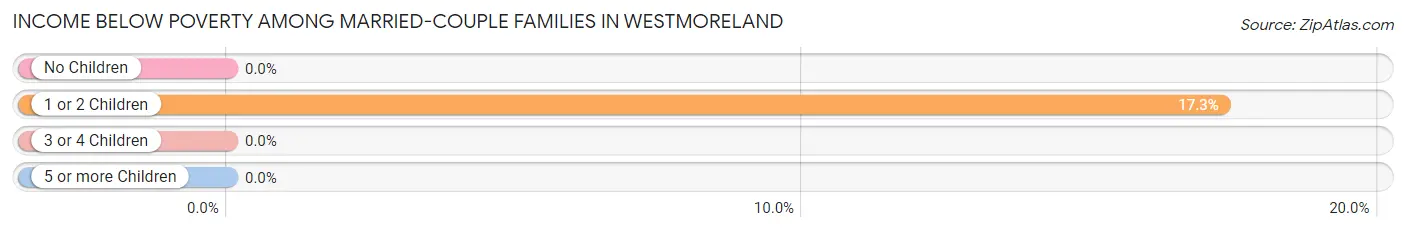
| Children | Above Poverty | Below Poverty |
| No Children | 210 (100.0%) | 0 (0.0%) |
| 1 or 2 Children | 201 (82.7%) | 42 (17.3%) |
| 3 or 4 Children | 62 (100.0%) | 0 (0.0%) |
| 5 or more Children | 0 (0.0%) | 0 (0.0%) |
| Total | 473 (91.8%) | 42 (8.2%) |
Income Below Poverty Among Single-Parent Households in Westmoreland
According to the poverty data in Westmoreland, 35.7% or 5 single-father households and 13.4% or 19 single-mother households are living below the poverty line. Among single-father households, those with 1 or 2 children have the highest poverty rate, with 5 households (100.0%) experiencing poverty. Likewise, among single-mother households, those with no children have the highest poverty rate, with 6 households (15.0%) falling below the poverty line.
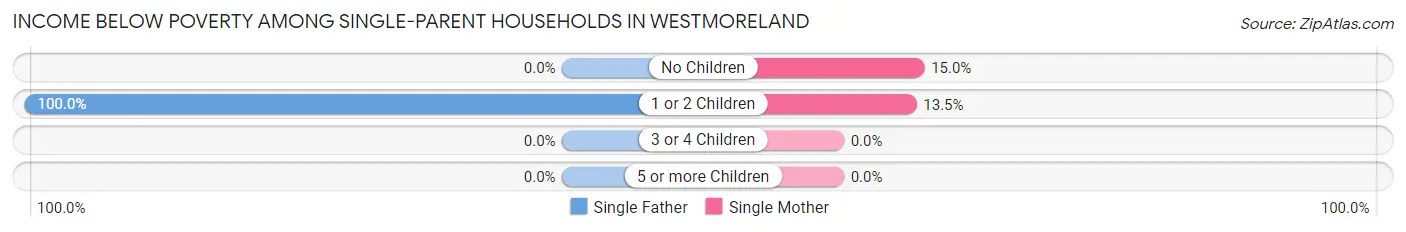
| Children | Single Father | Single Mother |
| No Children | 0 (0.0%) | 6 (15.0%) |
| 1 or 2 Children | 5 (100.0%) | 13 (13.5%) |
| 3 or 4 Children | 0 (0.0%) | 0 (0.0%) |
| 5 or more Children | 0 (0.0%) | 0 (0.0%) |
| Total | 5 (35.7%) | 19 (13.4%) |
Income Below Poverty Among Married-Couple vs Single-Parent Households in Westmoreland
The poverty data for Westmoreland shows that 42 of the married-couple family households (8.2%) and 24 of the single-parent households (15.4%) are living below the poverty level. Within the married-couple family households, those with 1 or 2 children have the highest poverty rate, with 42 households (17.3%) falling below the poverty line. Among the single-parent households, those with 1 or 2 children have the highest poverty rate, with 18 household (17.8%) living below poverty.
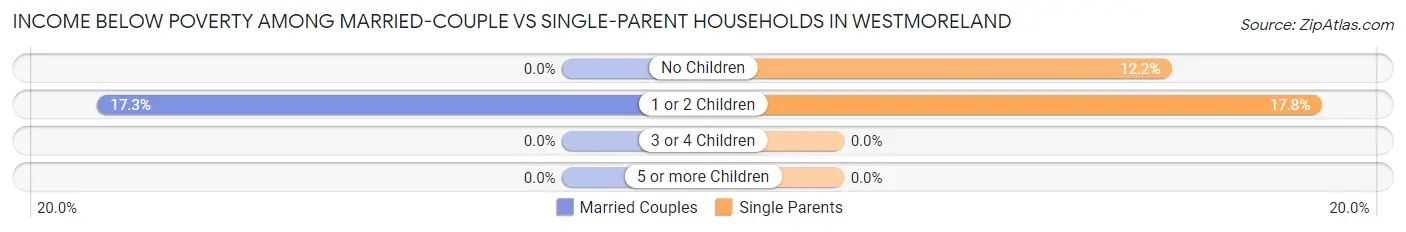
| Children | Married-Couple Families | Single-Parent Households |
| No Children | 0 (0.0%) | 6 (12.2%) |
| 1 or 2 Children | 42 (17.3%) | 18 (17.8%) |
| 3 or 4 Children | 0 (0.0%) | 0 (0.0%) |
| 5 or more Children | 0 (0.0%) | 0 (0.0%) |
| Total | 42 (8.2%) | 24 (15.4%) |
Race in Westmoreland
The most populous races in Westmoreland are White / Caucasian (2,492 | 91.9%), Two or more Races (170 | 6.3%), and Hispanic or Latino (68 | 2.5%).
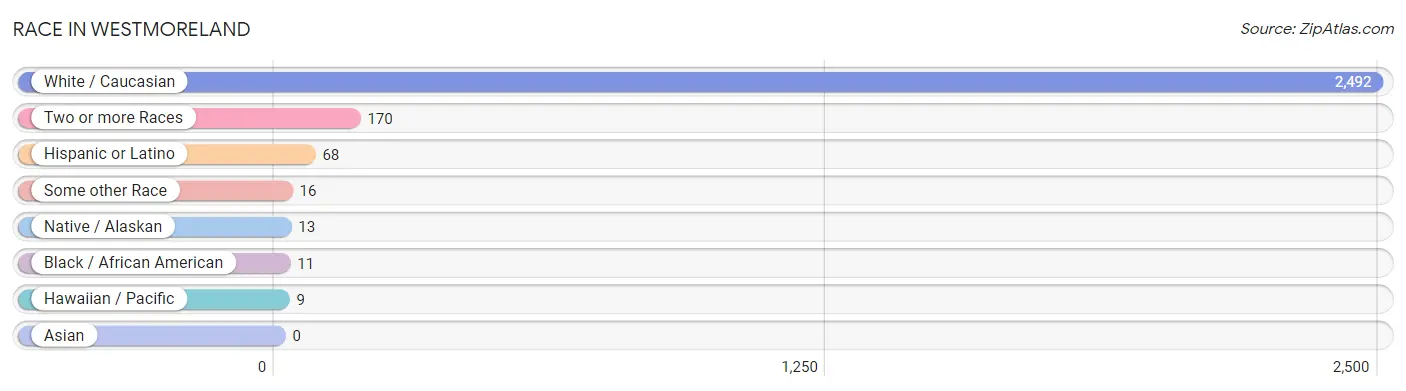
| Race | # Population | % Population |
| Asian | 0 | 0.0% |
| Black / African American | 11 | 0.4% |
| Hawaiian / Pacific | 9 | 0.3% |
| Hispanic or Latino | 68 | 2.5% |
| Native / Alaskan | 13 | 0.5% |
| White / Caucasian | 2,492 | 91.9% |
| Two or more Races | 170 | 6.3% |
| Some other Race | 16 | 0.6% |
| Total | 2,711 | 100.0% |
Ancestry in Westmoreland
The most populous ancestries reported in Westmoreland are American (542 | 20.0%), German (216 | 8.0%), Irish (191 | 7.0%), English (186 | 6.9%), and Scottish (77 | 2.8%), together accounting for 44.7% of all Westmoreland residents.
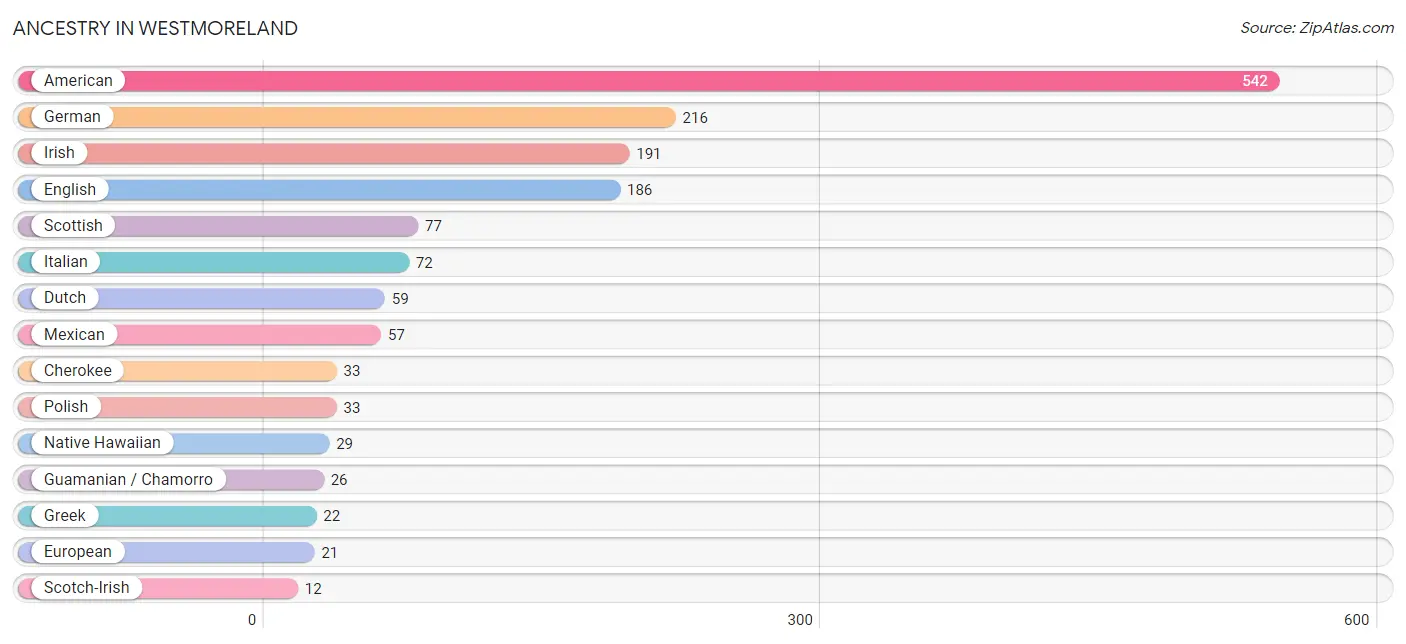
| Ancestry | # Population | % Population |
| American | 542 | 20.0% |
| Cherokee | 33 | 1.2% |
| Danish | 11 | 0.4% |
| Dutch | 59 | 2.2% |
| English | 186 | 6.9% |
| European | 21 | 0.8% |
| French | 6 | 0.2% |
| German | 216 | 8.0% |
| Greek | 22 | 0.8% |
| Guamanian / Chamorro | 26 | 1.0% |
| Irish | 191 | 7.0% |
| Italian | 72 | 2.7% |
| Mexican | 57 | 2.1% |
| Native Hawaiian | 29 | 1.1% |
| Polish | 33 | 1.2% |
| Puerto Rican | 11 | 0.4% |
| Scotch-Irish | 12 | 0.4% |
| Scottish | 77 | 2.8% | View All 18 Rows |
Immigrants in Westmoreland
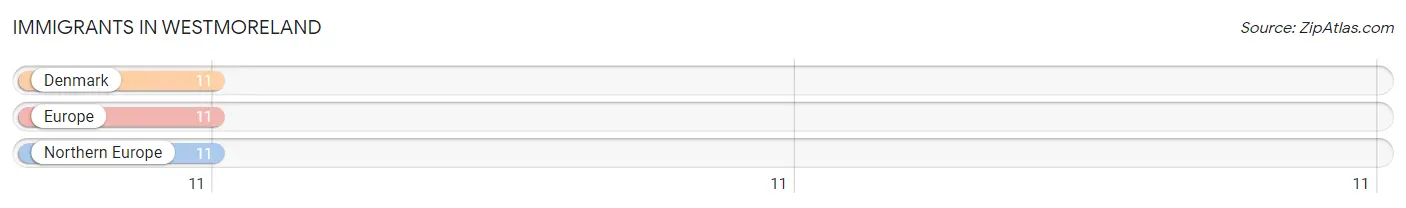
The most numerous immigrant groups reported in Westmoreland came from Denmark (11 | 0.4%), Europe (11 | 0.4%), and Northern Europe (11 | 0.4%), together accounting for 1.2% of all Westmoreland residents.
| Immigration Origin | # Population | % Population |
| Denmark | 11 | 0.4% |
| Europe | 11 | 0.4% |
| Northern Europe | 11 | 0.4% | View All 3 Rows |
Sex and Age in Westmoreland
Sex and Age in Westmoreland
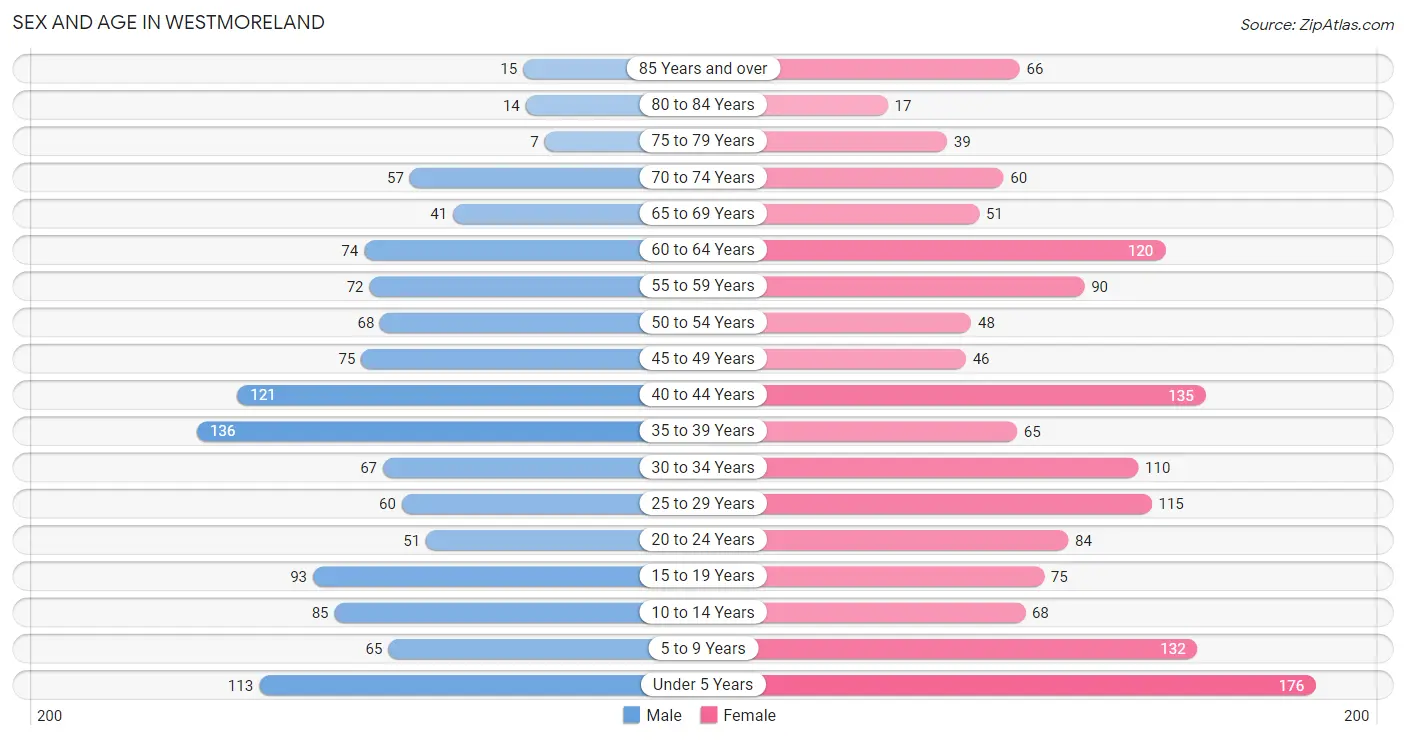
The most populous age groups in Westmoreland are 35 to 39 Years (136 | 11.2%) for men and Under 5 Years (176 | 11.8%) for women.
| Age Bracket | Male | Female |
| Under 5 Years | 113 (9.3%) | 176 (11.8%) |
| 5 to 9 Years | 65 (5.3%) | 132 (8.8%) |
| 10 to 14 Years | 85 (7.0%) | 68 (4.5%) |
| 15 to 19 Years | 93 (7.7%) | 75 (5.0%) |
| 20 to 24 Years | 51 (4.2%) | 84 (5.6%) |
| 25 to 29 Years | 60 (4.9%) | 115 (7.7%) |
| 30 to 34 Years | 67 (5.5%) | 110 (7.3%) |
| 35 to 39 Years | 136 (11.2%) | 65 (4.3%) |
| 40 to 44 Years | 121 (10.0%) | 135 (9.0%) |
| 45 to 49 Years | 75 (6.2%) | 46 (3.1%) |
| 50 to 54 Years | 68 (5.6%) | 48 (3.2%) |
| 55 to 59 Years | 72 (5.9%) | 90 (6.0%) |
| 60 to 64 Years | 74 (6.1%) | 120 (8.0%) |
| 65 to 69 Years | 41 (3.4%) | 51 (3.4%) |
| 70 to 74 Years | 57 (4.7%) | 60 (4.0%) |
| 75 to 79 Years | 7 (0.6%) | 39 (2.6%) |
| 80 to 84 Years | 14 (1.1%) | 17 (1.1%) |
| 85 Years and over | 15 (1.2%) | 66 (4.4%) |
| Total | 1,214 (100.0%) | 1,497 (100.0%) |
Families and Households in Westmoreland
Median Family Size in Westmoreland
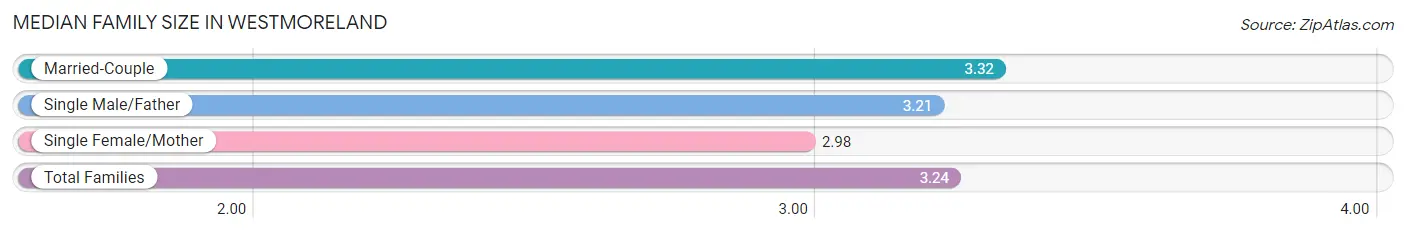
The median family size in Westmoreland is 3.24 persons per family, with married-couple families (515 | 76.7%) accounting for the largest median family size of 3.32 persons per family. On the other hand, single female/mother families (142 | 21.2%) represent the smallest median family size with 2.98 persons per family.
| Family Type | # Families | Family Size |
| Married-Couple | 515 (76.7%) | 3.32 |
| Single Male/Father | 14 (2.1%) | 3.21 |
| Single Female/Mother | 142 (21.2%) | 2.98 |
| Total Families | 671 (100.0%) | 3.24 |
Median Household Size in Westmoreland
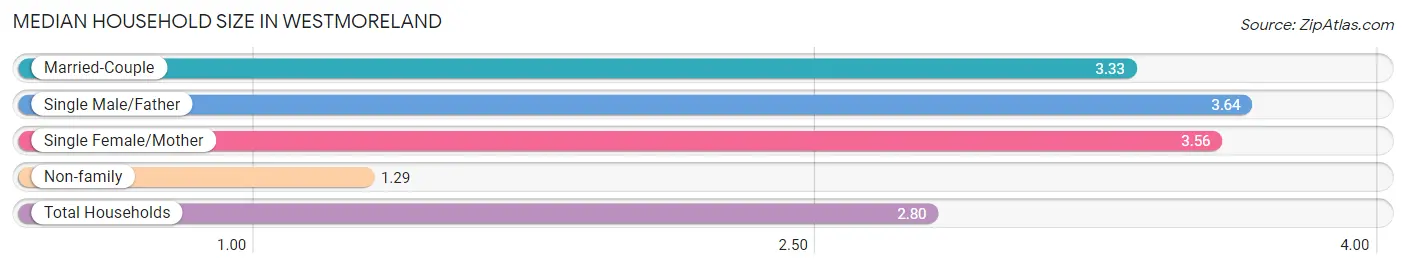
The median household size in Westmoreland is 2.80 persons per household, with single male/father households (14 | 1.5%) accounting for the largest median household size of 3.64 persons per household. non-family households (258 | 27.8%) represent the smallest median household size with 1.29 persons per household.
| Household Type | # Households | Household Size |
| Married-Couple | 515 (55.4%) | 3.33 |
| Single Male/Father | 14 (1.5%) | 3.64 |
| Single Female/Mother | 142 (15.3%) | 3.56 |
| Non-family | 258 (27.8%) | 1.29 |
| Total Households | 929 (100.0%) | 2.80 |
Household Size by Marriage Status in Westmoreland
Out of a total of 929 households in Westmoreland, 671 (72.2%) are family households, while 258 (27.8%) are nonfamily households. The most numerous type of family households are 2-person households, comprising 204, and the most common type of nonfamily households are 1-person households, comprising 198.
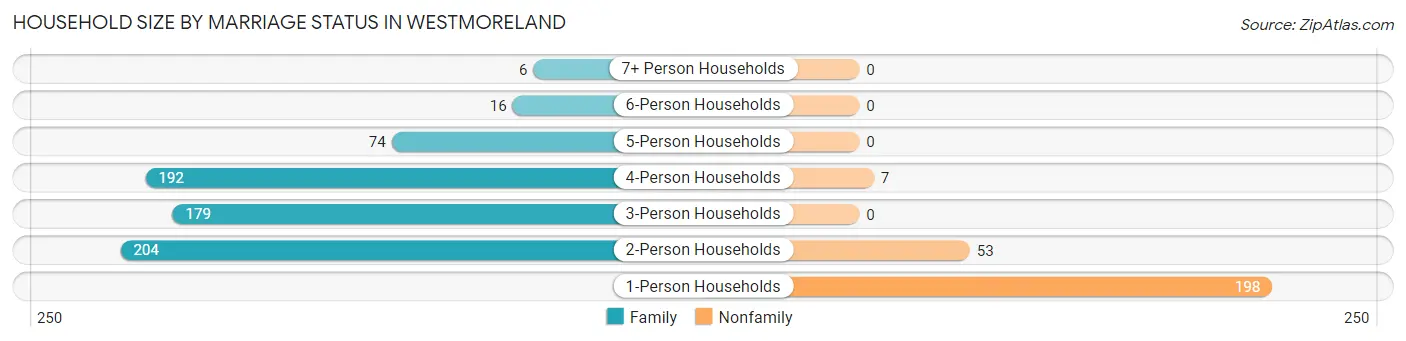
| Household Size | Family Households | Nonfamily Households |
| 1-Person Households | - | 198 (21.3%) |
| 2-Person Households | 204 (22.0%) | 53 (5.7%) |
| 3-Person Households | 179 (19.3%) | 0 (0.0%) |
| 4-Person Households | 192 (20.7%) | 7 (0.7%) |
| 5-Person Households | 74 (8.0%) | 0 (0.0%) |
| 6-Person Households | 16 (1.7%) | 0 (0.0%) |
| 7+ Person Households | 6 (0.6%) | 0 (0.0%) |
| Total | 671 (72.2%) | 258 (27.8%) |
Female Fertility in Westmoreland
Fertility by Age in Westmoreland
Average fertility rate in Westmoreland is 17.0 births per 1,000 women. Women in the age bracket of 20 to 34 years have the highest fertility rate with 36.0 births per 1,000 women. Women in the age bracket of 20 to 34 years acount for 100.0% of all women with births.
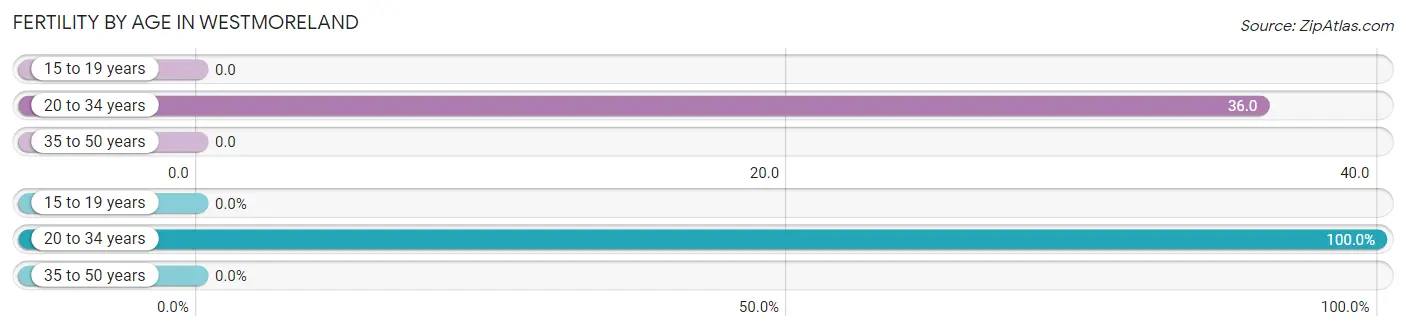
| Age Bracket | Women with Births | Births / 1,000 Women |
| 15 to 19 years | 0 (0.0%) | 0.0 |
| 20 to 34 years | 11 (100.0%) | 36.0 |
| 35 to 50 years | 0 (0.0%) | 0.0 |
| Total | 11 (100.0%) | 17.0 |
Fertility by Age by Marriage Status in Westmoreland
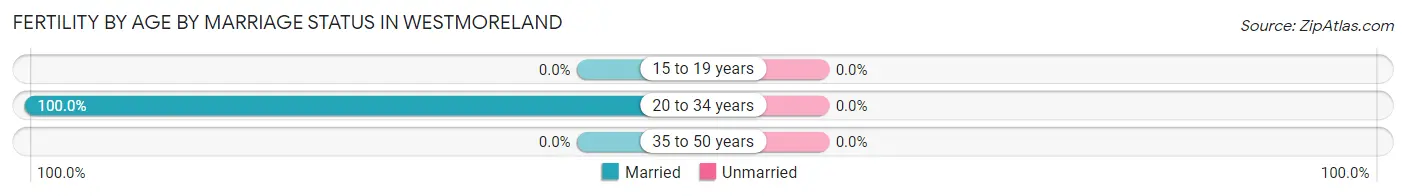
| Age Bracket | Married | Unmarried |
| 15 to 19 years | 0 (0.0%) | 0 (0.0%) |
| 20 to 34 years | 11 (100.0%) | 0 (0.0%) |
| 35 to 50 years | 0 (0.0%) | 0 (0.0%) |
| Total | 11 (100.0%) | 0 (0.0%) |
Fertility by Education in Westmoreland
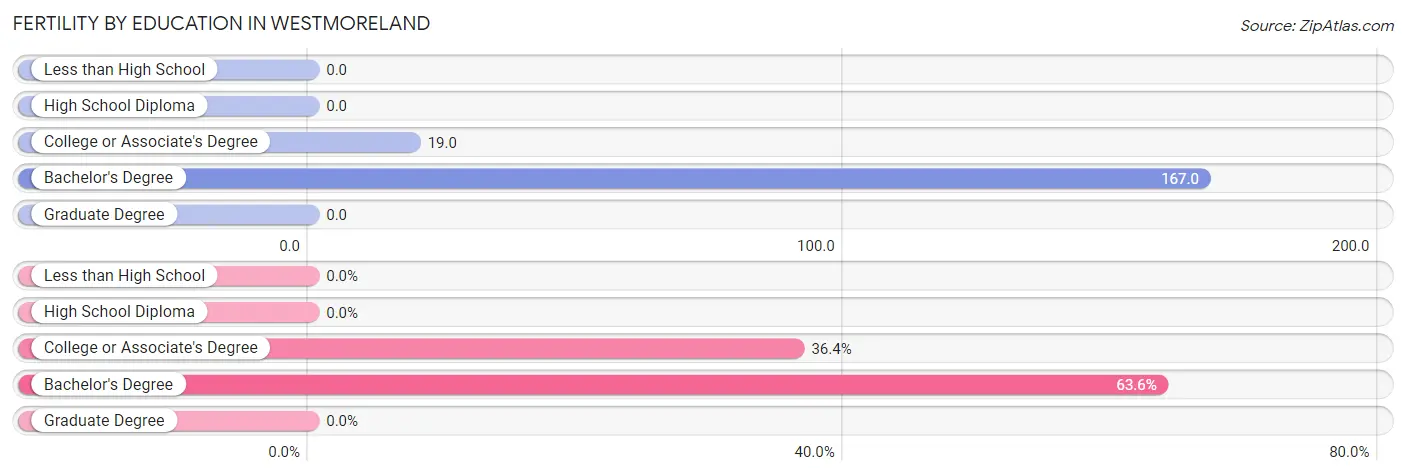
| Educational Attainment | Women with Births | Births / 1,000 Women |
| Less than High School | 0 (0.0%) | 0.0 |
| High School Diploma | 0 (0.0%) | 0.0 |
| College or Associate's Degree | 4 (36.4%) | 19.0 |
| Bachelor's Degree | 7 (63.6%) | 167.0 |
| Graduate Degree | 0 (0.0%) | 0.0 |
| Total | 11 (100.0%) | 17.0 |
Fertility by Education by Marriage Status in Westmoreland
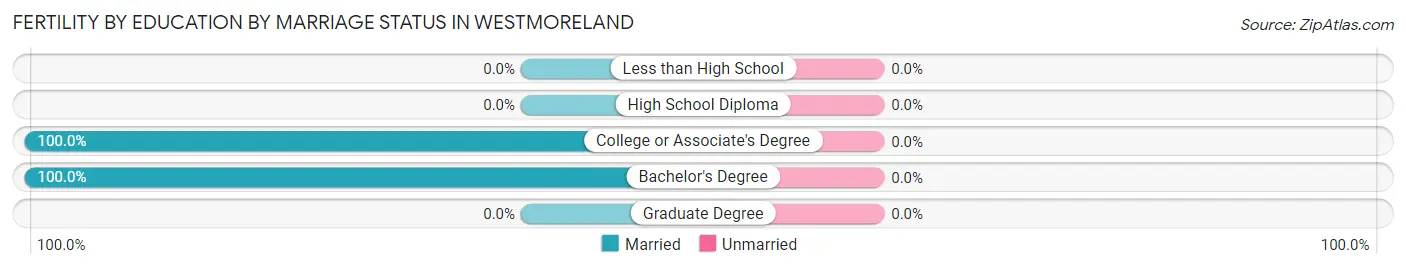
| Educational Attainment | Married | Unmarried |
| Less than High School | 0 (0.0%) | 0 (0.0%) |
| High School Diploma | 0 (0.0%) | 0 (0.0%) |
| College or Associate's Degree | 4 (100.0%) | 0 (0.0%) |
| Bachelor's Degree | 7 (100.0%) | 0 (0.0%) |
| Graduate Degree | 0 (0.0%) | 0 (0.0%) |
| Total | 11 (100.0%) | 0 (0.0%) |
Employment Characteristics in Westmoreland
Employment by Class of Employer in Westmoreland
Among the 1,172 employed individuals in Westmoreland, private company employees (856 | 73.0%), local government employees (114 | 9.7%), and self-employed (not incorporated) (88 | 7.5%) make up the most common classes of employment.
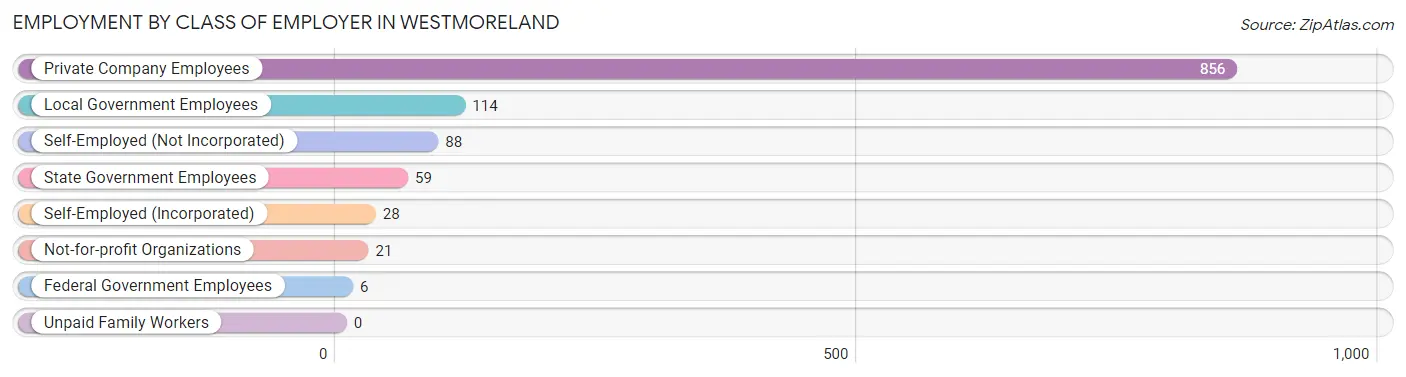
| Employer Class | # Employees | % Employees |
| Private Company Employees | 856 | 73.0% |
| Self-Employed (Incorporated) | 28 | 2.4% |
| Self-Employed (Not Incorporated) | 88 | 7.5% |
| Not-for-profit Organizations | 21 | 1.8% |
| Local Government Employees | 114 | 9.7% |
| State Government Employees | 59 | 5.0% |
| Federal Government Employees | 6 | 0.5% |
| Unpaid Family Workers | 0 | 0.0% |
| Total | 1,172 | 100.0% |
Employment Status by Age in Westmoreland
According to the labor force statistics for Westmoreland, out of the total population over 16 years of age (2,029), 62.5% or 1,268 individuals are in the labor force, with 6.0% or 76 of them unemployed. The age group with the highest labor force participation rate is 25 to 29 years, with 93.7% or 164 individuals in the labor force. Within the labor force, the 20 to 24 years age range has the highest percentage of unemployed individuals, with 12.2% or 15 of them being unemployed.
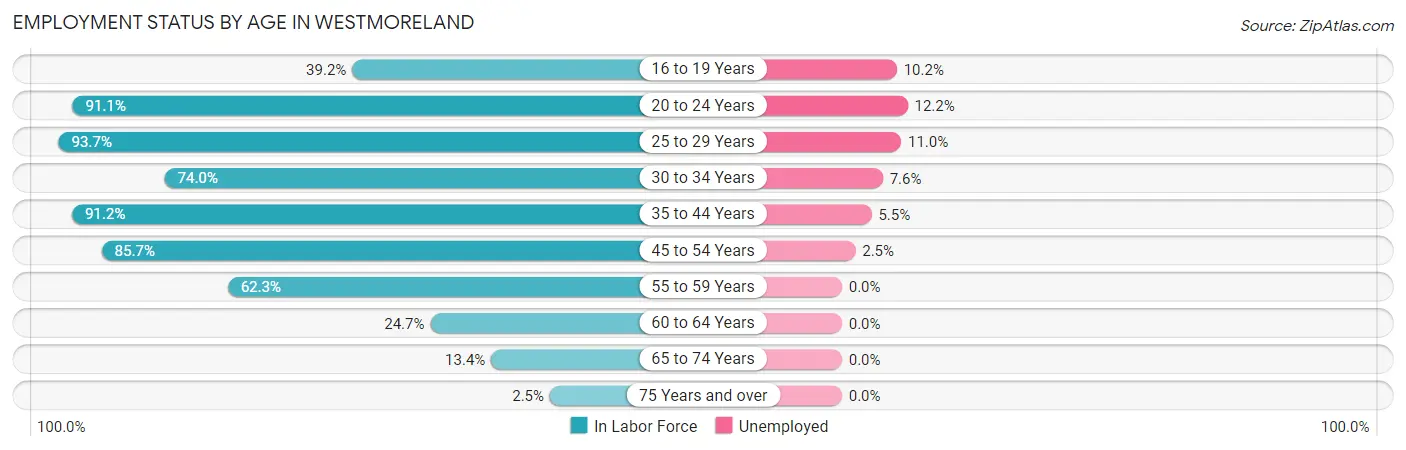
| Age Bracket | In Labor Force | Unemployed |
| 16 to 19 Years | 49 (39.2%) | 5 (10.2%) |
| 20 to 24 Years | 123 (91.1%) | 15 (12.2%) |
| 25 to 29 Years | 164 (93.7%) | 18 (11.0%) |
| 30 to 34 Years | 131 (74.0%) | 10 (7.6%) |
| 35 to 44 Years | 417 (91.2%) | 23 (5.5%) |
| 45 to 54 Years | 203 (85.7%) | 5 (2.5%) |
| 55 to 59 Years | 101 (62.3%) | 0 (0.0%) |
| 60 to 64 Years | 48 (24.7%) | 0 (0.0%) |
| 65 to 74 Years | 28 (13.4%) | 0 (0.0%) |
| 75 Years and over | 4 (2.5%) | 0 (0.0%) |
| Total | 1,268 (62.5%) | 76 (6.0%) |
Employment Status by Educational Attainment in Westmoreland
According to labor force statistics for Westmoreland, 75.9% of individuals (1,064) out of the total population between 25 and 64 years of age (1,402) are in the labor force, with 5.3% or 56 of them being unemployed. The group with the highest labor force participation rate are those with the educational attainment of bachelor's degree or higher, with 93.5% or 100 individuals in the labor force. Within the labor force, individuals with less than high school education have the highest percentage of unemployment, with 35.1% or 26 of them being unemployed.
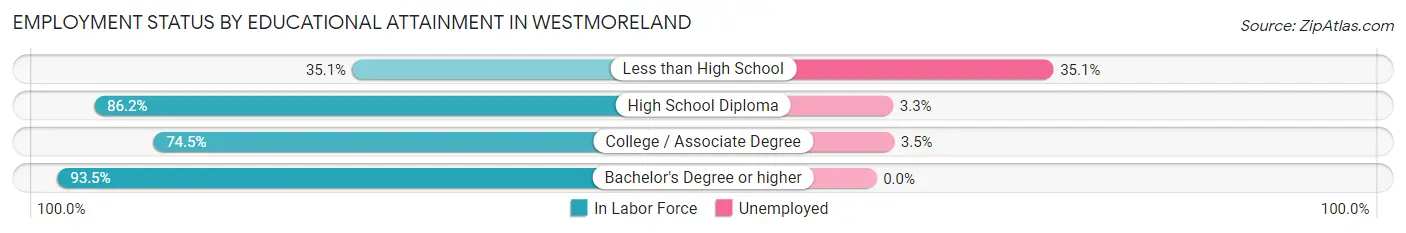
| Educational Attainment | In Labor Force | Unemployed |
| Less than High School | 74 (35.1%) | 74 (35.1%) |
| High School Diploma | 606 (86.2%) | 23 (3.3%) |
| College / Associate Degree | 284 (74.5%) | 13 (3.5%) |
| Bachelor's Degree or higher | 100 (93.5%) | 0 (0.0%) |
| Total | 1,064 (75.9%) | 74 (5.3%) |
Employment Occupations by Sex in Westmoreland
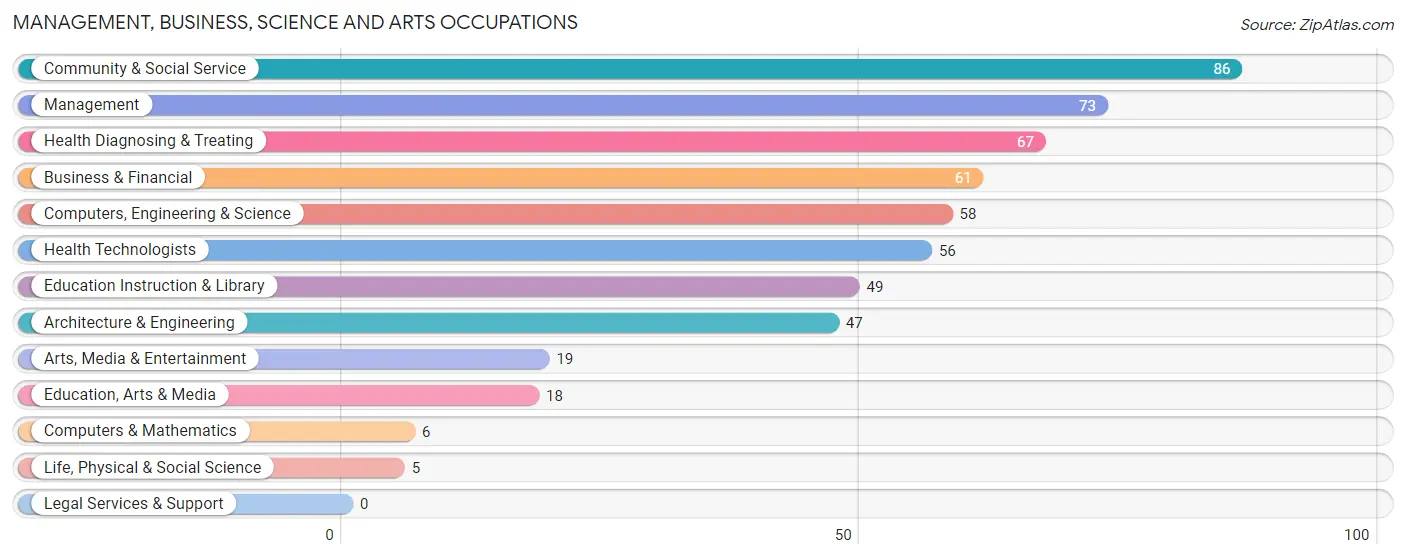
Management, Business, Science and Arts Occupations
The most common Management, Business, Science and Arts occupations in Westmoreland are Community & Social Service (86 | 7.2%), Management (73 | 6.1%), Health Diagnosing & Treating (67 | 5.6%), Business & Financial (61 | 5.1%), and Computers, Engineering & Science (58 | 4.9%).
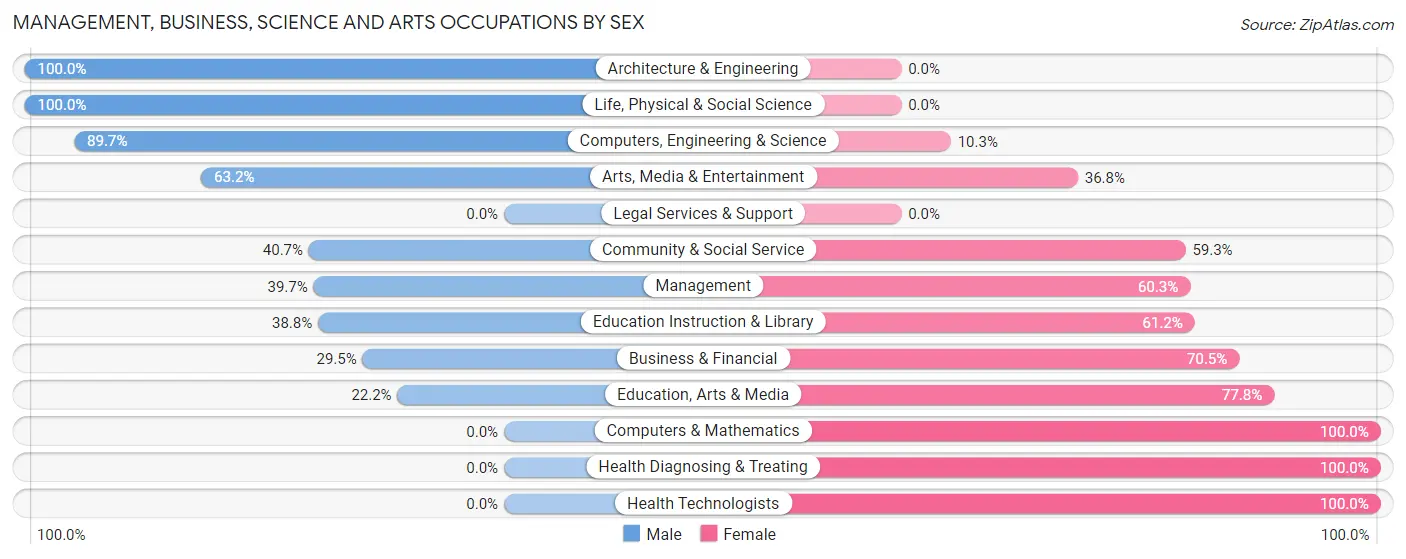
Management, Business, Science and Arts Occupations by Sex
Within the Management, Business, Science and Arts occupations in Westmoreland, the most male-oriented occupations are Architecture & Engineering (100.0%), Life, Physical & Social Science (100.0%), and Computers, Engineering & Science (89.7%), while the most female-oriented occupations are Computers & Mathematics (100.0%), Health Diagnosing & Treating (100.0%), and Health Technologists (100.0%).
| Occupation | Male | Female |
| Management | 29 (39.7%) | 44 (60.3%) |
| Business & Financial | 18 (29.5%) | 43 (70.5%) |
| Computers, Engineering & Science | 52 (89.7%) | 6 (10.3%) |
| Computers & Mathematics | 0 (0.0%) | 6 (100.0%) |
| Architecture & Engineering | 47 (100.0%) | 0 (0.0%) |
| Life, Physical & Social Science | 5 (100.0%) | 0 (0.0%) |
| Community & Social Service | 35 (40.7%) | 51 (59.3%) |
| Education, Arts & Media | 4 (22.2%) | 14 (77.8%) |
| Legal Services & Support | 0 (0.0%) | 0 (0.0%) |
| Education Instruction & Library | 19 (38.8%) | 30 (61.2%) |
| Arts, Media & Entertainment | 12 (63.2%) | 7 (36.8%) |
| Health Diagnosing & Treating | 0 (0.0%) | 67 (100.0%) |
| Health Technologists | 0 (0.0%) | 56 (100.0%) |
| Total (Category) | 134 (38.8%) | 211 (61.2%) |
| Total (Overall) | 617 (51.8%) | 575 (48.2%) |
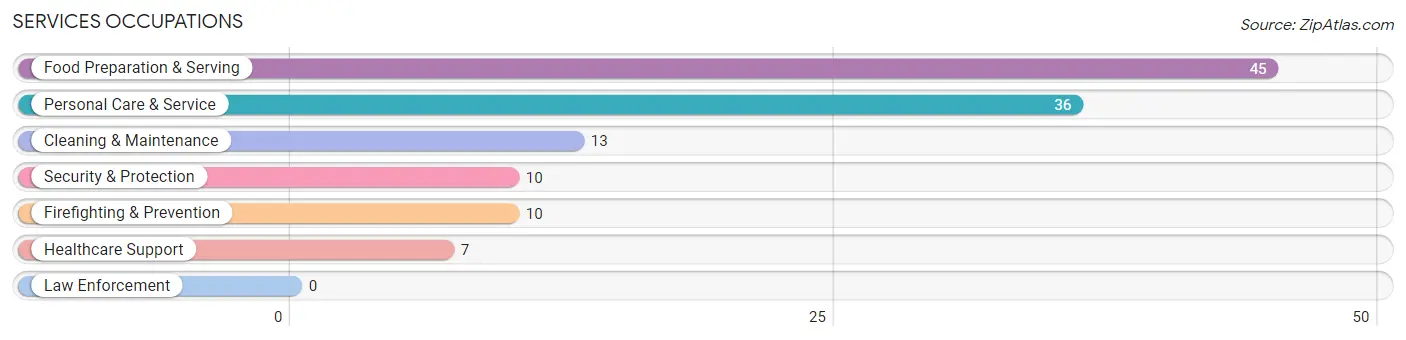
Services Occupations
The most common Services occupations in Westmoreland are Food Preparation & Serving (45 | 3.8%), Personal Care & Service (36 | 3.0%), Cleaning & Maintenance (13 | 1.1%), Security & Protection (10 | 0.8%), and Firefighting & Prevention (10 | 0.8%).
Services Occupations by Sex
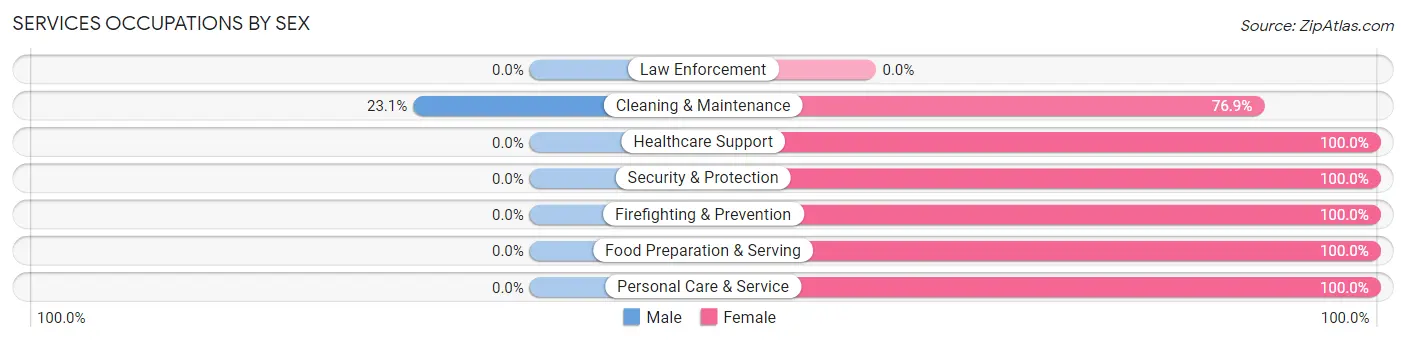
| Occupation | Male | Female |
| Healthcare Support | 0 (0.0%) | 7 (100.0%) |
| Security & Protection | 0 (0.0%) | 10 (100.0%) |
| Firefighting & Prevention | 0 (0.0%) | 10 (100.0%) |
| Law Enforcement | 0 (0.0%) | 0 (0.0%) |
| Food Preparation & Serving | 0 (0.0%) | 45 (100.0%) |
| Cleaning & Maintenance | 3 (23.1%) | 10 (76.9%) |
| Personal Care & Service | 0 (0.0%) | 36 (100.0%) |
| Total (Category) | 3 (2.7%) | 108 (97.3%) |
| Total (Overall) | 617 (51.8%) | 575 (48.2%) |
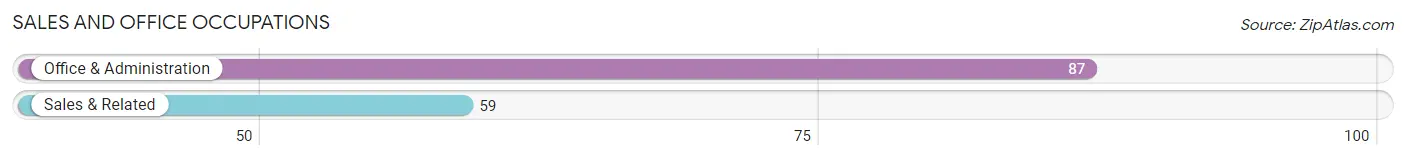
Sales and Office Occupations
The most common Sales and Office occupations in Westmoreland are Office & Administration (87 | 7.3%), and Sales & Related (59 | 5.0%).
Sales and Office Occupations by Sex
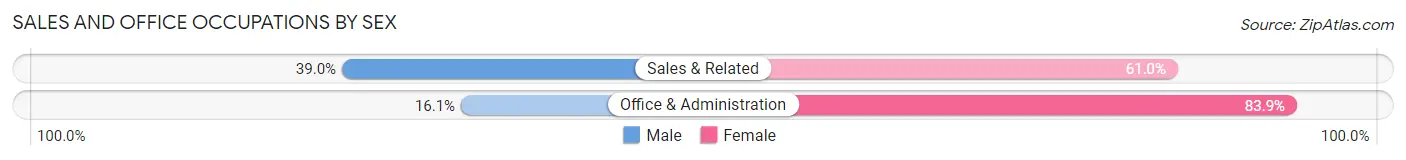
| Occupation | Male | Female |
| Sales & Related | 23 (39.0%) | 36 (61.0%) |
| Office & Administration | 14 (16.1%) | 73 (83.9%) |
| Total (Category) | 37 (25.3%) | 109 (74.7%) |
| Total (Overall) | 617 (51.8%) | 575 (48.2%) |
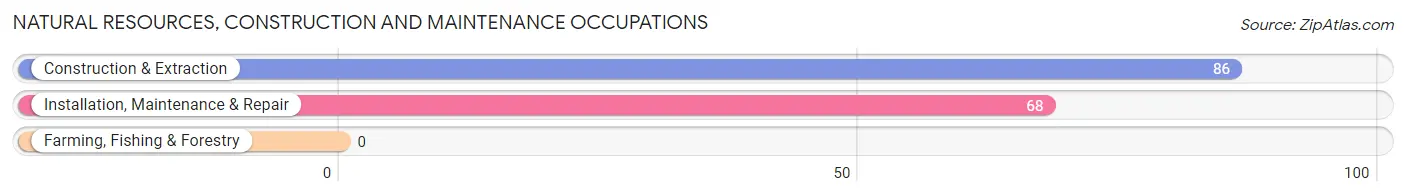
Natural Resources, Construction and Maintenance Occupations
The most common Natural Resources, Construction and Maintenance occupations in Westmoreland are Construction & Extraction (86 | 7.2%), and Installation, Maintenance & Repair (68 | 5.7%).
Natural Resources, Construction and Maintenance Occupations by Sex
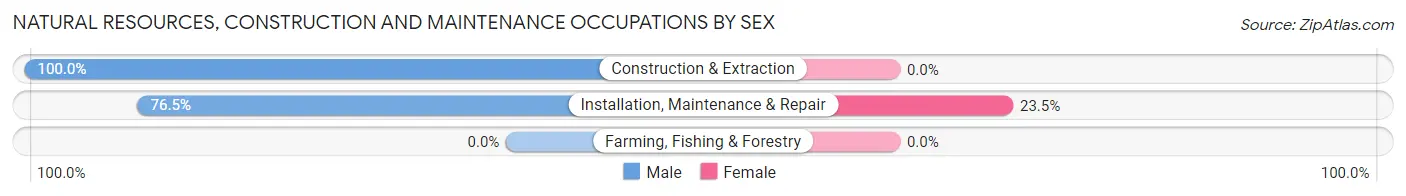
| Occupation | Male | Female |
| Farming, Fishing & Forestry | 0 (0.0%) | 0 (0.0%) |
| Construction & Extraction | 86 (100.0%) | 0 (0.0%) |
| Installation, Maintenance & Repair | 52 (76.5%) | 16 (23.5%) |
| Total (Category) | 138 (89.6%) | 16 (10.4%) |
| Total (Overall) | 617 (51.8%) | 575 (48.2%) |
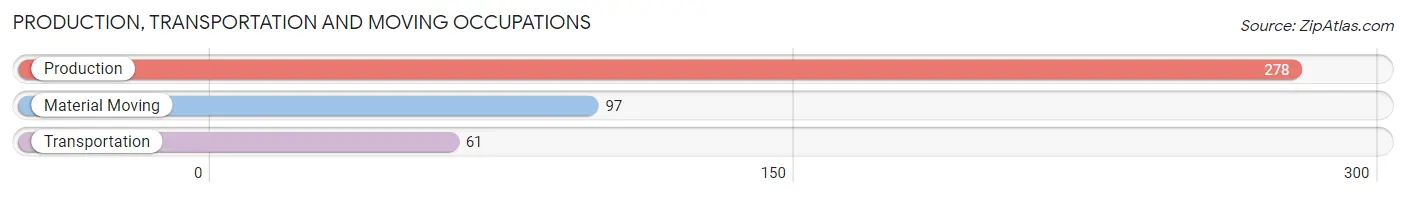
Production, Transportation and Moving Occupations
The most common Production, Transportation and Moving occupations in Westmoreland are Production (278 | 23.3%), Material Moving (97 | 8.1%), and Transportation (61 | 5.1%).
Production, Transportation and Moving Occupations by Sex
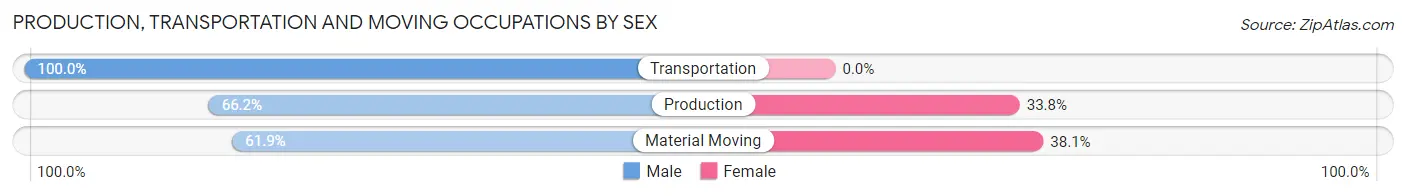
| Occupation | Male | Female |
| Production | 184 (66.2%) | 94 (33.8%) |
| Transportation | 61 (100.0%) | 0 (0.0%) |
| Material Moving | 60 (61.9%) | 37 (38.1%) |
| Total (Category) | 305 (70.0%) | 131 (30.0%) |
| Total (Overall) | 617 (51.8%) | 575 (48.2%) |
Employment Industries by Sex in Westmoreland
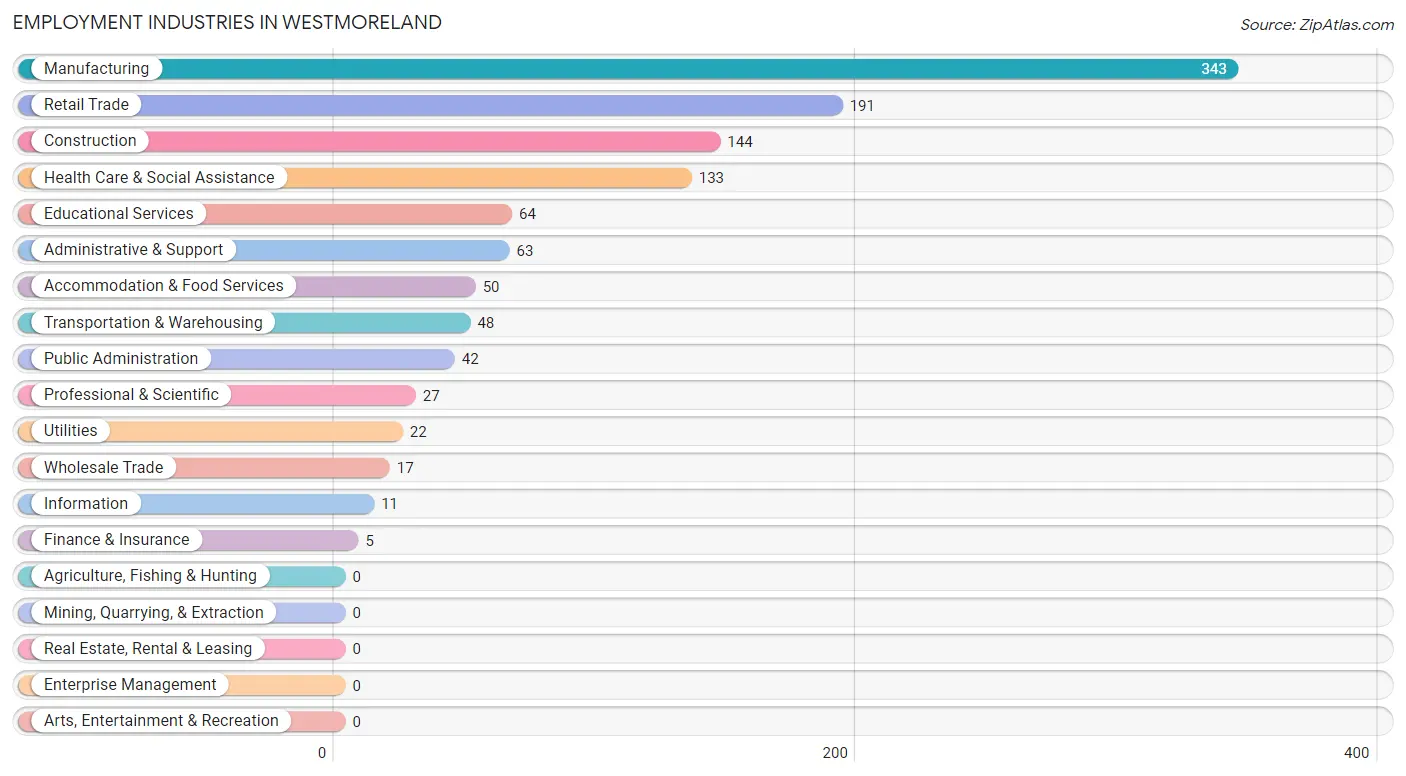
Employment Industries in Westmoreland
The major employment industries in Westmoreland include Manufacturing (343 | 28.8%), Retail Trade (191 | 16.0%), Construction (144 | 12.1%), Health Care & Social Assistance (133 | 11.2%), and Educational Services (64 | 5.4%).
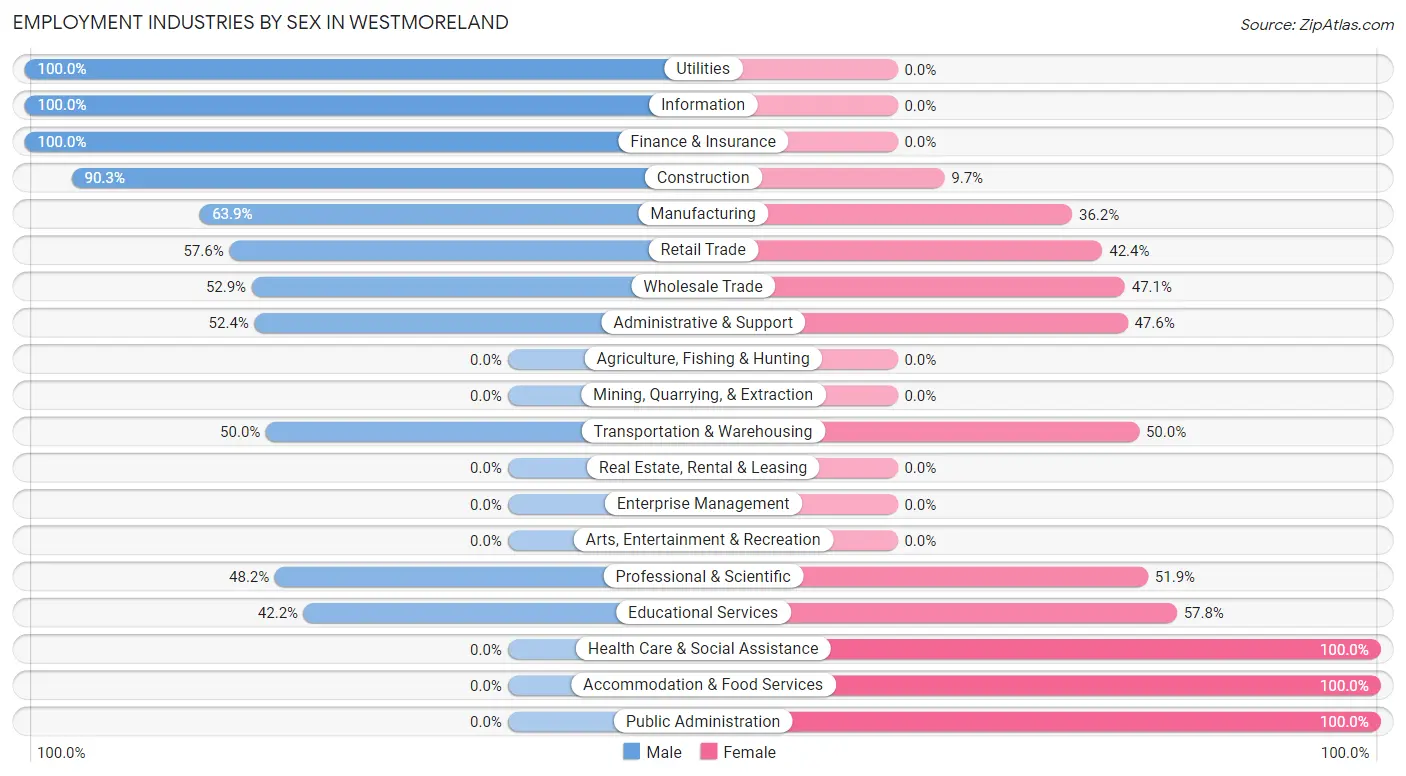
Employment Industries by Sex in Westmoreland
The Westmoreland industries that see more men than women are Utilities (100.0%), Information (100.0%), and Finance & Insurance (100.0%), whereas the industries that tend to have a higher number of women are Health Care & Social Assistance (100.0%), Accommodation & Food Services (100.0%), and Public Administration (100.0%).
| Industry | Male | Female |
| Agriculture, Fishing & Hunting | 0 (0.0%) | 0 (0.0%) |
| Mining, Quarrying, & Extraction | 0 (0.0%) | 0 (0.0%) |
| Construction | 130 (90.3%) | 14 (9.7%) |
| Manufacturing | 219 (63.8%) | 124 (36.1%) |
| Wholesale Trade | 9 (52.9%) | 8 (47.1%) |
| Retail Trade | 110 (57.6%) | 81 (42.4%) |
| Transportation & Warehousing | 24 (50.0%) | 24 (50.0%) |
| Utilities | 22 (100.0%) | 0 (0.0%) |
| Information | 11 (100.0%) | 0 (0.0%) |
| Finance & Insurance | 5 (100.0%) | 0 (0.0%) |
| Real Estate, Rental & Leasing | 0 (0.0%) | 0 (0.0%) |
| Professional & Scientific | 13 (48.1%) | 14 (51.8%) |
| Enterprise Management | 0 (0.0%) | 0 (0.0%) |
| Administrative & Support | 33 (52.4%) | 30 (47.6%) |
| Educational Services | 27 (42.2%) | 37 (57.8%) |
| Health Care & Social Assistance | 0 (0.0%) | 133 (100.0%) |
| Arts, Entertainment & Recreation | 0 (0.0%) | 0 (0.0%) |
| Accommodation & Food Services | 0 (0.0%) | 50 (100.0%) |
| Public Administration | 0 (0.0%) | 42 (100.0%) |
| Total | 617 (51.8%) | 575 (48.2%) |
Education in Westmoreland
School Enrollment in Westmoreland
The most common levels of schooling among the 559 students in Westmoreland are high school (173 | 30.9%), elementary school (161 | 28.8%), and middle school (114 | 20.4%).
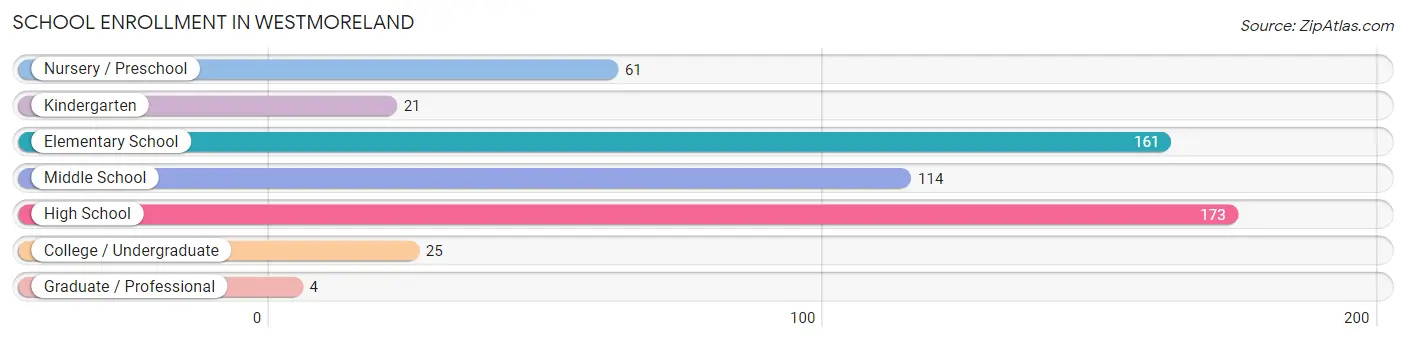
| School Level | # Students | % Students |
| Nursery / Preschool | 61 | 10.9% |
| Kindergarten | 21 | 3.8% |
| Elementary School | 161 | 28.8% |
| Middle School | 114 | 20.4% |
| High School | 173 | 30.9% |
| College / Undergraduate | 25 | 4.5% |
| Graduate / Professional | 4 | 0.7% |
| Total | 559 | 100.0% |
School Enrollment by Age by Funding Source in Westmoreland
Out of a total of 559 students who are enrolled in schools in Westmoreland, 6 (1.1%) attend a private institution, while the remaining 553 (98.9%) are enrolled in public schools. The age group of 15 to 17 year olds has the highest likelihood of being enrolled in private schools, with 6 (5.0% in the age bracket) enrolled. Conversely, the age group of 3 to 4 year olds has the lowest likelihood of being enrolled in a private school, with 39 (100.0% in the age bracket) attending a public institution.
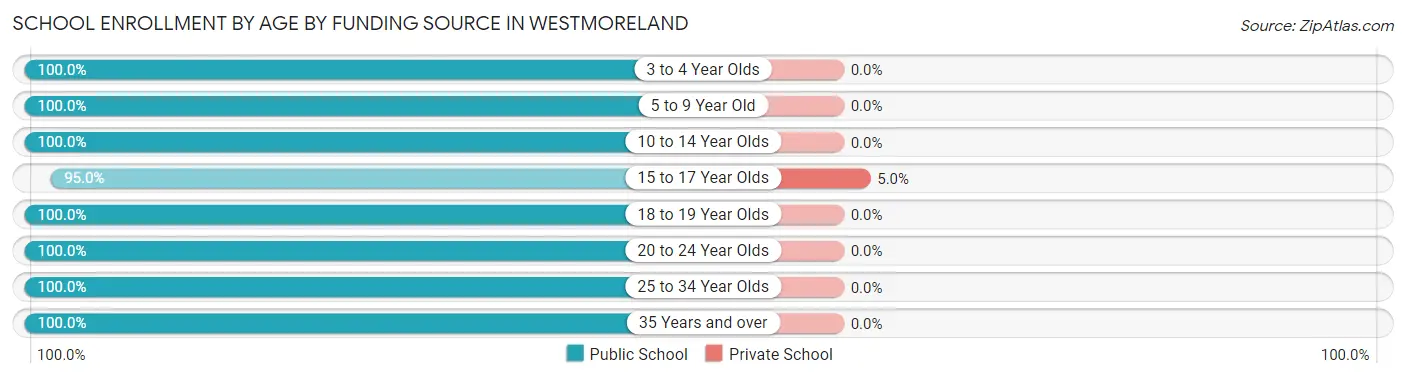
| Age Bracket | Public School | Private School |
| 3 to 4 Year Olds | 39 (100.0%) | 0 (0.0%) |
| 5 to 9 Year Old | 184 (100.0%) | 0 (0.0%) |
| 10 to 14 Year Olds | 153 (100.0%) | 0 (0.0%) |
| 15 to 17 Year Olds | 115 (95.0%) | 6 (5.0%) |
| 18 to 19 Year Olds | 33 (100.0%) | 0 (0.0%) |
| 20 to 24 Year Olds | 8 (100.0%) | 0 (0.0%) |
| 25 to 34 Year Olds | 17 (100.0%) | 0 (0.0%) |
| 35 Years and over | 4 (100.0%) | 0 (0.0%) |
| Total | 553 (98.9%) | 6 (1.1%) |
Educational Attainment by Field of Study in Westmoreland
Science & technology (56 | 29.2%), engineering (43 | 22.4%), education (37 | 19.3%), arts & humanities (16 | 8.3%), and bio, nature & agricultural (12 | 6.2%) are the most common fields of study among 192 individuals in Westmoreland who have obtained a bachelor's degree or higher.
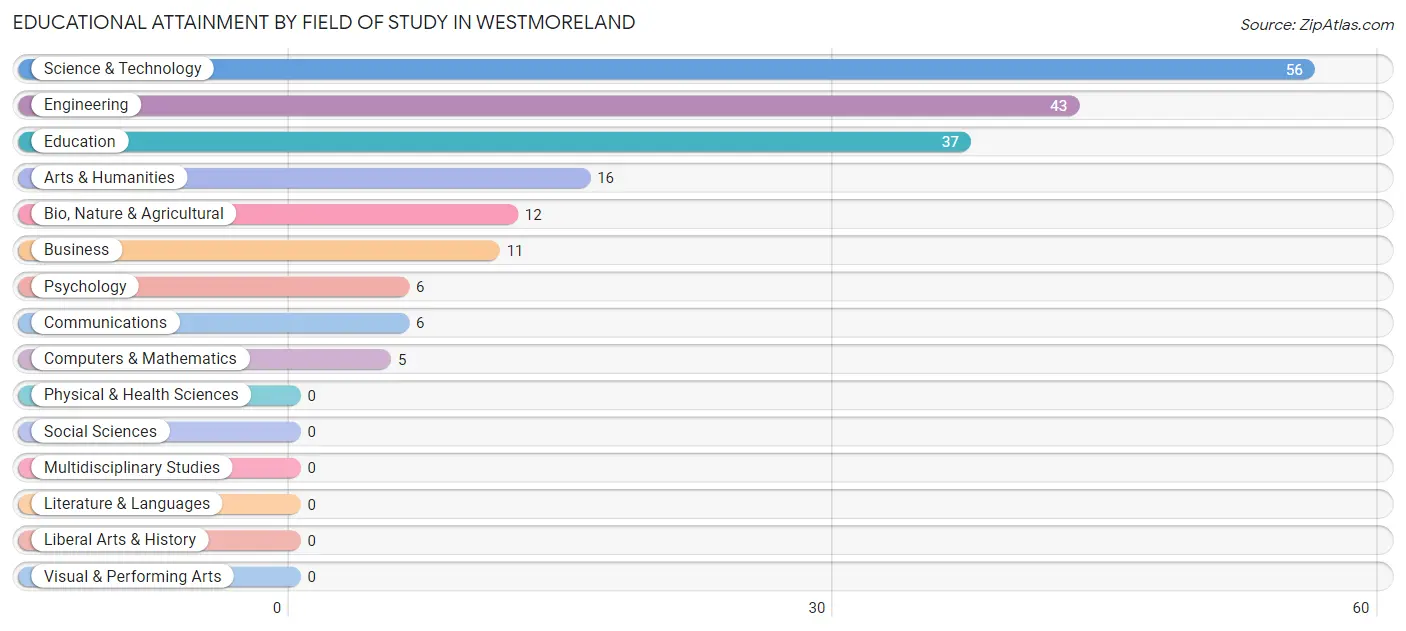
| Field of Study | # Graduates | % Graduates |
| Computers & Mathematics | 5 | 2.6% |
| Bio, Nature & Agricultural | 12 | 6.2% |
| Physical & Health Sciences | 0 | 0.0% |
| Psychology | 6 | 3.1% |
| Social Sciences | 0 | 0.0% |
| Engineering | 43 | 22.4% |
| Multidisciplinary Studies | 0 | 0.0% |
| Science & Technology | 56 | 29.2% |
| Business | 11 | 5.7% |
| Education | 37 | 19.3% |
| Literature & Languages | 0 | 0.0% |
| Liberal Arts & History | 0 | 0.0% |
| Visual & Performing Arts | 0 | 0.0% |
| Communications | 6 | 3.1% |
| Arts & Humanities | 16 | 8.3% |
| Total | 192 | 100.0% |
Transportation & Commute in Westmoreland
Vehicle Availability by Sex in Westmoreland
The most prevalent vehicle ownership categories in Westmoreland are males with 2 vehicles (241, accounting for 39.1%) and females with 2 vehicles (212, making up 43.4%).
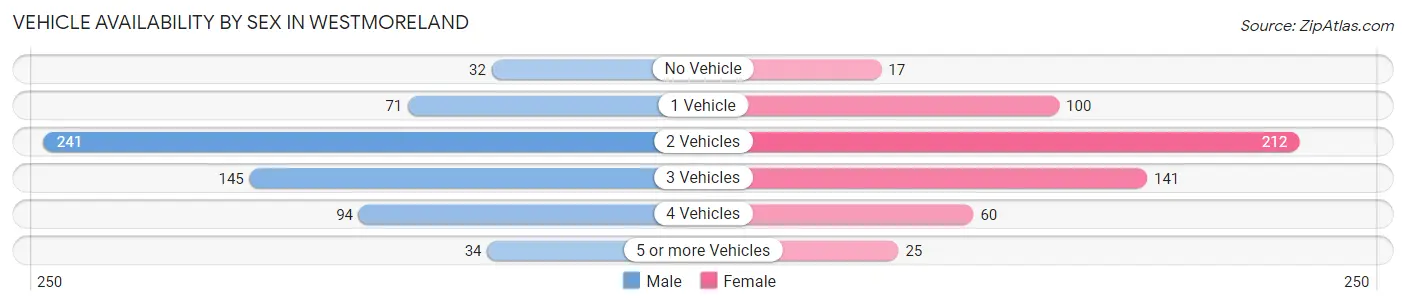
| Vehicles Available | Male | Female |
| No Vehicle | 32 (5.2%) | 17 (3.1%) |
| 1 Vehicle | 71 (11.5%) | 100 (18.0%) |
| 2 Vehicles | 241 (39.1%) | 212 (38.2%) |
| 3 Vehicles | 145 (23.5%) | 141 (25.4%) |
| 4 Vehicles | 94 (15.2%) | 60 (10.8%) |
| 5 or more Vehicles | 34 (5.5%) | 25 (4.5%) |
| Total | 617 (100.0%) | 555 (100.0%) |
Commute Time in Westmoreland
The most frequently occuring commute durations in Westmoreland are 30 to 34 minutes (263 commuters, 24.7%), 20 to 24 minutes (139 commuters, 13.0%), and 45 to 59 minutes (135 commuters, 12.7%).
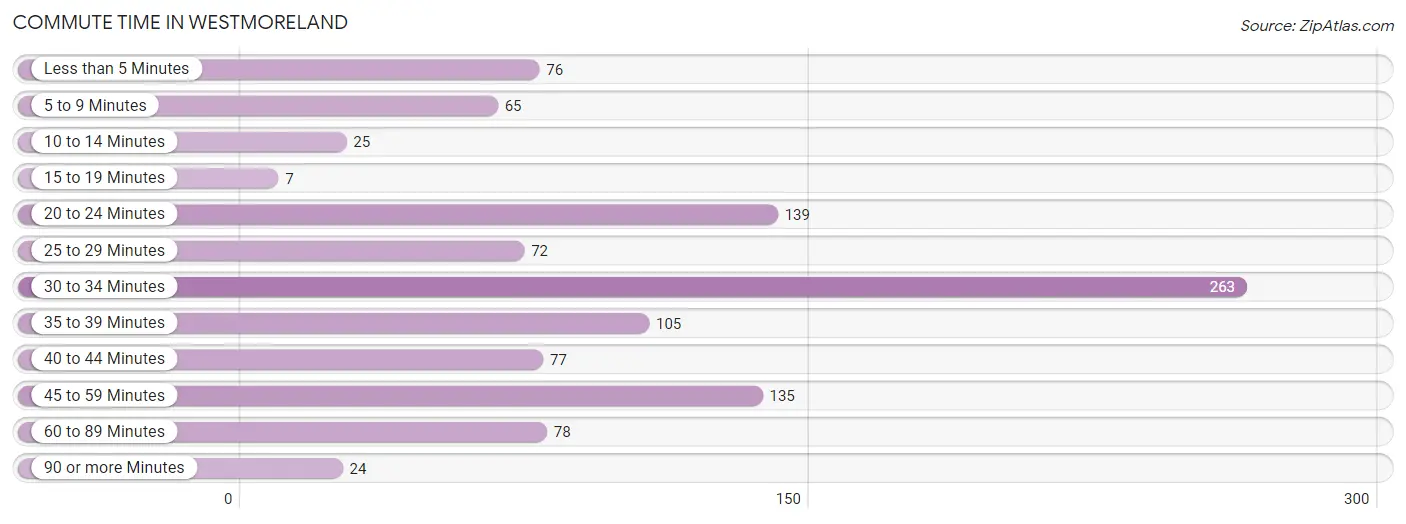
| Commute Time | # Commuters | % Commuters |
| Less than 5 Minutes | 76 | 7.1% |
| 5 to 9 Minutes | 65 | 6.1% |
| 10 to 14 Minutes | 25 | 2.4% |
| 15 to 19 Minutes | 7 | 0.7% |
| 20 to 24 Minutes | 139 | 13.0% |
| 25 to 29 Minutes | 72 | 6.8% |
| 30 to 34 Minutes | 263 | 24.7% |
| 35 to 39 Minutes | 105 | 9.9% |
| 40 to 44 Minutes | 77 | 7.2% |
| 45 to 59 Minutes | 135 | 12.7% |
| 60 to 89 Minutes | 78 | 7.3% |
| 90 or more Minutes | 24 | 2.2% |
Commute Time by Sex in Westmoreland
The most common commute times in Westmoreland are 30 to 34 minutes (184 commuters, 30.8%) for males and 30 to 34 minutes (79 commuters, 16.8%) for females.
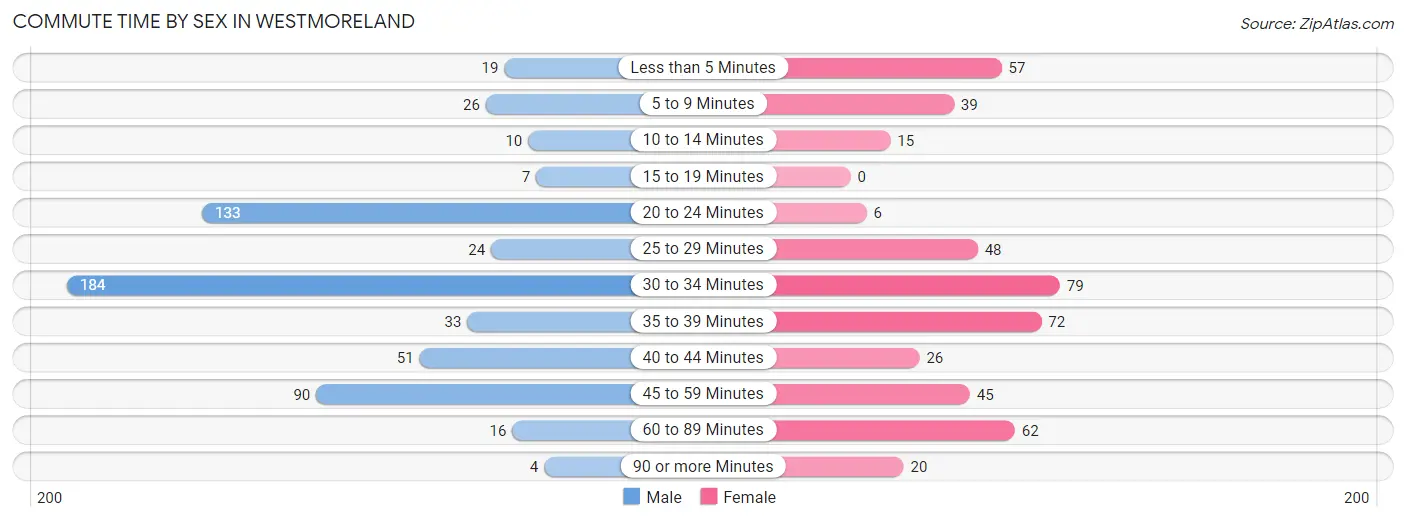
| Commute Time | Male | Female |
| Less than 5 Minutes | 19 (3.2%) | 57 (12.1%) |
| 5 to 9 Minutes | 26 (4.4%) | 39 (8.3%) |
| 10 to 14 Minutes | 10 (1.7%) | 15 (3.2%) |
| 15 to 19 Minutes | 7 (1.2%) | 0 (0.0%) |
| 20 to 24 Minutes | 133 (22.3%) | 6 (1.3%) |
| 25 to 29 Minutes | 24 (4.0%) | 48 (10.2%) |
| 30 to 34 Minutes | 184 (30.8%) | 79 (16.8%) |
| 35 to 39 Minutes | 33 (5.5%) | 72 (15.3%) |
| 40 to 44 Minutes | 51 (8.5%) | 26 (5.5%) |
| 45 to 59 Minutes | 90 (15.1%) | 45 (9.6%) |
| 60 to 89 Minutes | 16 (2.7%) | 62 (13.2%) |
| 90 or more Minutes | 4 (0.7%) | 20 (4.3%) |
Time of Departure to Work by Sex in Westmoreland
The most frequent times of departure to work in Westmoreland are 7:00 AM to 7:29 AM (116, 19.4%) for males and 7:00 AM to 7:29 AM (77, 16.4%) for females.
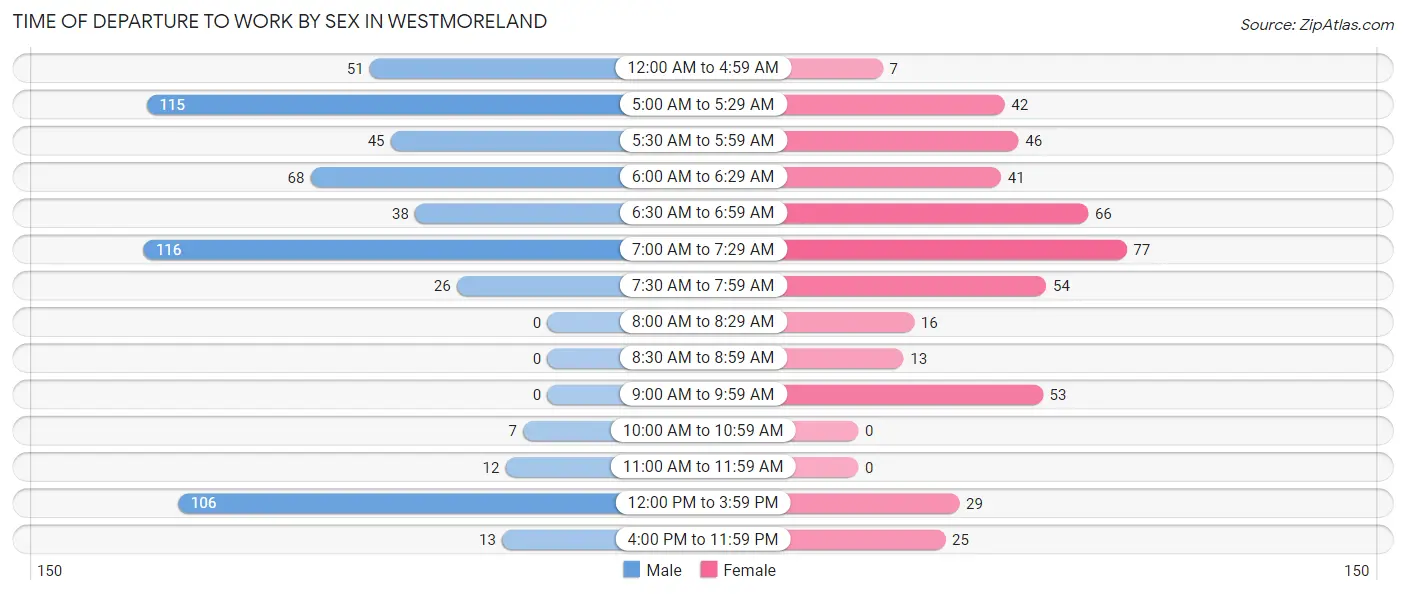
| Time of Departure | Male | Female |
| 12:00 AM to 4:59 AM | 51 (8.5%) | 7 (1.5%) |
| 5:00 AM to 5:29 AM | 115 (19.3%) | 42 (9.0%) |
| 5:30 AM to 5:59 AM | 45 (7.5%) | 46 (9.8%) |
| 6:00 AM to 6:29 AM | 68 (11.4%) | 41 (8.7%) |
| 6:30 AM to 6:59 AM | 38 (6.4%) | 66 (14.1%) |
| 7:00 AM to 7:29 AM | 116 (19.4%) | 77 (16.4%) |
| 7:30 AM to 7:59 AM | 26 (4.4%) | 54 (11.5%) |
| 8:00 AM to 8:29 AM | 0 (0.0%) | 16 (3.4%) |
| 8:30 AM to 8:59 AM | 0 (0.0%) | 13 (2.8%) |
| 9:00 AM to 9:59 AM | 0 (0.0%) | 53 (11.3%) |
| 10:00 AM to 10:59 AM | 7 (1.2%) | 0 (0.0%) |
| 11:00 AM to 11:59 AM | 12 (2.0%) | 0 (0.0%) |
| 12:00 PM to 3:59 PM | 106 (17.8%) | 29 (6.2%) |
| 4:00 PM to 11:59 PM | 13 (2.2%) | 25 (5.3%) |
| Total | 597 (100.0%) | 469 (100.0%) |
Housing Occupancy in Westmoreland
Occupancy by Ownership in Westmoreland
Of the total 929 dwellings in Westmoreland, owner-occupied units account for 527 (56.7%), while renter-occupied units make up 402 (43.3%).
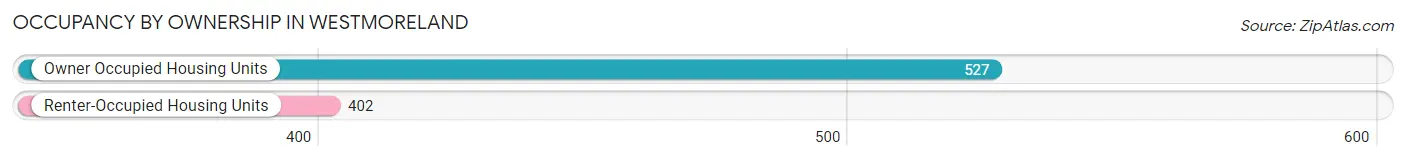
| Occupancy | # Housing Units | % Housing Units |
| Owner Occupied Housing Units | 527 | 56.7% |
| Renter-Occupied Housing Units | 402 | 43.3% |
| Total Occupied Housing Units | 929 | 100.0% |
Occupancy by Household Size in Westmoreland
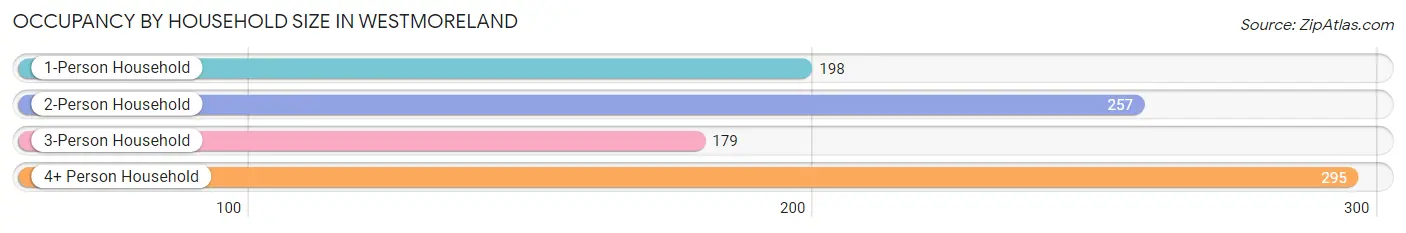
| Household Size | # Housing Units | % Housing Units |
| 1-Person Household | 198 | 21.3% |
| 2-Person Household | 257 | 27.7% |
| 3-Person Household | 179 | 19.3% |
| 4+ Person Household | 295 | 31.8% |
| Total Housing Units | 929 | 100.0% |
Occupancy by Ownership by Household Size in Westmoreland
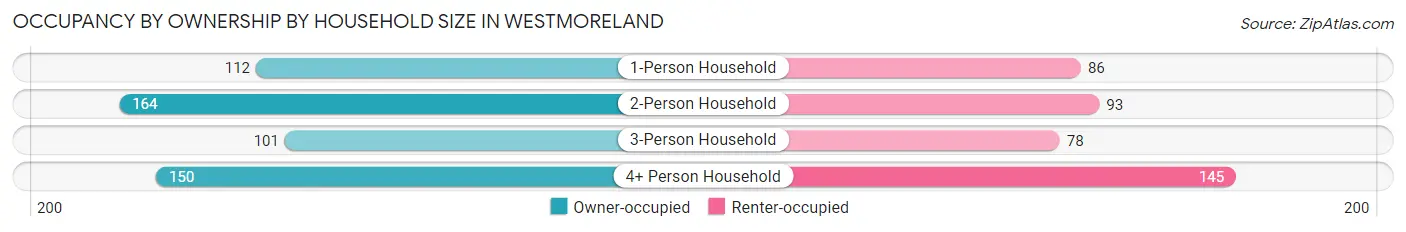
| Household Size | Owner-occupied | Renter-occupied |
| 1-Person Household | 112 (56.6%) | 86 (43.4%) |
| 2-Person Household | 164 (63.8%) | 93 (36.2%) |
| 3-Person Household | 101 (56.4%) | 78 (43.6%) |
| 4+ Person Household | 150 (50.8%) | 145 (49.1%) |
| Total Housing Units | 527 (56.7%) | 402 (43.3%) |
Occupancy by Educational Attainment in Westmoreland
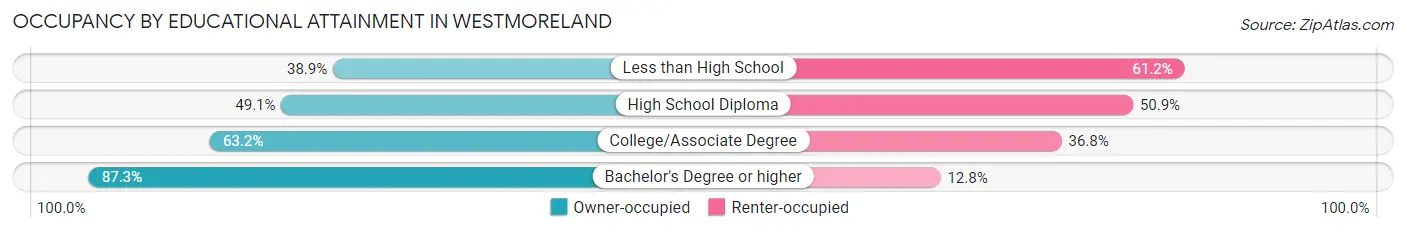
| Household Size | Owner-occupied | Renter-occupied |
| Less than High School | 61 (38.9%) | 96 (61.2%) |
| High School Diploma | 162 (49.1%) | 168 (50.9%) |
| College/Associate Degree | 215 (63.2%) | 125 (36.8%) |
| Bachelor's Degree or higher | 89 (87.3%) | 13 (12.8%) |
Occupancy by Age of Householder in Westmoreland
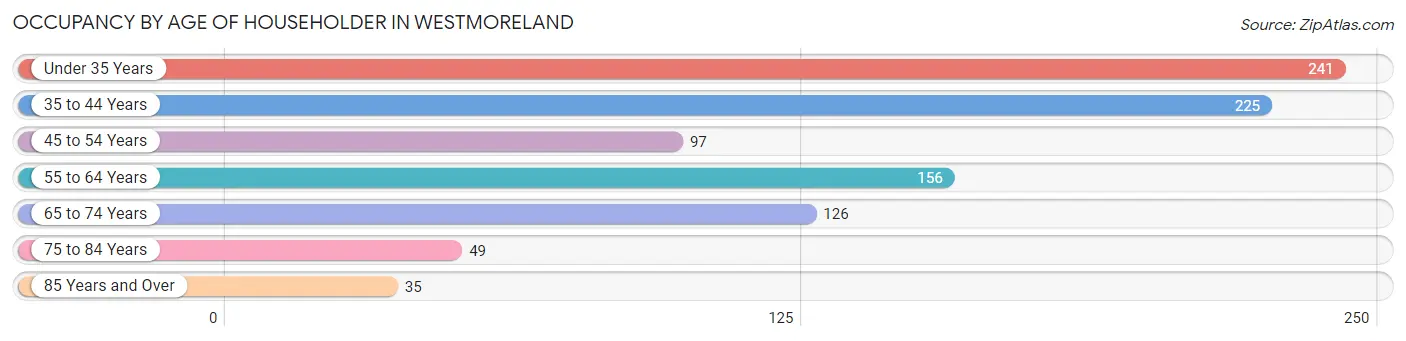
| Age Bracket | # Households | % Households |
| Under 35 Years | 241 | 25.9% |
| 35 to 44 Years | 225 | 24.2% |
| 45 to 54 Years | 97 | 10.4% |
| 55 to 64 Years | 156 | 16.8% |
| 65 to 74 Years | 126 | 13.6% |
| 75 to 84 Years | 49 | 5.3% |
| 85 Years and Over | 35 | 3.8% |
| Total | 929 | 100.0% |
Housing Finances in Westmoreland
Median Income by Occupancy in Westmoreland
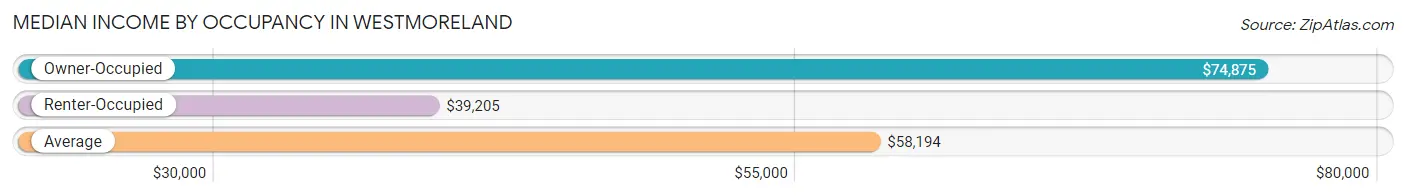
| Occupancy Type | # Households | Median Income |
| Owner-Occupied | 527 (56.7%) | $74,875 |
| Renter-Occupied | 402 (43.3%) | $39,205 |
| Average | 929 (100.0%) | $58,194 |
Occupancy by Householder Income Bracket in Westmoreland
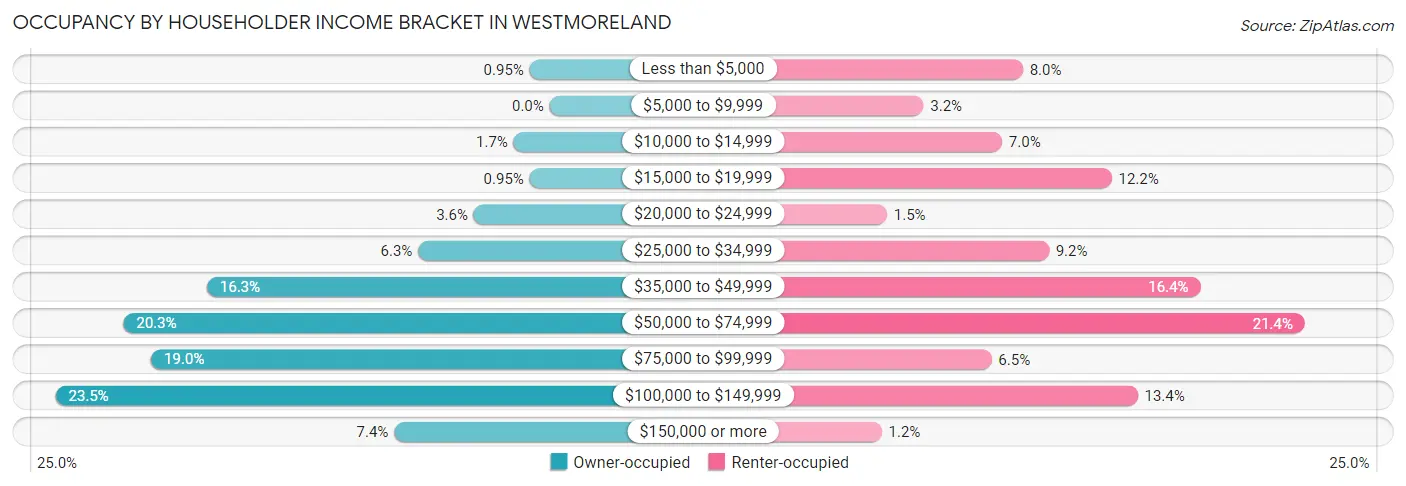
| Income Bracket | Owner-occupied | Renter-occupied |
| Less than $5,000 | 5 (0.9%) | 32 (8.0%) |
| $5,000 to $9,999 | 0 (0.0%) | 13 (3.2%) |
| $10,000 to $14,999 | 9 (1.7%) | 28 (7.0%) |
| $15,000 to $19,999 | 5 (0.9%) | 49 (12.2%) |
| $20,000 to $24,999 | 19 (3.6%) | 6 (1.5%) |
| $25,000 to $34,999 | 33 (6.3%) | 37 (9.2%) |
| $35,000 to $49,999 | 86 (16.3%) | 66 (16.4%) |
| $50,000 to $74,999 | 107 (20.3%) | 86 (21.4%) |
| $75,000 to $99,999 | 100 (19.0%) | 26 (6.5%) |
| $100,000 to $149,999 | 124 (23.5%) | 54 (13.4%) |
| $150,000 or more | 39 (7.4%) | 5 (1.2%) |
| Total | 527 (100.0%) | 402 (100.0%) |
Monthly Housing Cost Tiers in Westmoreland
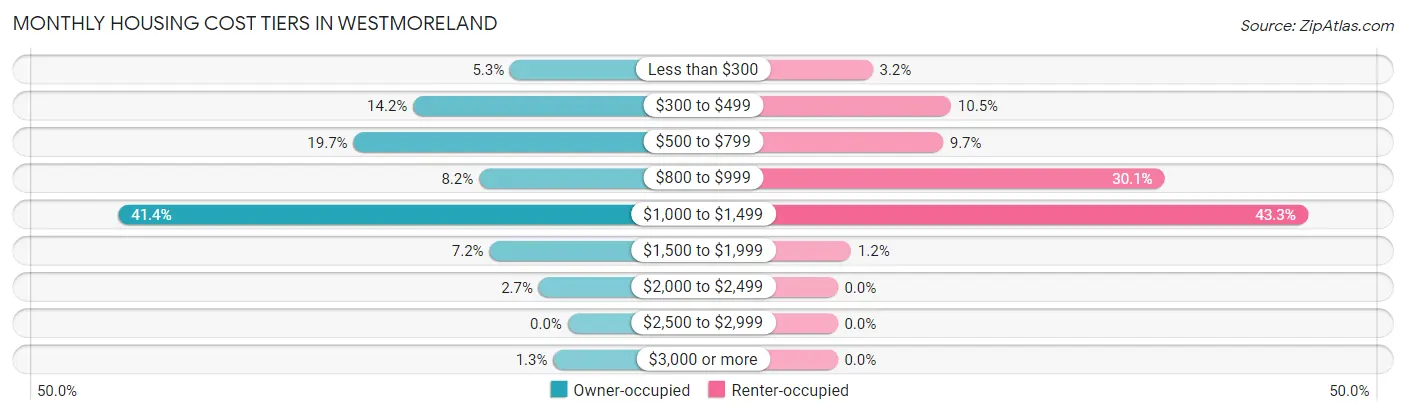
| Monthly Cost | Owner-occupied | Renter-occupied |
| Less than $300 | 28 (5.3%) | 13 (3.2%) |
| $300 to $499 | 75 (14.2%) | 42 (10.4%) |
| $500 to $799 | 104 (19.7%) | 39 (9.7%) |
| $800 to $999 | 43 (8.2%) | 121 (30.1%) |
| $1,000 to $1,499 | 218 (41.4%) | 174 (43.3%) |
| $1,500 to $1,999 | 38 (7.2%) | 5 (1.2%) |
| $2,000 to $2,499 | 14 (2.7%) | 0 (0.0%) |
| $2,500 to $2,999 | 0 (0.0%) | 0 (0.0%) |
| $3,000 or more | 7 (1.3%) | 0 (0.0%) |
| Total | 527 (100.0%) | 402 (100.0%) |
Physical Housing Characteristics in Westmoreland
Housing Structures in Westmoreland
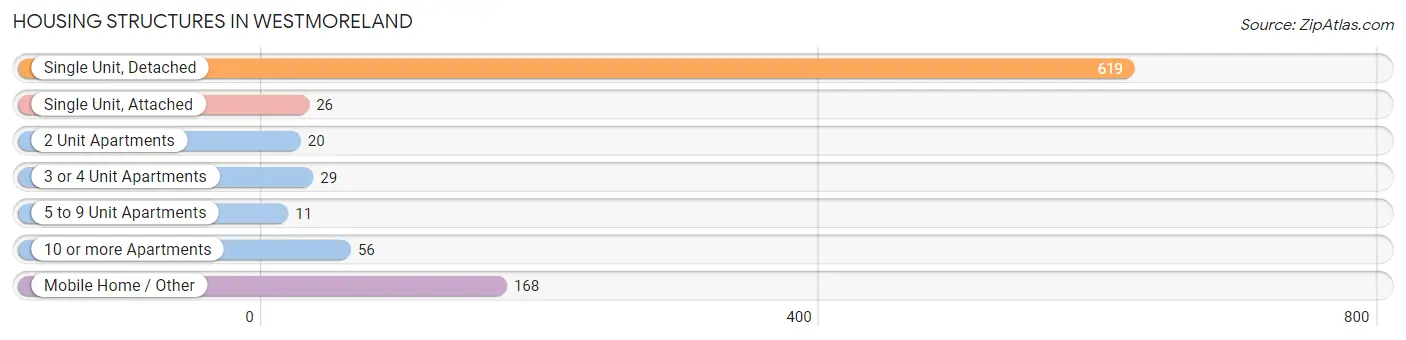
| Structure Type | # Housing Units | % Housing Units |
| Single Unit, Detached | 619 | 66.6% |
| Single Unit, Attached | 26 | 2.8% |
| 2 Unit Apartments | 20 | 2.1% |
| 3 or 4 Unit Apartments | 29 | 3.1% |
| 5 to 9 Unit Apartments | 11 | 1.2% |
| 10 or more Apartments | 56 | 6.0% |
| Mobile Home / Other | 168 | 18.1% |
| Total | 929 | 100.0% |
Housing Structures by Occupancy in Westmoreland
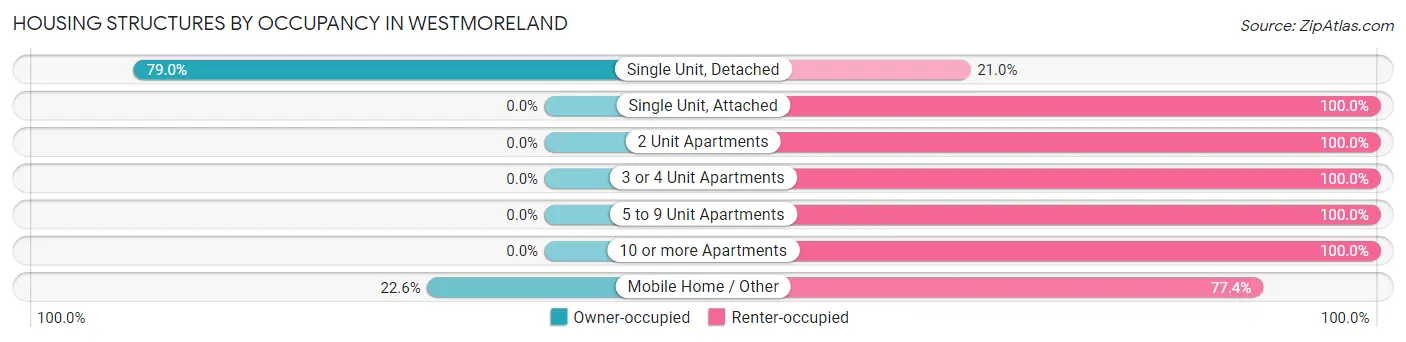
| Structure Type | Owner-occupied | Renter-occupied |
| Single Unit, Detached | 489 (79.0%) | 130 (21.0%) |
| Single Unit, Attached | 0 (0.0%) | 26 (100.0%) |
| 2 Unit Apartments | 0 (0.0%) | 20 (100.0%) |
| 3 or 4 Unit Apartments | 0 (0.0%) | 29 (100.0%) |
| 5 to 9 Unit Apartments | 0 (0.0%) | 11 (100.0%) |
| 10 or more Apartments | 0 (0.0%) | 56 (100.0%) |
| Mobile Home / Other | 38 (22.6%) | 130 (77.4%) |
| Total | 527 (56.7%) | 402 (43.3%) |
Housing Structures by Number of Rooms in Westmoreland
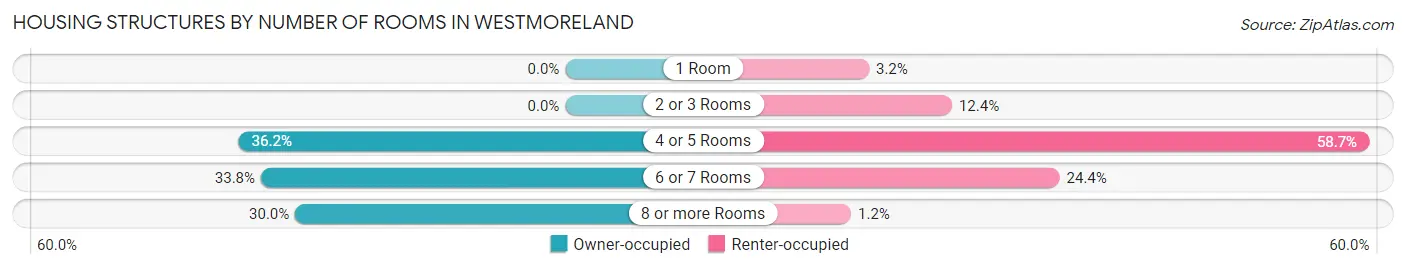
| Number of Rooms | Owner-occupied | Renter-occupied |
| 1 Room | 0 (0.0%) | 13 (3.2%) |
| 2 or 3 Rooms | 0 (0.0%) | 50 (12.4%) |
| 4 or 5 Rooms | 191 (36.2%) | 236 (58.7%) |
| 6 or 7 Rooms | 178 (33.8%) | 98 (24.4%) |
| 8 or more Rooms | 158 (30.0%) | 5 (1.2%) |
| Total | 527 (100.0%) | 402 (100.0%) |
Housing Structure by Heating Type in Westmoreland
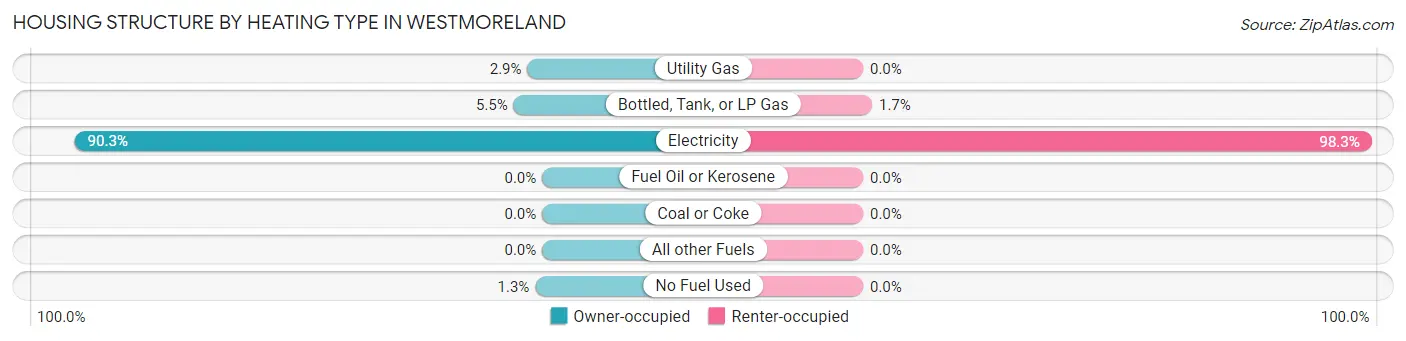
| Heating Type | Owner-occupied | Renter-occupied |
| Utility Gas | 15 (2.9%) | 0 (0.0%) |
| Bottled, Tank, or LP Gas | 29 (5.5%) | 7 (1.7%) |
| Electricity | 476 (90.3%) | 395 (98.3%) |
| Fuel Oil or Kerosene | 0 (0.0%) | 0 (0.0%) |
| Coal or Coke | 0 (0.0%) | 0 (0.0%) |
| All other Fuels | 0 (0.0%) | 0 (0.0%) |
| No Fuel Used | 7 (1.3%) | 0 (0.0%) |
| Total | 527 (100.0%) | 402 (100.0%) |
Household Vehicle Usage in Westmoreland
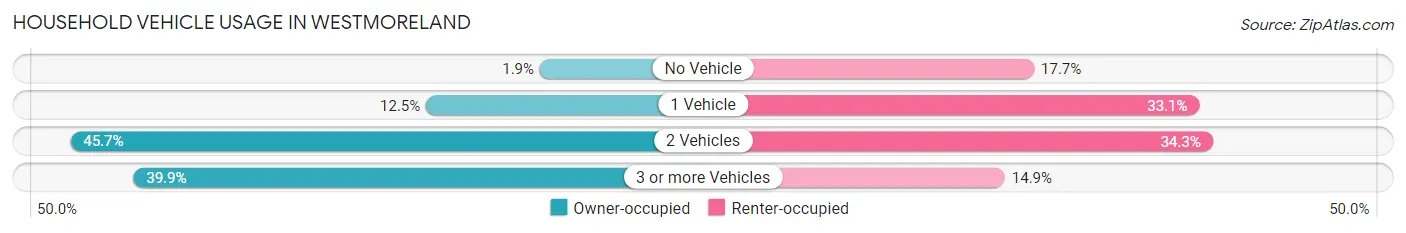
| Vehicles per Household | Owner-occupied | Renter-occupied |
| No Vehicle | 10 (1.9%) | 71 (17.7%) |
| 1 Vehicle | 66 (12.5%) | 133 (33.1%) |
| 2 Vehicles | 241 (45.7%) | 138 (34.3%) |
| 3 or more Vehicles | 210 (39.9%) | 60 (14.9%) |
| Total | 527 (100.0%) | 402 (100.0%) |
Real Estate & Mortgages in Westmoreland
Real Estate and Mortgage Overview in Westmoreland
| Characteristic | Without Mortgage | With Mortgage |
| Housing Units | 186 | 341 |
| Median Property Value | $207,700 | $212,200 |
| Median Household Income | $73,000 | $39 |
| Monthly Housing Costs | $481 | $7 |
| Real Estate Taxes | $1,343 | $14 |
Property Value by Mortgage Status in Westmoreland
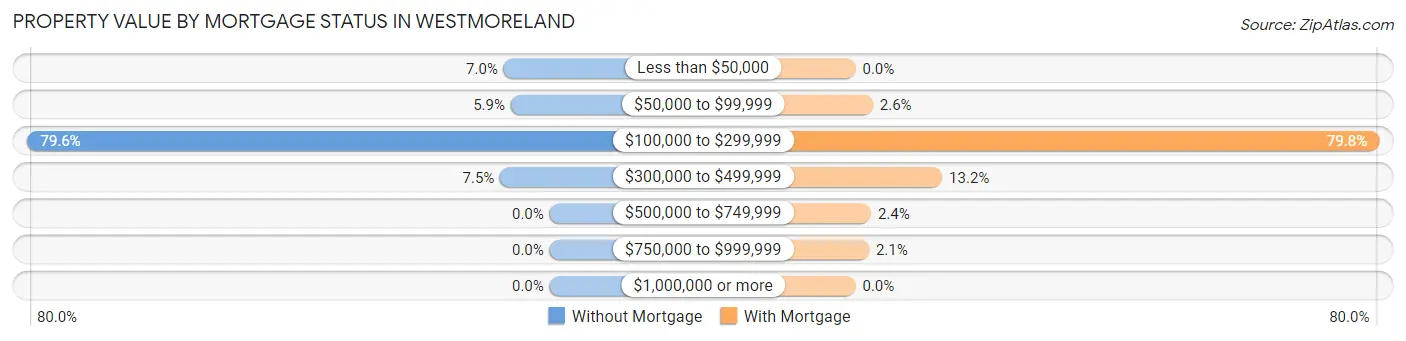
| Property Value | Without Mortgage | With Mortgage |
| Less than $50,000 | 13 (7.0%) | 0 (0.0%) |
| $50,000 to $99,999 | 11 (5.9%) | 9 (2.6%) |
| $100,000 to $299,999 | 148 (79.6%) | 272 (79.8%) |
| $300,000 to $499,999 | 14 (7.5%) | 45 (13.2%) |
| $500,000 to $749,999 | 0 (0.0%) | 8 (2.4%) |
| $750,000 to $999,999 | 0 (0.0%) | 7 (2.1%) |
| $1,000,000 or more | 0 (0.0%) | 0 (0.0%) |
| Total | 186 (100.0%) | 341 (100.0%) |
Household Income by Mortgage Status in Westmoreland
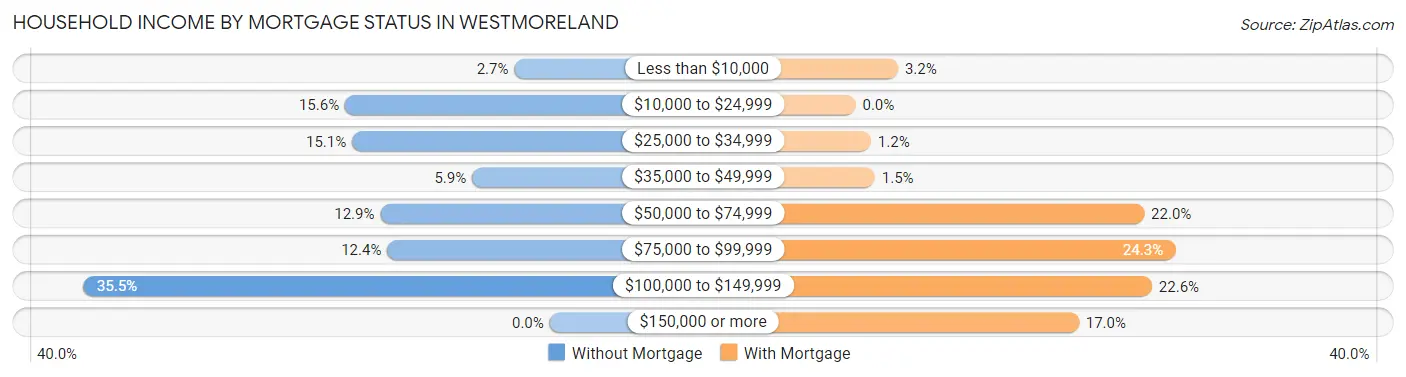
| Household Income | Without Mortgage | With Mortgage |
| Less than $10,000 | 5 (2.7%) | 11 (3.2%) |
| $10,000 to $24,999 | 29 (15.6%) | 0 (0.0%) |
| $25,000 to $34,999 | 28 (15.0%) | 4 (1.2%) |
| $35,000 to $49,999 | 11 (5.9%) | 5 (1.5%) |
| $50,000 to $74,999 | 24 (12.9%) | 75 (22.0%) |
| $75,000 to $99,999 | 23 (12.4%) | 83 (24.3%) |
| $100,000 to $149,999 | 66 (35.5%) | 77 (22.6%) |
| $150,000 or more | 0 (0.0%) | 58 (17.0%) |
| Total | 186 (100.0%) | 341 (100.0%) |
Property Value to Household Income Ratio in Westmoreland
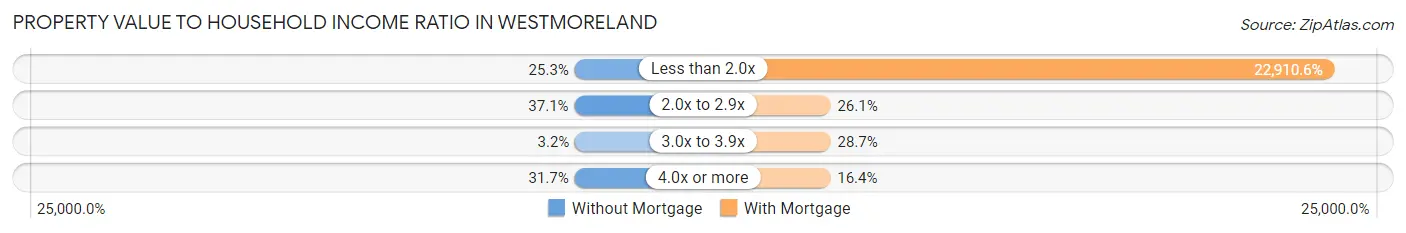
| Value-to-Income Ratio | Without Mortgage | With Mortgage |
| Less than 2.0x | 47 (25.3%) | 78,125 (22,910.6%) |
| 2.0x to 2.9x | 69 (37.1%) | 89 (26.1%) |
| 3.0x to 3.9x | 6 (3.2%) | 98 (28.7%) |
| 4.0x or more | 59 (31.7%) | 56 (16.4%) |
| Total | 186 (100.0%) | 341 (100.0%) |
Real Estate Taxes by Mortgage Status in Westmoreland
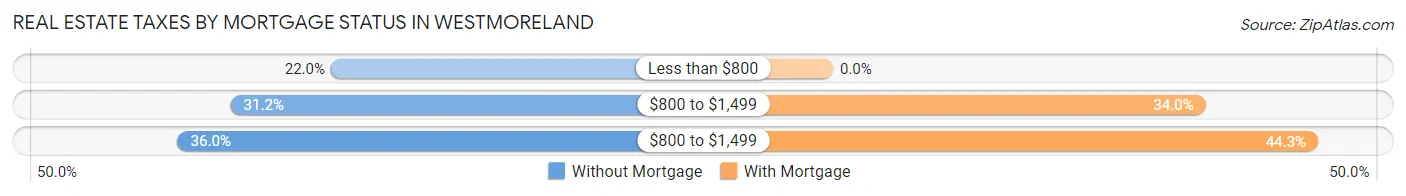
| Property Taxes | Without Mortgage | With Mortgage |
| Less than $800 | 41 (22.0%) | 0 (0.0%) |
| $800 to $1,499 | 58 (31.2%) | 116 (34.0%) |
| $800 to $1,499 | 67 (36.0%) | 151 (44.3%) |
| Total | 186 (100.0%) | 341 (100.0%) |
Health & Disability in Westmoreland
Health Insurance Coverage by Age in Westmoreland
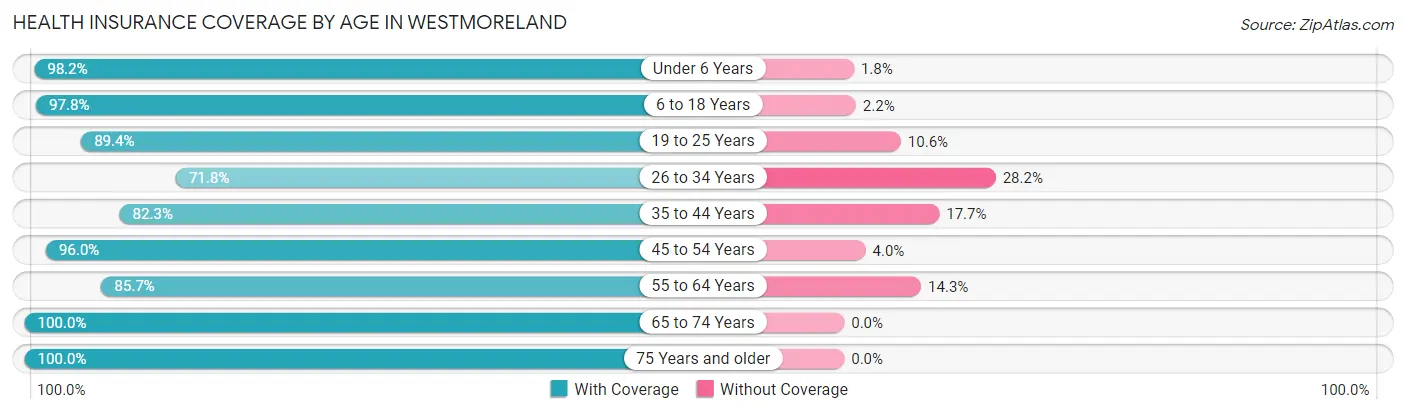
| Age Bracket | With Coverage | Without Coverage |
| Under 6 Years | 325 (98.2%) | 6 (1.8%) |
| 6 to 18 Years | 452 (97.8%) | 10 (2.2%) |
| 19 to 25 Years | 144 (89.4%) | 17 (10.6%) |
| 26 to 34 Years | 244 (71.8%) | 96 (28.2%) |
| 35 to 44 Years | 376 (82.3%) | 81 (17.7%) |
| 45 to 54 Years | 217 (96.0%) | 9 (4.0%) |
| 55 to 64 Years | 287 (85.7%) | 48 (14.3%) |
| 65 to 74 Years | 197 (100.0%) | 0 (0.0%) |
| 75 Years and older | 94 (100.0%) | 0 (0.0%) |
| Total | 2,336 (89.7%) | 267 (10.3%) |
Health Insurance Coverage by Citizenship Status in Westmoreland
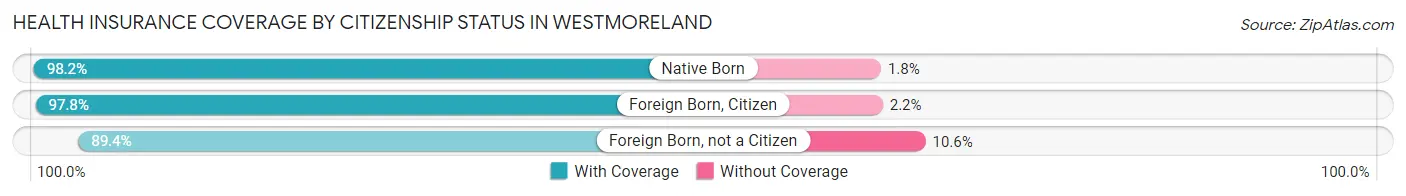
| Citizenship Status | With Coverage | Without Coverage |
| Native Born | 325 (98.2%) | 6 (1.8%) |
| Foreign Born, Citizen | 452 (97.8%) | 10 (2.2%) |
| Foreign Born, not a Citizen | 144 (89.4%) | 17 (10.6%) |
Health Insurance Coverage by Household Income in Westmoreland
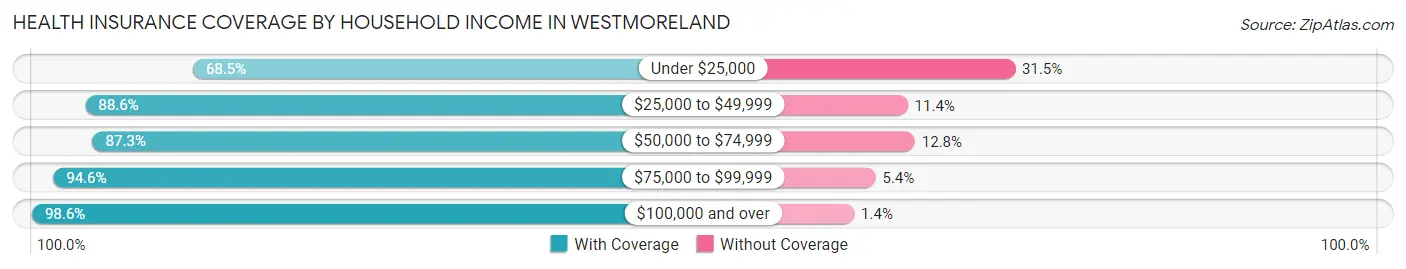
| Household Income | With Coverage | Without Coverage |
| Under $25,000 | 202 (68.5%) | 93 (31.5%) |
| $25,000 to $49,999 | 513 (88.6%) | 66 (11.4%) |
| $50,000 to $74,999 | 520 (87.3%) | 76 (12.8%) |
| $75,000 to $99,999 | 387 (94.6%) | 22 (5.4%) |
| $100,000 and over | 714 (98.6%) | 10 (1.4%) |
Public vs Private Health Insurance Coverage by Age in Westmoreland
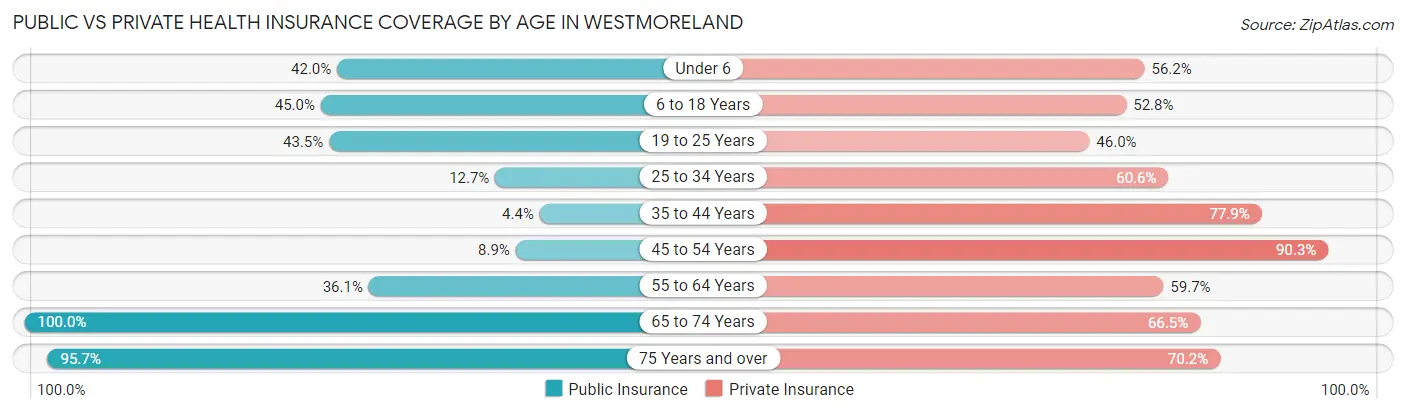
| Age Bracket | Public Insurance | Private Insurance |
| Under 6 | 139 (42.0%) | 186 (56.2%) |
| 6 to 18 Years | 208 (45.0%) | 244 (52.8%) |
| 19 to 25 Years | 70 (43.5%) | 74 (46.0%) |
| 25 to 34 Years | 43 (12.7%) | 206 (60.6%) |
| 35 to 44 Years | 20 (4.4%) | 356 (77.9%) |
| 45 to 54 Years | 20 (8.8%) | 204 (90.3%) |
| 55 to 64 Years | 121 (36.1%) | 200 (59.7%) |
| 65 to 74 Years | 197 (100.0%) | 131 (66.5%) |
| 75 Years and over | 90 (95.7%) | 66 (70.2%) |
| Total | 908 (34.9%) | 1,667 (64.0%) |
Disability Status by Sex by Age in Westmoreland
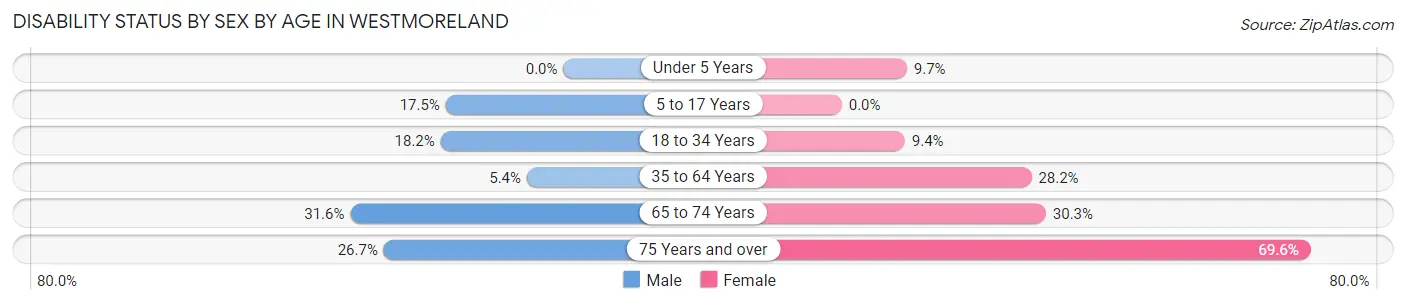
| Age Bracket | Male | Female |
| Under 5 Years | 0 (0.0%) | 17 (9.7%) |
| 5 to 17 Years | 40 (17.5%) | 0 (0.0%) |
| 18 to 34 Years | 35 (18.2%) | 32 (9.4%) |
| 35 to 64 Years | 29 (5.4%) | 136 (28.2%) |
| 65 to 74 Years | 31 (31.6%) | 30 (30.3%) |
| 75 Years and over | 4 (26.7%) | 55 (69.6%) |
Disability Class by Sex by Age in Westmoreland
Disability Class: Hearing Difficulty
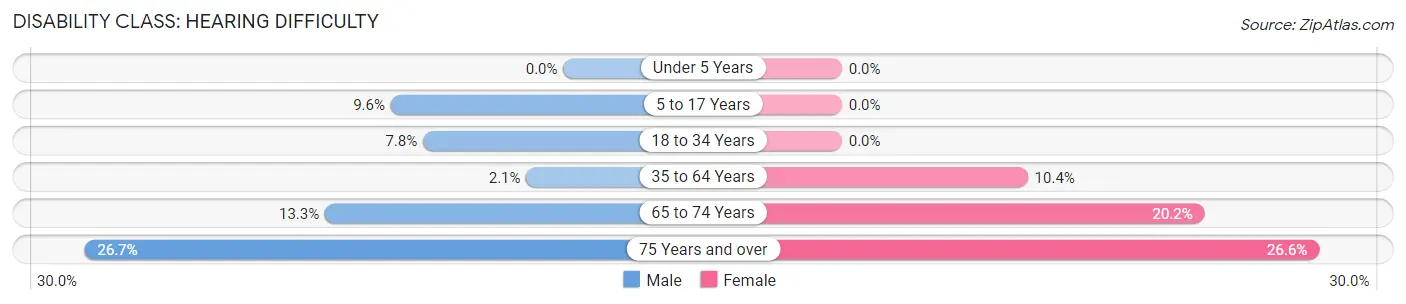
| Age Bracket | Male | Female |
| Under 5 Years | 0 (0.0%) | 0 (0.0%) |
| 5 to 17 Years | 22 (9.6%) | 0 (0.0%) |
| 18 to 34 Years | 15 (7.8%) | 0 (0.0%) |
| 35 to 64 Years | 11 (2.1%) | 50 (10.3%) |
| 65 to 74 Years | 13 (13.3%) | 20 (20.2%) |
| 75 Years and over | 4 (26.7%) | 21 (26.6%) |
Disability Class: Vision Difficulty
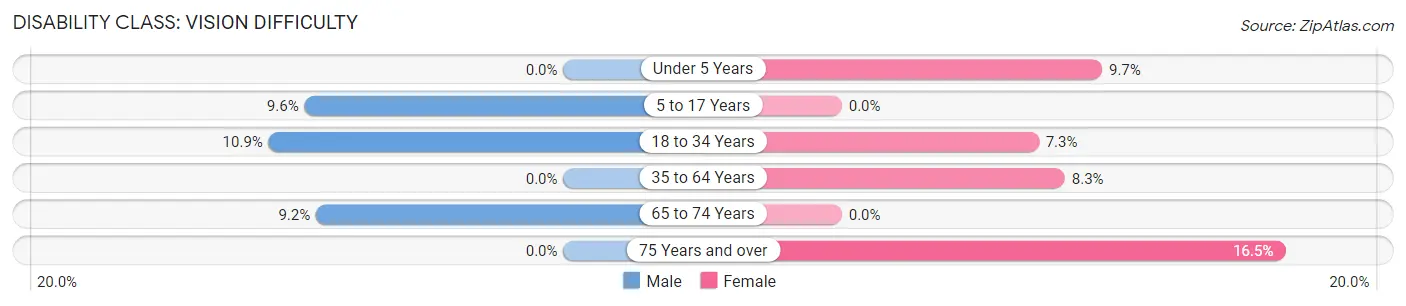
| Age Bracket | Male | Female |
| Under 5 Years | 0 (0.0%) | 17 (9.7%) |
| 5 to 17 Years | 22 (9.6%) | 0 (0.0%) |
| 18 to 34 Years | 21 (10.9%) | 25 (7.3%) |
| 35 to 64 Years | 0 (0.0%) | 40 (8.3%) |
| 65 to 74 Years | 9 (9.2%) | 0 (0.0%) |
| 75 Years and over | 0 (0.0%) | 13 (16.5%) |
Disability Class: Cognitive Difficulty
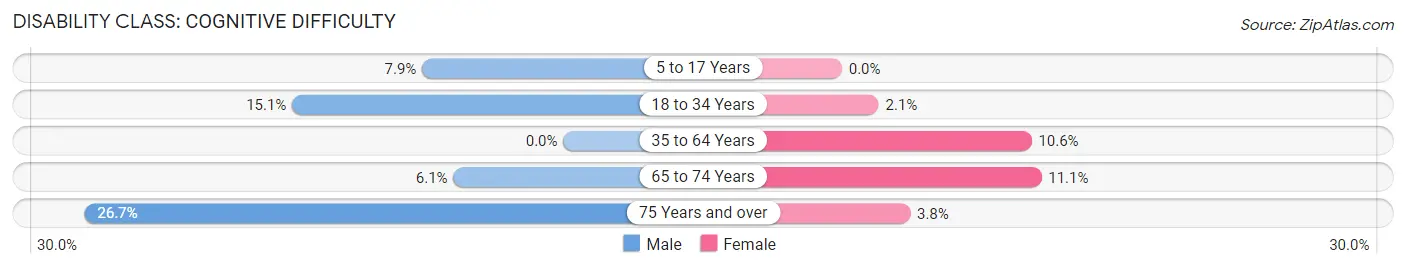
| Age Bracket | Male | Female |
| 5 to 17 Years | 18 (7.9%) | 0 (0.0%) |
| 18 to 34 Years | 29 (15.1%) | 7 (2.1%) |
| 35 to 64 Years | 0 (0.0%) | 51 (10.6%) |
| 65 to 74 Years | 6 (6.1%) | 11 (11.1%) |
| 75 Years and over | 4 (26.7%) | 3 (3.8%) |
Disability Class: Ambulatory Difficulty
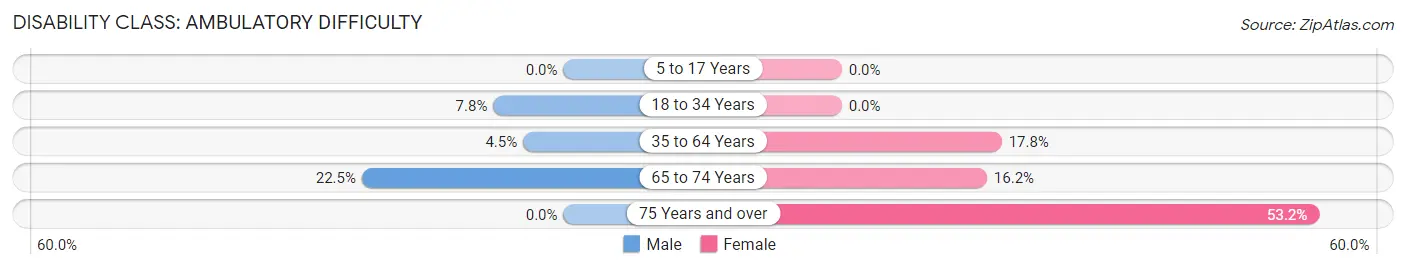
| Age Bracket | Male | Female |
| 5 to 17 Years | 0 (0.0%) | 0 (0.0%) |
| 18 to 34 Years | 15 (7.8%) | 0 (0.0%) |
| 35 to 64 Years | 24 (4.5%) | 86 (17.8%) |
| 65 to 74 Years | 22 (22.5%) | 16 (16.2%) |
| 75 Years and over | 0 (0.0%) | 42 (53.2%) |
Disability Class: Self-Care Difficulty
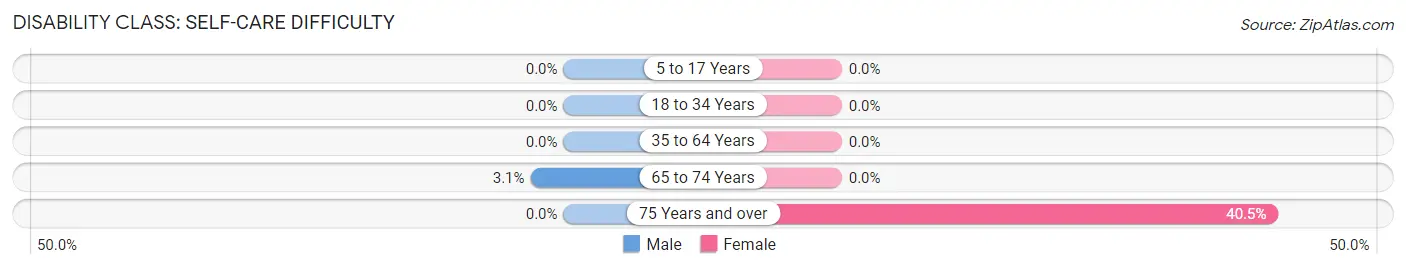
| Age Bracket | Male | Female |
| 5 to 17 Years | 0 (0.0%) | 0 (0.0%) |
| 18 to 34 Years | 0 (0.0%) | 0 (0.0%) |
| 35 to 64 Years | 0 (0.0%) | 0 (0.0%) |
| 65 to 74 Years | 3 (3.1%) | 0 (0.0%) |
| 75 Years and over | 0 (0.0%) | 32 (40.5%) |
Technology Access in Westmoreland
Computing Device Access in Westmoreland
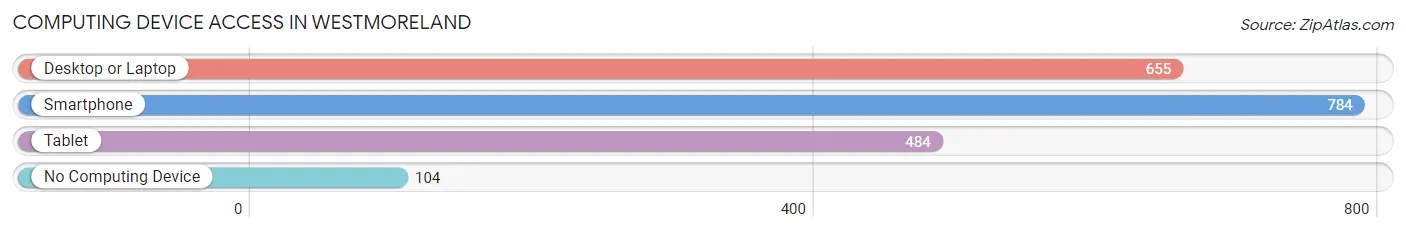
| Device Type | # Households | % Households |
| Desktop or Laptop | 655 | 70.5% |
| Smartphone | 784 | 84.4% |
| Tablet | 484 | 52.1% |
| No Computing Device | 104 | 11.2% |
| Total | 929 | 100.0% |
Internet Access in Westmoreland
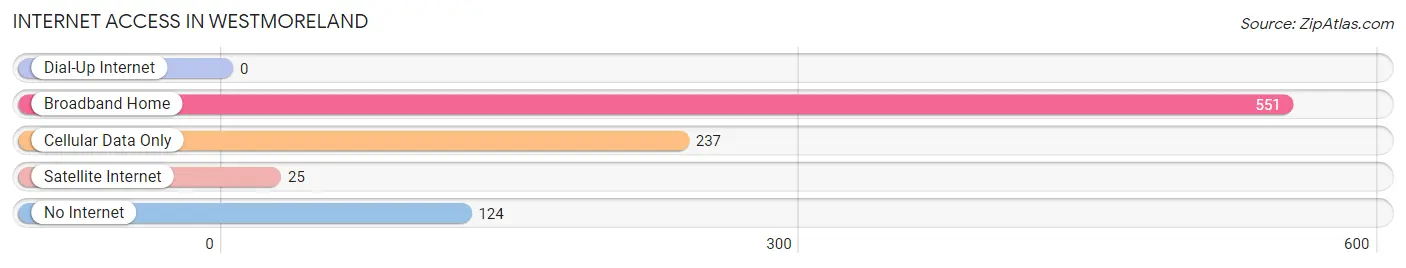
| Internet Type | # Households | % Households |
| Dial-Up Internet | 0 | 0.0% |
| Broadband Home | 551 | 59.3% |
| Cellular Data Only | 237 | 25.5% |
| Satellite Internet | 25 | 2.7% |
| No Internet | 124 | 13.4% |
| Total | 929 | 100.0% |
Westmoreland Summary
Westmoreland, Tennessee is a small town located in Sumner County, Tennessee. It is situated about 25 miles northeast of Nashville and is part of the Nashville metropolitan area. The town has a population of approximately 2,500 people and is known for its rural charm and friendly atmosphere.
History
Westmoreland was founded in 1820 by a group of settlers from North Carolina. The town was named after the Westmoreland family, who were among the first settlers. The town was originally a farming community, but it soon developed into a small manufacturing center. The town was incorporated in 1871 and has remained a small, rural community ever since.
Geography
Westmoreland is located in the rolling hills of Sumner County, Tennessee. The town is situated on the banks of the Cumberland River and is surrounded by lush forests and rolling hills. The town is located about 25 miles northeast of Nashville and is part of the Nashville metropolitan area.
Economy
Westmoreland’s economy is largely based on agriculture and manufacturing. The town is home to several small businesses, including a lumber mill, a furniture factory, and a dairy farm. The town also has a few retail stores, including a grocery store and a hardware store.
Demographics
As of the 2010 census, Westmoreland had a population of 2,500 people. The town is predominantly white, with about 90% of the population being Caucasian. The median household income is $37,000, and the median home value is $125,000. The town has a low unemployment rate of 4.2%.
Westmoreland is a small, rural town with a friendly atmosphere and a strong sense of community. The town is known for its rural charm and its close-knit community. The town is home to several small businesses and is a great place to raise a family. Westmoreland is a great place to live and work, and it is a great place to visit.
Common Questions
What is Per Capita Income in Westmoreland?
Per Capita income in Westmoreland is $26,295.
What is the Median Family Income in Westmoreland?
Median Family Income in Westmoreland is $60,350.
What is the Median Household income in Westmoreland?
Median Household Income in Westmoreland is $58,194.
What is Income or Wage Gap in Westmoreland?
Income or Wage Gap in Westmoreland is 12.5%.
Women in Westmoreland earn 87.5 cents for every dollar earned by a man.
What is Inequality or Gini Index in Westmoreland?
Inequality or Gini Index in Westmoreland is 0.42.
What is the Total Population of Westmoreland?
Total Population of Westmoreland is 2,711.
What is the Total Male Population of Westmoreland?
Total Male Population of Westmoreland is 1,214.
What is the Total Female Population of Westmoreland?
Total Female Population of Westmoreland is 1,497.
What is the Ratio of Males per 100 Females in Westmoreland?
There are 81.10 Males per 100 Females in Westmoreland.
What is the Ratio of Females per 100 Males in Westmoreland?
There are 123.31 Females per 100 Males in Westmoreland.
What is the Median Population Age in Westmoreland?
Median Population Age in Westmoreland is 36.8 Years.
What is the Average Family Size in Westmoreland
Average Family Size in Westmoreland is 3.2 People.
What is the Average Household Size in Westmoreland
Average Household Size in Westmoreland is 2.8 People.
How Large is the Labor Force in Westmoreland?
There are 1,268 People in the Labor Forcein in Westmoreland.
What is the Percentage of People in the Labor Force in Westmoreland?
62.5% of People are in the Labor Force in Westmoreland.
What is the Unemployment Rate in Westmoreland?
Unemployment Rate in Westmoreland is 6.0%.