Spring Hill, TN Map & Demographics
Spring Hill Map
Spring Hill Overview
$42,724
PER CAPITA INCOME
$113,926
AVG FAMILY INCOME
$104,880
AVG HOUSEHOLD INCOME
40.7%
WAGE / INCOME GAP [ % ]
59.3¢/ $1
WAGE / INCOME GAP [ $ ]
$5,387
FAMILY INCOME DEFICIT
0.36
INEQUALITY / GINI INDEX
51,319
TOTAL POPULATION
25,869
MALE POPULATION
25,450
FEMALE POPULATION
101.65
MALES / 100 FEMALES
98.38
FEMALES / 100 MALES
35.6
MEDIAN AGE
3.2
AVG FAMILY SIZE
2.9
AVG HOUSEHOLD SIZE
27,304
LABOR FORCE [ PEOPLE ]
72.7%
PERCENT IN LABOR FORCE
1.1%
UNEMPLOYMENT RATE
Spring Hill Zip Codes
Income in Spring Hill
Income Overview in Spring Hill
Per Capita Income in Spring Hill is $42,724, while median incomes of families and households are $113,926 and $104,880 respectively.
| Characteristic | Number | Measure |
| Per Capita Income | 51,319 | $42,724 |
| Median Family Income | 14,614 | $113,926 |
| Mean Family Income | 14,614 | $129,347 |
| Median Household Income | 17,867 | $104,880 |
| Mean Household Income | 17,867 | $119,905 |
| Income Deficit | 14,614 | $5,387 |
| Wage / Income Gap (%) | 51,319 | 40.66% |
| Wage / Income Gap ($) | 51,319 | 59.34¢ per $1 |
| Gini / Inequality Index | 51,319 | 0.36 |
Earnings by Sex in Spring Hill
Average Earnings in Spring Hill are $53,914, $68,369 for men and $40,567 for women, a difference of 40.7%.
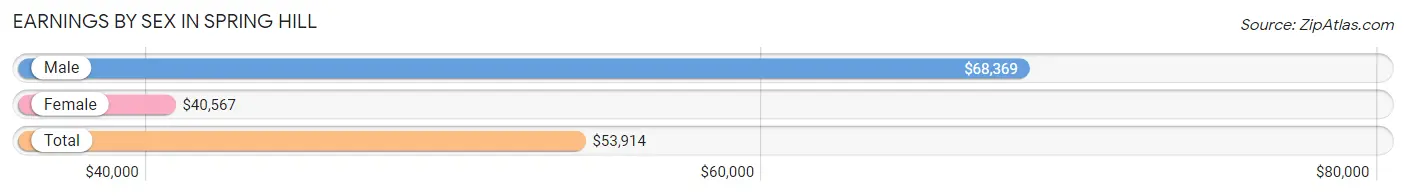
| Sex | Number | Average Earnings |
| Male | 15,648 (54.8%) | $68,369 |
| Female | 12,921 (45.2%) | $40,567 |
| Total | 28,569 (100.0%) | $53,914 |
Earnings by Sex by Income Bracket in Spring Hill
The most common earnings brackets in Spring Hill are $100,000+ for men (4,626 | 29.6%) and $75,000 to $99,999 for women (1,823 | 14.1%).
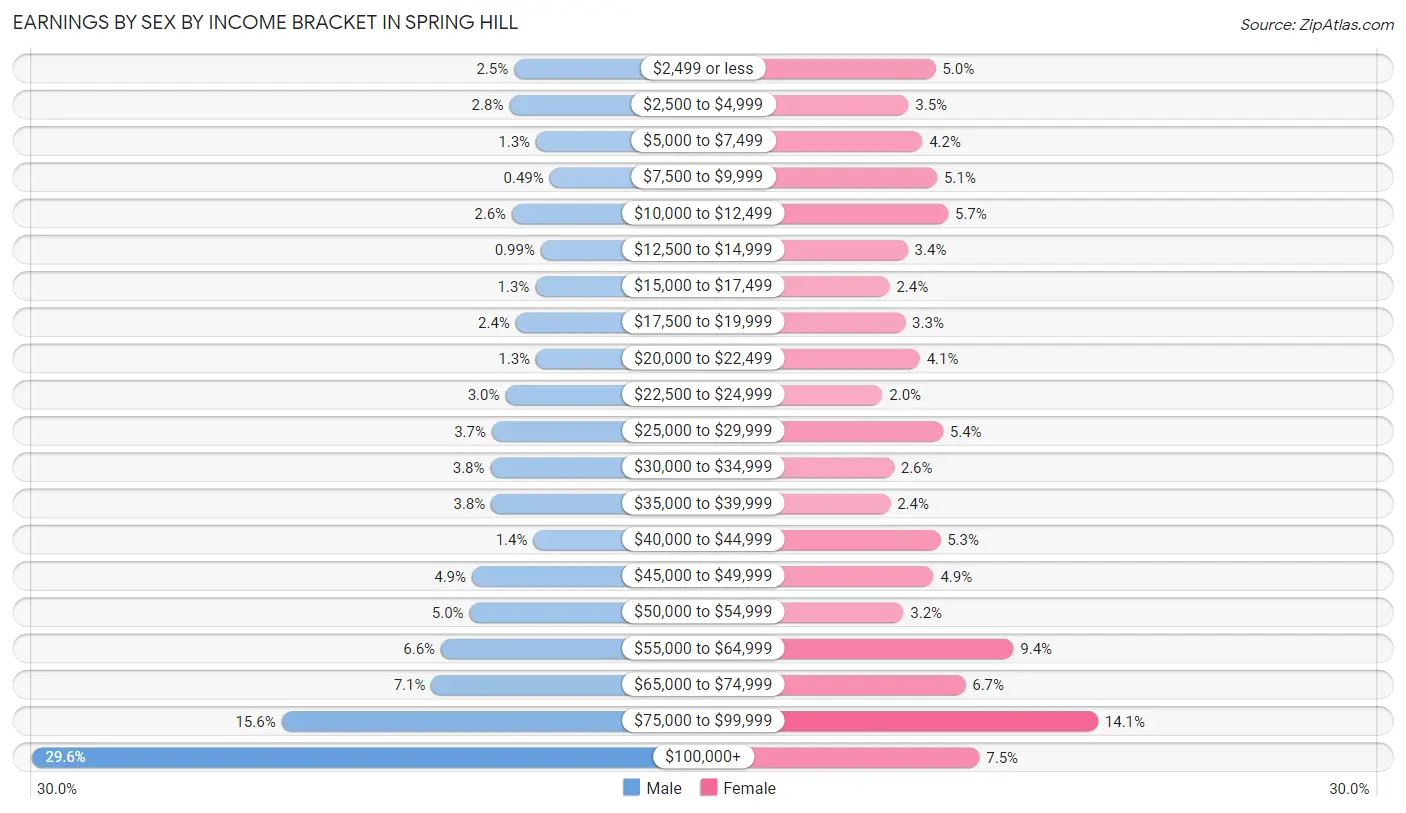
| Income | Male | Female |
| $2,499 or less | 389 (2.5%) | 643 (5.0%) |
| $2,500 to $4,999 | 432 (2.8%) | 447 (3.5%) |
| $5,000 to $7,499 | 197 (1.3%) | 548 (4.2%) |
| $7,500 to $9,999 | 77 (0.5%) | 657 (5.1%) |
| $10,000 to $12,499 | 408 (2.6%) | 735 (5.7%) |
| $12,500 to $14,999 | 155 (1.0%) | 442 (3.4%) |
| $15,000 to $17,499 | 204 (1.3%) | 310 (2.4%) |
| $17,500 to $19,999 | 376 (2.4%) | 424 (3.3%) |
| $20,000 to $22,499 | 197 (1.3%) | 530 (4.1%) |
| $22,500 to $24,999 | 466 (3.0%) | 258 (2.0%) |
| $25,000 to $29,999 | 585 (3.7%) | 698 (5.4%) |
| $30,000 to $34,999 | 597 (3.8%) | 341 (2.6%) |
| $35,000 to $39,999 | 591 (3.8%) | 315 (2.4%) |
| $40,000 to $44,999 | 220 (1.4%) | 678 (5.2%) |
| $45,000 to $49,999 | 761 (4.9%) | 629 (4.9%) |
| $50,000 to $54,999 | 782 (5.0%) | 411 (3.2%) |
| $55,000 to $64,999 | 1,032 (6.6%) | 1,209 (9.4%) |
| $65,000 to $74,999 | 1,118 (7.1%) | 861 (6.7%) |
| $75,000 to $99,999 | 2,435 (15.6%) | 1,823 (14.1%) |
| $100,000+ | 4,626 (29.6%) | 962 (7.4%) |
| Total | 15,648 (100.0%) | 12,921 (100.0%) |
Earnings by Sex by Educational Attainment in Spring Hill
Average earnings in Spring Hill are $76,718 for men and $46,655 for women, a difference of 39.2%. Men with an educational attainment of bachelor's degree enjoy the highest average annual earnings of $97,123, while those with less than high school education earn the least with $36,969. Women with an educational attainment of graduate degree earn the most with the average annual earnings of $58,834, while those with less than high school education have the smallest earnings of $10,349.
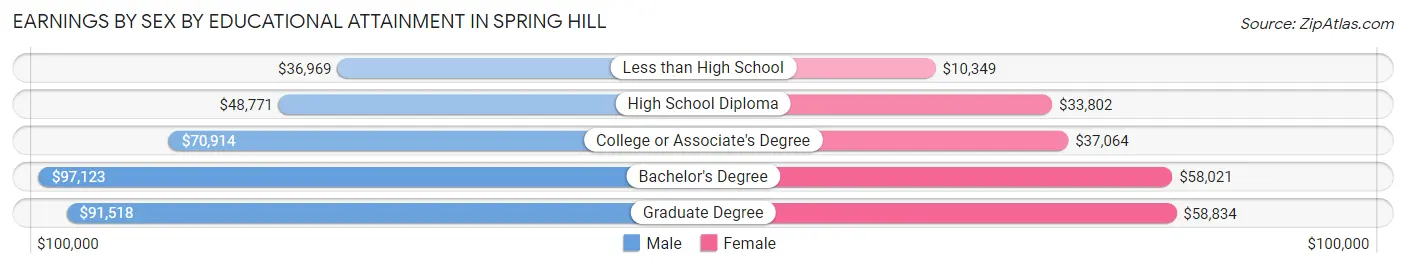
| Educational Attainment | Male Income | Female Income |
| Less than High School | $36,969 | $10,349 |
| High School Diploma | $48,771 | $33,802 |
| College or Associate's Degree | $70,914 | $37,064 |
| Bachelor's Degree | $97,123 | $58,021 |
| Graduate Degree | $91,518 | $58,834 |
| Total | $76,718 | $46,655 |
Family Income in Spring Hill
Family Income Brackets in Spring Hill
According to the Spring Hill family income data, there are 3,917 families falling into the $100,000 to $149,999 income range, which is the most common income bracket and makes up 26.8% of all families. Conversely, the less than $10,000 income bracket is the least frequent group with only 88 families (0.6%) belonging to this category.
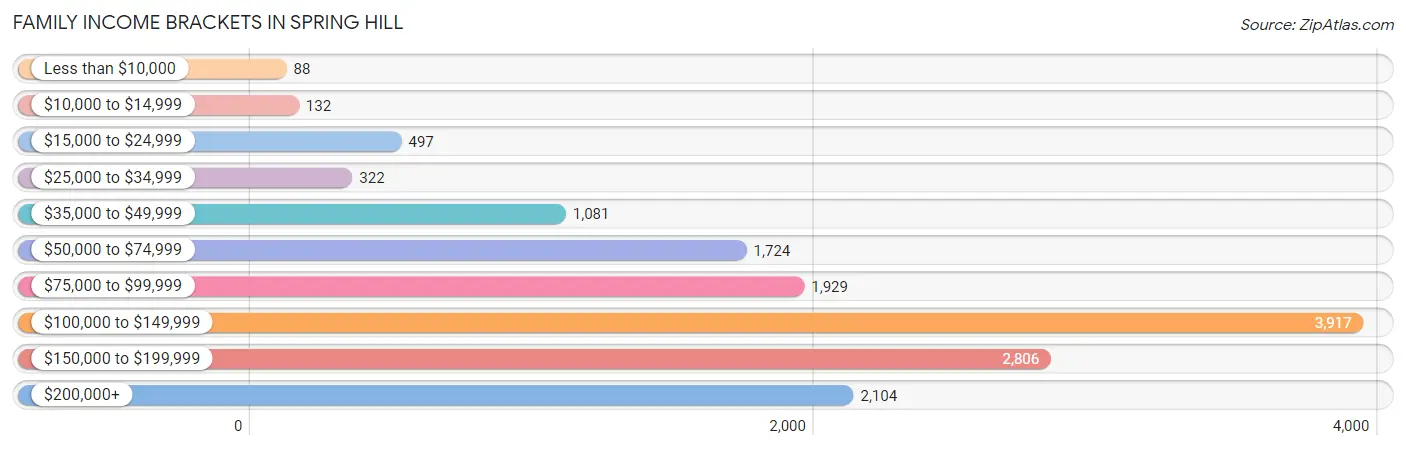
| Income Bracket | # Families | % Families |
| Less than $10,000 | 88 | 0.6% |
| $10,000 to $14,999 | 132 | 0.9% |
| $15,000 to $24,999 | 497 | 3.4% |
| $25,000 to $34,999 | 322 | 2.2% |
| $35,000 to $49,999 | 1,081 | 7.4% |
| $50,000 to $74,999 | 1,724 | 11.8% |
| $75,000 to $99,999 | 1,929 | 13.2% |
| $100,000 to $149,999 | 3,917 | 26.8% |
| $150,000 to $199,999 | 2,806 | 19.2% |
| $200,000+ | 2,104 | 14.4% |
Family Income by Famaliy Size in Spring Hill
7+ person families (139 | 0.9%) account for the highest median family income in Spring Hill with $226,776 per family, while 2-person families (6,247 | 42.7%) have the highest median income of $45,800 per family member.
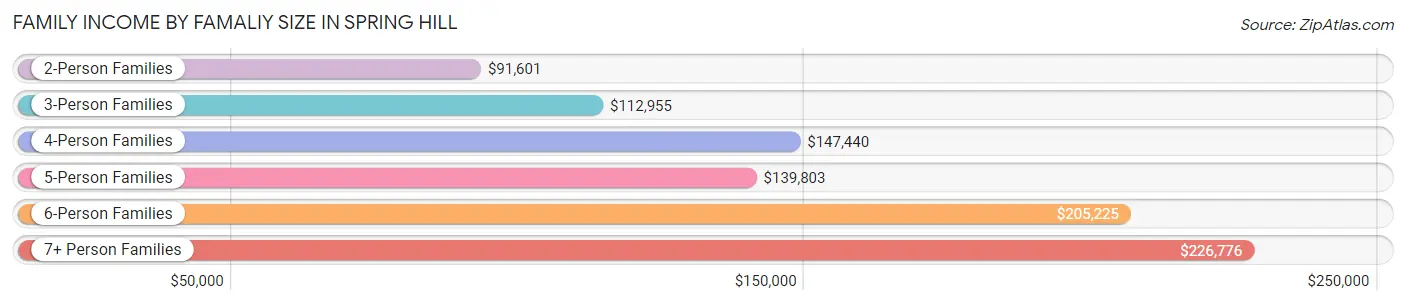
| Income Bracket | # Families | Median Income |
| 2-Person Families | 6,247 (42.7%) | $91,601 |
| 3-Person Families | 3,114 (21.3%) | $112,955 |
| 4-Person Families | 3,415 (23.4%) | $147,440 |
| 5-Person Families | 1,196 (8.2%) | $139,803 |
| 6-Person Families | 503 (3.4%) | $205,225 |
| 7+ Person Families | 139 (0.9%) | $226,776 |
| Total | 14,614 (100.0%) | $113,926 |
Family Income by Number of Earners in Spring Hill
The median family income in Spring Hill is $113,926, with families comprising 3+ earners (1,612) having the highest median family income of $152,315, while families with no earners (1,201) have the lowest median family income of $64,208, accounting for 11.0% and 8.2% of families, respectively.
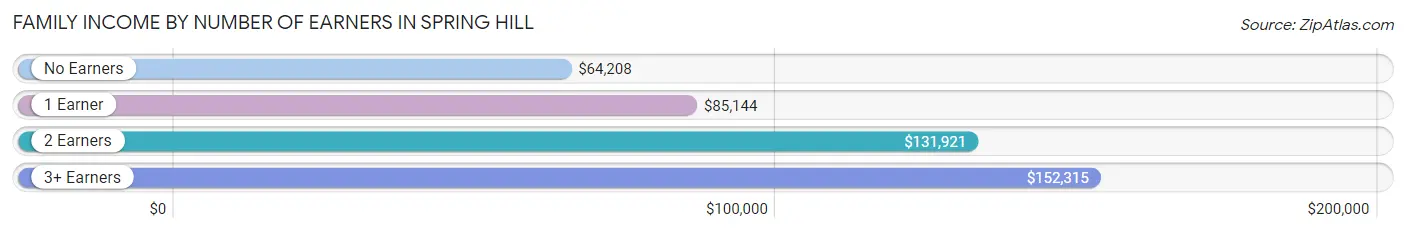
| Number of Earners | # Families | Median Income |
| No Earners | 1,201 (8.2%) | $64,208 |
| 1 Earner | 4,574 (31.3%) | $85,144 |
| 2 Earners | 7,227 (49.4%) | $131,921 |
| 3+ Earners | 1,612 (11.0%) | $152,315 |
| Total | 14,614 (100.0%) | $113,926 |
Household Income in Spring Hill
Household Income Brackets in Spring Hill
With 4,270 households falling in the category, the $100,000 to $149,999 income range is the most frequent in Spring Hill, accounting for 23.9% of all households. In contrast, only 214 households (1.2%) fall into the $10,000 to $14,999 income bracket, making it the least populous group.
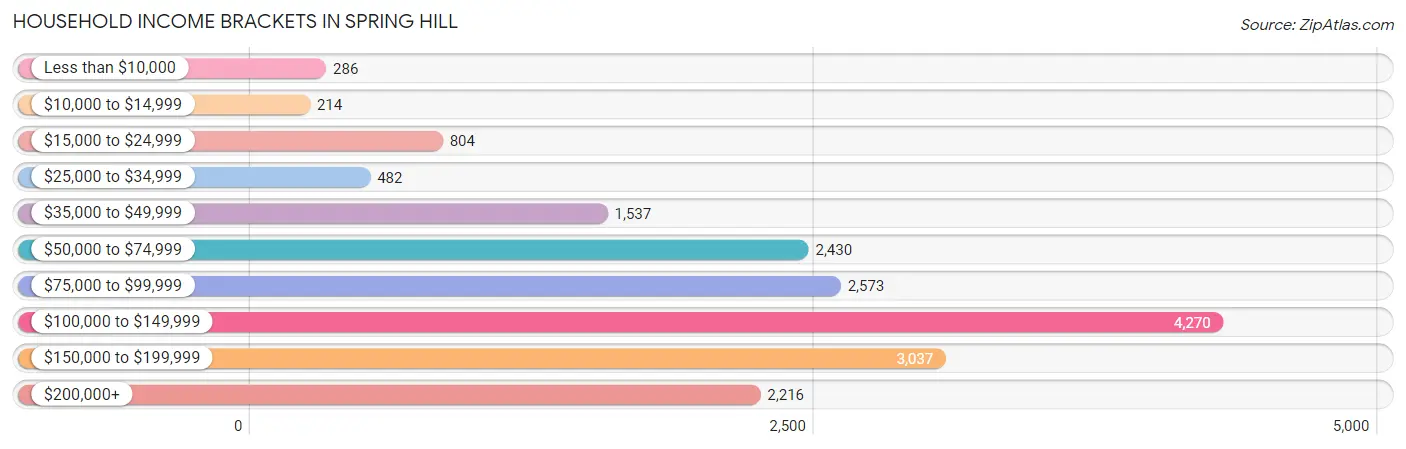
| Income Bracket | # Households | % Households |
| Less than $10,000 | 286 | 1.6% |
| $10,000 to $14,999 | 214 | 1.2% |
| $15,000 to $24,999 | 804 | 4.5% |
| $25,000 to $34,999 | 482 | 2.7% |
| $35,000 to $49,999 | 1,537 | 8.6% |
| $50,000 to $74,999 | 2,430 | 13.6% |
| $75,000 to $99,999 | 2,573 | 14.4% |
| $100,000 to $149,999 | 4,270 | 23.9% |
| $150,000 to $199,999 | 3,037 | 17.0% |
| $200,000+ | 2,216 | 12.4% |
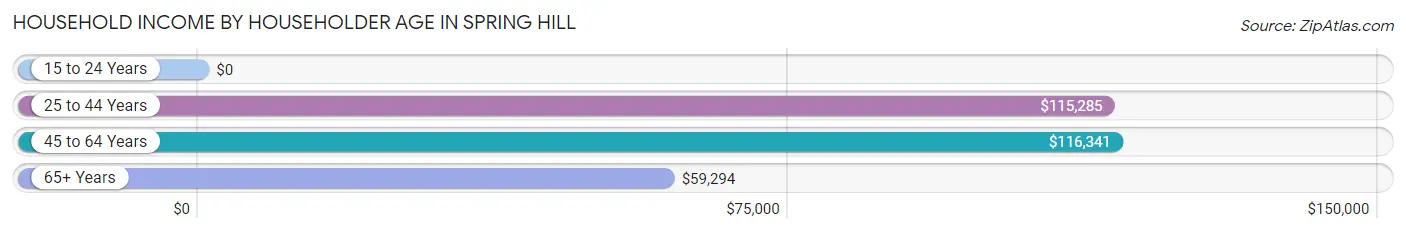
Household Income by Householder Age in Spring Hill
The median household income in Spring Hill is $104,880, with the highest median household income of $116,341 found in the 45 to 64 years age bracket for the primary householder. A total of 6,143 households (34.4%) fall into this category. Meanwhile, the 15 to 24 years age bracket for the primary householder has the lowest median household income of $0, with 303 households (1.7%) in this group.
| Income Bracket | # Households | Median Income |
| 15 to 24 Years | 303 (1.7%) | $0 |
| 25 to 44 Years | 8,210 (46.0%) | $115,285 |
| 45 to 64 Years | 6,143 (34.4%) | $116,341 |
| 65+ Years | 3,211 (18.0%) | $59,294 |
| Total | 17,867 (100.0%) | $104,880 |
Poverty in Spring Hill
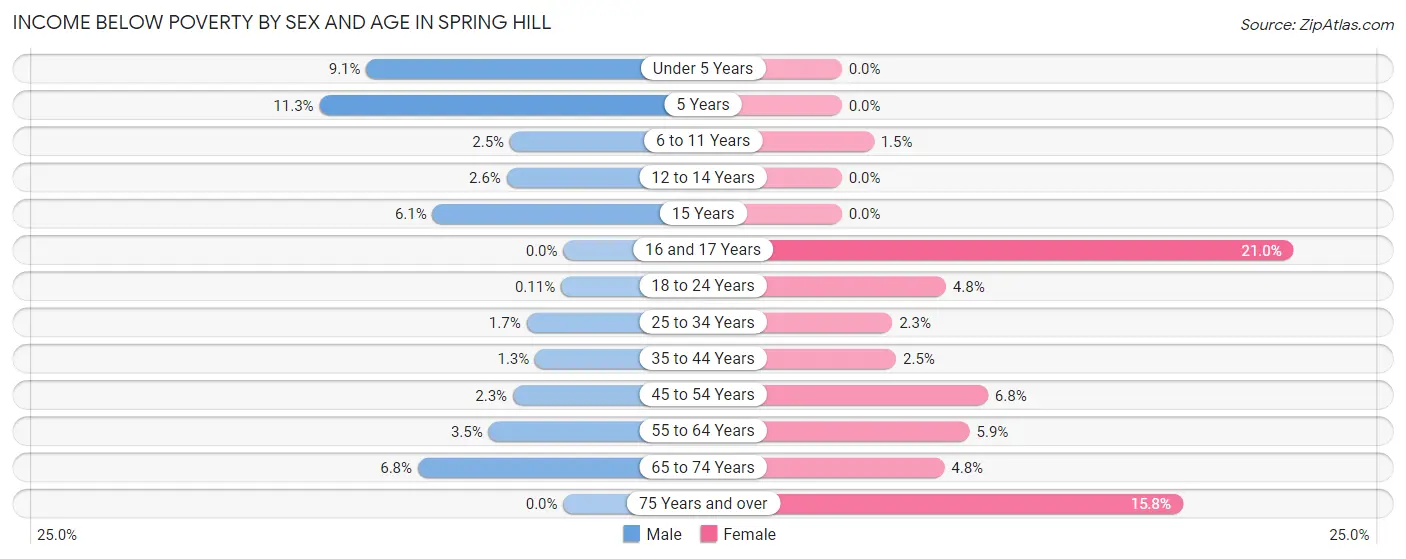
Income Below Poverty by Sex and Age in Spring Hill
With 2.9% poverty level for males and 4.0% for females among the residents of Spring Hill, 5 year old males and 16 and 17 year old females are the most vulnerable to poverty, with 53 males (11.3%) and 100 females (21.0%) in their respective age groups living below the poverty level.
| Age Bracket | Male | Female |
| Under 5 Years | 172 (9.1%) | 0 (0.0%) |
| 5 Years | 53 (11.3%) | 0 (0.0%) |
| 6 to 11 Years | 77 (2.5%) | 49 (1.5%) |
| 12 to 14 Years | 24 (2.6%) | 0 (0.0%) |
| 15 Years | 23 (6.1%) | 0 (0.0%) |
| 16 and 17 Years | 0 (0.0%) | 100 (21.0%) |
| 18 to 24 Years | 2 (0.1%) | 87 (4.8%) |
| 25 to 34 Years | 61 (1.7%) | 72 (2.3%) |
| 35 to 44 Years | 66 (1.3%) | 118 (2.5%) |
| 45 to 54 Years | 72 (2.3%) | 224 (6.8%) |
| 55 to 64 Years | 76 (3.5%) | 156 (5.9%) |
| 65 to 74 Years | 114 (6.8%) | 90 (4.8%) |
| 75 Years and over | 0 (0.0%) | 109 (15.8%) |
| Total | 740 (2.9%) | 1,005 (4.0%) |
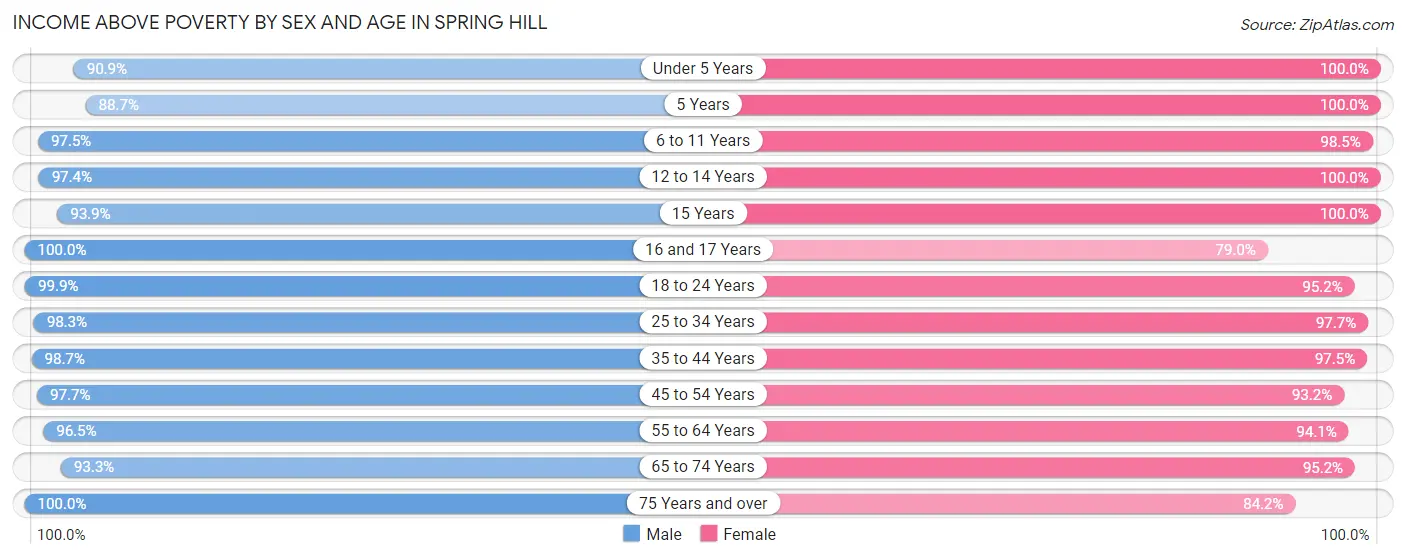
Income Above Poverty by Sex and Age in Spring Hill
According to the poverty statistics in Spring Hill, males aged 16 and 17 years and females aged under 5 years are the age groups that are most secure financially, with 100.0% of males and 100.0% of females in these age groups living above the poverty line.
| Age Bracket | Male | Female |
| Under 5 Years | 1,709 (90.9%) | 1,744 (100.0%) |
| 5 Years | 415 (88.7%) | 135 (100.0%) |
| 6 to 11 Years | 3,034 (97.5%) | 3,259 (98.5%) |
| 12 to 14 Years | 890 (97.4%) | 1,370 (100.0%) |
| 15 Years | 356 (93.9%) | 273 (100.0%) |
| 16 and 17 Years | 606 (100.0%) | 377 (79.0%) |
| 18 to 24 Years | 1,808 (99.9%) | 1,713 (95.2%) |
| 25 to 34 Years | 3,509 (98.3%) | 3,002 (97.7%) |
| 35 to 44 Years | 4,966 (98.7%) | 4,564 (97.5%) |
| 45 to 54 Years | 3,005 (97.7%) | 3,079 (93.2%) |
| 55 to 64 Years | 2,113 (96.5%) | 2,475 (94.1%) |
| 65 to 74 Years | 1,576 (93.2%) | 1,802 (95.2%) |
| 75 Years and over | 969 (100.0%) | 580 (84.2%) |
| Total | 24,956 (97.1%) | 24,373 (96.0%) |
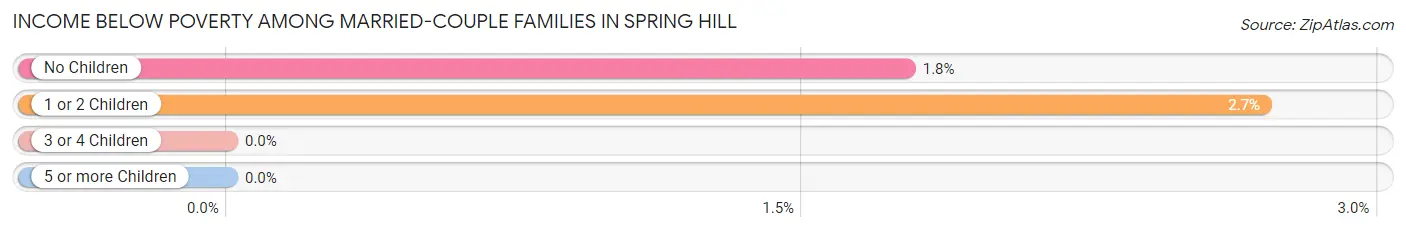
Income Below Poverty Among Married-Couple Families in Spring Hill
The poverty statistics for married-couple families in Spring Hill show that 2.0% or 243 of the total 12,241 families live below the poverty line. Families with 1 or 2 children have the highest poverty rate of 2.7%, comprising of 138 families. On the other hand, families with 3 or 4 children have the lowest poverty rate of 0.0%, which includes 0 families.
| Children | Above Poverty | Below Poverty |
| No Children | 5,828 (98.2%) | 105 (1.8%) |
| 1 or 2 Children | 4,977 (97.3%) | 138 (2.7%) |
| 3 or 4 Children | 1,188 (100.0%) | 0 (0.0%) |
| 5 or more Children | 5 (100.0%) | 0 (0.0%) |
| Total | 11,998 (98.0%) | 243 (2.0%) |
Income Below Poverty Among Single-Parent Households in Spring Hill
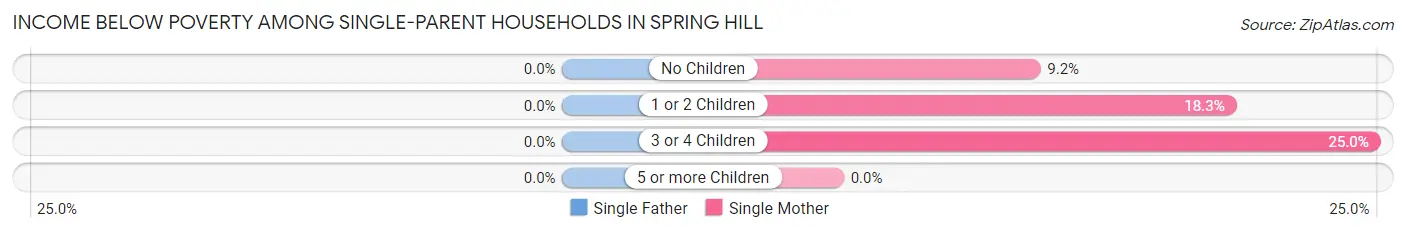
| Children | Single Father | Single Mother |
| No Children | 0 (0.0%) | 48 (9.2%) |
| 1 or 2 Children | 0 (0.0%) | 163 (18.3%) |
| 3 or 4 Children | 0 (0.0%) | 26 (25.0%) |
| 5 or more Children | 0 (0.0%) | 0 (0.0%) |
| Total | 0 (0.0%) | 237 (15.6%) |
Income Below Poverty Among Married-Couple vs Single-Parent Households in Spring Hill
The poverty data for Spring Hill shows that 243 of the married-couple family households (2.0%) and 237 of the single-parent households (10.0%) are living below the poverty level. Within the married-couple family households, those with 1 or 2 children have the highest poverty rate, with 138 households (2.7%) falling below the poverty line. Among the single-parent households, those with 1 or 2 children have the highest poverty rate, with 163 household (12.8%) living below poverty.
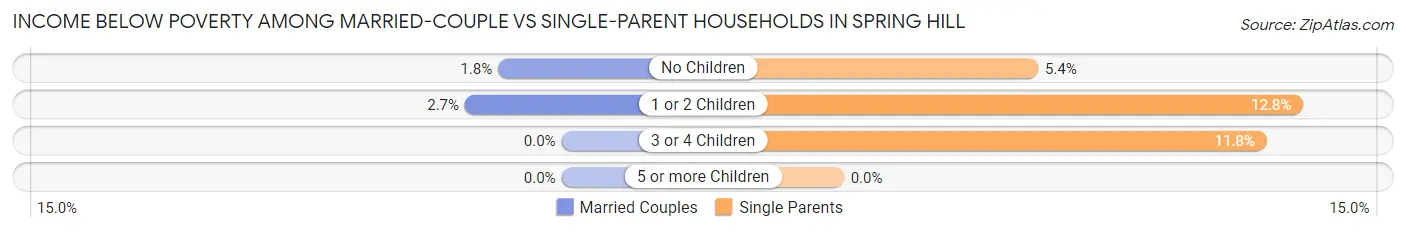
| Children | Married-Couple Families | Single-Parent Households |
| No Children | 105 (1.8%) | 48 (5.4%) |
| 1 or 2 Children | 138 (2.7%) | 163 (12.8%) |
| 3 or 4 Children | 0 (0.0%) | 26 (11.8%) |
| 5 or more Children | 0 (0.0%) | 0 (0.0%) |
| Total | 243 (2.0%) | 237 (10.0%) |
Race in Spring Hill
The most populous races in Spring Hill are White / Caucasian (44,434 | 86.6%), Hispanic or Latino (3,878 | 7.6%), and Two or more Races (3,129 | 6.1%).
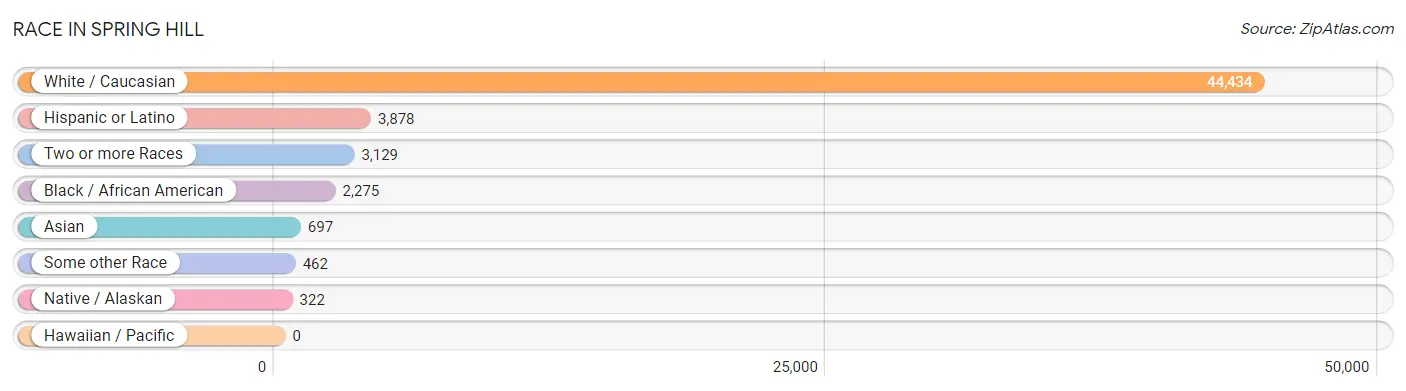
| Race | # Population | % Population |
| Asian | 697 | 1.4% |
| Black / African American | 2,275 | 4.4% |
| Hawaiian / Pacific | 0 | 0.0% |
| Hispanic or Latino | 3,878 | 7.6% |
| Native / Alaskan | 322 | 0.6% |
| White / Caucasian | 44,434 | 86.6% |
| Two or more Races | 3,129 | 6.1% |
| Some other Race | 462 | 0.9% |
| Total | 51,319 | 100.0% |
Ancestry in Spring Hill
The most populous ancestries reported in Spring Hill are English (6,769 | 13.2%), German (6,666 | 13.0%), Irish (5,408 | 10.5%), American (5,253 | 10.2%), and Mexican (2,090 | 4.1%), together accounting for 51.0% of all Spring Hill residents.
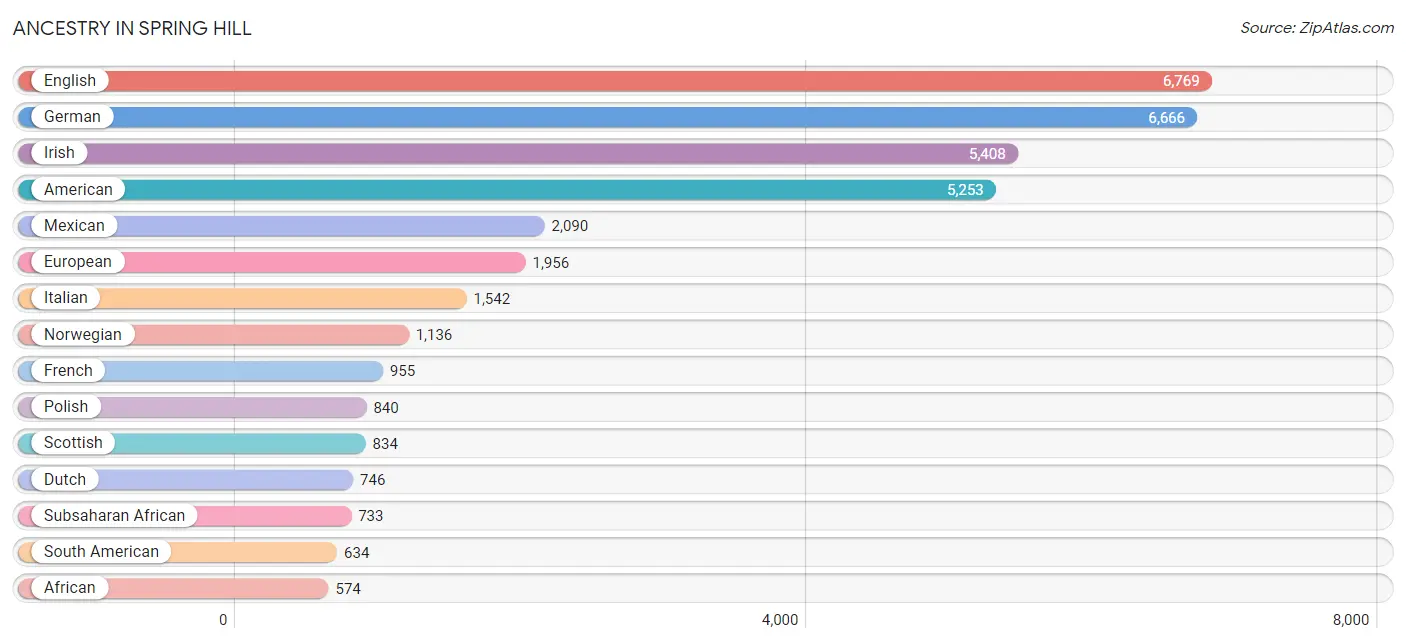
| Ancestry | # Population | % Population |
| African | 574 | 1.1% |
| Aleut | 38 | 0.1% |
| American | 5,253 | 10.2% |
| Arab | 455 | 0.9% |
| Austrian | 26 | 0.1% |
| Belgian | 42 | 0.1% |
| Bhutanese | 25 | 0.1% |
| British | 542 | 1.1% |
| Burmese | 25 | 0.1% |
| Canadian | 324 | 0.6% |
| Central American | 284 | 0.5% |
| Cherokee | 212 | 0.4% |
| Choctaw | 13 | 0.0% |
| Colombian | 480 | 0.9% |
| Comanche | 44 | 0.1% |
| Croatian | 59 | 0.1% |
| Cuban | 199 | 0.4% |
| Czech | 114 | 0.2% |
| Czechoslovakian | 192 | 0.4% |
| Danish | 64 | 0.1% |
| Dominican | 8 | 0.0% |
| Dutch | 746 | 1.5% |
| Eastern European | 33 | 0.1% |
| English | 6,769 | 13.2% |
| European | 1,956 | 3.8% |
| Finnish | 229 | 0.4% |
| French | 955 | 1.9% |
| French Canadian | 130 | 0.3% |
| German | 6,666 | 13.0% |
| Greek | 265 | 0.5% |
| Honduran | 225 | 0.4% |
| Hungarian | 73 | 0.1% |
| Icelander | 67 | 0.1% |
| Indian (Asian) | 359 | 0.7% |
| Iraqi | 175 | 0.3% |
| Irish | 5,408 | 10.5% |
| Italian | 1,542 | 3.0% |
| Korean | 361 | 0.7% |
| Lebanese | 273 | 0.5% |
| Lithuanian | 69 | 0.1% |
| Macedonian | 71 | 0.1% |
| Mexican | 2,090 | 4.1% |
| Mexican American Indian | 27 | 0.1% |
| Nigerian | 43 | 0.1% |
| Northern European | 368 | 0.7% |
| Norwegian | 1,136 | 2.2% |
| Pennsylvania German | 15 | 0.0% |
| Polish | 840 | 1.6% |
| Portuguese | 86 | 0.2% |
| Puerto Rican | 518 | 1.0% |
| Russian | 127 | 0.3% |
| Salvadoran | 59 | 0.1% |
| Scandinavian | 90 | 0.2% |
| Scotch-Irish | 453 | 0.9% |
| Scottish | 834 | 1.6% |
| Slavic | 30 | 0.1% |
| South African | 116 | 0.2% |
| South American | 634 | 1.2% |
| Spaniard | 91 | 0.2% |
| Spanish | 54 | 0.1% |
| Subsaharan African | 733 | 1.4% |
| Swedish | 345 | 0.7% |
| Swiss | 91 | 0.2% |
| Thai | 245 | 0.5% |
| Ukrainian | 126 | 0.3% |
| Venezuelan | 154 | 0.3% |
| Welsh | 466 | 0.9% | View All 67 Rows |
Immigrants in Spring Hill
The most numerous immigrant groups reported in Spring Hill came from Latin America (1,386 | 2.7%), Central America (1,112 | 2.2%), Mexico (887 | 1.7%), Asia (436 | 0.9%), and Europe (323 | 0.6%), together accounting for 8.1% of all Spring Hill residents.
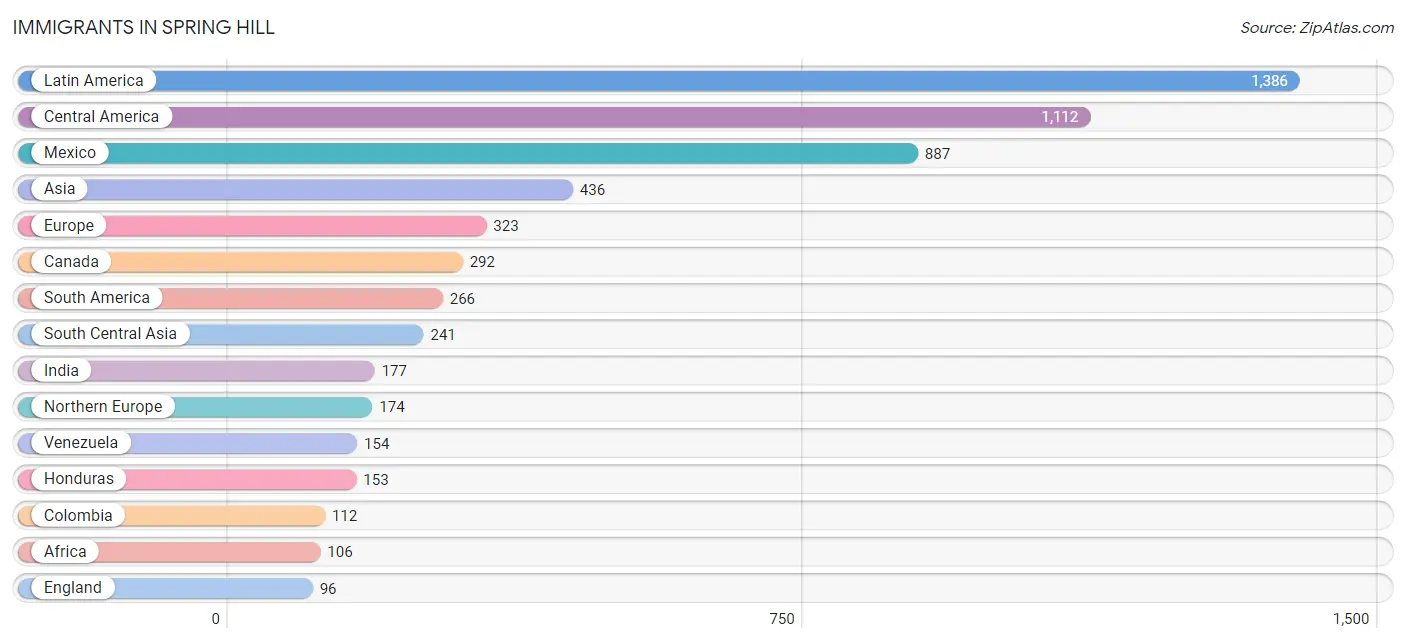
| Immigration Origin | # Population | % Population |
| Africa | 106 | 0.2% |
| Asia | 436 | 0.9% |
| Canada | 292 | 0.6% |
| Caribbean | 8 | 0.0% |
| Central America | 1,112 | 2.2% |
| China | 41 | 0.1% |
| Colombia | 112 | 0.2% |
| Dominican Republic | 8 | 0.0% |
| Eastern Africa | 26 | 0.1% |
| Eastern Asia | 66 | 0.1% |
| Eastern Europe | 71 | 0.1% |
| England | 96 | 0.2% |
| Europe | 323 | 0.6% |
| Germany | 41 | 0.1% |
| Guatemala | 72 | 0.1% |
| Honduras | 153 | 0.3% |
| India | 177 | 0.3% |
| Iraq | 95 | 0.2% |
| Italy | 17 | 0.0% |
| Kenya | 26 | 0.1% |
| Korea | 25 | 0.1% |
| Latin America | 1,386 | 2.7% |
| Malaysia | 27 | 0.1% |
| Mexico | 887 | 1.7% |
| Netherlands | 20 | 0.0% |
| Northern Europe | 174 | 0.3% |
| Pakistan | 64 | 0.1% |
| South America | 266 | 0.5% |
| South Central Asia | 241 | 0.5% |
| South Eastern Asia | 27 | 0.1% |
| Southern Europe | 17 | 0.0% |
| Venezuela | 154 | 0.3% |
| Western Africa | 80 | 0.2% |
| Western Asia | 95 | 0.2% |
| Western Europe | 61 | 0.1% | View All 35 Rows |
Sex and Age in Spring Hill
Sex and Age in Spring Hill
The most populous age groups in Spring Hill are 5 to 9 Years (3,114 | 12.0%) for men and 5 to 9 Years (2,617 | 10.3%) for women.
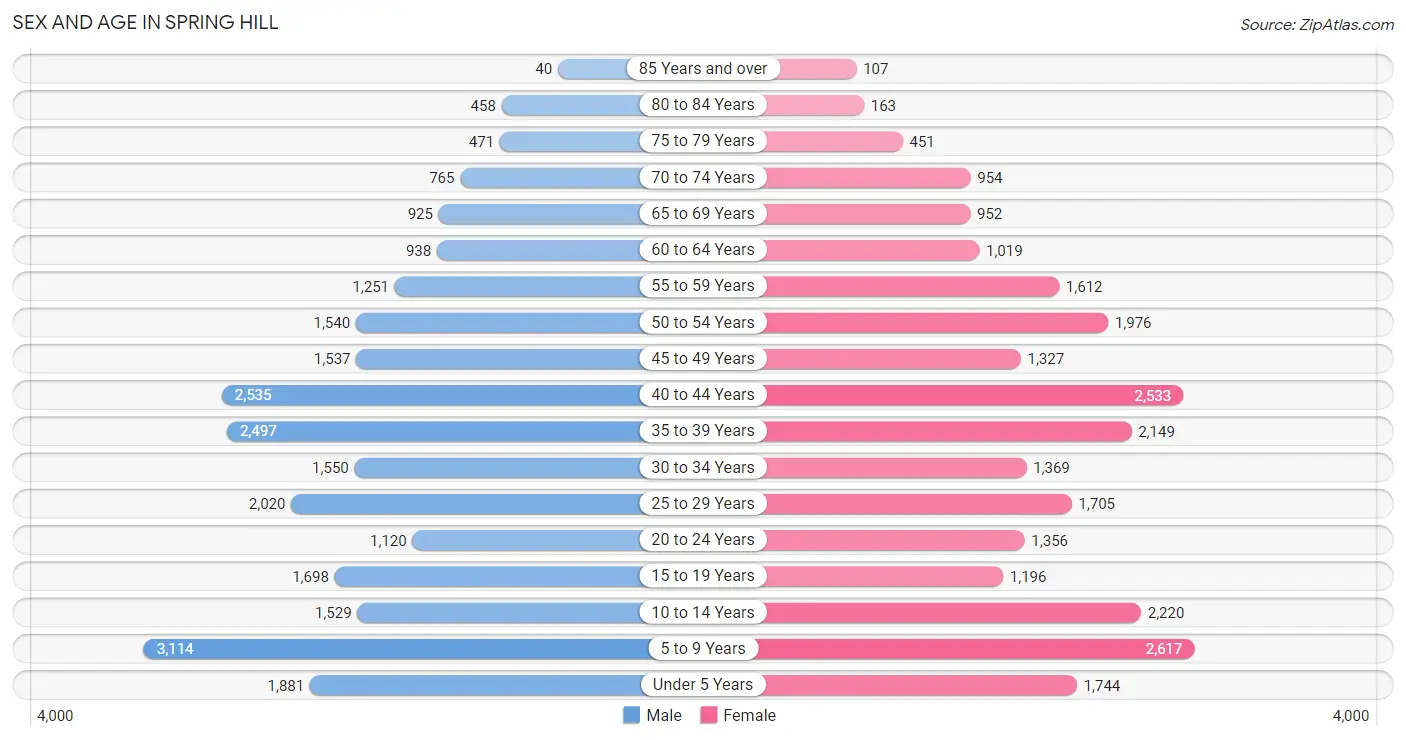
| Age Bracket | Male | Female |
| Under 5 Years | 1,881 (7.3%) | 1,744 (6.9%) |
| 5 to 9 Years | 3,114 (12.0%) | 2,617 (10.3%) |
| 10 to 14 Years | 1,529 (5.9%) | 2,220 (8.7%) |
| 15 to 19 Years | 1,698 (6.6%) | 1,196 (4.7%) |
| 20 to 24 Years | 1,120 (4.3%) | 1,356 (5.3%) |
| 25 to 29 Years | 2,020 (7.8%) | 1,705 (6.7%) |
| 30 to 34 Years | 1,550 (6.0%) | 1,369 (5.4%) |
| 35 to 39 Years | 2,497 (9.7%) | 2,149 (8.4%) |
| 40 to 44 Years | 2,535 (9.8%) | 2,533 (10.0%) |
| 45 to 49 Years | 1,537 (5.9%) | 1,327 (5.2%) |
| 50 to 54 Years | 1,540 (5.9%) | 1,976 (7.8%) |
| 55 to 59 Years | 1,251 (4.8%) | 1,612 (6.3%) |
| 60 to 64 Years | 938 (3.6%) | 1,019 (4.0%) |
| 65 to 69 Years | 925 (3.6%) | 952 (3.7%) |
| 70 to 74 Years | 765 (3.0%) | 954 (3.7%) |
| 75 to 79 Years | 471 (1.8%) | 451 (1.8%) |
| 80 to 84 Years | 458 (1.8%) | 163 (0.6%) |
| 85 Years and over | 40 (0.2%) | 107 (0.4%) |
| Total | 25,869 (100.0%) | 25,450 (100.0%) |
Families and Households in Spring Hill
Median Family Size in Spring Hill
The median family size in Spring Hill is 3.19 persons per family, with married-couple families (12,241 | 83.8%) accounting for the largest median family size of 3.29 persons per family. On the other hand, single male/father families (854 | 5.8%) represent the smallest median family size with 2.41 persons per family.
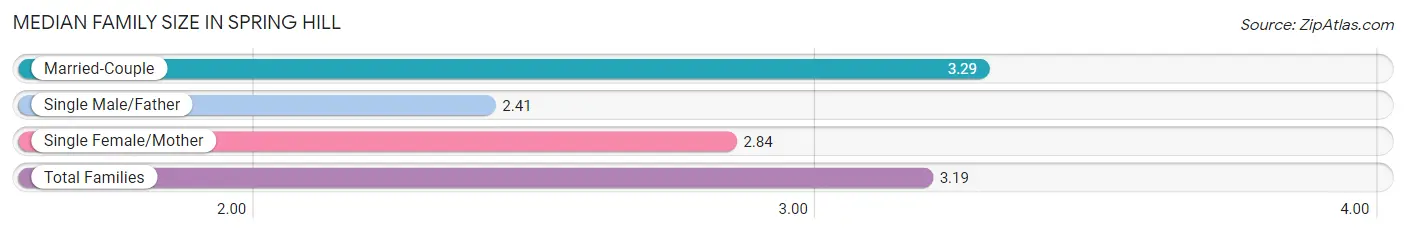
| Family Type | # Families | Family Size |
| Married-Couple | 12,241 (83.8%) | 3.29 |
| Single Male/Father | 854 (5.8%) | 2.41 |
| Single Female/Mother | 1,519 (10.4%) | 2.84 |
| Total Families | 14,614 (100.0%) | 3.19 |
Median Household Size in Spring Hill
The median household size in Spring Hill is 2.87 persons per household, with married-couple households (12,241 | 68.5%) accounting for the largest median household size of 3.3 persons per household. non-family households (3,253 | 18.2%) represent the smallest median household size with 1.27 persons per household.
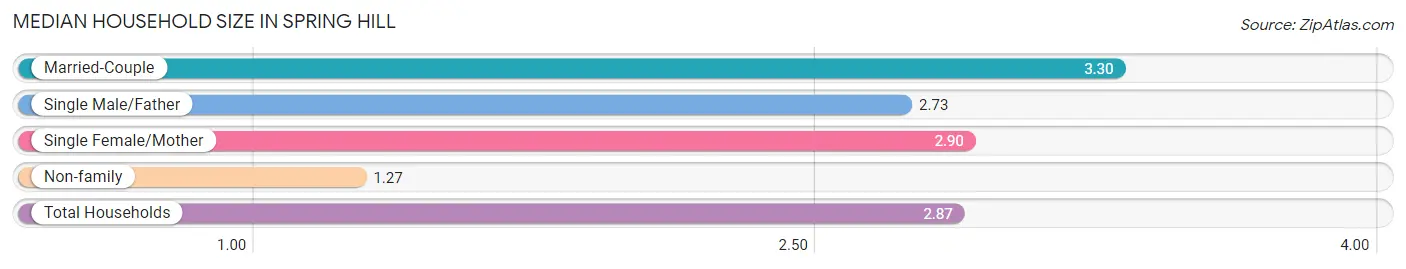
| Household Type | # Households | Household Size |
| Married-Couple | 12,241 (68.5%) | 3.30 |
| Single Male/Father | 854 (4.8%) | 2.73 |
| Single Female/Mother | 1,519 (8.5%) | 2.90 |
| Non-family | 3,253 (18.2%) | 1.27 |
| Total Households | 17,867 (100.0%) | 2.87 |
Household Size by Marriage Status in Spring Hill
Out of a total of 17,867 households in Spring Hill, 14,614 (81.8%) are family households, while 3,253 (18.2%) are nonfamily households. The most numerous type of family households are 2-person households, comprising 5,945, and the most common type of nonfamily households are 1-person households, comprising 2,786.
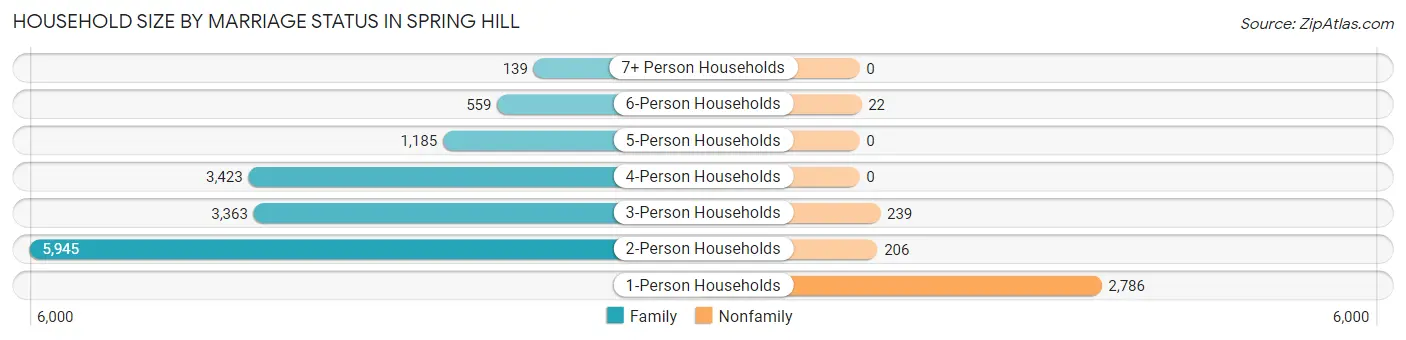
| Household Size | Family Households | Nonfamily Households |
| 1-Person Households | - | 2,786 (15.6%) |
| 2-Person Households | 5,945 (33.3%) | 206 (1.1%) |
| 3-Person Households | 3,363 (18.8%) | 239 (1.3%) |
| 4-Person Households | 3,423 (19.2%) | 0 (0.0%) |
| 5-Person Households | 1,185 (6.6%) | 0 (0.0%) |
| 6-Person Households | 559 (3.1%) | 22 (0.1%) |
| 7+ Person Households | 139 (0.8%) | 0 (0.0%) |
| Total | 14,614 (81.8%) | 3,253 (18.2%) |
Female Fertility in Spring Hill
Fertility by Age in Spring Hill
Average fertility rate in Spring Hill is 98.0 births per 1,000 women. Women in the age bracket of 20 to 34 years have the highest fertility rate with 172.0 births per 1,000 women. Women in the age bracket of 20 to 34 years acount for 65.3% of all women with births.
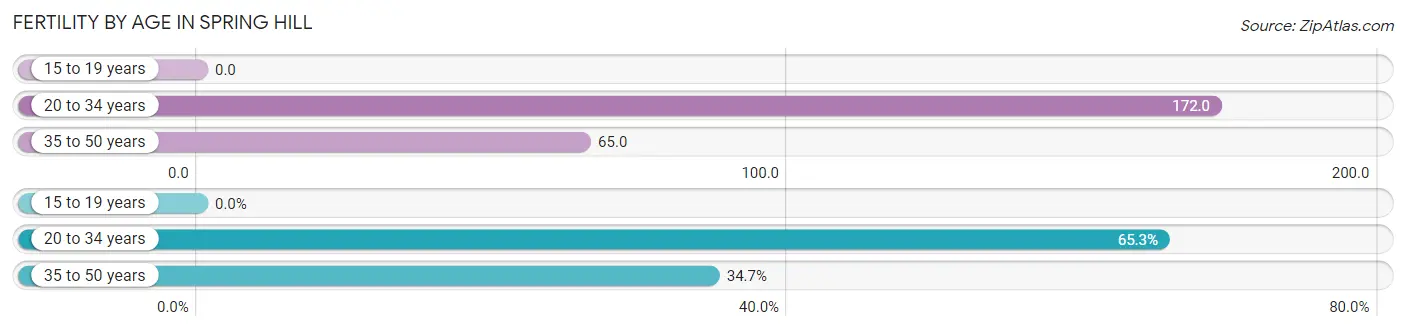
| Age Bracket | Women with Births | Births / 1,000 Women |
| 15 to 19 years | 0 (0.0%) | 0.0 |
| 20 to 34 years | 763 (65.3%) | 172.0 |
| 35 to 50 years | 406 (34.7%) | 65.0 |
| Total | 1,169 (100.0%) | 98.0 |
Fertility by Age by Marriage Status in Spring Hill
97.9% of women with births (1,169) in Spring Hill are married. The highest percentage of unmarried women with births falls into 20 to 34 years age bracket with 3.3% of them unmarried at the time of birth, while the lowest percentage of unmarried women with births belong to 35 to 50 years age bracket with 0.0% of them unmarried.
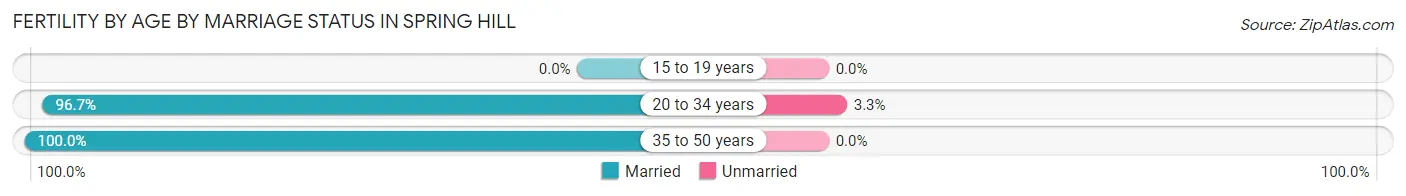
| Age Bracket | Married | Unmarried |
| 15 to 19 years | 0 (0.0%) | 0 (0.0%) |
| 20 to 34 years | 738 (96.7%) | 25 (3.3%) |
| 35 to 50 years | 406 (100.0%) | 0 (0.0%) |
| Total | 1,144 (97.9%) | 25 (2.1%) |
Fertility by Education in Spring Hill
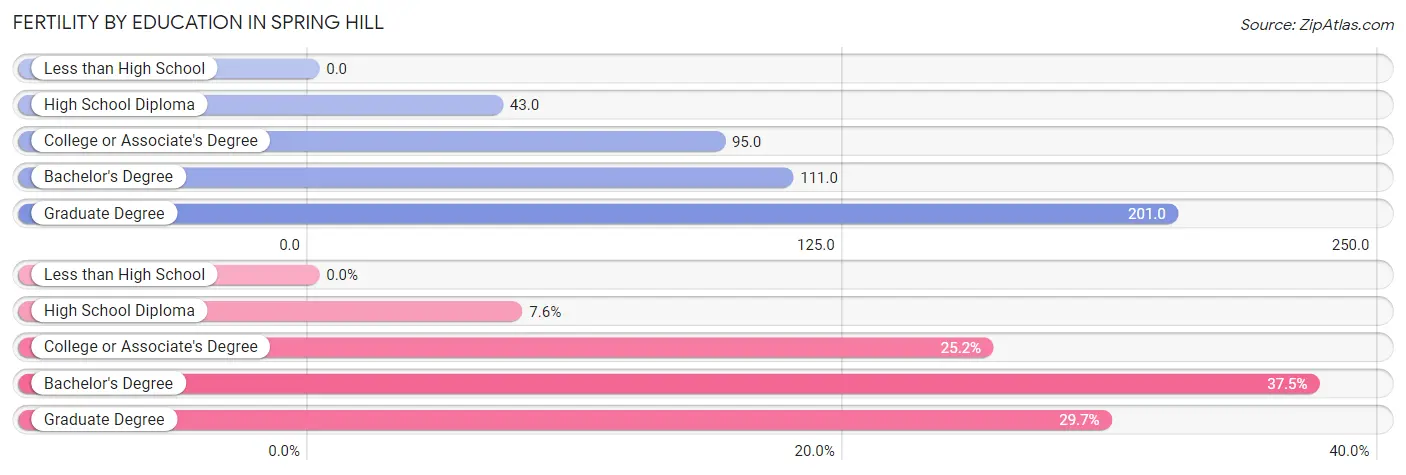
| Educational Attainment | Women with Births | Births / 1,000 Women |
| Less than High School | 0 (0.0%) | 0.0 |
| High School Diploma | 89 (7.6%) | 43.0 |
| College or Associate's Degree | 295 (25.2%) | 95.0 |
| Bachelor's Degree | 438 (37.5%) | 111.0 |
| Graduate Degree | 347 (29.7%) | 201.0 |
| Total | 1,169 (100.0%) | 98.0 |
Fertility by Education by Marriage Status in Spring Hill
2.1% of women with births in Spring Hill are unmarried. Women with the educational attainment of college or associate's degree are most likely to be married with 100.0% of them married at childbirth, while women with the educational attainment of high school diploma are least likely to be married with 28.1% of them unmarried at childbirth.
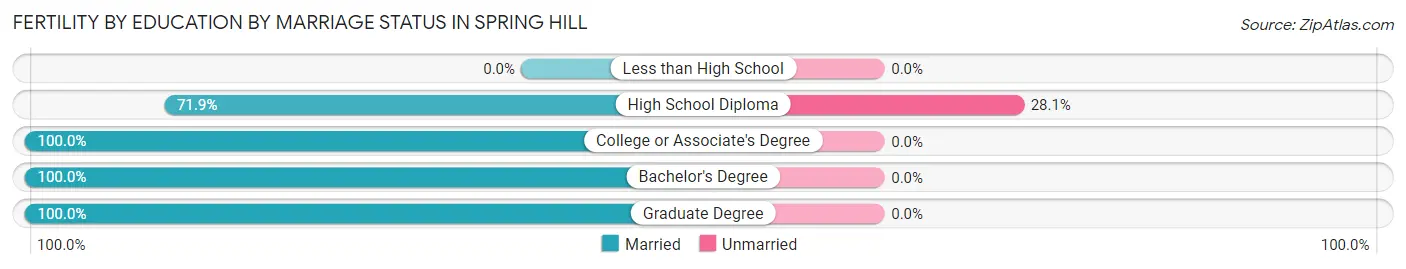
| Educational Attainment | Married | Unmarried |
| Less than High School | 0 (0.0%) | 0 (0.0%) |
| High School Diploma | 64 (71.9%) | 25 (28.1%) |
| College or Associate's Degree | 295 (100.0%) | 0 (0.0%) |
| Bachelor's Degree | 438 (100.0%) | 0 (0.0%) |
| Graduate Degree | 347 (100.0%) | 0 (0.0%) |
| Total | 1,144 (97.9%) | 25 (2.1%) |
Employment Characteristics in Spring Hill
Employment by Class of Employer in Spring Hill
Among the 26,547 employed individuals in Spring Hill, private company employees (19,327 | 72.8%), local government employees (2,066 | 7.8%), and self-employed (not incorporated) (1,580 | 5.9%) make up the most common classes of employment.
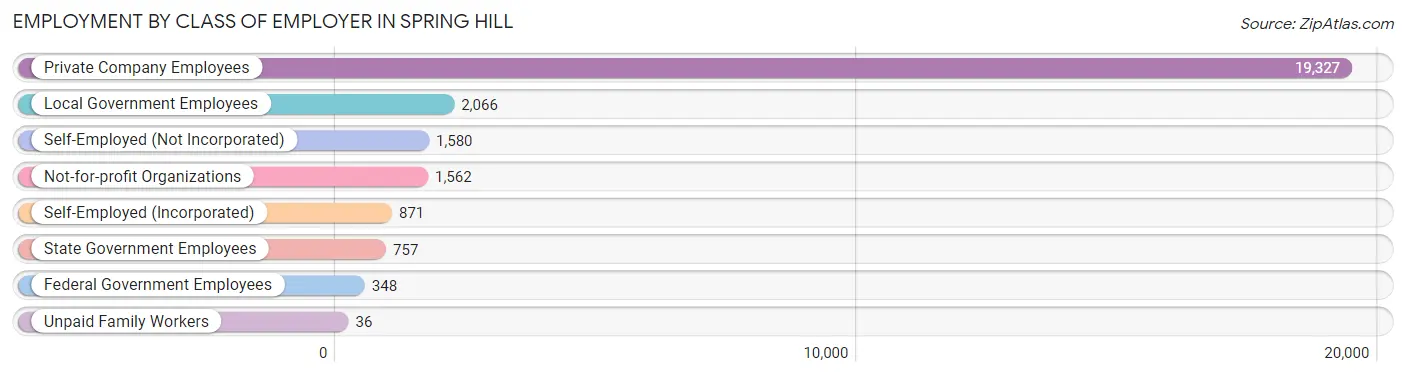
| Employer Class | # Employees | % Employees |
| Private Company Employees | 19,327 | 72.8% |
| Self-Employed (Incorporated) | 871 | 3.3% |
| Self-Employed (Not Incorporated) | 1,580 | 5.9% |
| Not-for-profit Organizations | 1,562 | 5.9% |
| Local Government Employees | 2,066 | 7.8% |
| State Government Employees | 757 | 2.9% |
| Federal Government Employees | 348 | 1.3% |
| Unpaid Family Workers | 36 | 0.1% |
| Total | 26,547 | 100.0% |
Employment Status by Age in Spring Hill
According to the labor force statistics for Spring Hill, out of the total population over 16 years of age (37,557), 72.7% or 27,304 individuals are in the labor force, with 1.1% or 300 of them unemployed. The age group with the highest labor force participation rate is 35 to 44 years, with 88.1% or 8,558 individuals in the labor force. Within the labor force, the 65 to 74 years age range has the highest percentage of unemployed individuals, with 4.0% or 25 of them being unemployed.
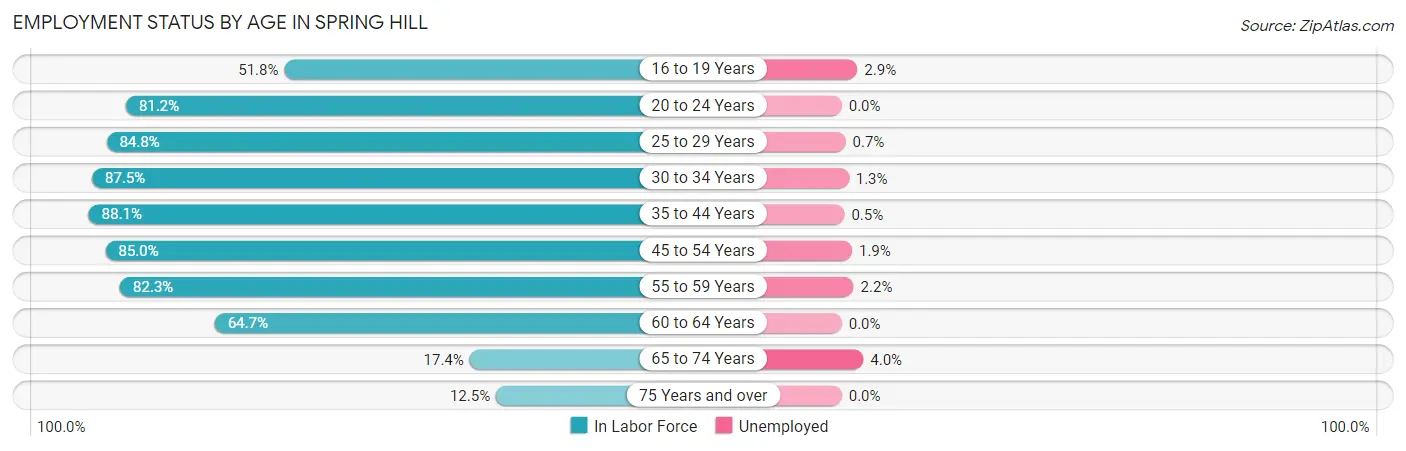
| Age Bracket | In Labor Force | Unemployed |
| 16 to 19 Years | 1,159 (51.8%) | 34 (2.9%) |
| 20 to 24 Years | 2,011 (81.2%) | 0 (0.0%) |
| 25 to 29 Years | 3,159 (84.8%) | 22 (0.7%) |
| 30 to 34 Years | 2,554 (87.5%) | 33 (1.3%) |
| 35 to 44 Years | 8,558 (88.1%) | 43 (0.5%) |
| 45 to 54 Years | 5,423 (85.0%) | 103 (1.9%) |
| 55 to 59 Years | 2,356 (82.3%) | 52 (2.2%) |
| 60 to 64 Years | 1,266 (64.7%) | 0 (0.0%) |
| 65 to 74 Years | 626 (17.4%) | 25 (4.0%) |
| 75 Years and over | 211 (12.5%) | 0 (0.0%) |
| Total | 27,304 (72.7%) | 300 (1.1%) |
Employment Status by Educational Attainment in Spring Hill
According to labor force statistics for Spring Hill, 84.6% of individuals (23,314) out of the total population between 25 and 64 years of age (27,558) are in the labor force, with 1.1% or 256 of them being unemployed. The group with the highest labor force participation rate are those with the educational attainment of bachelor's degree or higher, with 86.8% or 12,083 individuals in the labor force. Within the labor force, individuals with less than high school education have the highest percentage of unemployment, with 7.2% or 53 of them being unemployed.
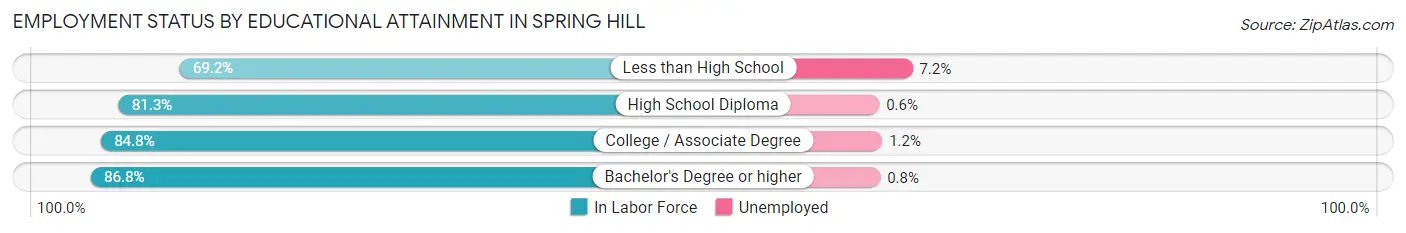
| Educational Attainment | In Labor Force | Unemployed |
| Less than High School | 733 (69.2%) | 76 (7.2%) |
| High School Diploma | 3,947 (81.3%) | 29 (0.6%) |
| College / Associate Degree | 6,549 (84.8%) | 93 (1.2%) |
| Bachelor's Degree or higher | 12,083 (86.8%) | 111 (0.8%) |
| Total | 23,314 (84.6%) | 303 (1.1%) |
Employment Occupations by Sex in Spring Hill
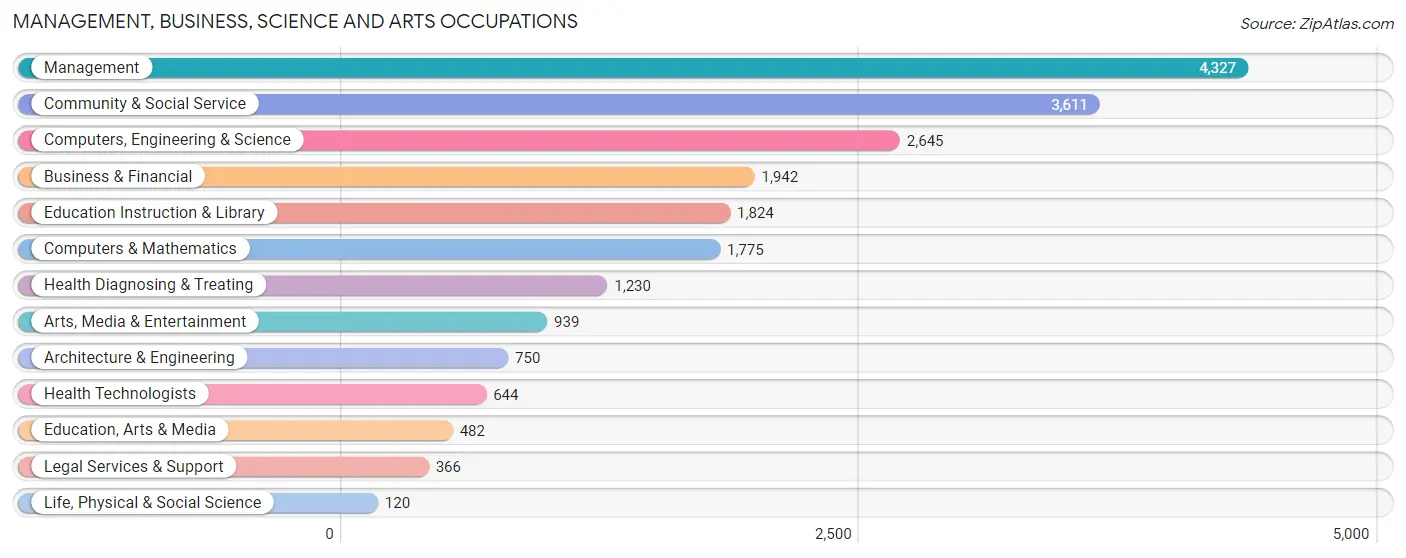
Management, Business, Science and Arts Occupations
The most common Management, Business, Science and Arts occupations in Spring Hill are Management (4,327 | 16.0%), Community & Social Service (3,611 | 13.4%), Computers, Engineering & Science (2,645 | 9.8%), Business & Financial (1,942 | 7.2%), and Education Instruction & Library (1,824 | 6.8%).
Management, Business, Science and Arts Occupations by Sex
Within the Management, Business, Science and Arts occupations in Spring Hill, the most male-oriented occupations are Architecture & Engineering (98.9%), Legal Services & Support (90.4%), and Arts, Media & Entertainment (88.3%), while the most female-oriented occupations are Health Technologists (83.4%), Education Instruction & Library (79.9%), and Health Diagnosing & Treating (76.3%).
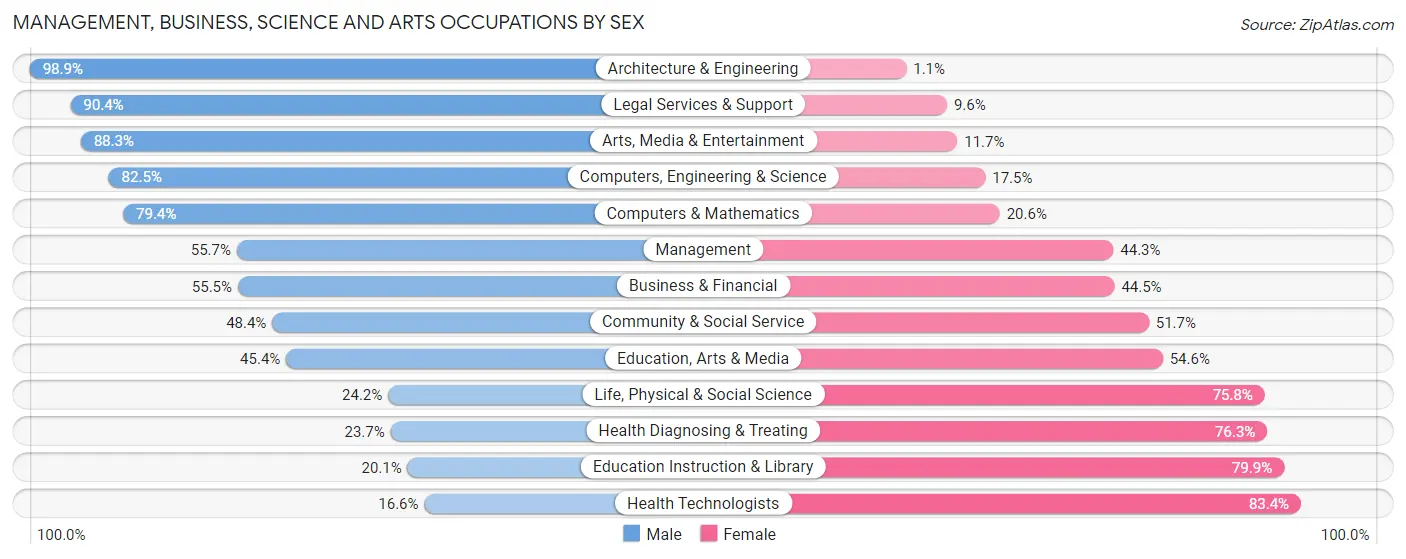
| Occupation | Male | Female |
| Management | 2,412 (55.7%) | 1,915 (44.3%) |
| Business & Financial | 1,078 (55.5%) | 864 (44.5%) |
| Computers, Engineering & Science | 2,181 (82.5%) | 464 (17.5%) |
| Computers & Mathematics | 1,410 (79.4%) | 365 (20.6%) |
| Architecture & Engineering | 742 (98.9%) | 8 (1.1%) |
| Life, Physical & Social Science | 29 (24.2%) | 91 (75.8%) |
| Community & Social Service | 1,746 (48.3%) | 1,865 (51.6%) |
| Education, Arts & Media | 219 (45.4%) | 263 (54.6%) |
| Legal Services & Support | 331 (90.4%) | 35 (9.6%) |
| Education Instruction & Library | 367 (20.1%) | 1,457 (79.9%) |
| Arts, Media & Entertainment | 829 (88.3%) | 110 (11.7%) |
| Health Diagnosing & Treating | 291 (23.7%) | 939 (76.3%) |
| Health Technologists | 107 (16.6%) | 537 (83.4%) |
| Total (Category) | 7,708 (56.0%) | 6,047 (44.0%) |
| Total (Overall) | 14,910 (55.2%) | 12,095 (44.8%) |
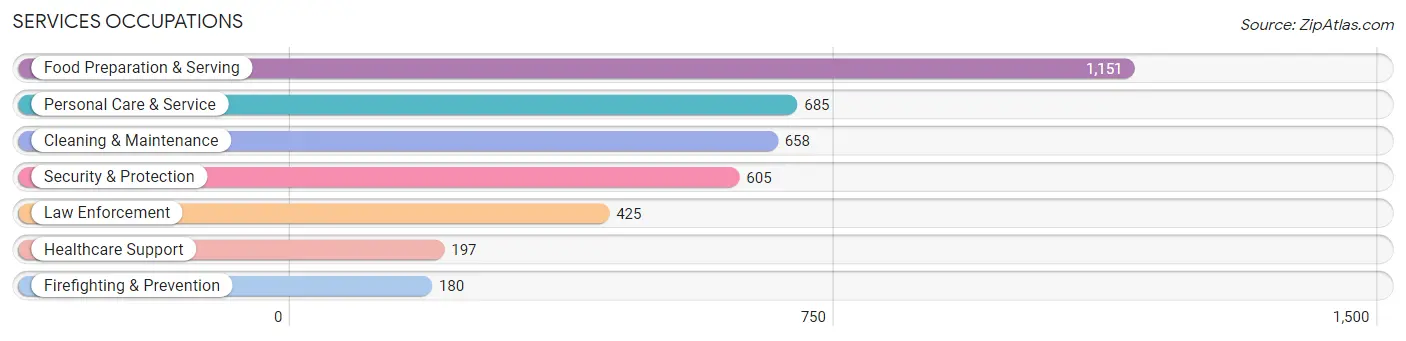
Services Occupations
The most common Services occupations in Spring Hill are Food Preparation & Serving (1,151 | 4.3%), Personal Care & Service (685 | 2.5%), Cleaning & Maintenance (658 | 2.4%), Security & Protection (605 | 2.2%), and Law Enforcement (425 | 1.6%).
Services Occupations by Sex
Within the Services occupations in Spring Hill, the most male-oriented occupations are Law Enforcement (100.0%), Security & Protection (95.5%), and Firefighting & Prevention (85.0%), while the most female-oriented occupations are Healthcare Support (98.0%), Personal Care & Service (72.3%), and Food Preparation & Serving (68.3%).
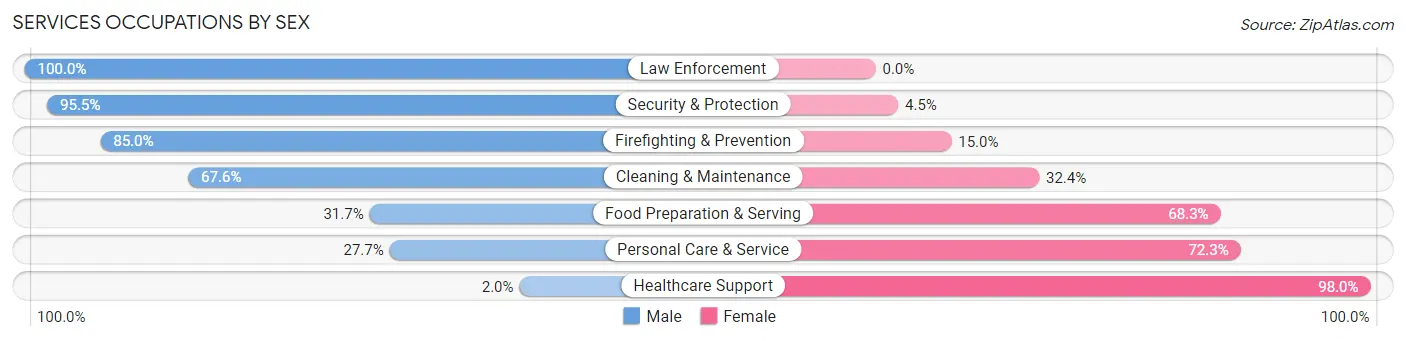
| Occupation | Male | Female |
| Healthcare Support | 4 (2.0%) | 193 (98.0%) |
| Security & Protection | 578 (95.5%) | 27 (4.5%) |
| Firefighting & Prevention | 153 (85.0%) | 27 (15.0%) |
| Law Enforcement | 425 (100.0%) | 0 (0.0%) |
| Food Preparation & Serving | 365 (31.7%) | 786 (68.3%) |
| Cleaning & Maintenance | 445 (67.6%) | 213 (32.4%) |
| Personal Care & Service | 190 (27.7%) | 495 (72.3%) |
| Total (Category) | 1,582 (48.0%) | 1,714 (52.0%) |
| Total (Overall) | 14,910 (55.2%) | 12,095 (44.8%) |
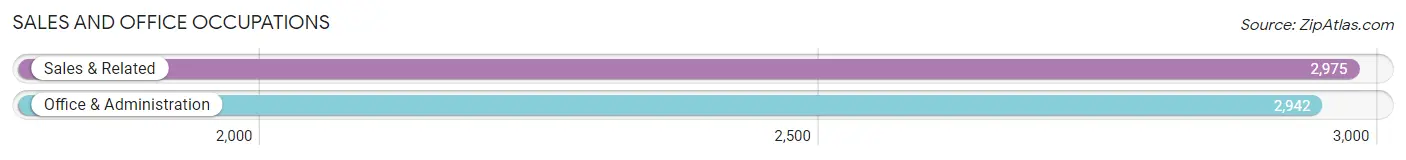
Sales and Office Occupations
The most common Sales and Office occupations in Spring Hill are Sales & Related (2,975 | 11.0%), and Office & Administration (2,942 | 10.9%).
Sales and Office Occupations by Sex
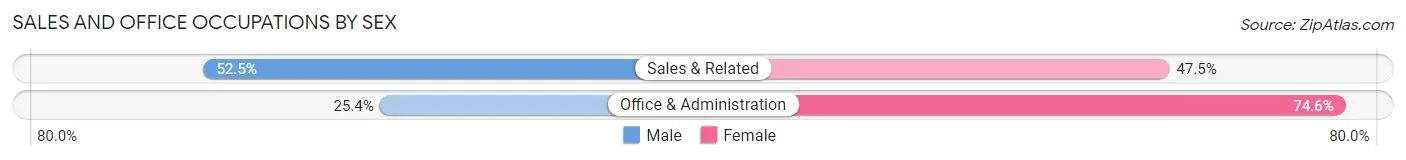
| Occupation | Male | Female |
| Sales & Related | 1,561 (52.5%) | 1,414 (47.5%) |
| Office & Administration | 747 (25.4%) | 2,195 (74.6%) |
| Total (Category) | 2,308 (39.0%) | 3,609 (61.0%) |
| Total (Overall) | 14,910 (55.2%) | 12,095 (44.8%) |
Natural Resources, Construction and Maintenance Occupations
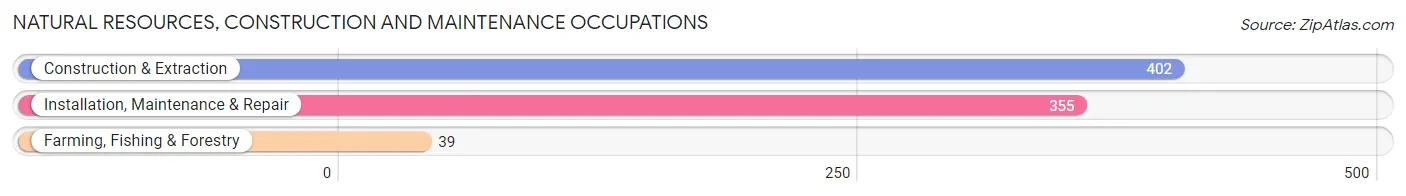
The most common Natural Resources, Construction and Maintenance occupations in Spring Hill are Construction & Extraction (402 | 1.5%), Installation, Maintenance & Repair (355 | 1.3%), and Farming, Fishing & Forestry (39 | 0.1%).
Natural Resources, Construction and Maintenance Occupations by Sex
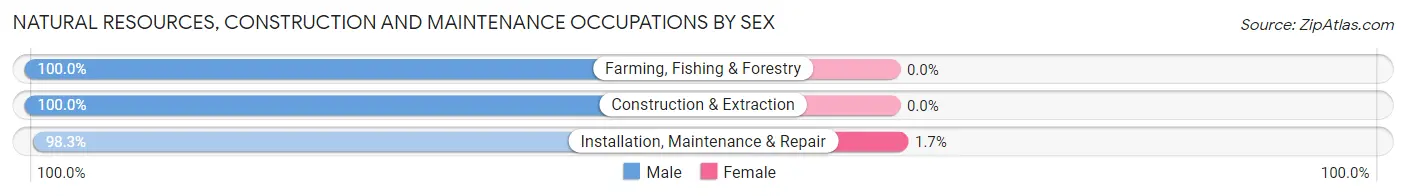
| Occupation | Male | Female |
| Farming, Fishing & Forestry | 39 (100.0%) | 0 (0.0%) |
| Construction & Extraction | 402 (100.0%) | 0 (0.0%) |
| Installation, Maintenance & Repair | 349 (98.3%) | 6 (1.7%) |
| Total (Category) | 790 (99.3%) | 6 (0.7%) |
| Total (Overall) | 14,910 (55.2%) | 12,095 (44.8%) |
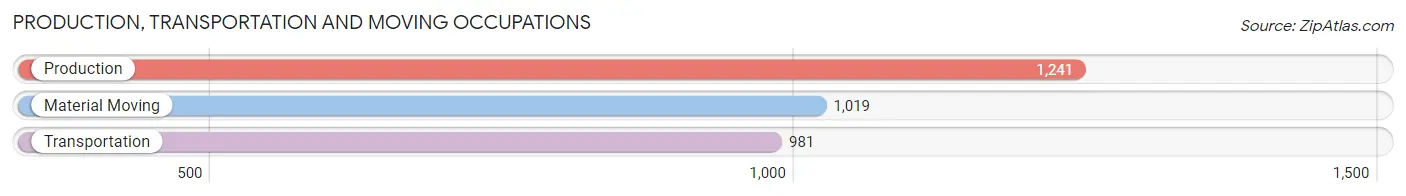
Production, Transportation and Moving Occupations
The most common Production, Transportation and Moving occupations in Spring Hill are Production (1,241 | 4.6%), Material Moving (1,019 | 3.8%), and Transportation (981 | 3.6%).
Production, Transportation and Moving Occupations by Sex
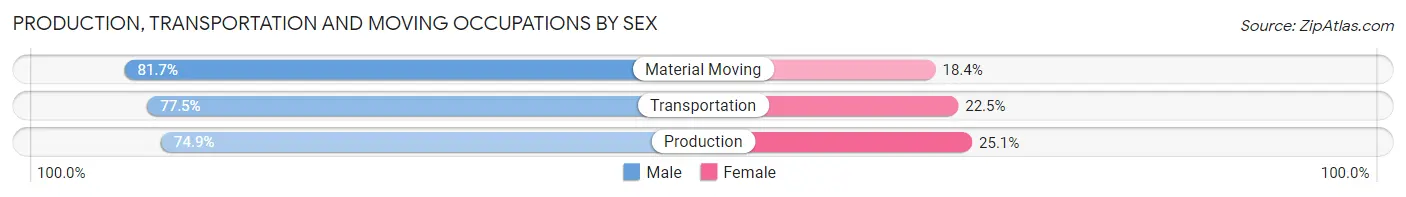
| Occupation | Male | Female |
| Production | 930 (74.9%) | 311 (25.1%) |
| Transportation | 760 (77.5%) | 221 (22.5%) |
| Material Moving | 832 (81.7%) | 187 (18.3%) |
| Total (Category) | 2,522 (77.8%) | 719 (22.2%) |
| Total (Overall) | 14,910 (55.2%) | 12,095 (44.8%) |
Employment Industries by Sex in Spring Hill
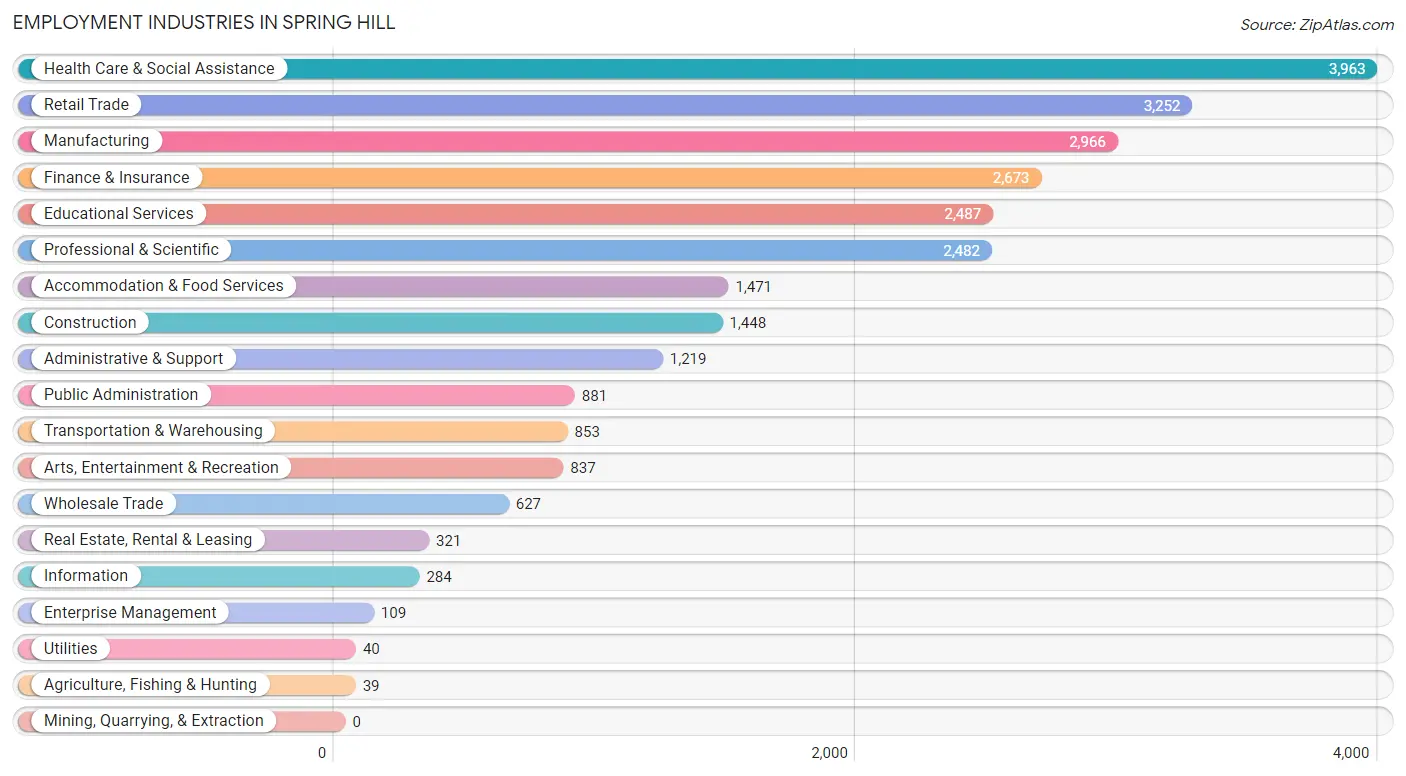
Employment Industries in Spring Hill
The major employment industries in Spring Hill include Health Care & Social Assistance (3,963 | 14.7%), Retail Trade (3,252 | 12.0%), Manufacturing (2,966 | 11.0%), Finance & Insurance (2,673 | 9.9%), and Educational Services (2,487 | 9.2%).
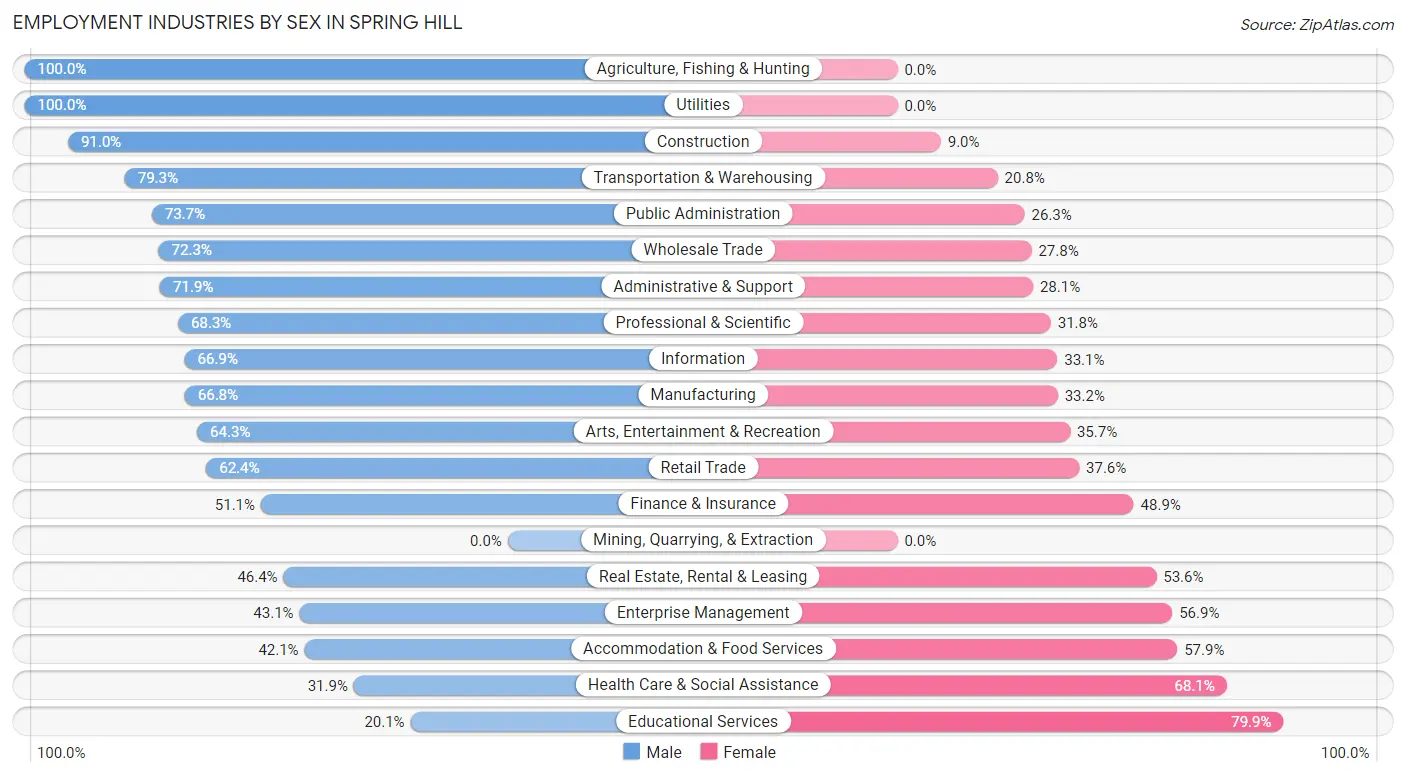
Employment Industries by Sex in Spring Hill
The Spring Hill industries that see more men than women are Agriculture, Fishing & Hunting (100.0%), Utilities (100.0%), and Construction (91.0%), whereas the industries that tend to have a higher number of women are Educational Services (79.9%), Health Care & Social Assistance (68.1%), and Accommodation & Food Services (57.9%).
| Industry | Male | Female |
| Agriculture, Fishing & Hunting | 39 (100.0%) | 0 (0.0%) |
| Mining, Quarrying, & Extraction | 0 (0.0%) | 0 (0.0%) |
| Construction | 1,318 (91.0%) | 130 (9.0%) |
| Manufacturing | 1,982 (66.8%) | 984 (33.2%) |
| Wholesale Trade | 453 (72.3%) | 174 (27.8%) |
| Retail Trade | 2,029 (62.4%) | 1,223 (37.6%) |
| Transportation & Warehousing | 676 (79.2%) | 177 (20.7%) |
| Utilities | 40 (100.0%) | 0 (0.0%) |
| Information | 190 (66.9%) | 94 (33.1%) |
| Finance & Insurance | 1,366 (51.1%) | 1,307 (48.9%) |
| Real Estate, Rental & Leasing | 149 (46.4%) | 172 (53.6%) |
| Professional & Scientific | 1,694 (68.2%) | 788 (31.8%) |
| Enterprise Management | 47 (43.1%) | 62 (56.9%) |
| Administrative & Support | 877 (71.9%) | 342 (28.1%) |
| Educational Services | 501 (20.1%) | 1,986 (79.9%) |
| Health Care & Social Assistance | 1,263 (31.9%) | 2,700 (68.1%) |
| Arts, Entertainment & Recreation | 538 (64.3%) | 299 (35.7%) |
| Accommodation & Food Services | 619 (42.1%) | 852 (57.9%) |
| Public Administration | 649 (73.7%) | 232 (26.3%) |
| Total | 14,910 (55.2%) | 12,095 (44.8%) |
Education in Spring Hill
School Enrollment in Spring Hill
The most common levels of schooling among the 13,728 students in Spring Hill are elementary school (4,691 | 34.2%), middle school (2,855 | 20.8%), and high school (2,559 | 18.6%).
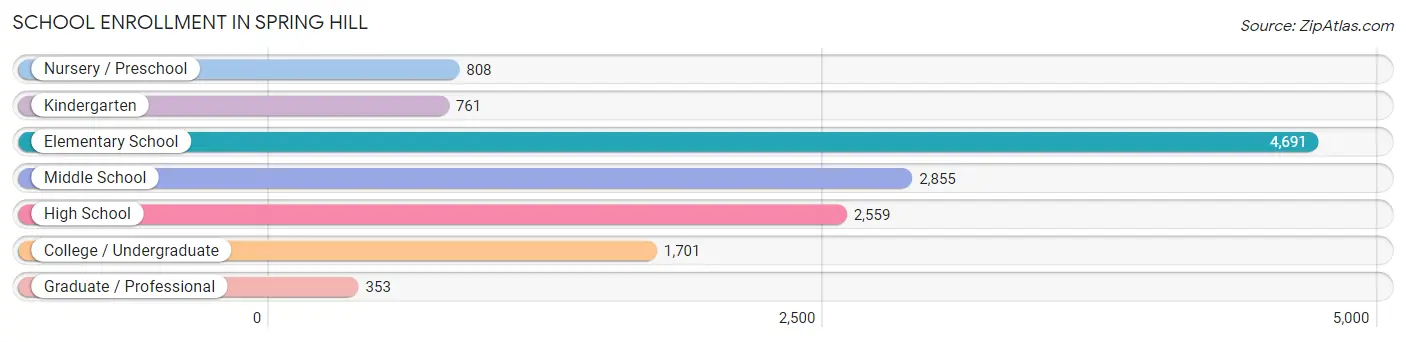
| School Level | # Students | % Students |
| Nursery / Preschool | 808 | 5.9% |
| Kindergarten | 761 | 5.5% |
| Elementary School | 4,691 | 34.2% |
| Middle School | 2,855 | 20.8% |
| High School | 2,559 | 18.6% |
| College / Undergraduate | 1,701 | 12.4% |
| Graduate / Professional | 353 | 2.6% |
| Total | 13,728 | 100.0% |
School Enrollment by Age by Funding Source in Spring Hill
Out of a total of 13,728 students who are enrolled in schools in Spring Hill, 1,743 (12.7%) attend a private institution, while the remaining 11,985 (87.3%) are enrolled in public schools. The age group of 35 years and over has the highest likelihood of being enrolled in private schools, with 223 (42.9% in the age bracket) enrolled. Conversely, the age group of 25 to 34 year olds has the lowest likelihood of being enrolled in a private school, with 124 (100.0% in the age bracket) attending a public institution.
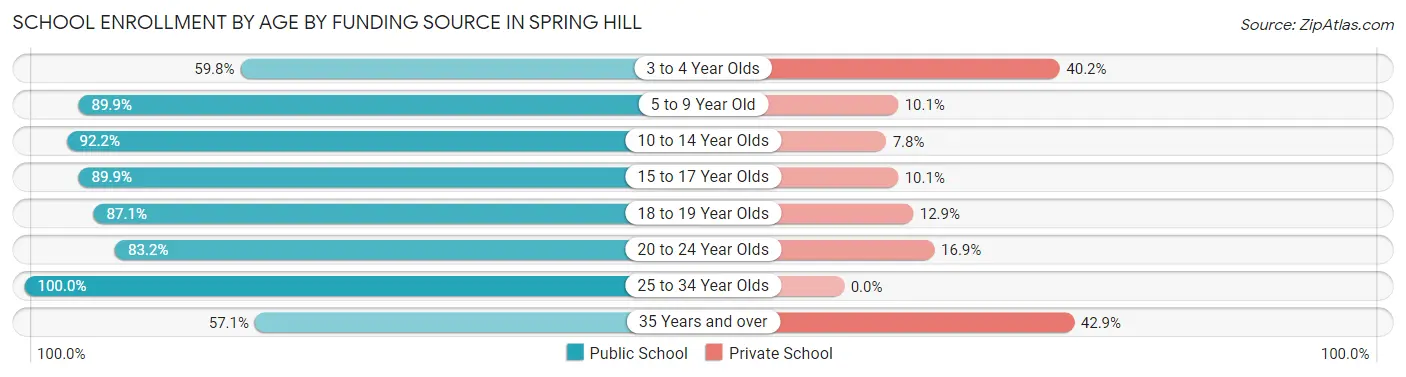
| Age Bracket | Public School | Private School |
| 3 to 4 Year Olds | 408 (59.8%) | 274 (40.2%) |
| 5 to 9 Year Old | 4,790 (89.9%) | 536 (10.1%) |
| 10 to 14 Year Olds | 3,377 (92.2%) | 287 (7.8%) |
| 15 to 17 Year Olds | 1,581 (89.9%) | 177 (10.1%) |
| 18 to 19 Year Olds | 650 (87.1%) | 96 (12.9%) |
| 20 to 24 Year Olds | 755 (83.2%) | 153 (16.9%) |
| 25 to 34 Year Olds | 124 (100.0%) | 0 (0.0%) |
| 35 Years and over | 297 (57.1%) | 223 (42.9%) |
| Total | 11,985 (87.3%) | 1,743 (12.7%) |
Educational Attainment by Field of Study in Spring Hill
Business (4,411 | 25.6%), education (2,131 | 12.4%), science & technology (1,661 | 9.7%), engineering (1,445 | 8.4%), and computers & mathematics (1,036 | 6.0%) are the most common fields of study among 17,201 individuals in Spring Hill who have obtained a bachelor's degree or higher.
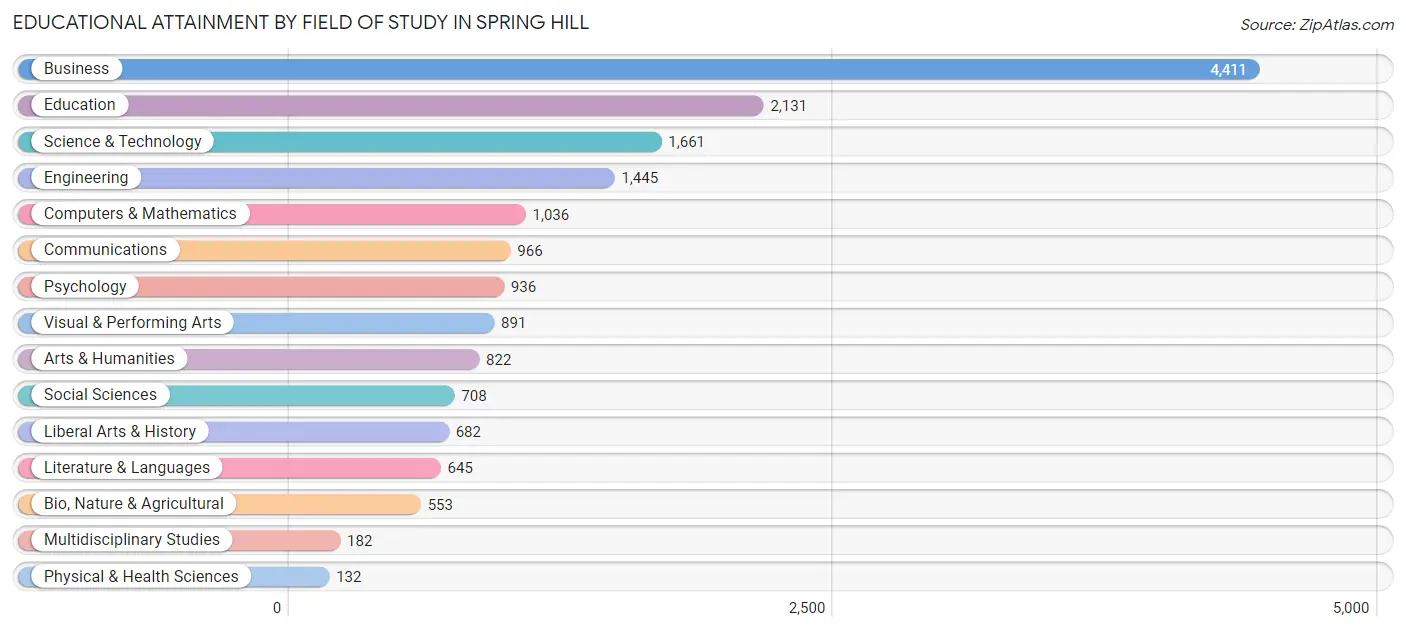
| Field of Study | # Graduates | % Graduates |
| Computers & Mathematics | 1,036 | 6.0% |
| Bio, Nature & Agricultural | 553 | 3.2% |
| Physical & Health Sciences | 132 | 0.8% |
| Psychology | 936 | 5.4% |
| Social Sciences | 708 | 4.1% |
| Engineering | 1,445 | 8.4% |
| Multidisciplinary Studies | 182 | 1.1% |
| Science & Technology | 1,661 | 9.7% |
| Business | 4,411 | 25.6% |
| Education | 2,131 | 12.4% |
| Literature & Languages | 645 | 3.7% |
| Liberal Arts & History | 682 | 4.0% |
| Visual & Performing Arts | 891 | 5.2% |
| Communications | 966 | 5.6% |
| Arts & Humanities | 822 | 4.8% |
| Total | 17,201 | 100.0% |
Transportation & Commute in Spring Hill
Vehicle Availability by Sex in Spring Hill
The most prevalent vehicle ownership categories in Spring Hill are males with 2 vehicles (6,916, accounting for 46.8%) and females with 2 vehicles (5,668, making up 58.7%).
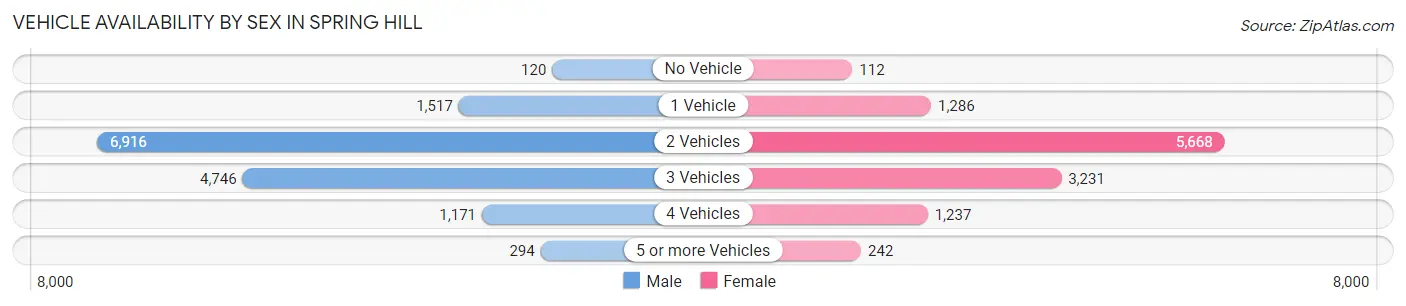
| Vehicles Available | Male | Female |
| No Vehicle | 120 (0.8%) | 112 (0.9%) |
| 1 Vehicle | 1,517 (10.3%) | 1,286 (10.9%) |
| 2 Vehicles | 6,916 (46.8%) | 5,668 (48.1%) |
| 3 Vehicles | 4,746 (32.2%) | 3,231 (27.4%) |
| 4 Vehicles | 1,171 (7.9%) | 1,237 (10.5%) |
| 5 or more Vehicles | 294 (2.0%) | 242 (2.1%) |
| Total | 14,764 (100.0%) | 11,776 (100.0%) |
Commute Time in Spring Hill
The most frequently occuring commute durations in Spring Hill are 30 to 34 minutes (4,438 commuters, 21.1%), 45 to 59 minutes (3,211 commuters, 15.3%), and 20 to 24 minutes (2,690 commuters, 12.8%).
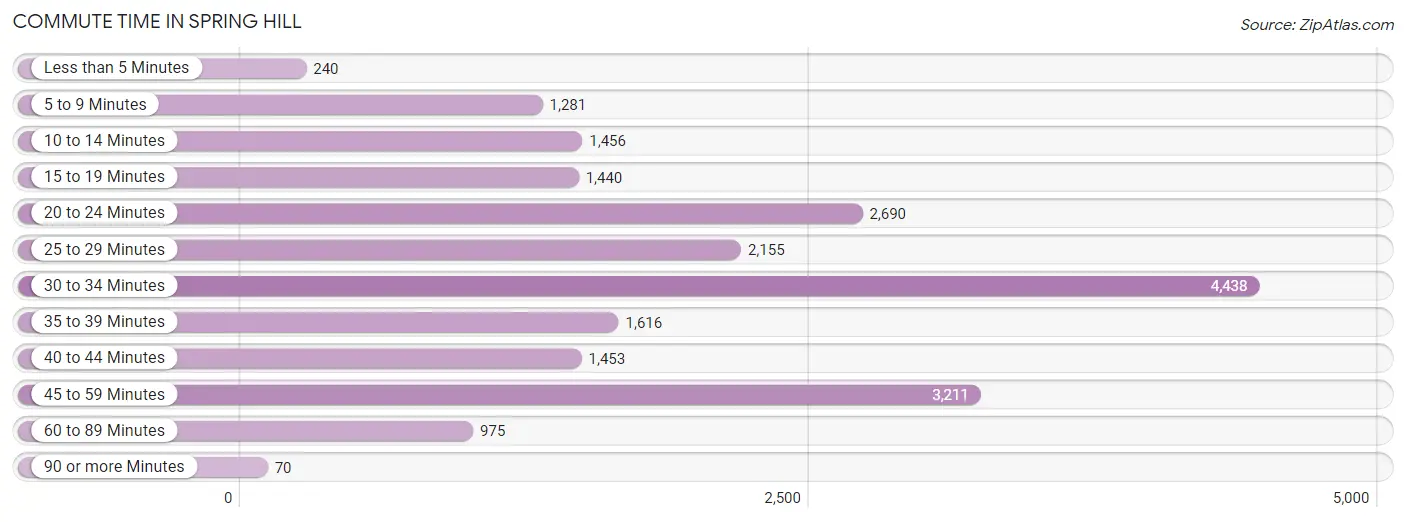
| Commute Time | # Commuters | % Commuters |
| Less than 5 Minutes | 240 | 1.1% |
| 5 to 9 Minutes | 1,281 | 6.1% |
| 10 to 14 Minutes | 1,456 | 6.9% |
| 15 to 19 Minutes | 1,440 | 6.9% |
| 20 to 24 Minutes | 2,690 | 12.8% |
| 25 to 29 Minutes | 2,155 | 10.2% |
| 30 to 34 Minutes | 4,438 | 21.1% |
| 35 to 39 Minutes | 1,616 | 7.7% |
| 40 to 44 Minutes | 1,453 | 6.9% |
| 45 to 59 Minutes | 3,211 | 15.3% |
| 60 to 89 Minutes | 975 | 4.6% |
| 90 or more Minutes | 70 | 0.3% |
Commute Time by Sex in Spring Hill
The most common commute times in Spring Hill are 30 to 34 minutes (2,772 commuters, 23.5%) for males and 30 to 34 minutes (1,666 commuters, 18.0%) for females.
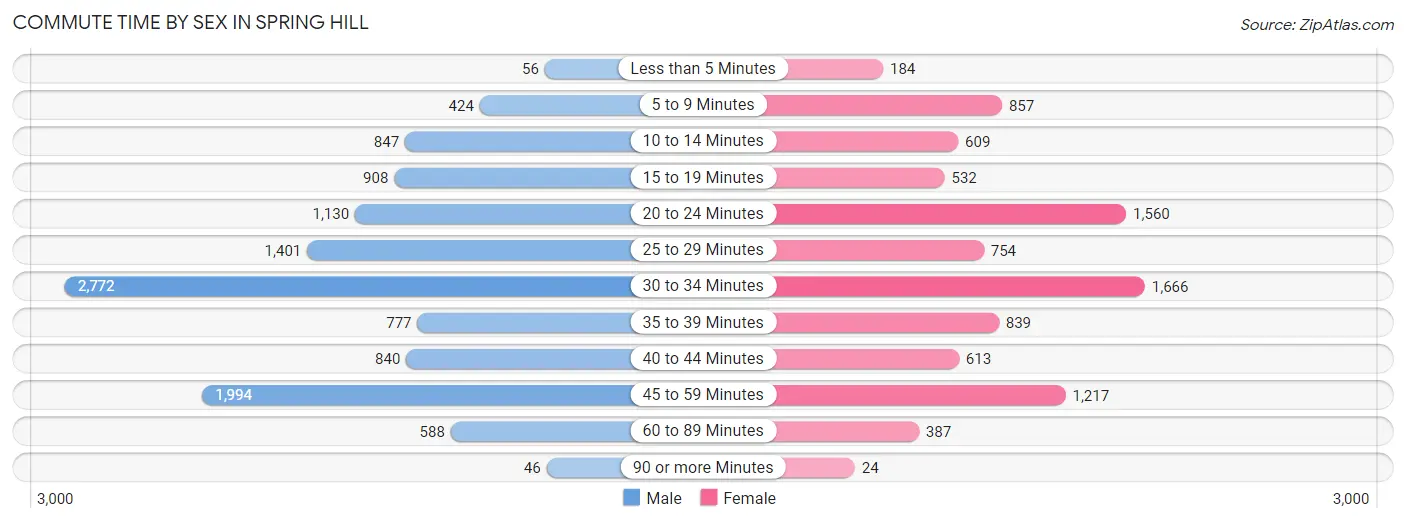
| Commute Time | Male | Female |
| Less than 5 Minutes | 56 (0.5%) | 184 (2.0%) |
| 5 to 9 Minutes | 424 (3.6%) | 857 (9.3%) |
| 10 to 14 Minutes | 847 (7.2%) | 609 (6.6%) |
| 15 to 19 Minutes | 908 (7.7%) | 532 (5.8%) |
| 20 to 24 Minutes | 1,130 (9.6%) | 1,560 (16.9%) |
| 25 to 29 Minutes | 1,401 (11.9%) | 754 (8.2%) |
| 30 to 34 Minutes | 2,772 (23.5%) | 1,666 (18.0%) |
| 35 to 39 Minutes | 777 (6.6%) | 839 (9.1%) |
| 40 to 44 Minutes | 840 (7.1%) | 613 (6.6%) |
| 45 to 59 Minutes | 1,994 (16.9%) | 1,217 (13.2%) |
| 60 to 89 Minutes | 588 (5.0%) | 387 (4.2%) |
| 90 or more Minutes | 46 (0.4%) | 24 (0.3%) |
Time of Departure to Work by Sex in Spring Hill
The most frequent times of departure to work in Spring Hill are 6:30 AM to 6:59 AM (1,814, 15.4%) for males and 8:00 AM to 8:29 AM (1,713, 18.5%) for females.
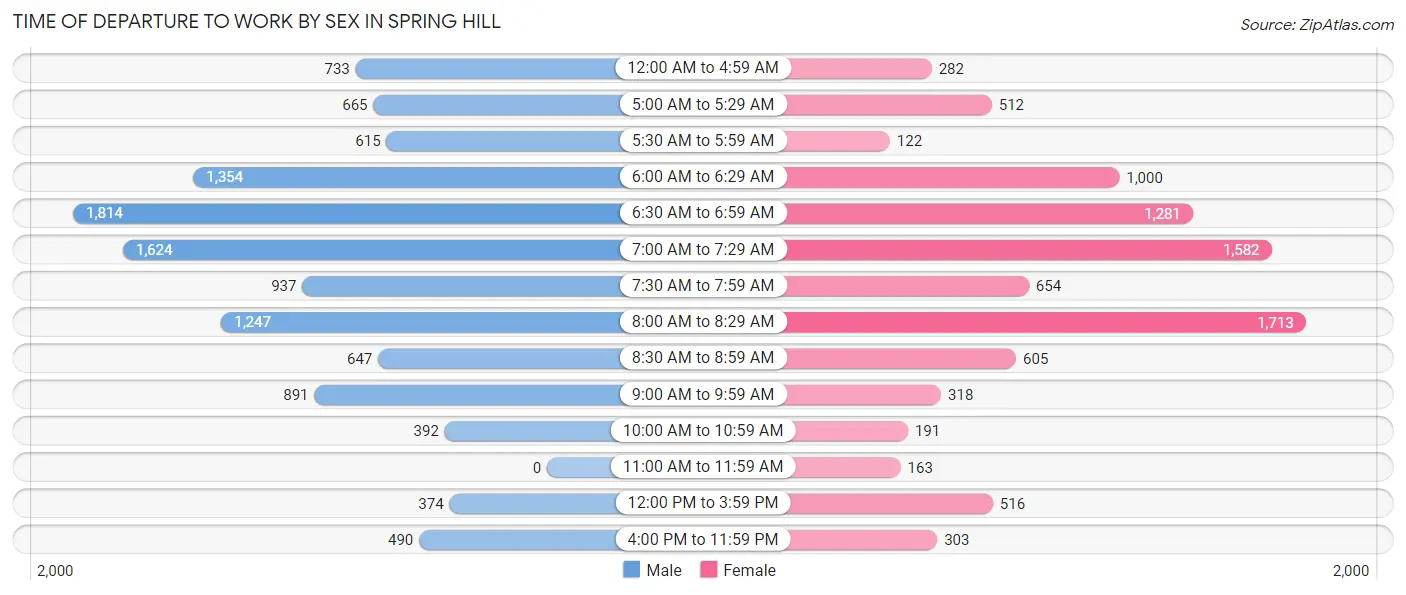
| Time of Departure | Male | Female |
| 12:00 AM to 4:59 AM | 733 (6.2%) | 282 (3.0%) |
| 5:00 AM to 5:29 AM | 665 (5.6%) | 512 (5.5%) |
| 5:30 AM to 5:59 AM | 615 (5.2%) | 122 (1.3%) |
| 6:00 AM to 6:29 AM | 1,354 (11.5%) | 1,000 (10.8%) |
| 6:30 AM to 6:59 AM | 1,814 (15.4%) | 1,281 (13.9%) |
| 7:00 AM to 7:29 AM | 1,624 (13.8%) | 1,582 (17.1%) |
| 7:30 AM to 7:59 AM | 937 (8.0%) | 654 (7.1%) |
| 8:00 AM to 8:29 AM | 1,247 (10.6%) | 1,713 (18.5%) |
| 8:30 AM to 8:59 AM | 647 (5.5%) | 605 (6.6%) |
| 9:00 AM to 9:59 AM | 891 (7.6%) | 318 (3.4%) |
| 10:00 AM to 10:59 AM | 392 (3.3%) | 191 (2.1%) |
| 11:00 AM to 11:59 AM | 0 (0.0%) | 163 (1.8%) |
| 12:00 PM to 3:59 PM | 374 (3.2%) | 516 (5.6%) |
| 4:00 PM to 11:59 PM | 490 (4.2%) | 303 (3.3%) |
| Total | 11,783 (100.0%) | 9,242 (100.0%) |
Housing Occupancy in Spring Hill
Occupancy by Ownership in Spring Hill
Of the total 17,867 dwellings in Spring Hill, owner-occupied units account for 13,390 (74.9%), while renter-occupied units make up 4,477 (25.1%).
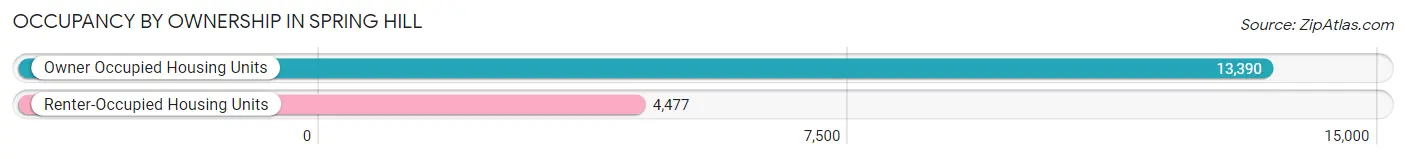
| Occupancy | # Housing Units | % Housing Units |
| Owner Occupied Housing Units | 13,390 | 74.9% |
| Renter-Occupied Housing Units | 4,477 | 25.1% |
| Total Occupied Housing Units | 17,867 | 100.0% |
Occupancy by Household Size in Spring Hill
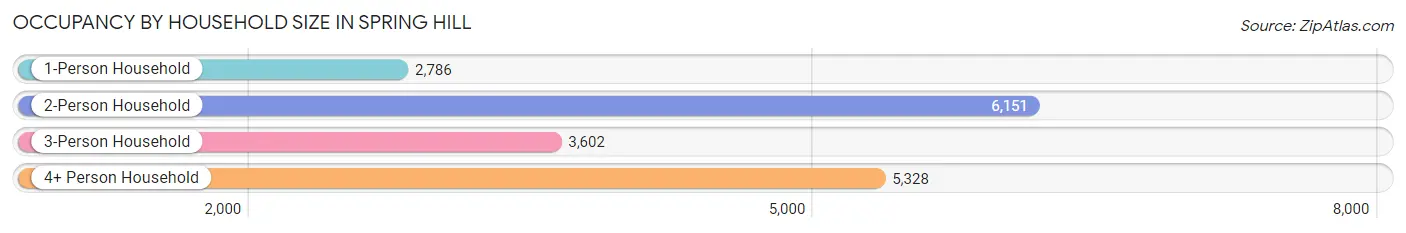
| Household Size | # Housing Units | % Housing Units |
| 1-Person Household | 2,786 | 15.6% |
| 2-Person Household | 6,151 | 34.4% |
| 3-Person Household | 3,602 | 20.2% |
| 4+ Person Household | 5,328 | 29.8% |
| Total Housing Units | 17,867 | 100.0% |
Occupancy by Ownership by Household Size in Spring Hill
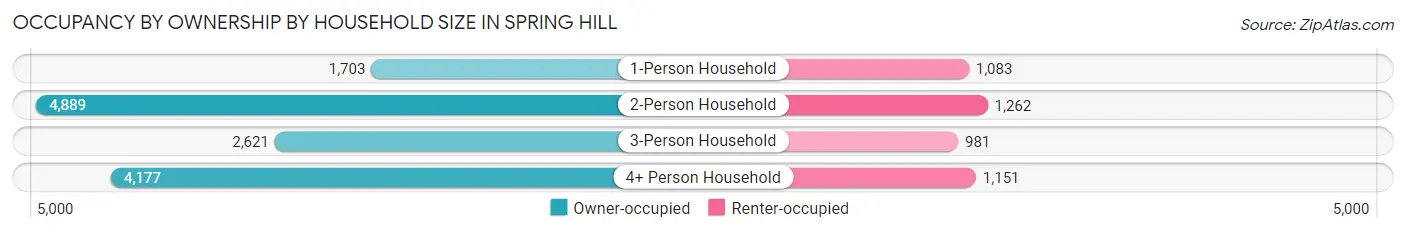
| Household Size | Owner-occupied | Renter-occupied |
| 1-Person Household | 1,703 (61.1%) | 1,083 (38.9%) |
| 2-Person Household | 4,889 (79.5%) | 1,262 (20.5%) |
| 3-Person Household | 2,621 (72.8%) | 981 (27.2%) |
| 4+ Person Household | 4,177 (78.4%) | 1,151 (21.6%) |
| Total Housing Units | 13,390 (74.9%) | 4,477 (25.1%) |
Occupancy by Educational Attainment in Spring Hill
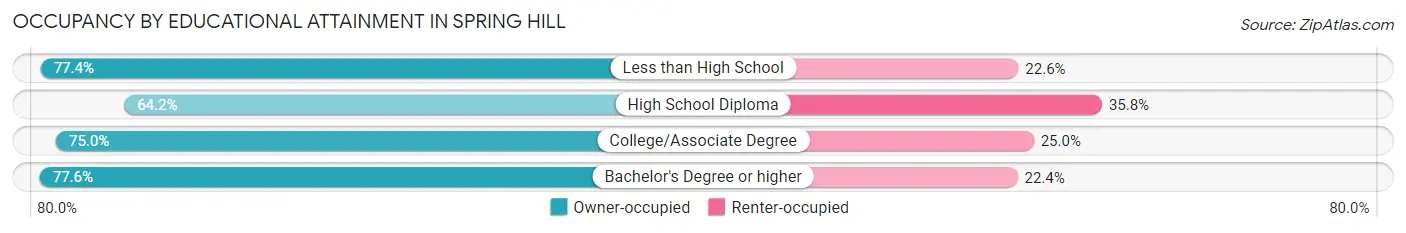
| Household Size | Owner-occupied | Renter-occupied |
| Less than High School | 429 (77.4%) | 125 (22.6%) |
| High School Diploma | 1,626 (64.2%) | 907 (35.8%) |
| College/Associate Degree | 3,837 (75.0%) | 1,278 (25.0%) |
| Bachelor's Degree or higher | 7,498 (77.6%) | 2,167 (22.4%) |
Occupancy by Age of Householder in Spring Hill
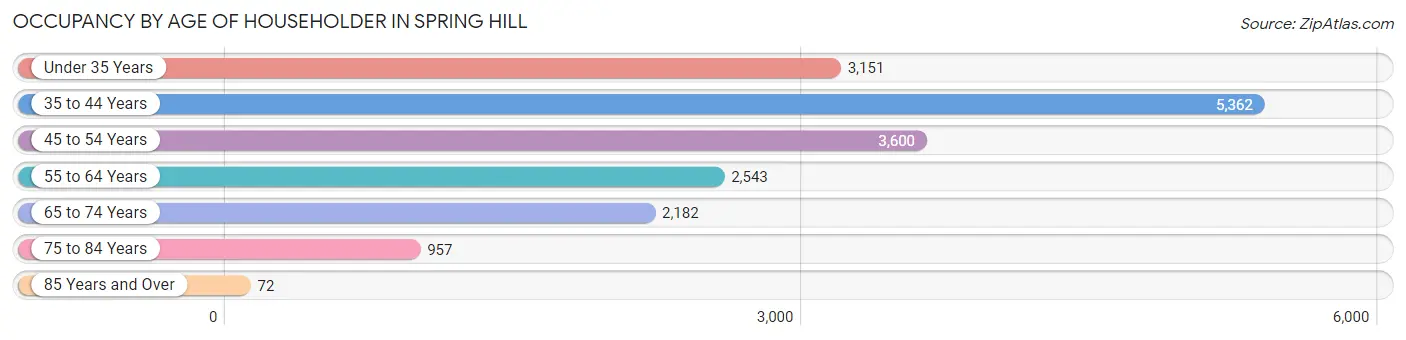
| Age Bracket | # Households | % Households |
| Under 35 Years | 3,151 | 17.6% |
| 35 to 44 Years | 5,362 | 30.0% |
| 45 to 54 Years | 3,600 | 20.2% |
| 55 to 64 Years | 2,543 | 14.2% |
| 65 to 74 Years | 2,182 | 12.2% |
| 75 to 84 Years | 957 | 5.4% |
| 85 Years and Over | 72 | 0.4% |
| Total | 17,867 | 100.0% |
Housing Finances in Spring Hill
Median Income by Occupancy in Spring Hill
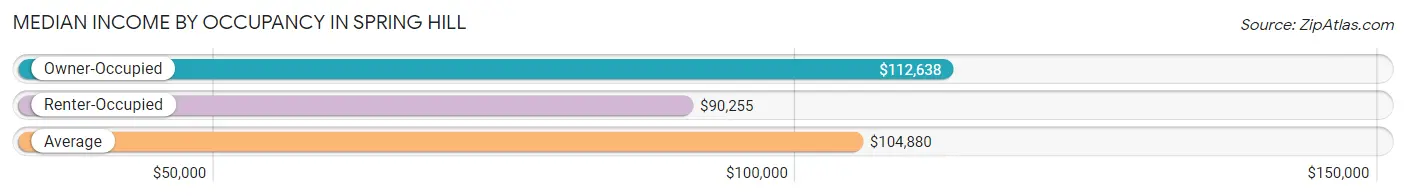
| Occupancy Type | # Households | Median Income |
| Owner-Occupied | 13,390 (74.9%) | $112,638 |
| Renter-Occupied | 4,477 (25.1%) | $90,255 |
| Average | 17,867 (100.0%) | $104,880 |
Occupancy by Householder Income Bracket in Spring Hill
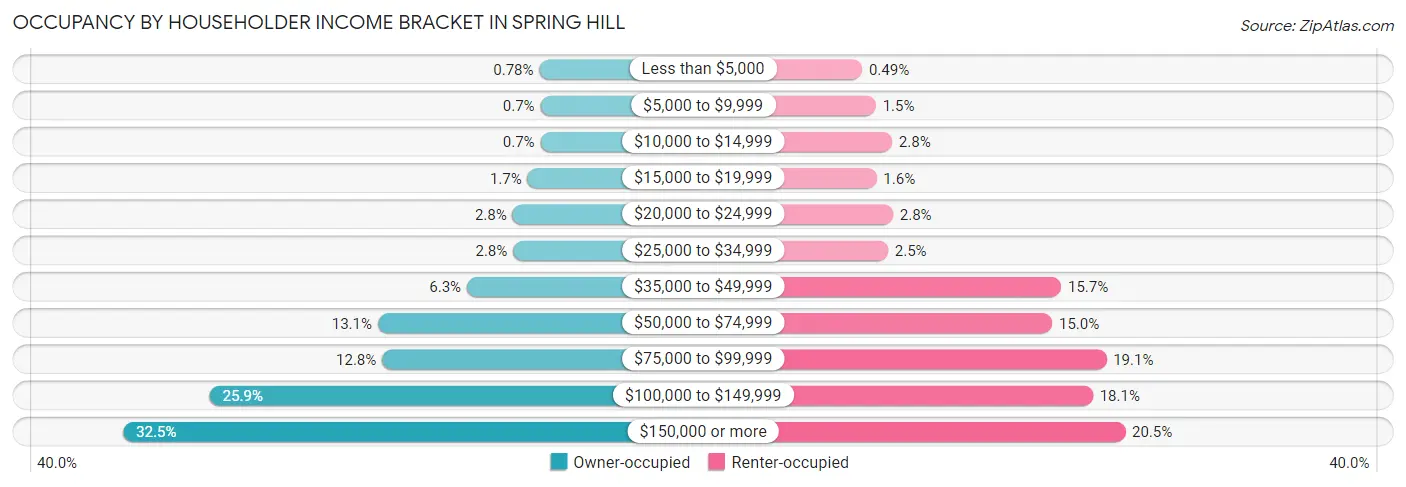
| Income Bracket | Owner-occupied | Renter-occupied |
| Less than $5,000 | 104 (0.8%) | 22 (0.5%) |
| $5,000 to $9,999 | 94 (0.7%) | 69 (1.5%) |
| $10,000 to $14,999 | 94 (0.7%) | 124 (2.8%) |
| $15,000 to $19,999 | 225 (1.7%) | 71 (1.6%) |
| $20,000 to $24,999 | 377 (2.8%) | 127 (2.8%) |
| $25,000 to $34,999 | 372 (2.8%) | 110 (2.5%) |
| $35,000 to $49,999 | 844 (6.3%) | 701 (15.7%) |
| $50,000 to $74,999 | 1,753 (13.1%) | 670 (15.0%) |
| $75,000 to $99,999 | 1,709 (12.8%) | 855 (19.1%) |
| $100,000 to $149,999 | 3,468 (25.9%) | 809 (18.1%) |
| $150,000 or more | 4,350 (32.5%) | 919 (20.5%) |
| Total | 13,390 (100.0%) | 4,477 (100.0%) |
Monthly Housing Cost Tiers in Spring Hill
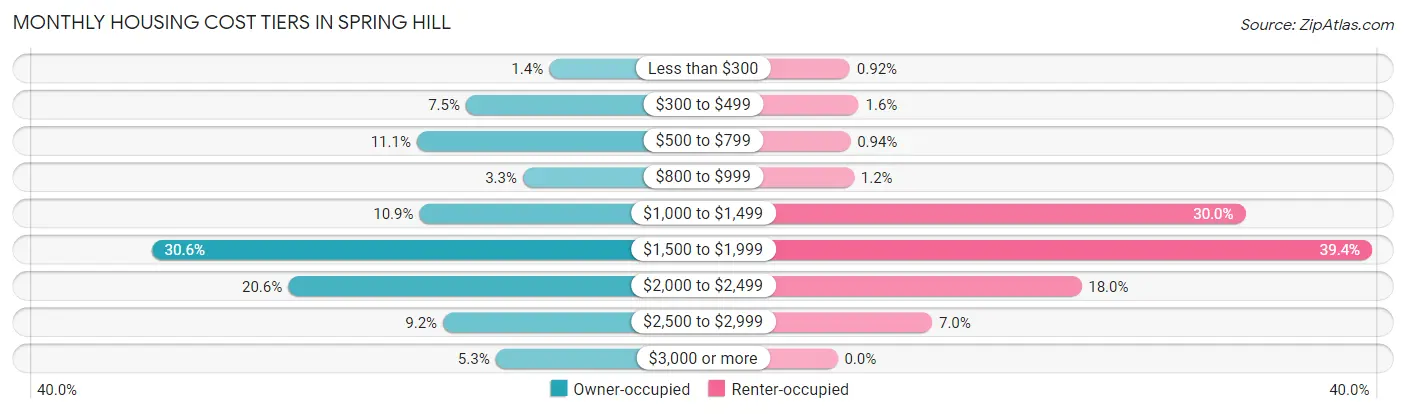
| Monthly Cost | Owner-occupied | Renter-occupied |
| Less than $300 | 185 (1.4%) | 41 (0.9%) |
| $300 to $499 | 1,005 (7.5%) | 70 (1.6%) |
| $500 to $799 | 1,489 (11.1%) | 42 (0.9%) |
| $800 to $999 | 443 (3.3%) | 54 (1.2%) |
| $1,000 to $1,499 | 1,464 (10.9%) | 1,345 (30.0%) |
| $1,500 to $1,999 | 4,103 (30.6%) | 1,762 (39.4%) |
| $2,000 to $2,499 | 2,758 (20.6%) | 804 (18.0%) |
| $2,500 to $2,999 | 1,230 (9.2%) | 312 (7.0%) |
| $3,000 or more | 713 (5.3%) | 0 (0.0%) |
| Total | 13,390 (100.0%) | 4,477 (100.0%) |
Physical Housing Characteristics in Spring Hill
Housing Structures in Spring Hill
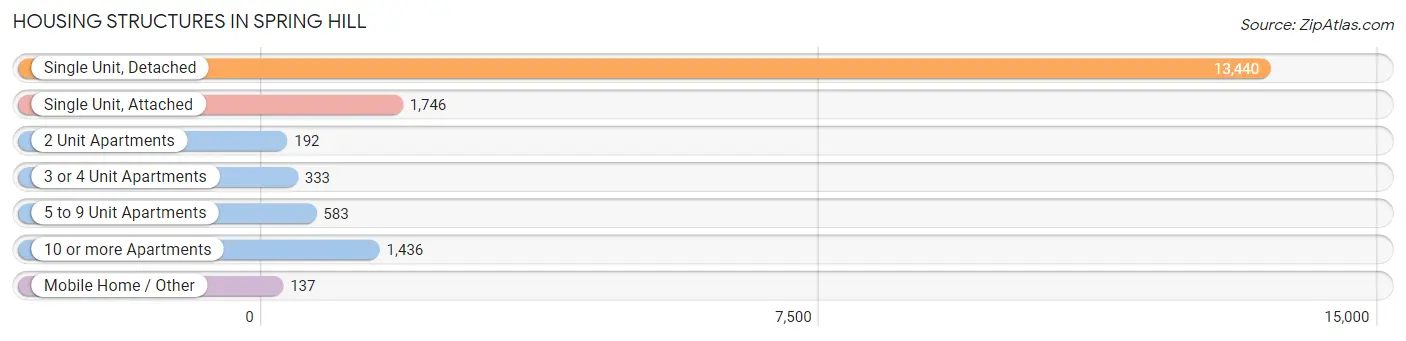
| Structure Type | # Housing Units | % Housing Units |
| Single Unit, Detached | 13,440 | 75.2% |
| Single Unit, Attached | 1,746 | 9.8% |
| 2 Unit Apartments | 192 | 1.1% |
| 3 or 4 Unit Apartments | 333 | 1.9% |
| 5 to 9 Unit Apartments | 583 | 3.3% |
| 10 or more Apartments | 1,436 | 8.0% |
| Mobile Home / Other | 137 | 0.8% |
| Total | 17,867 | 100.0% |
Housing Structures by Occupancy in Spring Hill
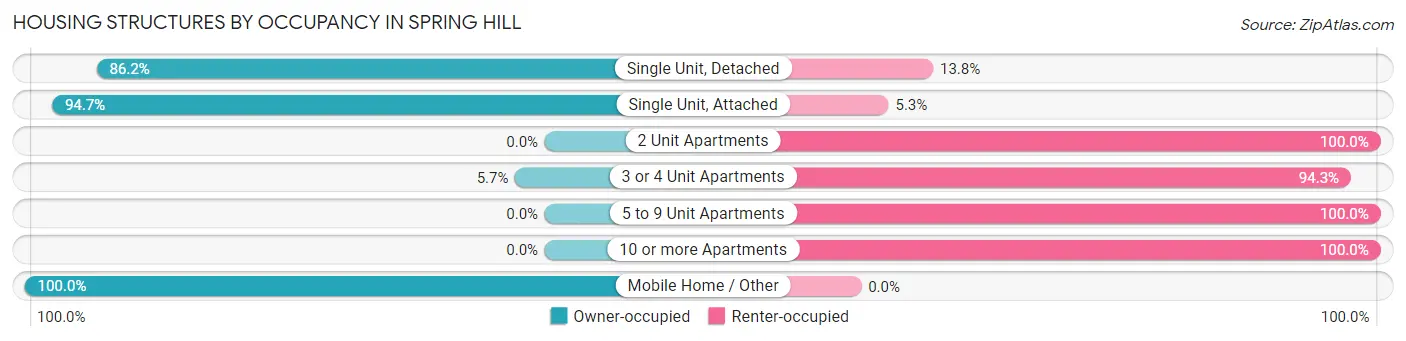
| Structure Type | Owner-occupied | Renter-occupied |
| Single Unit, Detached | 11,580 (86.2%) | 1,860 (13.8%) |
| Single Unit, Attached | 1,654 (94.7%) | 92 (5.3%) |
| 2 Unit Apartments | 0 (0.0%) | 192 (100.0%) |
| 3 or 4 Unit Apartments | 19 (5.7%) | 314 (94.3%) |
| 5 to 9 Unit Apartments | 0 (0.0%) | 583 (100.0%) |
| 10 or more Apartments | 0 (0.0%) | 1,436 (100.0%) |
| Mobile Home / Other | 137 (100.0%) | 0 (0.0%) |
| Total | 13,390 (74.9%) | 4,477 (25.1%) |
Housing Structures by Number of Rooms in Spring Hill
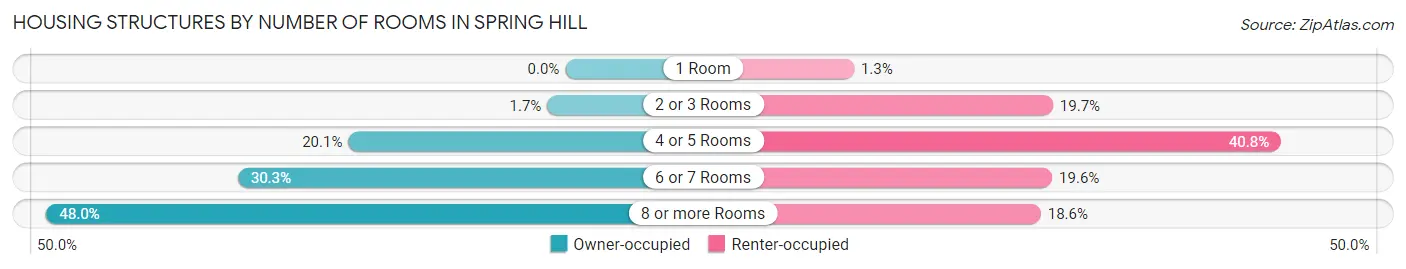
| Number of Rooms | Owner-occupied | Renter-occupied |
| 1 Room | 0 (0.0%) | 58 (1.3%) |
| 2 or 3 Rooms | 224 (1.7%) | 882 (19.7%) |
| 4 or 5 Rooms | 2,687 (20.1%) | 1,826 (40.8%) |
| 6 or 7 Rooms | 4,055 (30.3%) | 879 (19.6%) |
| 8 or more Rooms | 6,424 (48.0%) | 832 (18.6%) |
| Total | 13,390 (100.0%) | 4,477 (100.0%) |
Housing Structure by Heating Type in Spring Hill
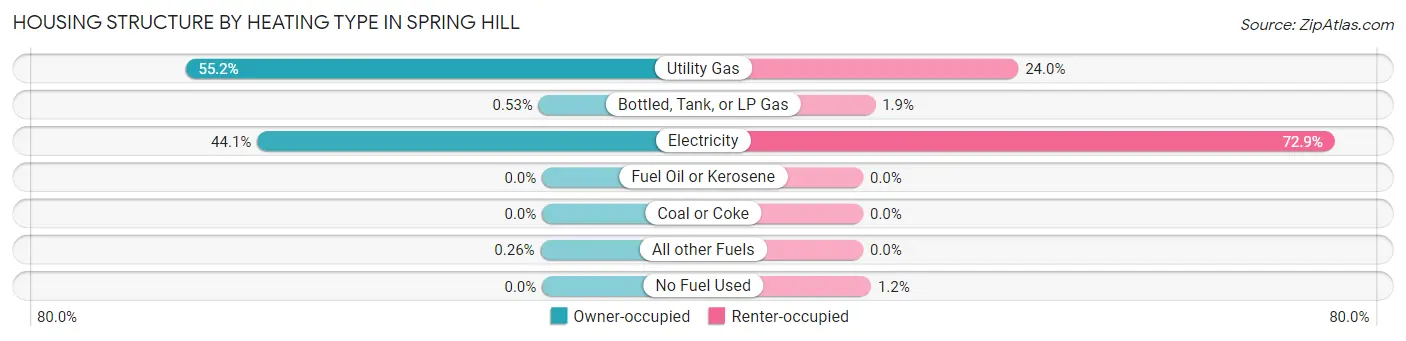
| Heating Type | Owner-occupied | Renter-occupied |
| Utility Gas | 7,386 (55.2%) | 1,074 (24.0%) |
| Bottled, Tank, or LP Gas | 71 (0.5%) | 84 (1.9%) |
| Electricity | 5,898 (44.1%) | 3,264 (72.9%) |
| Fuel Oil or Kerosene | 0 (0.0%) | 0 (0.0%) |
| Coal or Coke | 0 (0.0%) | 0 (0.0%) |
| All other Fuels | 35 (0.3%) | 0 (0.0%) |
| No Fuel Used | 0 (0.0%) | 55 (1.2%) |
| Total | 13,390 (100.0%) | 4,477 (100.0%) |
Household Vehicle Usage in Spring Hill
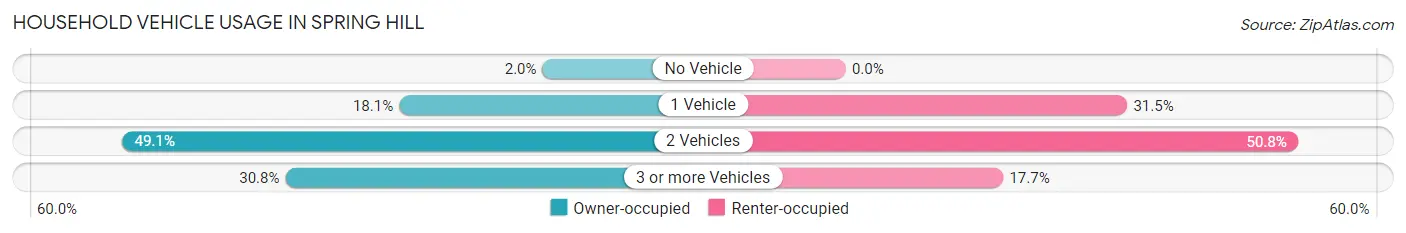
| Vehicles per Household | Owner-occupied | Renter-occupied |
| No Vehicle | 268 (2.0%) | 0 (0.0%) |
| 1 Vehicle | 2,418 (18.1%) | 1,412 (31.5%) |
| 2 Vehicles | 6,580 (49.1%) | 2,275 (50.8%) |
| 3 or more Vehicles | 4,124 (30.8%) | 790 (17.6%) |
| Total | 13,390 (100.0%) | 4,477 (100.0%) |
Real Estate & Mortgages in Spring Hill
Real Estate and Mortgage Overview in Spring Hill
| Characteristic | Without Mortgage | With Mortgage |
| Housing Units | 2,820 | 10,570 |
| Median Property Value | $372,300 | $392,900 |
| Median Household Income | $70,913 | $3,738 |
| Monthly Housing Costs | $535 | $713 |
| Real Estate Taxes | $2,099 | $279 |
Property Value by Mortgage Status in Spring Hill
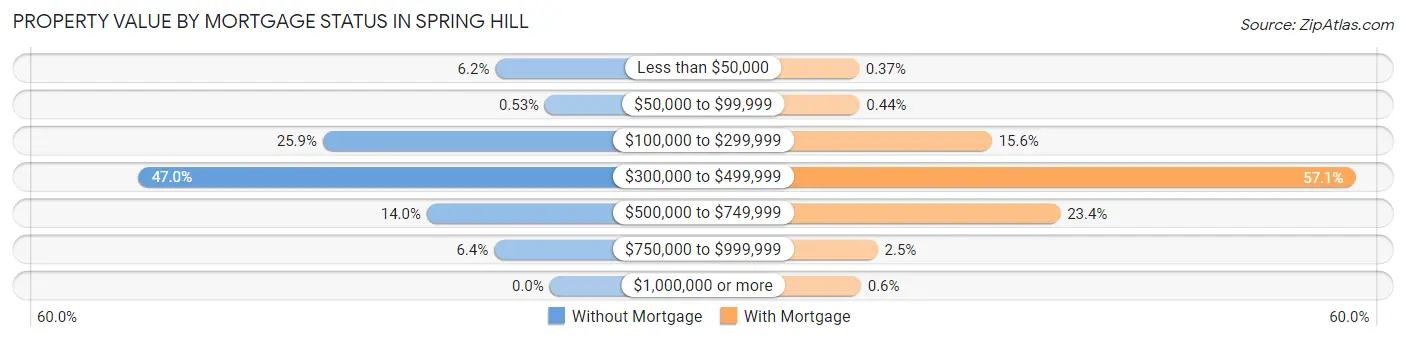
| Property Value | Without Mortgage | With Mortgage |
| Less than $50,000 | 175 (6.2%) | 39 (0.4%) |
| $50,000 to $99,999 | 15 (0.5%) | 47 (0.4%) |
| $100,000 to $299,999 | 731 (25.9%) | 1,645 (15.6%) |
| $300,000 to $499,999 | 1,324 (46.9%) | 6,038 (57.1%) |
| $500,000 to $749,999 | 396 (14.0%) | 2,472 (23.4%) |
| $750,000 to $999,999 | 179 (6.4%) | 266 (2.5%) |
| $1,000,000 or more | 0 (0.0%) | 63 (0.6%) |
| Total | 2,820 (100.0%) | 10,570 (100.0%) |
Household Income by Mortgage Status in Spring Hill
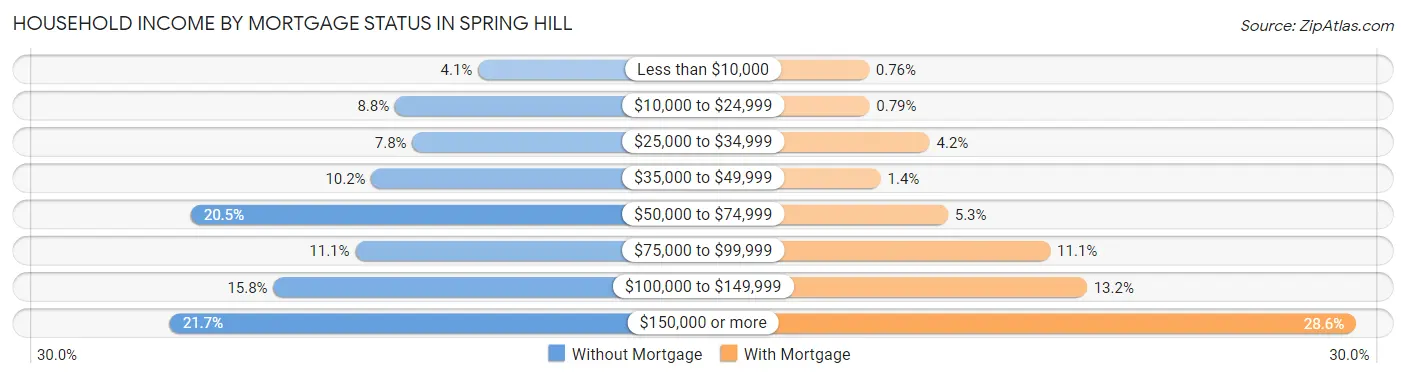
| Household Income | Without Mortgage | With Mortgage |
| Less than $10,000 | 115 (4.1%) | 80 (0.8%) |
| $10,000 to $24,999 | 249 (8.8%) | 83 (0.8%) |
| $25,000 to $34,999 | 221 (7.8%) | 447 (4.2%) |
| $35,000 to $49,999 | 287 (10.2%) | 151 (1.4%) |
| $50,000 to $74,999 | 578 (20.5%) | 557 (5.3%) |
| $75,000 to $99,999 | 313 (11.1%) | 1,175 (11.1%) |
| $100,000 to $149,999 | 445 (15.8%) | 1,396 (13.2%) |
| $150,000 or more | 612 (21.7%) | 3,023 (28.6%) |
| Total | 2,820 (100.0%) | 10,570 (100.0%) |
Property Value to Household Income Ratio in Spring Hill
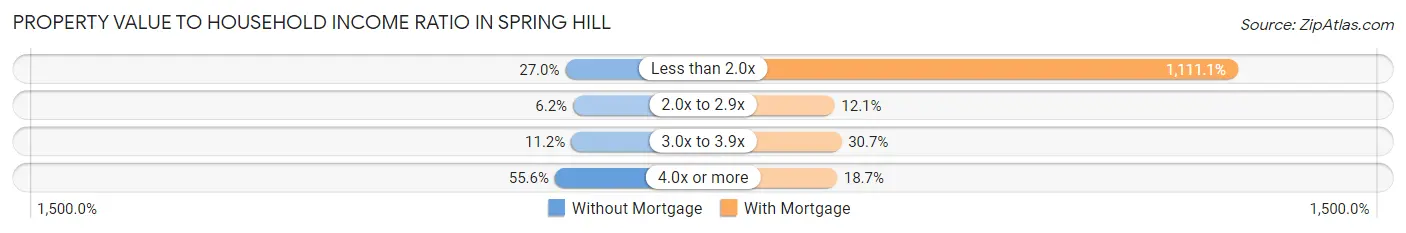
| Value-to-Income Ratio | Without Mortgage | With Mortgage |
| Less than 2.0x | 762 (27.0%) | 117,441 (1,111.1%) |
| 2.0x to 2.9x | 176 (6.2%) | 1,282 (12.1%) |
| 3.0x to 3.9x | 315 (11.2%) | 3,243 (30.7%) |
| 4.0x or more | 1,567 (55.6%) | 1,977 (18.7%) |
| Total | 2,820 (100.0%) | 10,570 (100.0%) |
Real Estate Taxes by Mortgage Status in Spring Hill
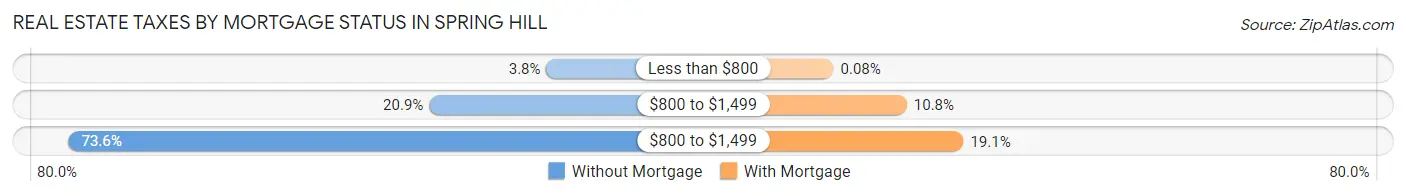
| Property Taxes | Without Mortgage | With Mortgage |
| Less than $800 | 106 (3.8%) | 8 (0.1%) |
| $800 to $1,499 | 589 (20.9%) | 1,140 (10.8%) |
| $800 to $1,499 | 2,075 (73.6%) | 2,015 (19.1%) |
| Total | 2,820 (100.0%) | 10,570 (100.0%) |
Health & Disability in Spring Hill
Health Insurance Coverage by Age in Spring Hill
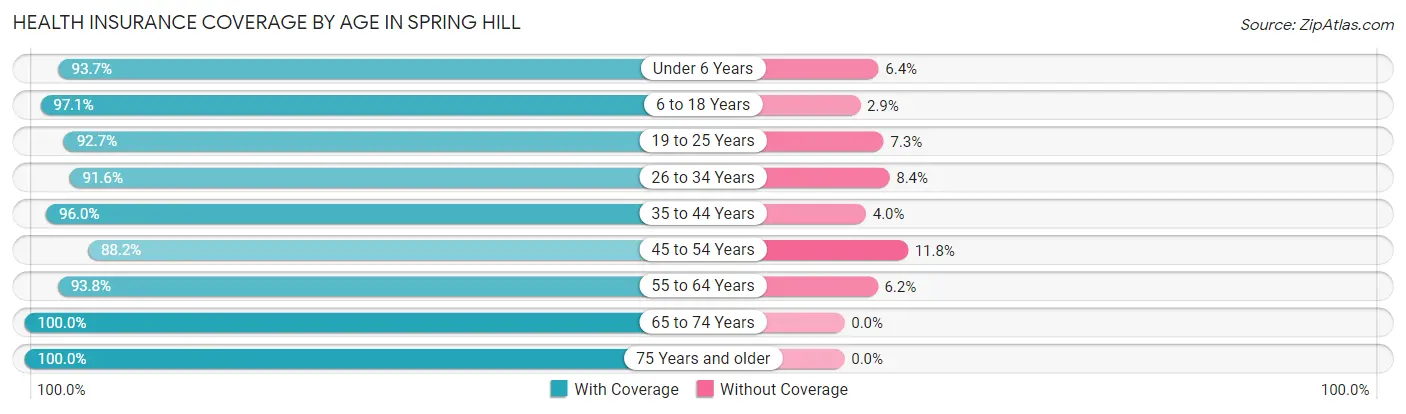
| Age Bracket | With Coverage | Without Coverage |
| Under 6 Years | 3,998 (93.6%) | 271 (6.4%) |
| 6 to 18 Years | 11,052 (97.1%) | 334 (2.9%) |
| 19 to 25 Years | 3,632 (92.7%) | 286 (7.3%) |
| 26 to 34 Years | 5,044 (91.6%) | 462 (8.4%) |
| 35 to 44 Years | 9,324 (96.0%) | 390 (4.0%) |
| 45 to 54 Years | 5,626 (88.2%) | 754 (11.8%) |
| 55 to 64 Years | 4,522 (93.8%) | 298 (6.2%) |
| 65 to 74 Years | 3,582 (100.0%) | 0 (0.0%) |
| 75 Years and older | 1,658 (100.0%) | 0 (0.0%) |
| Total | 48,438 (94.5%) | 2,795 (5.5%) |
Health Insurance Coverage by Citizenship Status in Spring Hill
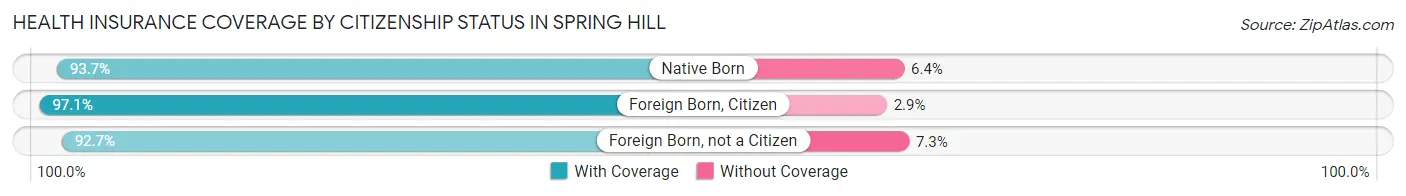
| Citizenship Status | With Coverage | Without Coverage |
| Native Born | 3,998 (93.6%) | 271 (6.4%) |
| Foreign Born, Citizen | 11,052 (97.1%) | 334 (2.9%) |
| Foreign Born, not a Citizen | 3,632 (92.7%) | 286 (7.3%) |
Health Insurance Coverage by Household Income in Spring Hill
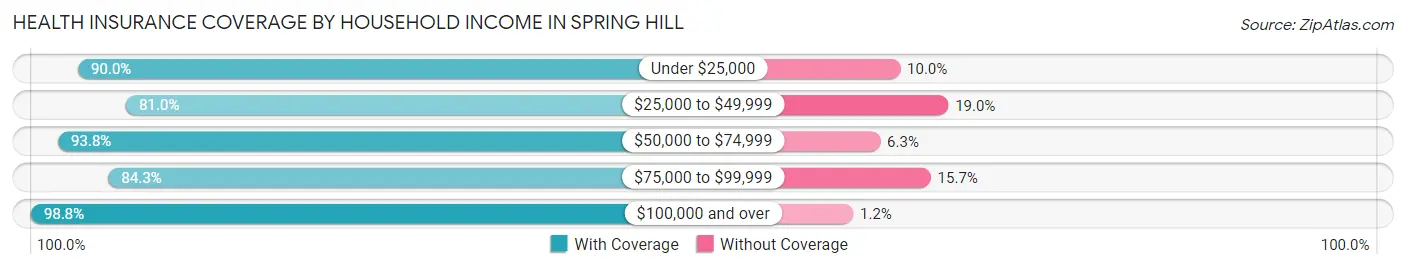
| Household Income | With Coverage | Without Coverage |
| Under $25,000 | 1,929 (90.0%) | 214 (10.0%) |
| $25,000 to $49,999 | 3,518 (81.0%) | 825 (19.0%) |
| $50,000 to $74,999 | 5,156 (93.8%) | 344 (6.2%) |
| $75,000 to $99,999 | 5,476 (84.3%) | 1,021 (15.7%) |
| $100,000 and over | 32,351 (98.8%) | 387 (1.2%) |
Public vs Private Health Insurance Coverage by Age in Spring Hill
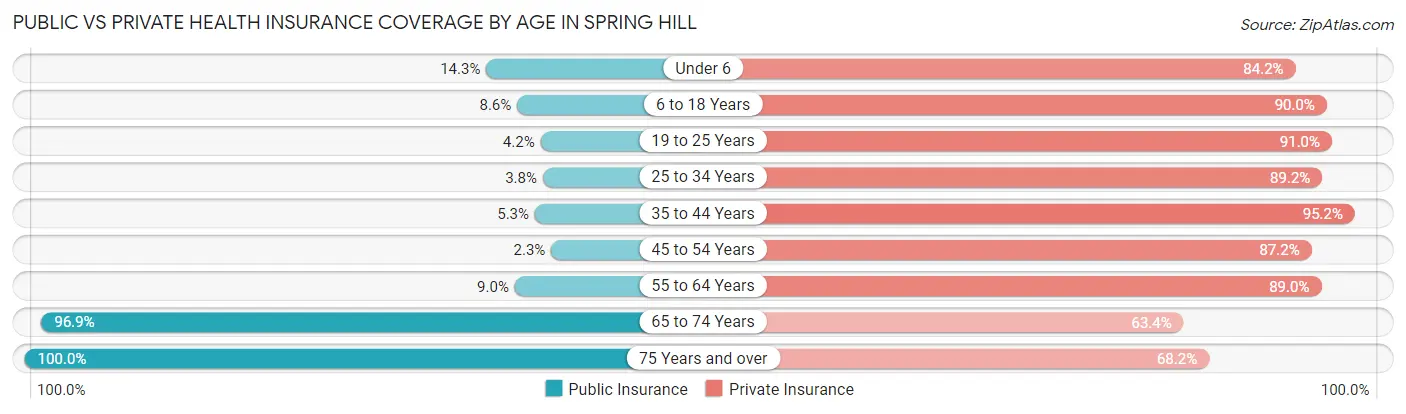
| Age Bracket | Public Insurance | Private Insurance |
| Under 6 | 611 (14.3%) | 3,594 (84.2%) |
| 6 to 18 Years | 977 (8.6%) | 10,247 (90.0%) |
| 19 to 25 Years | 166 (4.2%) | 3,564 (91.0%) |
| 25 to 34 Years | 210 (3.8%) | 4,909 (89.2%) |
| 35 to 44 Years | 514 (5.3%) | 9,249 (95.2%) |
| 45 to 54 Years | 144 (2.3%) | 5,563 (87.2%) |
| 55 to 64 Years | 435 (9.0%) | 4,289 (89.0%) |
| 65 to 74 Years | 3,471 (96.9%) | 2,272 (63.4%) |
| 75 Years and over | 1,658 (100.0%) | 1,130 (68.1%) |
| Total | 8,186 (16.0%) | 44,817 (87.5%) |
Disability Status by Sex by Age in Spring Hill
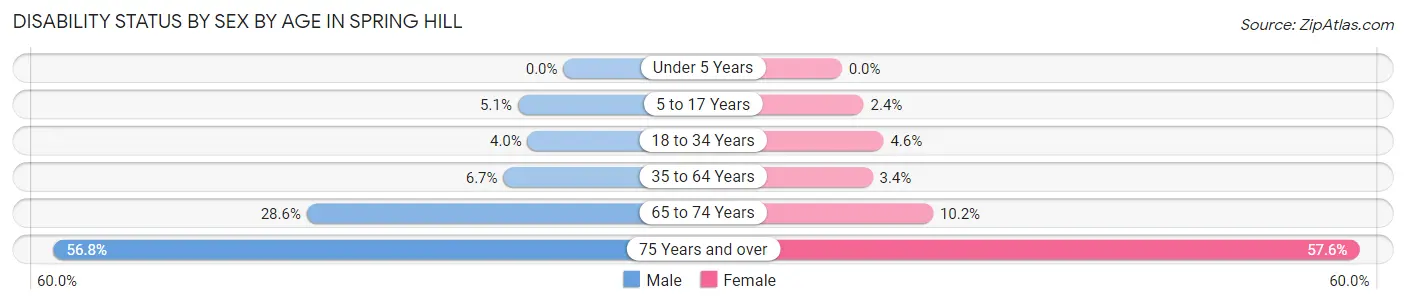
| Age Bracket | Male | Female |
| Under 5 Years | 0 (0.0%) | 0 (0.0%) |
| 5 to 17 Years | 285 (5.1%) | 136 (2.4%) |
| 18 to 34 Years | 214 (4.0%) | 226 (4.6%) |
| 35 to 64 Years | 688 (6.7%) | 363 (3.4%) |
| 65 to 74 Years | 483 (28.6%) | 192 (10.2%) |
| 75 Years and over | 550 (56.8%) | 397 (57.6%) |
Disability Class by Sex by Age in Spring Hill
Disability Class: Hearing Difficulty
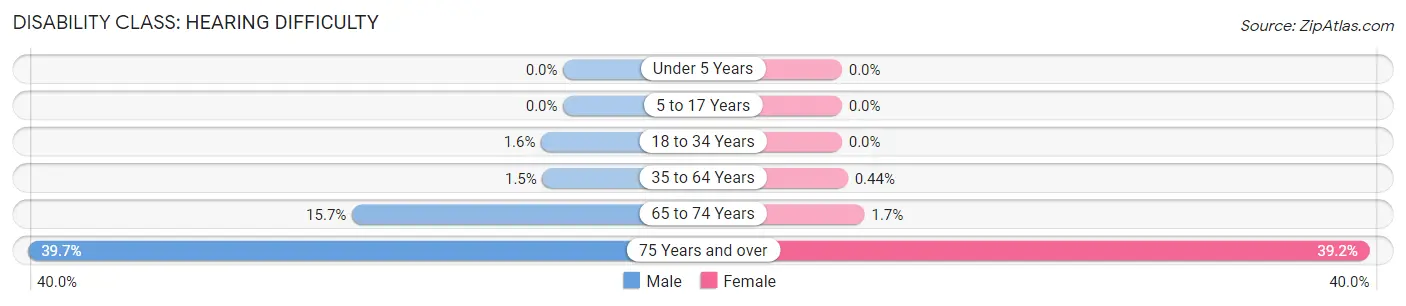
| Age Bracket | Male | Female |
| Under 5 Years | 0 (0.0%) | 0 (0.0%) |
| 5 to 17 Years | 0 (0.0%) | 0 (0.0%) |
| 18 to 34 Years | 88 (1.6%) | 0 (0.0%) |
| 35 to 64 Years | 159 (1.5%) | 47 (0.4%) |
| 65 to 74 Years | 265 (15.7%) | 32 (1.7%) |
| 75 Years and over | 385 (39.7%) | 270 (39.2%) |
Disability Class: Vision Difficulty
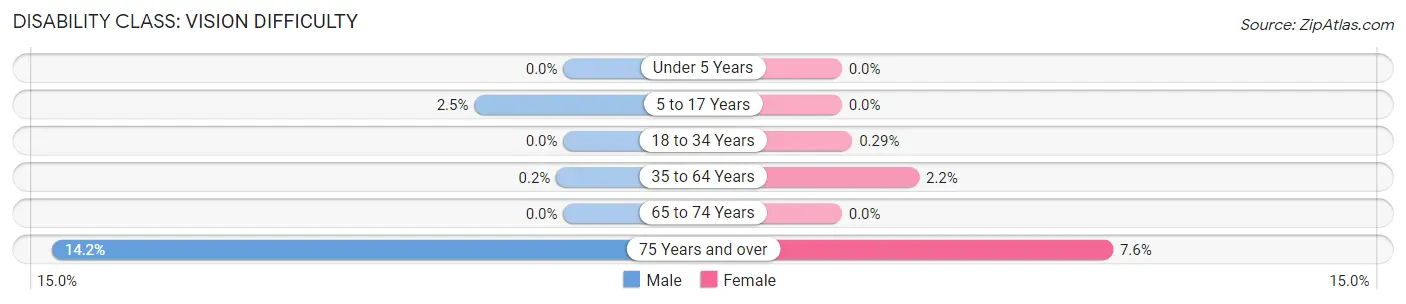
| Age Bracket | Male | Female |
| Under 5 Years | 0 (0.0%) | 0 (0.0%) |
| 5 to 17 Years | 139 (2.5%) | 0 (0.0%) |
| 18 to 34 Years | 0 (0.0%) | 14 (0.3%) |
| 35 to 64 Years | 21 (0.2%) | 228 (2.1%) |
| 65 to 74 Years | 0 (0.0%) | 0 (0.0%) |
| 75 Years and over | 138 (14.2%) | 52 (7.5%) |
Disability Class: Cognitive Difficulty
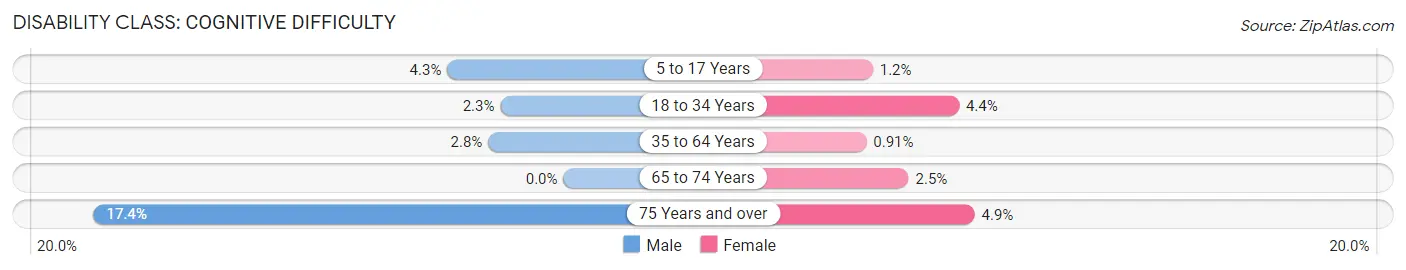
| Age Bracket | Male | Female |
| 5 to 17 Years | 242 (4.3%) | 64 (1.1%) |
| 18 to 34 Years | 126 (2.3%) | 212 (4.3%) |
| 35 to 64 Years | 287 (2.8%) | 97 (0.9%) |
| 65 to 74 Years | 0 (0.0%) | 47 (2.5%) |
| 75 Years and over | 169 (17.4%) | 34 (4.9%) |
Disability Class: Ambulatory Difficulty
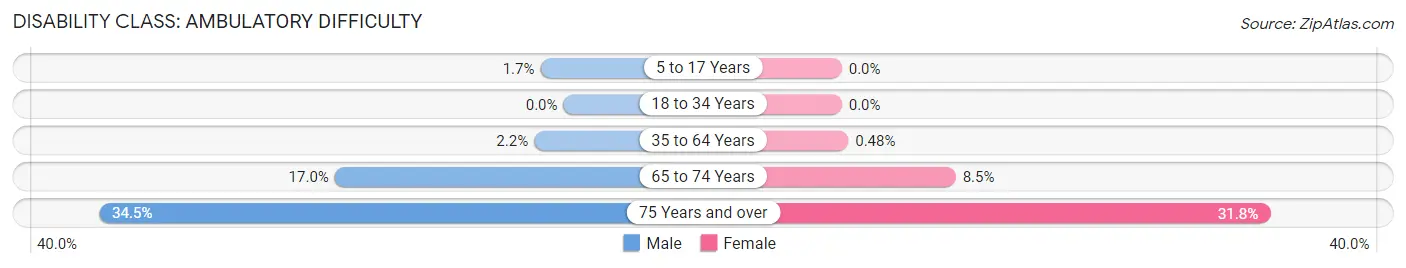
| Age Bracket | Male | Female |
| 5 to 17 Years | 96 (1.7%) | 0 (0.0%) |
| 18 to 34 Years | 0 (0.0%) | 0 (0.0%) |
| 35 to 64 Years | 225 (2.2%) | 51 (0.5%) |
| 65 to 74 Years | 287 (17.0%) | 160 (8.5%) |
| 75 Years and over | 334 (34.5%) | 219 (31.8%) |
Disability Class: Self-Care Difficulty
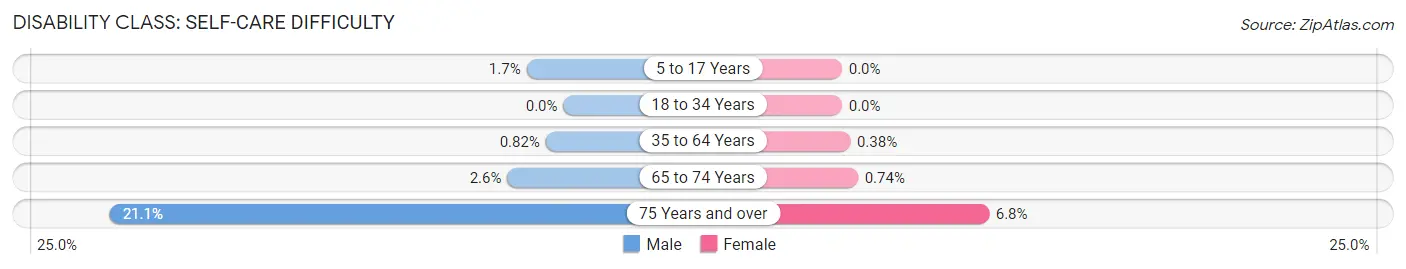
| Age Bracket | Male | Female |
| 5 to 17 Years | 96 (1.7%) | 0 (0.0%) |
| 18 to 34 Years | 0 (0.0%) | 0 (0.0%) |
| 35 to 64 Years | 84 (0.8%) | 40 (0.4%) |
| 65 to 74 Years | 44 (2.6%) | 14 (0.7%) |
| 75 Years and over | 204 (21.0%) | 47 (6.8%) |
Technology Access in Spring Hill
Computing Device Access in Spring Hill
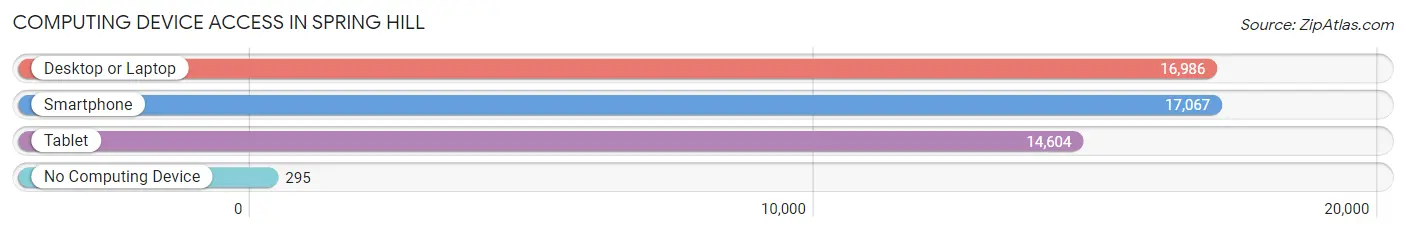
| Device Type | # Households | % Households |
| Desktop or Laptop | 16,986 | 95.1% |
| Smartphone | 17,067 | 95.5% |
| Tablet | 14,604 | 81.7% |
| No Computing Device | 295 | 1.7% |
| Total | 17,867 | 100.0% |
Internet Access in Spring Hill
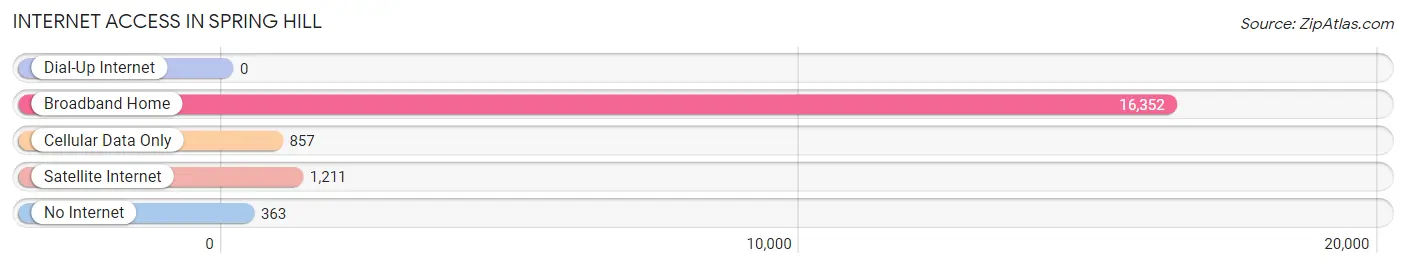
| Internet Type | # Households | % Households |
| Dial-Up Internet | 0 | 0.0% |
| Broadband Home | 16,352 | 91.5% |
| Cellular Data Only | 857 | 4.8% |
| Satellite Internet | 1,211 | 6.8% |
| No Internet | 363 | 2.0% |
| Total | 17,867 | 100.0% |
Spring Hill Summary
History
Spring Hill, Tennessee is a city located in Maury and Williamson counties in the state of Tennessee. It is part of the Nashville metropolitan area and is located about 30 miles south of Nashville. The city was founded in 1809 and was originally known as “Cross Plains”. The city was renamed in 1817 to Spring Hill after a nearby spring. The city was an important stop on the stagecoach route between Nashville and Natchez, Mississippi. The city was also an important stop on the railroad line between Nashville and Chattanooga.
The city was the site of a major Civil War battle in November 1864. The Battle of Spring Hill was fought between the Union and Confederate forces. The Union forces were victorious and the Confederate forces retreated to Franklin, Tennessee. The battle was part of the Franklin-Nashville Campaign and was an important victory for the Union forces.
The city was incorporated in 1867 and has grown steadily since then. The city has experienced a population boom in recent years due to its proximity to Nashville and its growing economy.
Geography
Spring Hill is located in Maury and Williamson counties in the state of Tennessee. It is part of the Nashville metropolitan area and is located about 30 miles south of Nashville. The city is situated on the western edge of the Nashville Basin and is surrounded by rolling hills and forests. The city is located at an elevation of 645 feet above sea level.
The city has a total area of 24.2 square miles, of which 24.1 square miles is land and 0.1 square miles is water. The city is located in the Central Time Zone and observes Daylight Saving Time.
Economy
Spring Hill has a diverse economy that is driven by manufacturing, healthcare, retail, and tourism. The city is home to several major employers, including General Motors, Nissan, and Vanderbilt University Medical Center. The city is also home to several smaller businesses and startups.
The city has a strong tourism industry, with visitors coming to the city to visit its historic sites, outdoor recreation areas, and cultural attractions. The city is also home to several annual festivals and events, including the Spring Hill Music Festival and the Spring Hill Art Festival.
Demographics
As of the 2010 census, the city had a population of 29,036. The racial makeup of the city was 87.3% White, 8.2% African American, 0.4% Native American, 1.2% Asian, 0.1% Pacific Islander, 1.2% from other races, and 1.7% from two or more races. Hispanic or Latino of any race were 3.7% of the population.
The median income for a household in the city was $63,945 and the median income for a family was $76,945. The per capita income for the city was $30,945. About 5.2% of families and 7.2% of the population were below the poverty line, including 8.2% of those under age 18 and 6.2% of those age 65 or over.
Common Questions
What is Per Capita Income in Spring Hill?
Per Capita income in Spring Hill is $42,724.
What is the Median Family Income in Spring Hill?
Median Family Income in Spring Hill is $113,926.
What is the Median Household income in Spring Hill?
Median Household Income in Spring Hill is $104,880.
What is Income or Wage Gap in Spring Hill?
Income or Wage Gap in Spring Hill is 40.7%.
Women in Spring Hill earn 59.3 cents for every dollar earned by a man.
What is Family Income Deficit in Spring Hill?
Family Income Deficit in Spring Hill is $5,387.
Families that are below poverty line in Spring Hill earn $5,387 less on average than the poverty threshold level.
What is Inequality or Gini Index in Spring Hill?
Inequality or Gini Index in Spring Hill is 0.36.
What is the Total Population of Spring Hill?
Total Population of Spring Hill is 51,319.
What is the Total Male Population of Spring Hill?
Total Male Population of Spring Hill is 25,869.
What is the Total Female Population of Spring Hill?
Total Female Population of Spring Hill is 25,450.
What is the Ratio of Males per 100 Females in Spring Hill?
There are 101.65 Males per 100 Females in Spring Hill.
What is the Ratio of Females per 100 Males in Spring Hill?
There are 98.38 Females per 100 Males in Spring Hill.
What is the Median Population Age in Spring Hill?
Median Population Age in Spring Hill is 35.6 Years.
What is the Average Family Size in Spring Hill
Average Family Size in Spring Hill is 3.2 People.
What is the Average Household Size in Spring Hill
Average Household Size in Spring Hill is 2.9 People.
How Large is the Labor Force in Spring Hill?
There are 27,304 People in the Labor Forcein in Spring Hill.
What is the Percentage of People in the Labor Force in Spring Hill?
72.7% of People are in the Labor Force in Spring Hill.
What is the Unemployment Rate in Spring Hill?
Unemployment Rate in Spring Hill is 1.1%.