Brownsville, TN Map & Demographics
Brownsville Map
Brownsville Overview
$22,379
PER CAPITA INCOME
$41,731
AVG FAMILY INCOME
$38,662
AVG HOUSEHOLD INCOME
28.4%
WAGE / INCOME GAP [ % ]
71.6¢/ $1
WAGE / INCOME GAP [ $ ]
$9,893
FAMILY INCOME DEFICIT
0.48
INEQUALITY / GINI INDEX
9,739
TOTAL POPULATION
4,506
MALE POPULATION
5,233
FEMALE POPULATION
86.11
MALES / 100 FEMALES
116.13
FEMALES / 100 MALES
41.1
MEDIAN AGE
3.2
AVG FAMILY SIZE
2.5
AVG HOUSEHOLD SIZE
4,418
LABOR FORCE [ PEOPLE ]
57.5%
PERCENT IN LABOR FORCE
11.5%
UNEMPLOYMENT RATE
Brownsville Zip Codes
Brownsville Area Codes
Income in Brownsville
Income Overview in Brownsville
Per Capita Income in Brownsville is $22,379, while median incomes of families and households are $41,731 and $38,662 respectively.
| Characteristic | Number | Measure |
| Per Capita Income | 9,739 | $22,379 |
| Median Family Income | 2,330 | $41,731 |
| Mean Family Income | 2,330 | $61,403 |
| Median Household Income | 3,934 | $38,662 |
| Mean Household Income | 3,934 | $51,684 |
| Income Deficit | 2,330 | $9,893 |
| Wage / Income Gap (%) | 9,739 | 28.41% |
| Wage / Income Gap ($) | 9,739 | 71.59¢ per $1 |
| Gini / Inequality Index | 9,739 | 0.48 |
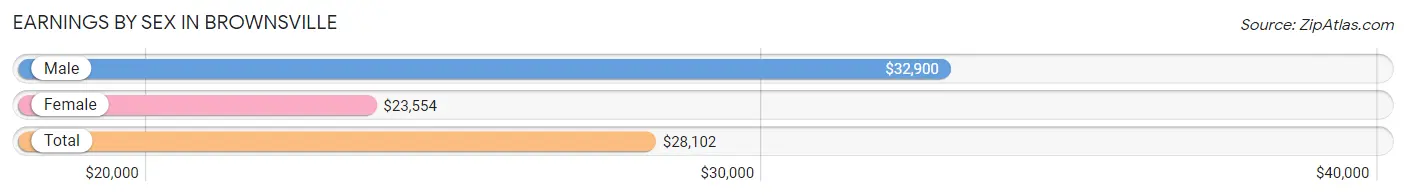
Earnings by Sex in Brownsville
Average Earnings in Brownsville are $28,102, $32,900 for men and $23,554 for women, a difference of 28.4%.
| Sex | Number | Average Earnings |
| Male | 2,292 (49.5%) | $32,900 |
| Female | 2,340 (50.5%) | $23,554 |
| Total | 4,632 (100.0%) | $28,102 |
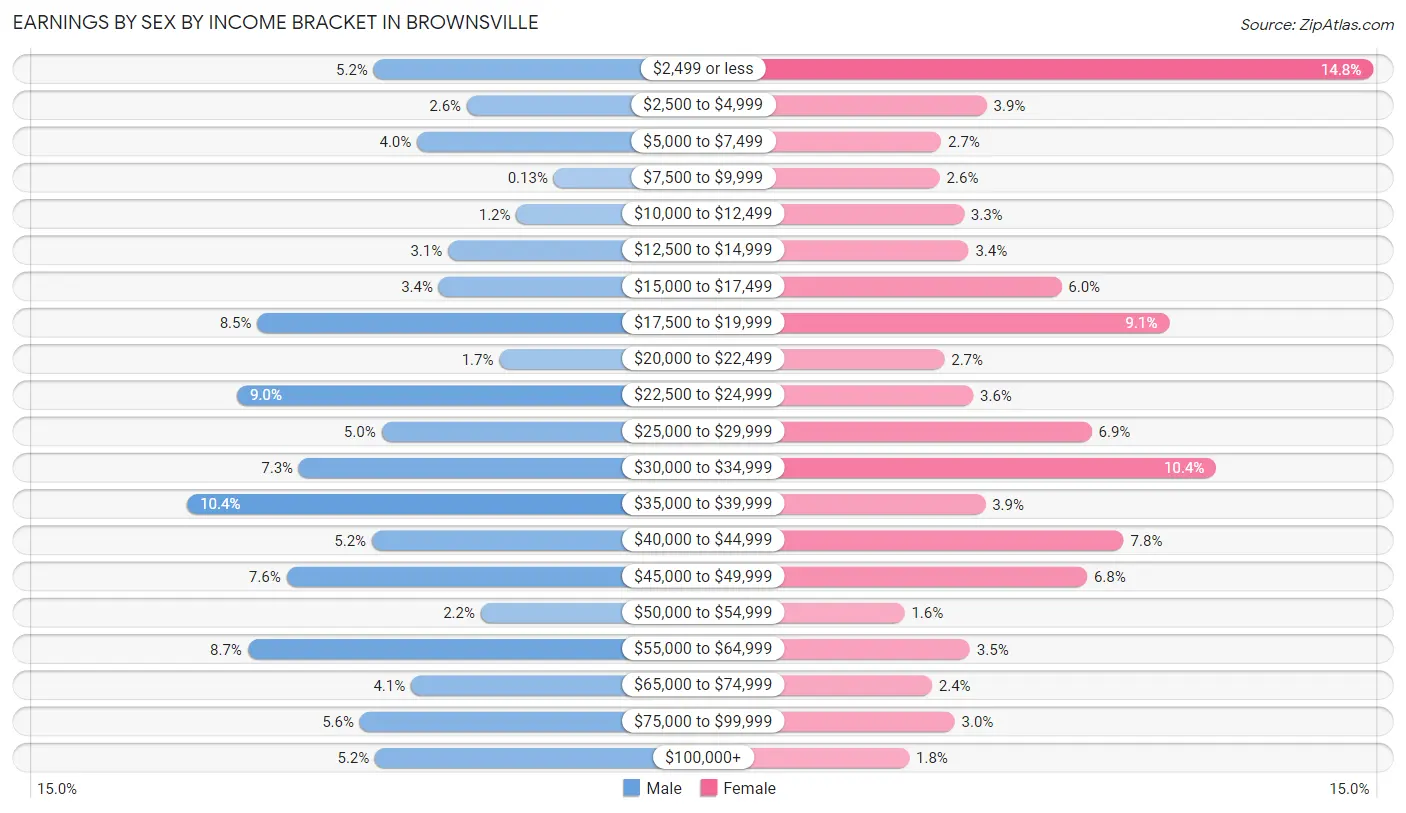
Earnings by Sex by Income Bracket in Brownsville
The most common earnings brackets in Brownsville are $35,000 to $39,999 for men (239 | 10.4%) and $2,499 or less for women (346 | 14.8%).
| Income | Male | Female |
| $2,499 or less | 119 (5.2%) | 346 (14.8%) |
| $2,500 to $4,999 | 59 (2.6%) | 92 (3.9%) |
| $5,000 to $7,499 | 91 (4.0%) | 62 (2.6%) |
| $7,500 to $9,999 | 3 (0.1%) | 61 (2.6%) |
| $10,000 to $12,499 | 27 (1.2%) | 77 (3.3%) |
| $12,500 to $14,999 | 71 (3.1%) | 80 (3.4%) |
| $15,000 to $17,499 | 77 (3.4%) | 141 (6.0%) |
| $17,500 to $19,999 | 194 (8.5%) | 212 (9.1%) |
| $20,000 to $22,499 | 38 (1.7%) | 64 (2.7%) |
| $22,500 to $24,999 | 207 (9.0%) | 83 (3.5%) |
| $25,000 to $29,999 | 114 (5.0%) | 161 (6.9%) |
| $30,000 to $34,999 | 167 (7.3%) | 243 (10.4%) |
| $35,000 to $39,999 | 239 (10.4%) | 91 (3.9%) |
| $40,000 to $44,999 | 120 (5.2%) | 182 (7.8%) |
| $45,000 to $49,999 | 175 (7.6%) | 158 (6.8%) |
| $50,000 to $54,999 | 50 (2.2%) | 38 (1.6%) |
| $55,000 to $64,999 | 200 (8.7%) | 81 (3.5%) |
| $65,000 to $74,999 | 95 (4.1%) | 56 (2.4%) |
| $75,000 to $99,999 | 128 (5.6%) | 71 (3.0%) |
| $100,000+ | 118 (5.1%) | 41 (1.8%) |
| Total | 2,292 (100.0%) | 2,340 (100.0%) |
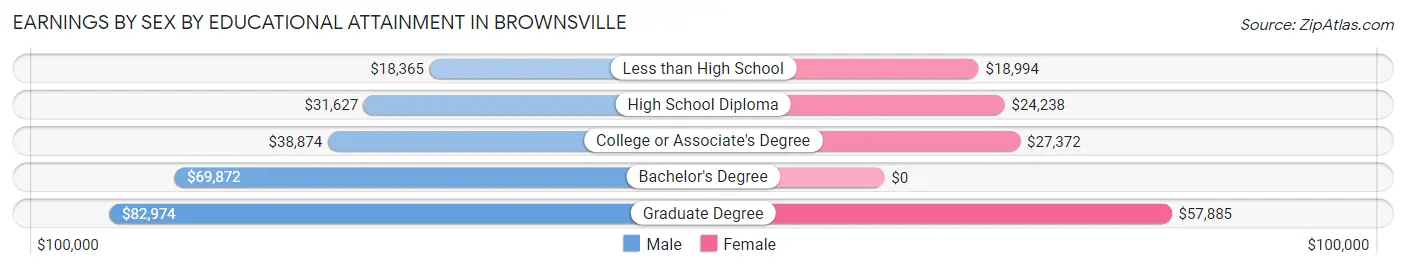
Earnings by Sex by Educational Attainment in Brownsville
Average earnings in Brownsville are $36,773 for men and $27,149 for women, a difference of 26.2%. Men with an educational attainment of graduate degree enjoy the highest average annual earnings of $82,974, while those with less than high school education earn the least with $18,365. Women with an educational attainment of graduate degree earn the most with the average annual earnings of $57,885, while those with less than high school education have the smallest earnings of $18,994.
| Educational Attainment | Male Income | Female Income |
| Less than High School | $18,365 | $18,994 |
| High School Diploma | $31,627 | $24,238 |
| College or Associate's Degree | $38,874 | $27,372 |
| Bachelor's Degree | $69,872 | $0 |
| Graduate Degree | $82,974 | $57,885 |
| Total | $36,773 | $27,149 |
Family Income in Brownsville
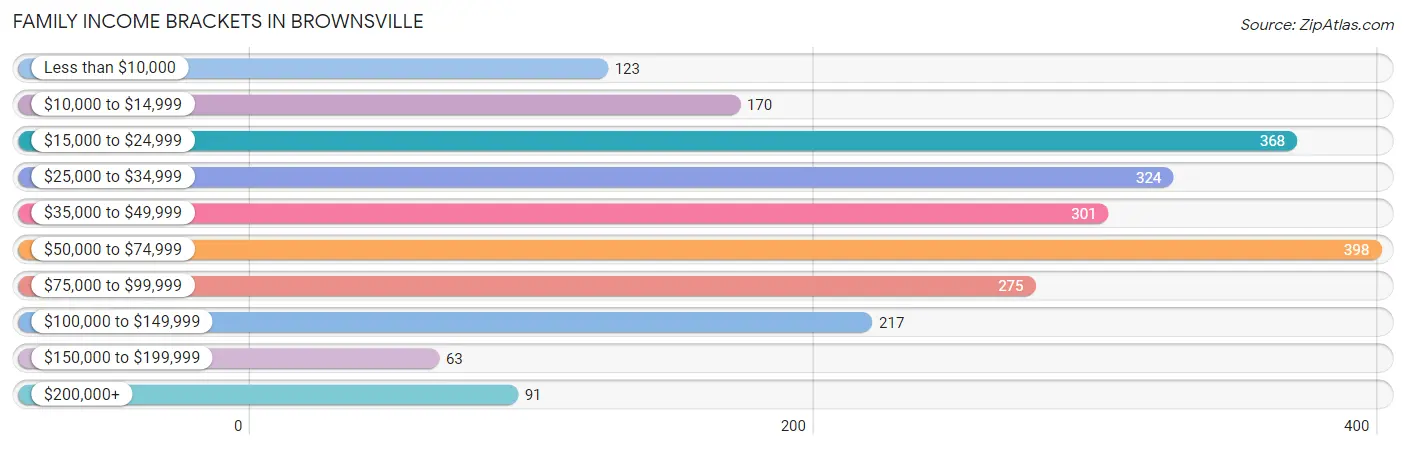
Family Income Brackets in Brownsville
According to the Brownsville family income data, there are 398 families falling into the $50,000 to $74,999 income range, which is the most common income bracket and makes up 17.1% of all families. Conversely, the $150,000 to $199,999 income bracket is the least frequent group with only 63 families (2.7%) belonging to this category.
| Income Bracket | # Families | % Families |
| Less than $10,000 | 123 | 5.3% |
| $10,000 to $14,999 | 170 | 7.3% |
| $15,000 to $24,999 | 368 | 15.8% |
| $25,000 to $34,999 | 324 | 13.9% |
| $35,000 to $49,999 | 301 | 12.9% |
| $50,000 to $74,999 | 398 | 17.1% |
| $75,000 to $99,999 | 275 | 11.8% |
| $100,000 to $149,999 | 217 | 9.3% |
| $150,000 to $199,999 | 63 | 2.7% |
| $200,000+ | 91 | 3.9% |
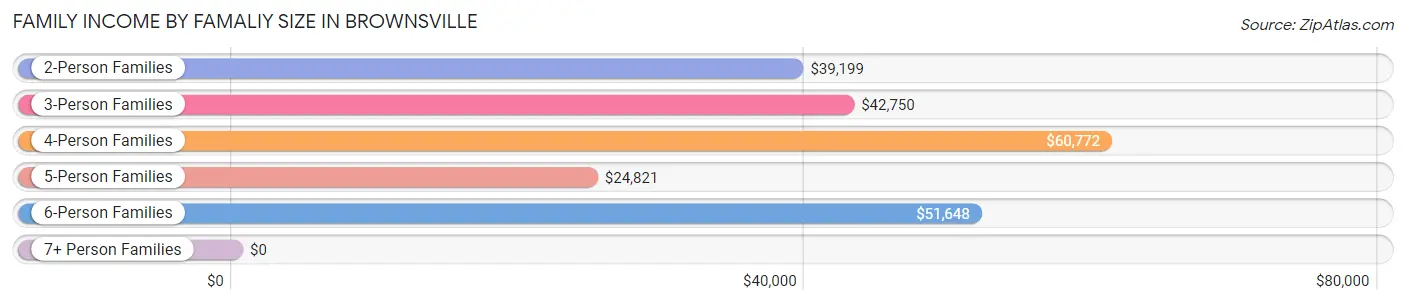
Family Income by Famaliy Size in Brownsville
4-person families (367 | 15.8%) account for the highest median family income in Brownsville with $60,772 per family, while 2-person families (1,179 | 50.6%) have the highest median income of $19,600 per family member.
| Income Bracket | # Families | Median Income |
| 2-Person Families | 1,179 (50.6%) | $39,199 |
| 3-Person Families | 544 (23.4%) | $42,750 |
| 4-Person Families | 367 (15.8%) | $60,772 |
| 5-Person Families | 129 (5.5%) | $24,821 |
| 6-Person Families | 73 (3.1%) | $51,648 |
| 7+ Person Families | 38 (1.6%) | $0 |
| Total | 2,330 (100.0%) | $41,731 |
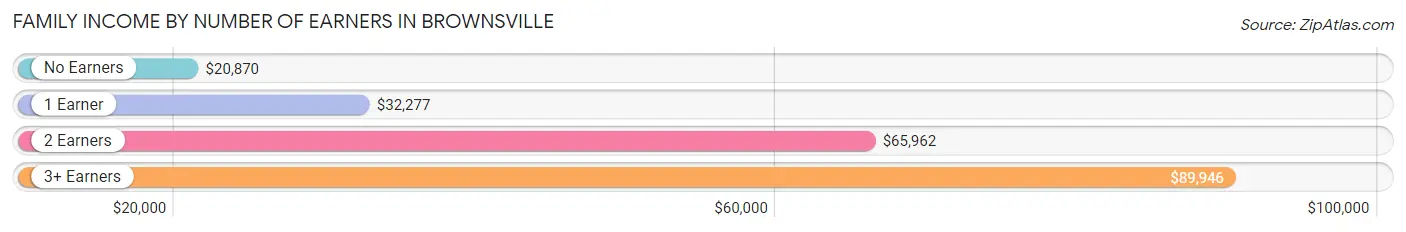
Family Income by Number of Earners in Brownsville
The median family income in Brownsville is $41,731, with families comprising 3+ earners (215) having the highest median family income of $89,946, while families with no earners (552) have the lowest median family income of $20,870, accounting for 9.2% and 23.7% of families, respectively.
| Number of Earners | # Families | Median Income |
| No Earners | 552 (23.7%) | $20,870 |
| 1 Earner | 821 (35.2%) | $32,277 |
| 2 Earners | 742 (31.9%) | $65,962 |
| 3+ Earners | 215 (9.2%) | $89,946 |
| Total | 2,330 (100.0%) | $41,731 |
Household Income in Brownsville
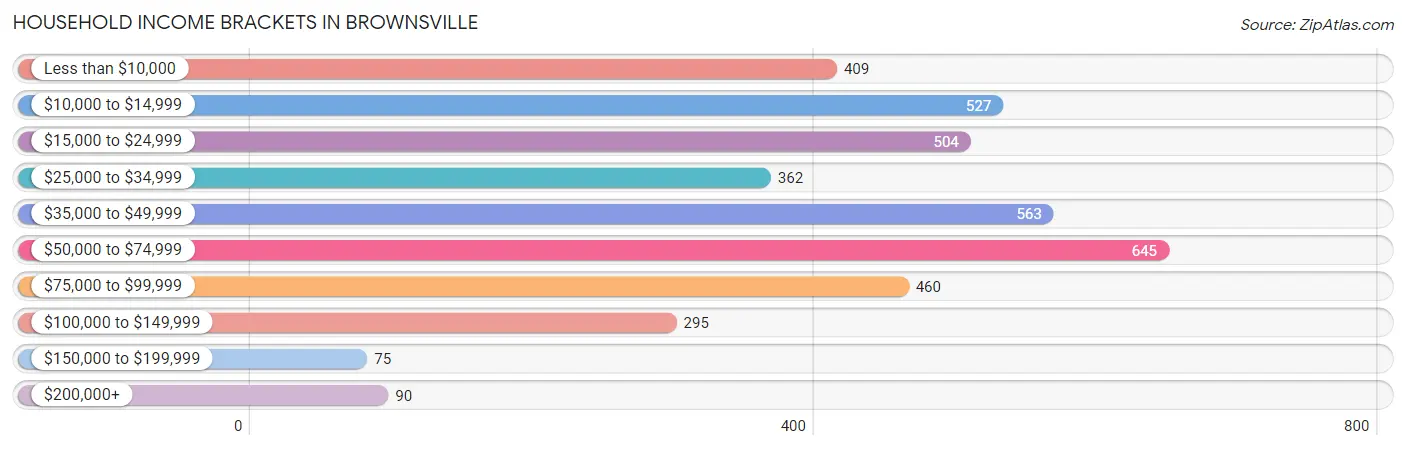
Household Income Brackets in Brownsville
With 645 households falling in the category, the $50,000 to $74,999 income range is the most frequent in Brownsville, accounting for 16.4% of all households. In contrast, only 75 households (1.9%) fall into the $150,000 to $199,999 income bracket, making it the least populous group.
| Income Bracket | # Households | % Households |
| Less than $10,000 | 409 | 10.4% |
| $10,000 to $14,999 | 527 | 13.4% |
| $15,000 to $24,999 | 504 | 12.8% |
| $25,000 to $34,999 | 362 | 9.2% |
| $35,000 to $49,999 | 563 | 14.3% |
| $50,000 to $74,999 | 645 | 16.4% |
| $75,000 to $99,999 | 460 | 11.7% |
| $100,000 to $149,999 | 295 | 7.5% |
| $150,000 to $199,999 | 75 | 1.9% |
| $200,000+ | 90 | 2.3% |
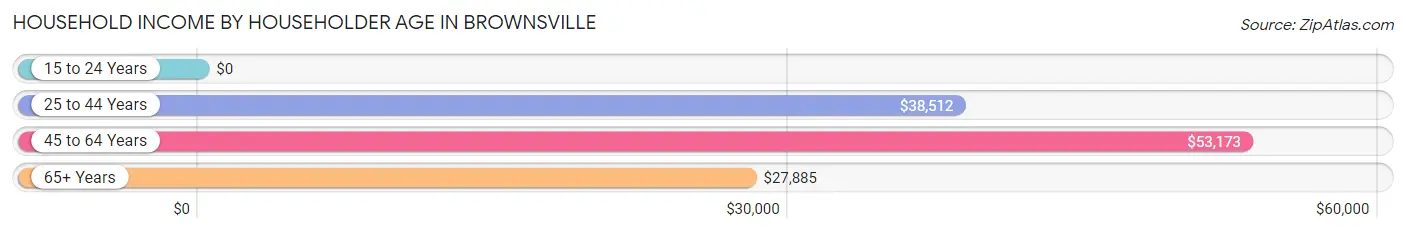
Household Income by Householder Age in Brownsville
The median household income in Brownsville is $38,662, with the highest median household income of $53,173 found in the 45 to 64 years age bracket for the primary householder. A total of 1,627 households (41.4%) fall into this category. Meanwhile, the 15 to 24 years age bracket for the primary householder has the lowest median household income of $0, with 88 households (2.2%) in this group.
| Income Bracket | # Households | Median Income |
| 15 to 24 Years | 88 (2.2%) | $0 |
| 25 to 44 Years | 1,115 (28.3%) | $38,512 |
| 45 to 64 Years | 1,627 (41.4%) | $53,173 |
| 65+ Years | 1,104 (28.1%) | $27,885 |
| Total | 3,934 (100.0%) | $38,662 |
Poverty in Brownsville
Income Below Poverty by Sex and Age in Brownsville
With 25.5% poverty level for males and 30.2% for females among the residents of Brownsville, under 5 year old males and under 5 year old females are the most vulnerable to poverty, with 214 males (73.8%) and 168 females (54.7%) in their respective age groups living below the poverty level.
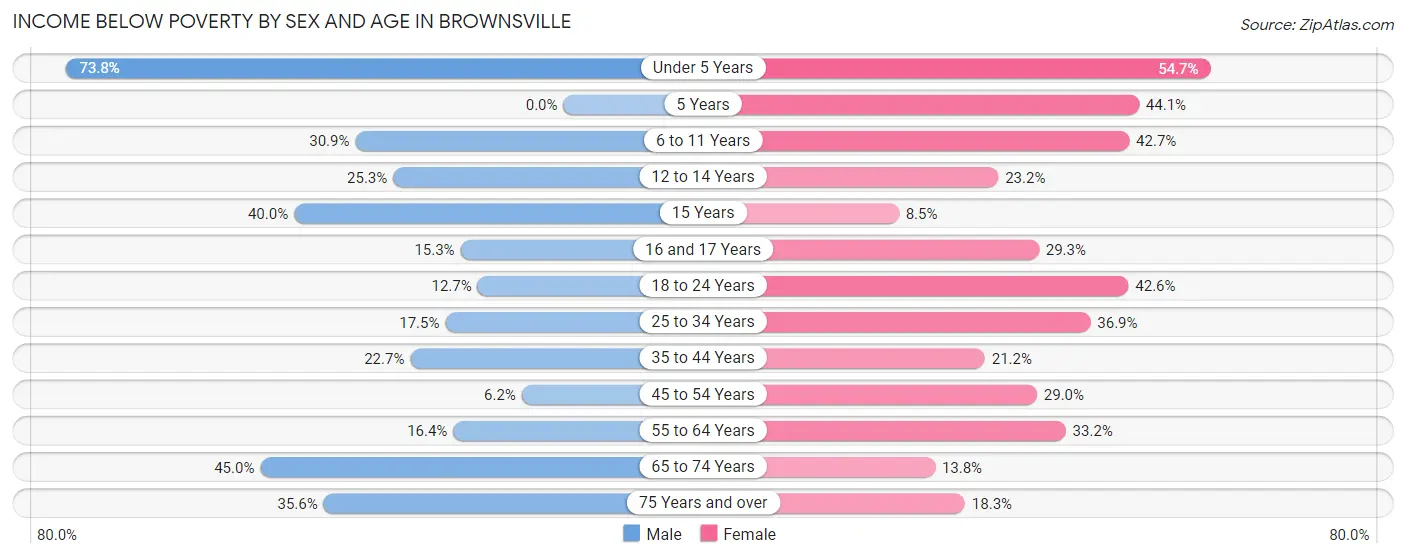
| Age Bracket | Male | Female |
| Under 5 Years | 214 (73.8%) | 168 (54.7%) |
| 5 Years | 0 (0.0%) | 45 (44.1%) |
| 6 to 11 Years | 114 (30.9%) | 128 (42.7%) |
| 12 to 14 Years | 68 (25.3%) | 46 (23.2%) |
| 15 Years | 50 (40.0%) | 6 (8.5%) |
| 16 and 17 Years | 11 (15.3%) | 62 (29.2%) |
| 18 to 24 Years | 47 (12.7%) | 137 (42.5%) |
| 25 to 34 Years | 108 (17.5%) | 258 (36.9%) |
| 35 to 44 Years | 123 (22.7%) | 131 (21.2%) |
| 45 to 54 Years | 35 (6.2%) | 188 (29.0%) |
| 55 to 64 Years | 97 (16.4%) | 234 (33.2%) |
| 65 to 74 Years | 194 (45.0%) | 70 (13.8%) |
| 75 Years and over | 73 (35.6%) | 87 (18.3%) |
| Total | 1,134 (25.5%) | 1,560 (30.2%) |
Income Above Poverty by Sex and Age in Brownsville
According to the poverty statistics in Brownsville, males aged 45 to 54 years and females aged 15 years are the age groups that are most secure financially, with 93.8% of males and 91.5% of females in these age groups living above the poverty line.
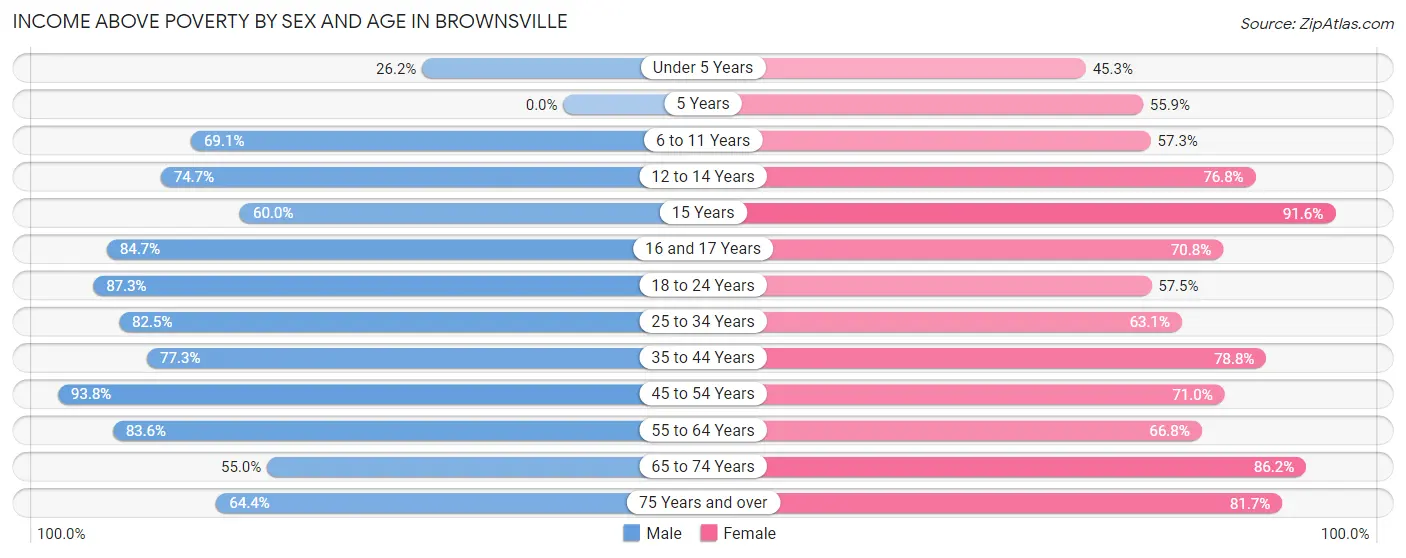
| Age Bracket | Male | Female |
| Under 5 Years | 76 (26.2%) | 139 (45.3%) |
| 5 Years | 0 (0.0%) | 57 (55.9%) |
| 6 to 11 Years | 255 (69.1%) | 172 (57.3%) |
| 12 to 14 Years | 201 (74.7%) | 152 (76.8%) |
| 15 Years | 75 (60.0%) | 65 (91.5%) |
| 16 and 17 Years | 61 (84.7%) | 150 (70.8%) |
| 18 to 24 Years | 322 (87.3%) | 185 (57.5%) |
| 25 to 34 Years | 508 (82.5%) | 441 (63.1%) |
| 35 to 44 Years | 418 (77.3%) | 486 (78.8%) |
| 45 to 54 Years | 530 (93.8%) | 461 (71.0%) |
| 55 to 64 Years | 496 (83.6%) | 470 (66.8%) |
| 65 to 74 Years | 237 (55.0%) | 436 (86.2%) |
| 75 Years and over | 132 (64.4%) | 389 (81.7%) |
| Total | 3,311 (74.5%) | 3,603 (69.8%) |
Income Below Poverty Among Married-Couple Families in Brownsville
The poverty statistics for married-couple families in Brownsville show that 13.0% or 145 of the total 1,115 families live below the poverty line. Families with 3 or 4 children have the highest poverty rate of 49.3%, comprising of 35 families. On the other hand, families with no children have the lowest poverty rate of 5.4%, which includes 40 families.
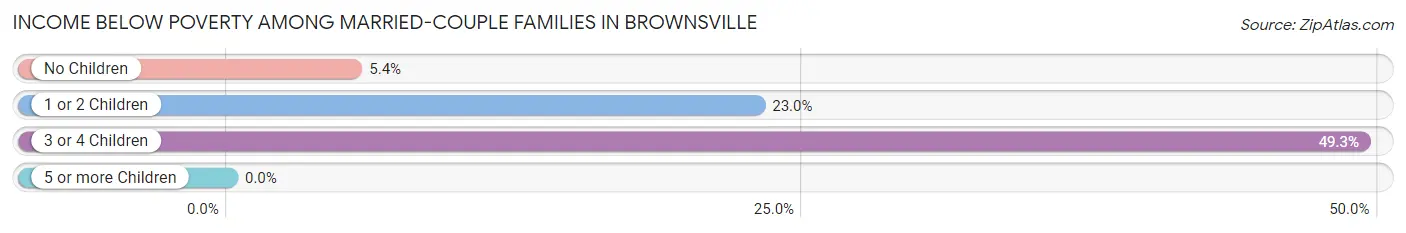
| Children | Above Poverty | Below Poverty |
| No Children | 699 (94.6%) | 40 (5.4%) |
| 1 or 2 Children | 235 (77.0%) | 70 (23.0%) |
| 3 or 4 Children | 36 (50.7%) | 35 (49.3%) |
| 5 or more Children | 0 (0.0%) | 0 (0.0%) |
| Total | 970 (87.0%) | 145 (13.0%) |
Income Below Poverty Among Single-Parent Households in Brownsville
According to the poverty data in Brownsville, 25.9% or 68 single-father households and 37.0% or 352 single-mother households are living below the poverty line. Among single-father households, those with 5 or more children have the highest poverty rate, with 22 households (100.0%) experiencing poverty. Likewise, among single-mother households, those with 5 or more children have the highest poverty rate, with 15 households (55.6%) falling below the poverty line.
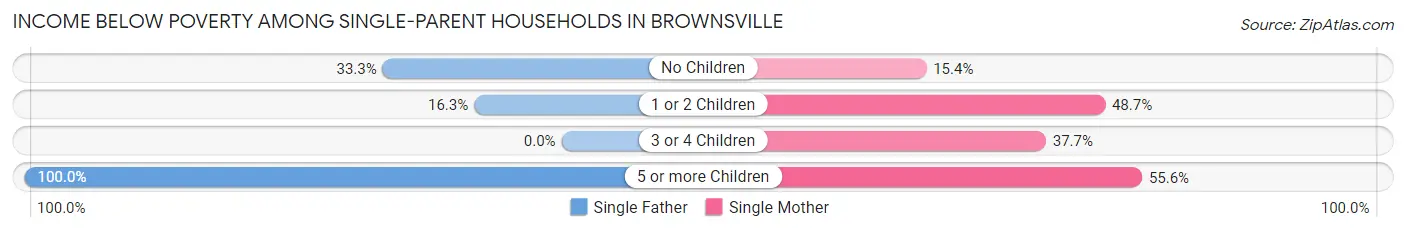
| Children | Single Father | Single Mother |
| No Children | 32 (33.3%) | 48 (15.4%) |
| 1 or 2 Children | 14 (16.3%) | 257 (48.7%) |
| 3 or 4 Children | 0 (0.0%) | 32 (37.7%) |
| 5 or more Children | 22 (100.0%) | 15 (55.6%) |
| Total | 68 (25.9%) | 352 (37.0%) |
Income Below Poverty Among Married-Couple vs Single-Parent Households in Brownsville
The poverty data for Brownsville shows that 145 of the married-couple family households (13.0%) and 420 of the single-parent households (34.6%) are living below the poverty level. Within the married-couple family households, those with 3 or 4 children have the highest poverty rate, with 35 households (49.3%) falling below the poverty line. Among the single-parent households, those with 5 or more children have the highest poverty rate, with 37 household (75.5%) living below poverty.
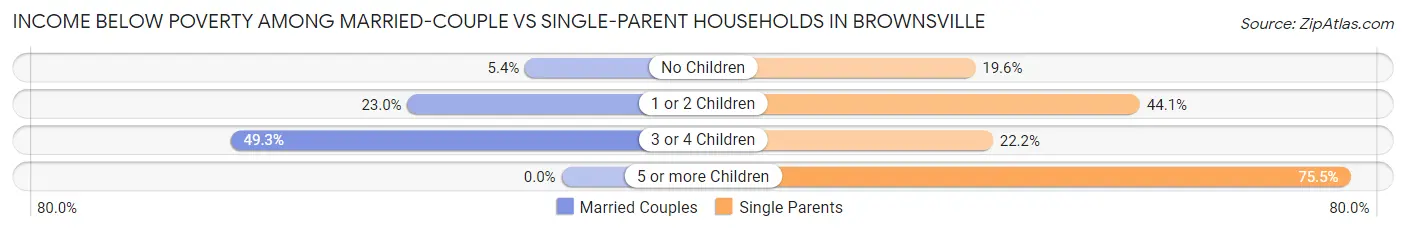
| Children | Married-Couple Families | Single-Parent Households |
| No Children | 40 (5.4%) | 80 (19.6%) |
| 1 or 2 Children | 70 (23.0%) | 271 (44.1%) |
| 3 or 4 Children | 35 (49.3%) | 32 (22.2%) |
| 5 or more Children | 0 (0.0%) | 37 (75.5%) |
| Total | 145 (13.0%) | 420 (34.6%) |
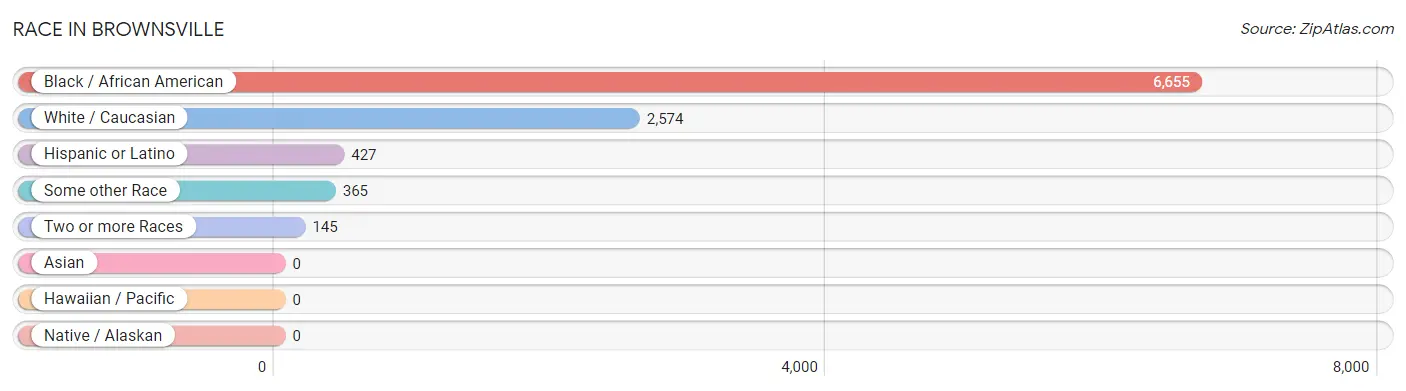
Race in Brownsville
The most populous races in Brownsville are Black / African American (6,655 | 68.3%), White / Caucasian (2,574 | 26.4%), and Hispanic or Latino (427 | 4.4%).
| Race | # Population | % Population |
| Asian | 0 | 0.0% |
| Black / African American | 6,655 | 68.3% |
| Hawaiian / Pacific | 0 | 0.0% |
| Hispanic or Latino | 427 | 4.4% |
| Native / Alaskan | 0 | 0.0% |
| White / Caucasian | 2,574 | 26.4% |
| Two or more Races | 145 | 1.5% |
| Some other Race | 365 | 3.7% |
| Total | 9,739 | 100.0% |
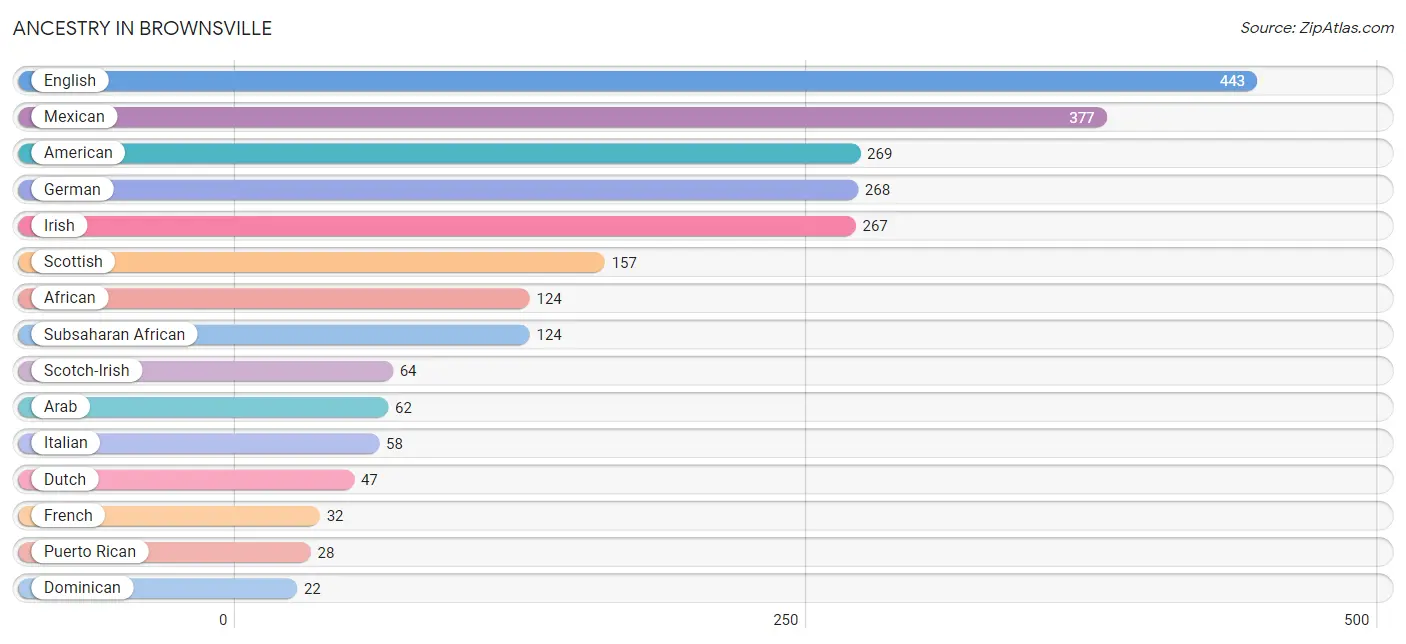
Ancestry in Brownsville
The most populous ancestries reported in Brownsville are English (443 | 4.5%), Mexican (377 | 3.9%), American (269 | 2.8%), German (268 | 2.8%), and Irish (267 | 2.7%), together accounting for 16.7% of all Brownsville residents.
| Ancestry | # Population | % Population |
| African | 124 | 1.3% |
| American | 269 | 2.8% |
| Arab | 62 | 0.6% |
| British | 6 | 0.1% |
| Canadian | 10 | 0.1% |
| Cherokee | 8 | 0.1% |
| Danish | 6 | 0.1% |
| Dominican | 22 | 0.2% |
| Dutch | 47 | 0.5% |
| English | 443 | 4.5% |
| French | 32 | 0.3% |
| German | 268 | 2.8% |
| Irish | 267 | 2.7% |
| Italian | 58 | 0.6% |
| Mexican | 377 | 3.9% |
| Norwegian | 6 | 0.1% |
| Polish | 7 | 0.1% |
| Puerto Rican | 28 | 0.3% |
| Scandinavian | 16 | 0.2% |
| Scotch-Irish | 64 | 0.7% |
| Scottish | 157 | 1.6% |
| Subsaharan African | 124 | 1.3% |
| Swedish | 9 | 0.1% |
| Welsh | 12 | 0.1% | View All 24 Rows |
Immigrants in Brownsville
The most numerous immigrant groups reported in Brownsville came from Central America (170 | 1.8%), Latin America (170 | 1.8%), Mexico (170 | 1.8%), Asia (62 | 0.6%), and Western Asia (62 | 0.6%), together accounting for 6.5% of all Brownsville residents.
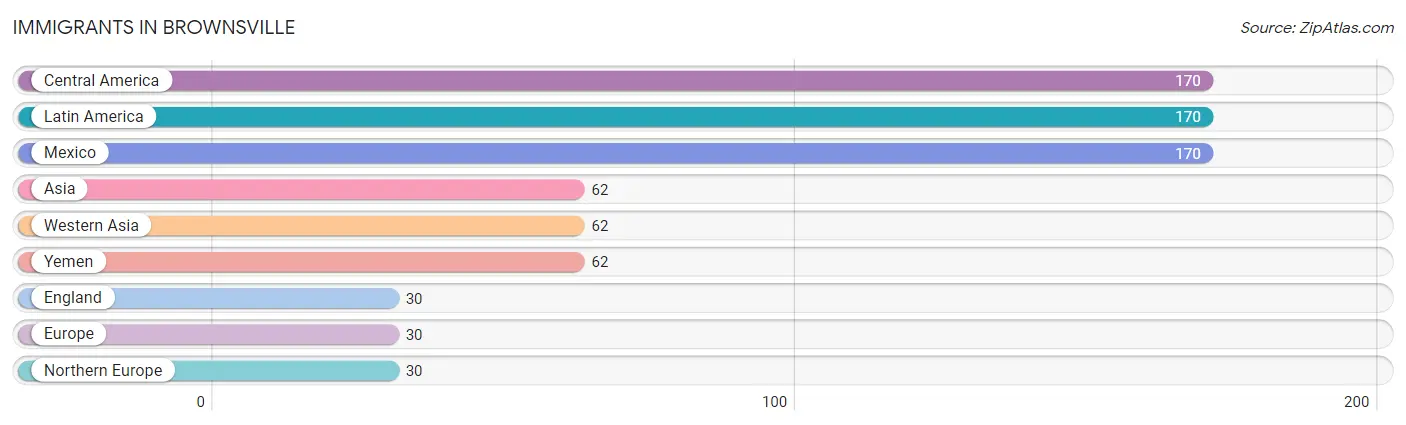
| Immigration Origin | # Population | % Population |
| Asia | 62 | 0.6% |
| Central America | 170 | 1.8% |
| England | 30 | 0.3% |
| Europe | 30 | 0.3% |
| Latin America | 170 | 1.8% |
| Mexico | 170 | 1.8% |
| Northern Europe | 30 | 0.3% |
| Western Asia | 62 | 0.6% |
| Yemen | 62 | 0.6% | View All 9 Rows |
Sex and Age in Brownsville
Sex and Age in Brownsville
The most populous age groups in Brownsville are 50 to 54 Years (382 | 8.5%) for men and 60 to 64 Years (389 | 7.4%) for women.
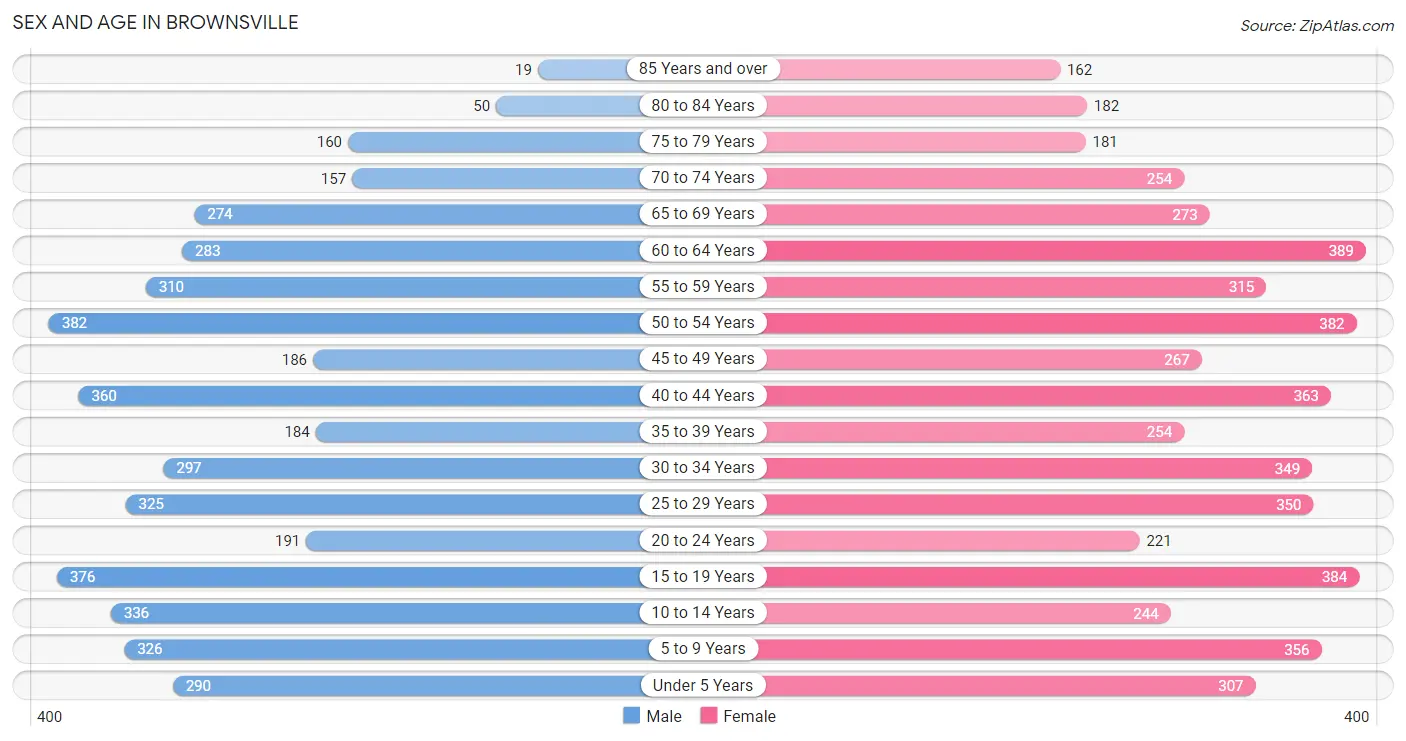
| Age Bracket | Male | Female |
| Under 5 Years | 290 (6.4%) | 307 (5.9%) |
| 5 to 9 Years | 326 (7.2%) | 356 (6.8%) |
| 10 to 14 Years | 336 (7.5%) | 244 (4.7%) |
| 15 to 19 Years | 376 (8.3%) | 384 (7.3%) |
| 20 to 24 Years | 191 (4.2%) | 221 (4.2%) |
| 25 to 29 Years | 325 (7.2%) | 350 (6.7%) |
| 30 to 34 Years | 297 (6.6%) | 349 (6.7%) |
| 35 to 39 Years | 184 (4.1%) | 254 (4.9%) |
| 40 to 44 Years | 360 (8.0%) | 363 (6.9%) |
| 45 to 49 Years | 186 (4.1%) | 267 (5.1%) |
| 50 to 54 Years | 382 (8.5%) | 382 (7.3%) |
| 55 to 59 Years | 310 (6.9%) | 315 (6.0%) |
| 60 to 64 Years | 283 (6.3%) | 389 (7.4%) |
| 65 to 69 Years | 274 (6.1%) | 273 (5.2%) |
| 70 to 74 Years | 157 (3.5%) | 254 (4.9%) |
| 75 to 79 Years | 160 (3.5%) | 181 (3.5%) |
| 80 to 84 Years | 50 (1.1%) | 182 (3.5%) |
| 85 Years and over | 19 (0.4%) | 162 (3.1%) |
| Total | 4,506 (100.0%) | 5,233 (100.0%) |
Families and Households in Brownsville
Median Family Size in Brownsville
The median family size in Brownsville is 3.20 persons per family, with single male/father families (263 | 11.3%) accounting for the largest median family size of 3.98 persons per family. On the other hand, married-couple families (1,115 | 47.8%) represent the smallest median family size with 3.10 persons per family.
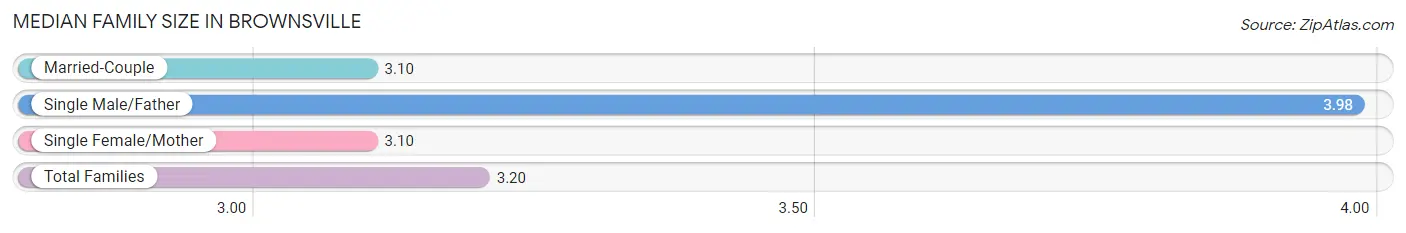
| Family Type | # Families | Family Size |
| Married-Couple | 1,115 (47.8%) | 3.10 |
| Single Male/Father | 263 (11.3%) | 3.98 |
| Single Female/Mother | 952 (40.9%) | 3.10 |
| Total Families | 2,330 (100.0%) | 3.20 |
Median Household Size in Brownsville
The median household size in Brownsville is 2.45 persons per household, with single male/father households (263 | 6.7%) accounting for the largest median household size of 4.74 persons per household. non-family households (1,604 | 40.8%) represent the smallest median household size with 1.10 persons per household.
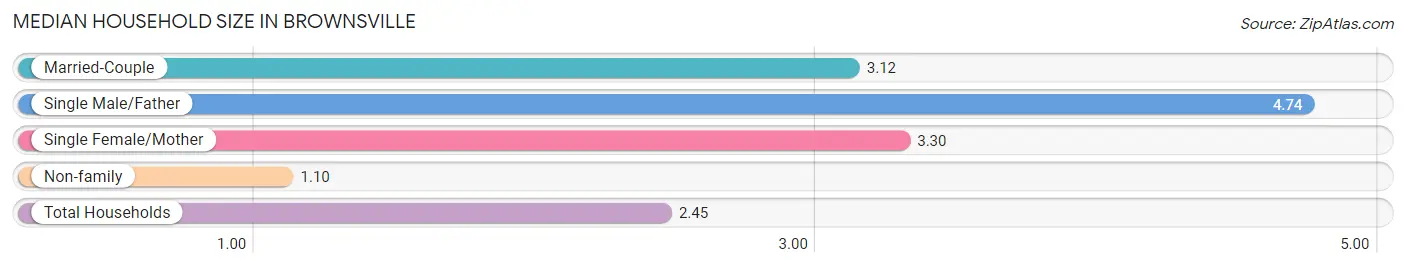
| Household Type | # Households | Household Size |
| Married-Couple | 1,115 (28.3%) | 3.12 |
| Single Male/Father | 263 (6.7%) | 4.74 |
| Single Female/Mother | 952 (24.2%) | 3.30 |
| Non-family | 1,604 (40.8%) | 1.10 |
| Total Households | 3,934 (100.0%) | 2.45 |
Household Size by Marriage Status in Brownsville
Out of a total of 3,934 households in Brownsville, 2,330 (59.2%) are family households, while 1,604 (40.8%) are nonfamily households. The most numerous type of family households are 2-person households, comprising 1,062, and the most common type of nonfamily households are 1-person households, comprising 1,462.
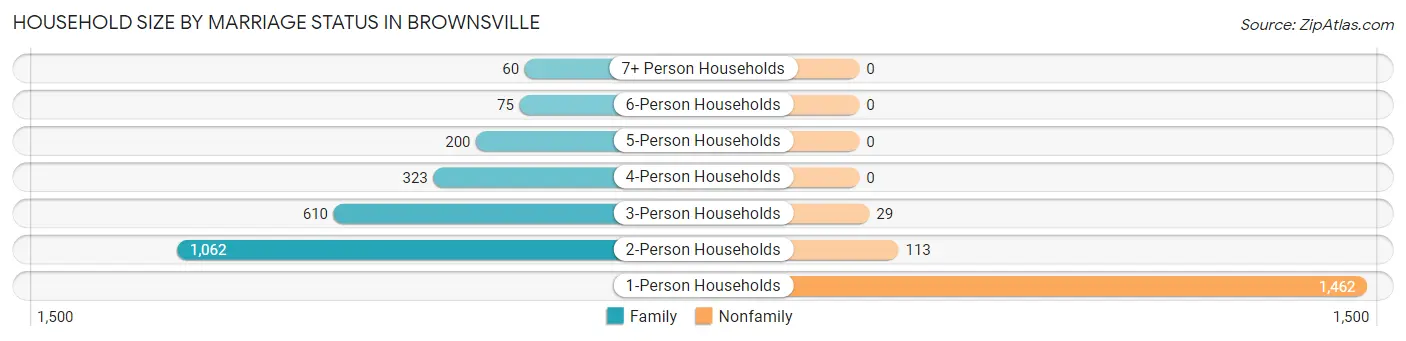
| Household Size | Family Households | Nonfamily Households |
| 1-Person Households | - | 1,462 (37.2%) |
| 2-Person Households | 1,062 (27.0%) | 113 (2.9%) |
| 3-Person Households | 610 (15.5%) | 29 (0.7%) |
| 4-Person Households | 323 (8.2%) | 0 (0.0%) |
| 5-Person Households | 200 (5.1%) | 0 (0.0%) |
| 6-Person Households | 75 (1.9%) | 0 (0.0%) |
| 7+ Person Households | 60 (1.5%) | 0 (0.0%) |
| Total | 2,330 (59.2%) | 1,604 (40.8%) |
Female Fertility in Brownsville
Fertility by Age in Brownsville
Average fertility rate in Brownsville is 49.0 births per 1,000 women. Women in the age bracket of 20 to 34 years have the highest fertility rate with 118.0 births per 1,000 women. Women in the age bracket of 20 to 34 years acount for 100.0% of all women with births.
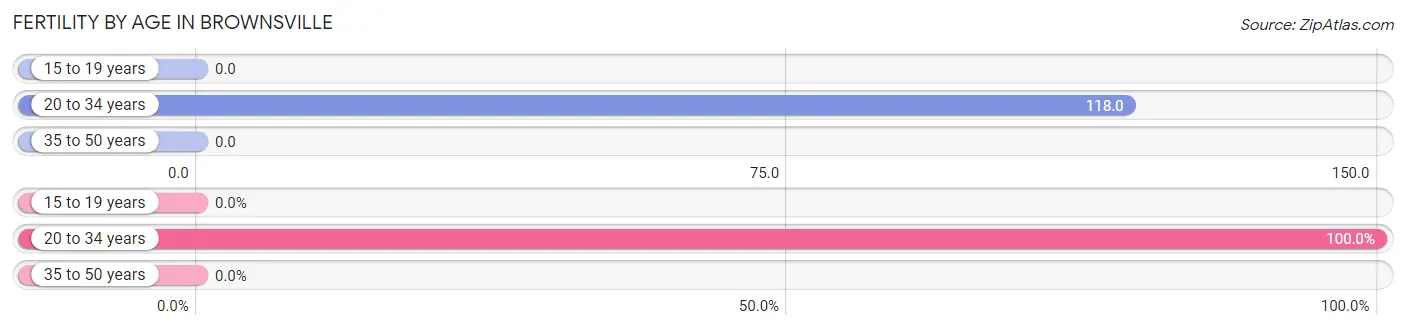
| Age Bracket | Women with Births | Births / 1,000 Women |
| 15 to 19 years | 0 (0.0%) | 0.0 |
| 20 to 34 years | 109 (100.0%) | 118.0 |
| 35 to 50 years | 0 (0.0%) | 0.0 |
| Total | 109 (100.0%) | 49.0 |
Fertility by Age by Marriage Status in Brownsville
49.5% of women with births (109) in Brownsville are married. The highest percentage of unmarried women with births falls into 20 to 34 years age bracket with 50.5% of them unmarried at the time of birth, while the lowest percentage of unmarried women with births belong to 20 to 34 years age bracket with 50.5% of them unmarried.
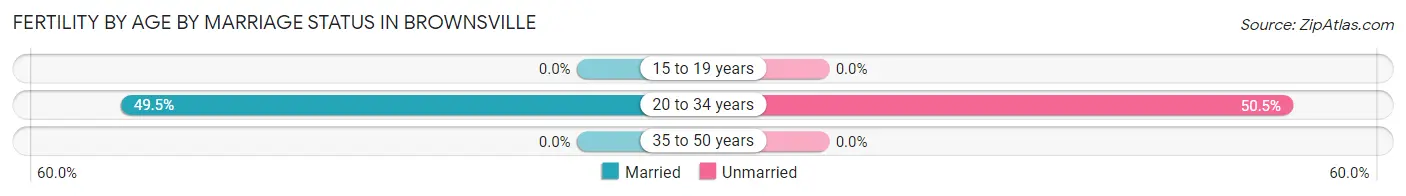
| Age Bracket | Married | Unmarried |
| 15 to 19 years | 0 (0.0%) | 0 (0.0%) |
| 20 to 34 years | 54 (49.5%) | 55 (50.5%) |
| 35 to 50 years | 0 (0.0%) | 0 (0.0%) |
| Total | 54 (49.5%) | 55 (50.5%) |
Fertility by Education in Brownsville
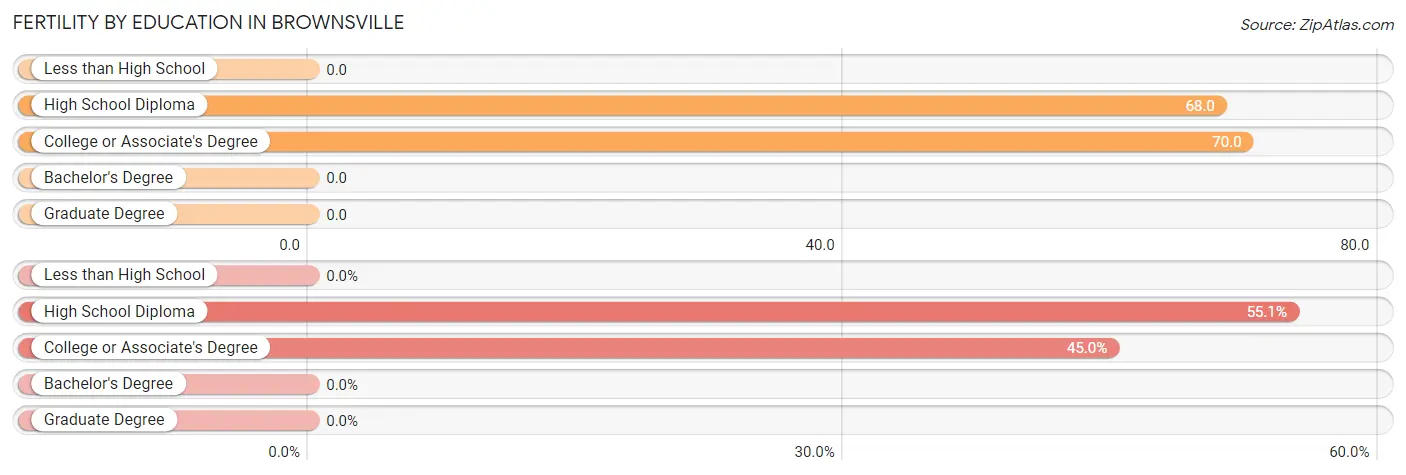
| Educational Attainment | Women with Births | Births / 1,000 Women |
| Less than High School | 0 (0.0%) | 0.0 |
| High School Diploma | 60 (55.0%) | 68.0 |
| College or Associate's Degree | 49 (45.0%) | 70.0 |
| Bachelor's Degree | 0 (0.0%) | 0.0 |
| Graduate Degree | 0 (0.0%) | 0.0 |
| Total | 109 (100.0%) | 49.0 |
Fertility by Education by Marriage Status in Brownsville
50.5% of women with births in Brownsville are unmarried. Women with the educational attainment of high school diploma are most likely to be married with 90.0% of them married at childbirth, while women with the educational attainment of college or associate's degree are least likely to be married with 100.0% of them unmarried at childbirth.
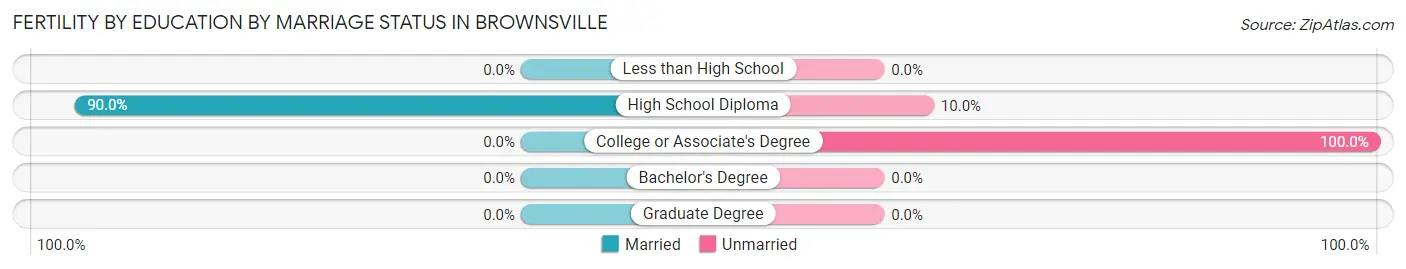
| Educational Attainment | Married | Unmarried |
| Less than High School | 0 (0.0%) | 0 (0.0%) |
| High School Diploma | 54 (90.0%) | 6 (10.0%) |
| College or Associate's Degree | 0 (0.0%) | 49 (100.0%) |
| Bachelor's Degree | 0 (0.0%) | 0 (0.0%) |
| Graduate Degree | 0 (0.0%) | 0 (0.0%) |
| Total | 54 (49.5%) | 55 (50.5%) |
Employment Characteristics in Brownsville
Employment by Class of Employer in Brownsville
Among the 3,842 employed individuals in Brownsville, private company employees (2,838 | 73.9%), local government employees (361 | 9.4%), and not-for-profit organizations (195 | 5.1%) make up the most common classes of employment.
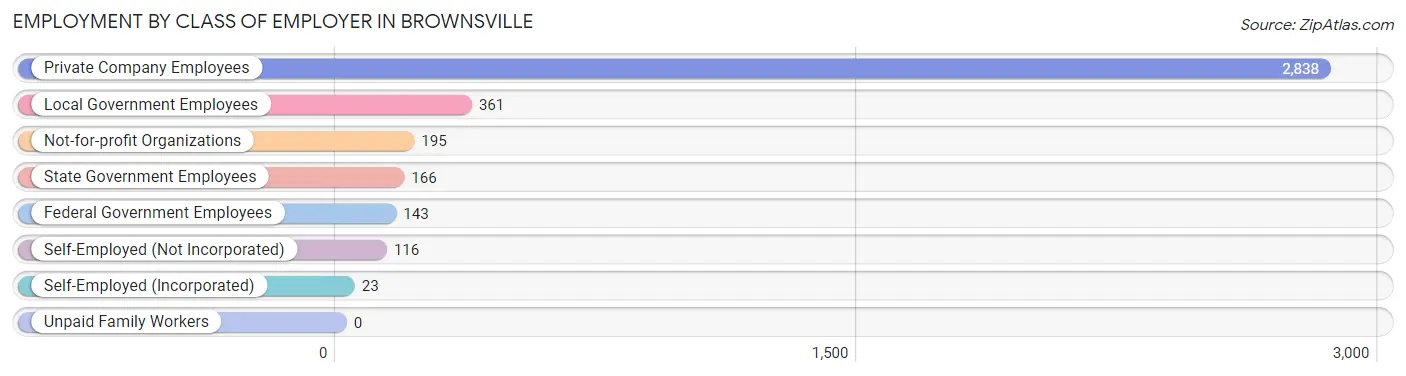
| Employer Class | # Employees | % Employees |
| Private Company Employees | 2,838 | 73.9% |
| Self-Employed (Incorporated) | 23 | 0.6% |
| Self-Employed (Not Incorporated) | 116 | 3.0% |
| Not-for-profit Organizations | 195 | 5.1% |
| Local Government Employees | 361 | 9.4% |
| State Government Employees | 166 | 4.3% |
| Federal Government Employees | 143 | 3.7% |
| Unpaid Family Workers | 0 | 0.0% |
| Total | 3,842 | 100.0% |
Employment Status by Age in Brownsville
According to the labor force statistics for Brownsville, out of the total population over 16 years of age (7,684), 57.5% or 4,418 individuals are in the labor force, with 11.5% or 508 of them unemployed. The age group with the highest labor force participation rate is 30 to 34 years, with 86.4% or 558 individuals in the labor force. Within the labor force, the 16 to 19 years age range has the highest percentage of unemployed individuals, with 31.1% or 109 of them being unemployed.
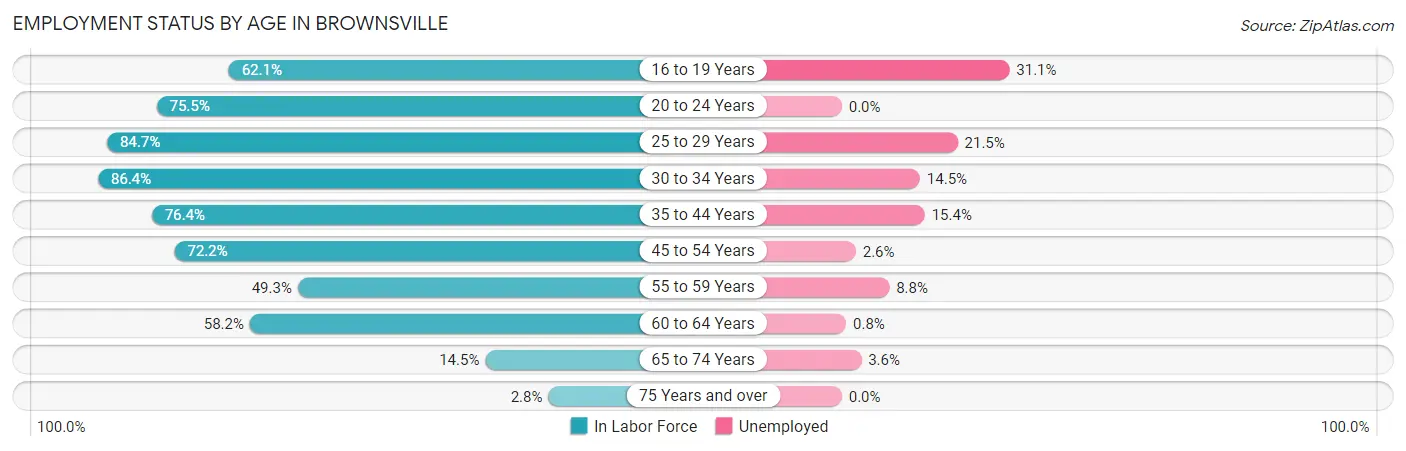
| Age Bracket | In Labor Force | Unemployed |
| 16 to 19 Years | 350 (62.1%) | 109 (31.1%) |
| 20 to 24 Years | 311 (75.5%) | 0 (0.0%) |
| 25 to 29 Years | 572 (84.7%) | 123 (21.5%) |
| 30 to 34 Years | 558 (86.4%) | 81 (14.5%) |
| 35 to 44 Years | 887 (76.4%) | 137 (15.4%) |
| 45 to 54 Years | 879 (72.2%) | 23 (2.6%) |
| 55 to 59 Years | 308 (49.3%) | 27 (8.8%) |
| 60 to 64 Years | 391 (58.2%) | 3 (0.8%) |
| 65 to 74 Years | 139 (14.5%) | 5 (3.6%) |
| 75 Years and over | 21 (2.8%) | 0 (0.0%) |
| Total | 4,418 (57.5%) | 508 (11.5%) |
Employment Status by Educational Attainment in Brownsville
According to labor force statistics for Brownsville, 72.0% of individuals (3,597) out of the total population between 25 and 64 years of age (4,996) are in the labor force, with 11.0% or 396 of them being unemployed. The group with the highest labor force participation rate are those with the educational attainment of bachelor's degree or higher, with 95.6% or 409 individuals in the labor force. Within the labor force, individuals with high school diploma education have the highest percentage of unemployment, with 11.7% or 202 of them being unemployed.
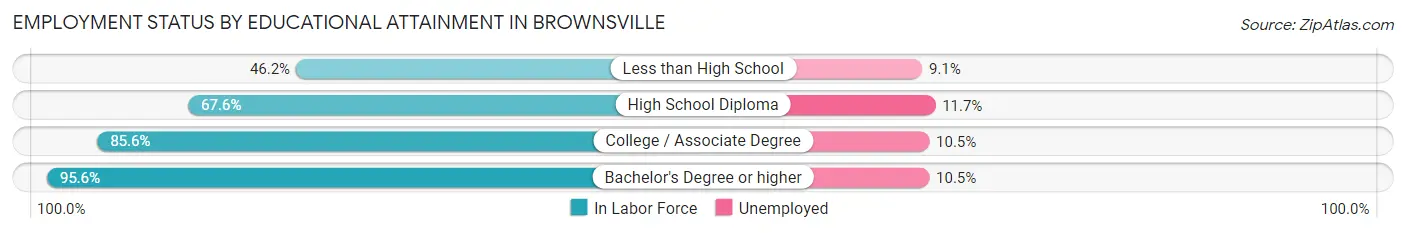
| Educational Attainment | In Labor Force | Unemployed |
| Less than High School | 309 (46.2%) | 61 (9.1%) |
| High School Diploma | 1,729 (67.6%) | 299 (11.7%) |
| College / Associate Degree | 1,148 (85.6%) | 141 (10.5%) |
| Bachelor's Degree or higher | 409 (95.6%) | 45 (10.5%) |
| Total | 3,597 (72.0%) | 550 (11.0%) |
Employment Occupations by Sex in Brownsville
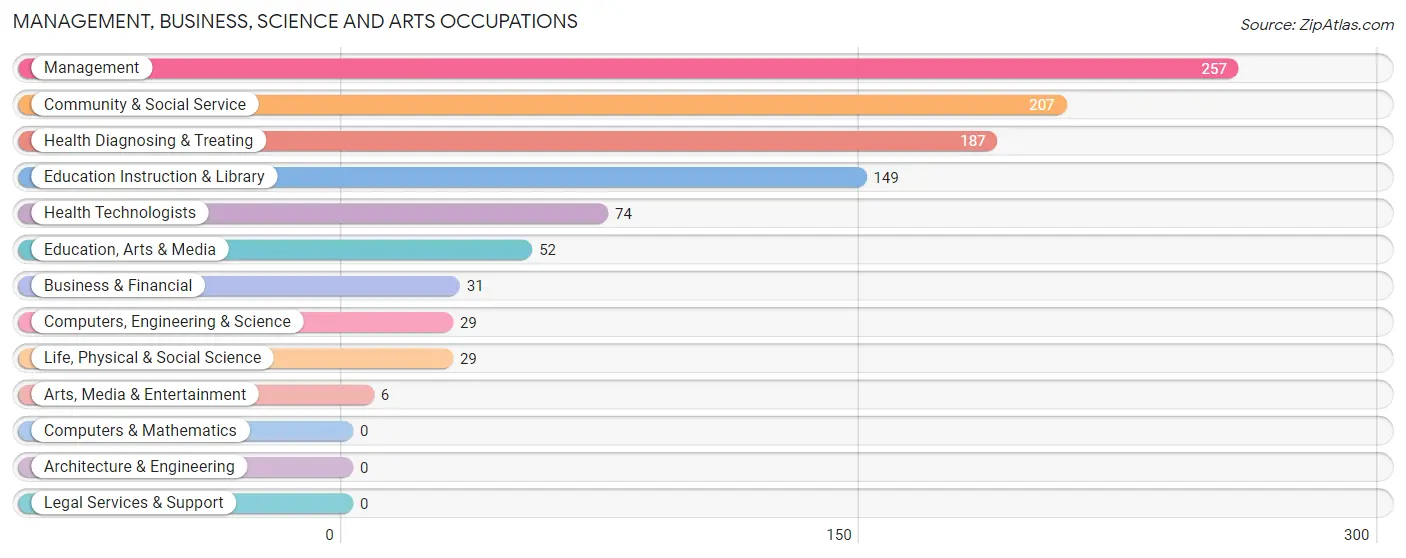
Management, Business, Science and Arts Occupations
The most common Management, Business, Science and Arts occupations in Brownsville are Management (257 | 6.6%), Community & Social Service (207 | 5.3%), Health Diagnosing & Treating (187 | 4.8%), Education Instruction & Library (149 | 3.8%), and Health Technologists (74 | 1.9%).
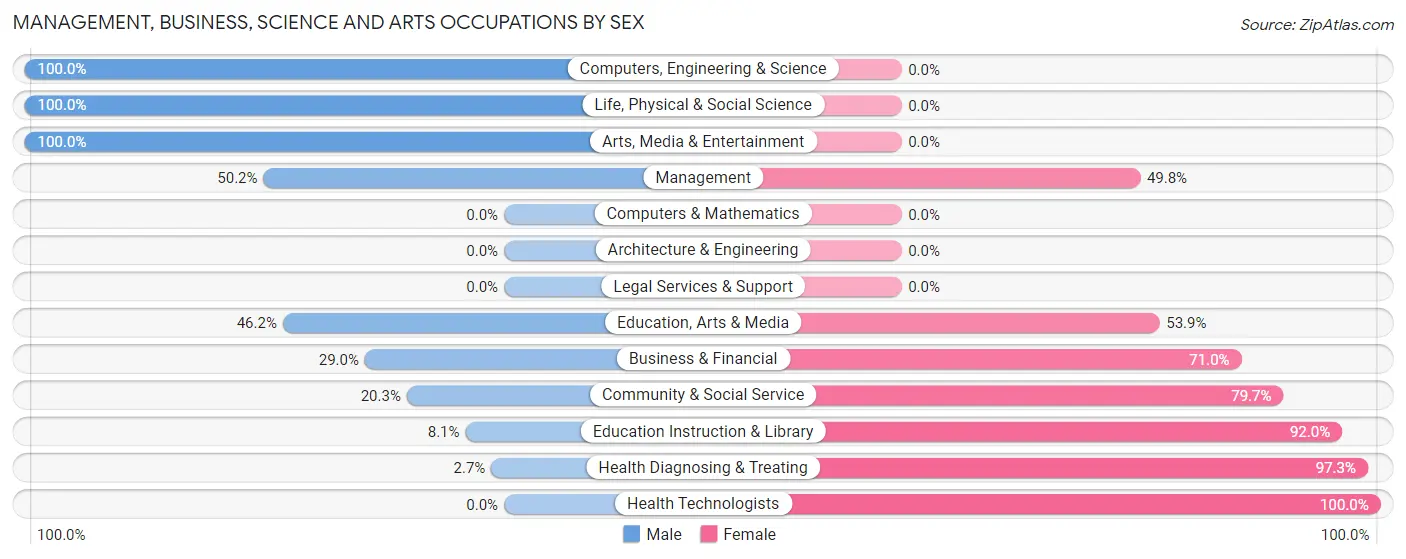
Management, Business, Science and Arts Occupations by Sex
Within the Management, Business, Science and Arts occupations in Brownsville, the most male-oriented occupations are Computers, Engineering & Science (100.0%), Life, Physical & Social Science (100.0%), and Arts, Media & Entertainment (100.0%), while the most female-oriented occupations are Health Technologists (100.0%), Health Diagnosing & Treating (97.3%), and Education Instruction & Library (91.9%).
| Occupation | Male | Female |
| Management | 129 (50.2%) | 128 (49.8%) |
| Business & Financial | 9 (29.0%) | 22 (71.0%) |
| Computers, Engineering & Science | 29 (100.0%) | 0 (0.0%) |
| Computers & Mathematics | 0 (0.0%) | 0 (0.0%) |
| Architecture & Engineering | 0 (0.0%) | 0 (0.0%) |
| Life, Physical & Social Science | 29 (100.0%) | 0 (0.0%) |
| Community & Social Service | 42 (20.3%) | 165 (79.7%) |
| Education, Arts & Media | 24 (46.2%) | 28 (53.8%) |
| Legal Services & Support | 0 (0.0%) | 0 (0.0%) |
| Education Instruction & Library | 12 (8.1%) | 137 (91.9%) |
| Arts, Media & Entertainment | 6 (100.0%) | 0 (0.0%) |
| Health Diagnosing & Treating | 5 (2.7%) | 182 (97.3%) |
| Health Technologists | 0 (0.0%) | 74 (100.0%) |
| Total (Category) | 214 (30.1%) | 497 (69.9%) |
| Total (Overall) | 1,939 (49.6%) | 1,969 (50.4%) |
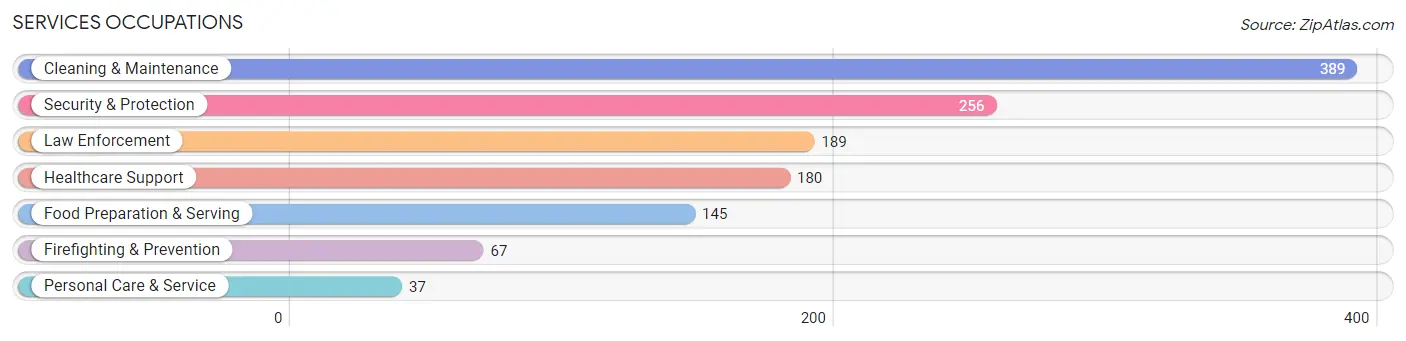
Services Occupations
The most common Services occupations in Brownsville are Cleaning & Maintenance (389 | 10.0%), Security & Protection (256 | 6.6%), Law Enforcement (189 | 4.8%), Healthcare Support (180 | 4.6%), and Food Preparation & Serving (145 | 3.7%).
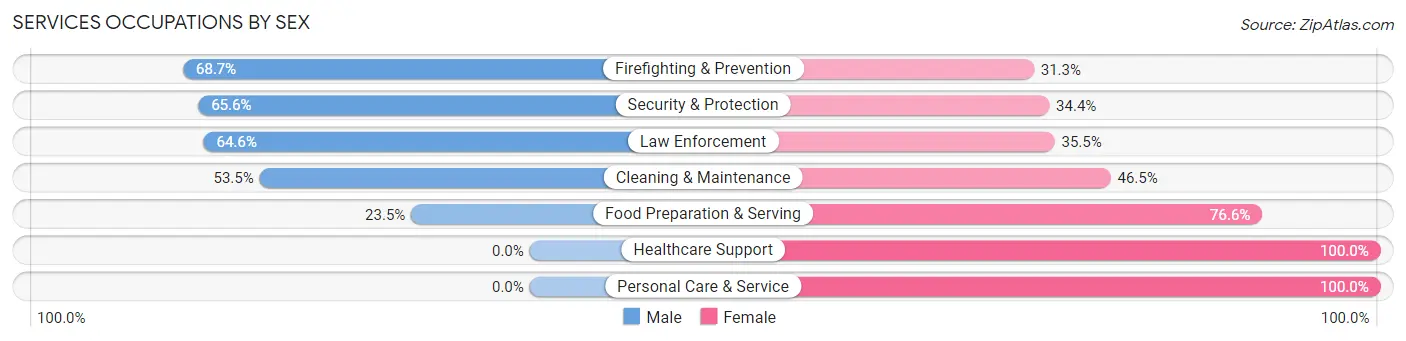
Services Occupations by Sex
Within the Services occupations in Brownsville, the most male-oriented occupations are Firefighting & Prevention (68.7%), Security & Protection (65.6%), and Law Enforcement (64.5%), while the most female-oriented occupations are Healthcare Support (100.0%), Personal Care & Service (100.0%), and Food Preparation & Serving (76.5%).
| Occupation | Male | Female |
| Healthcare Support | 0 (0.0%) | 180 (100.0%) |
| Security & Protection | 168 (65.6%) | 88 (34.4%) |
| Firefighting & Prevention | 46 (68.7%) | 21 (31.3%) |
| Law Enforcement | 122 (64.5%) | 67 (35.4%) |
| Food Preparation & Serving | 34 (23.4%) | 111 (76.5%) |
| Cleaning & Maintenance | 208 (53.5%) | 181 (46.5%) |
| Personal Care & Service | 0 (0.0%) | 37 (100.0%) |
| Total (Category) | 410 (40.7%) | 597 (59.3%) |
| Total (Overall) | 1,939 (49.6%) | 1,969 (50.4%) |
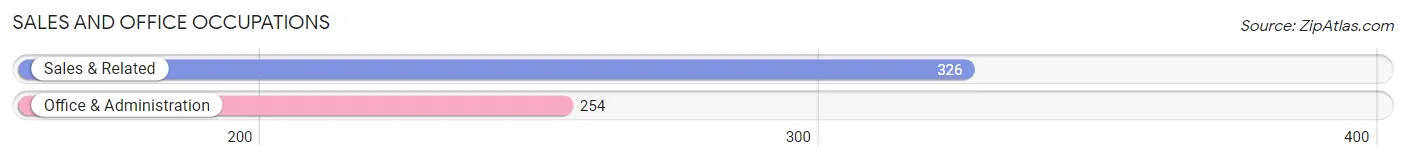
Sales and Office Occupations
The most common Sales and Office occupations in Brownsville are Sales & Related (326 | 8.3%), and Office & Administration (254 | 6.5%).
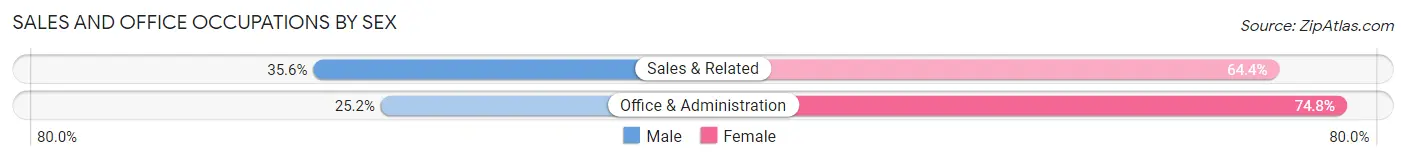
Sales and Office Occupations by Sex
| Occupation | Male | Female |
| Sales & Related | 116 (35.6%) | 210 (64.4%) |
| Office & Administration | 64 (25.2%) | 190 (74.8%) |
| Total (Category) | 180 (31.0%) | 400 (69.0%) |
| Total (Overall) | 1,939 (49.6%) | 1,969 (50.4%) |
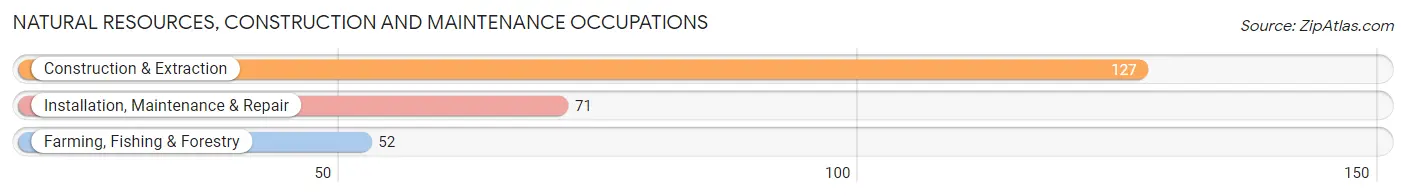
Natural Resources, Construction and Maintenance Occupations
The most common Natural Resources, Construction and Maintenance occupations in Brownsville are Construction & Extraction (127 | 3.3%), Installation, Maintenance & Repair (71 | 1.8%), and Farming, Fishing & Forestry (52 | 1.3%).
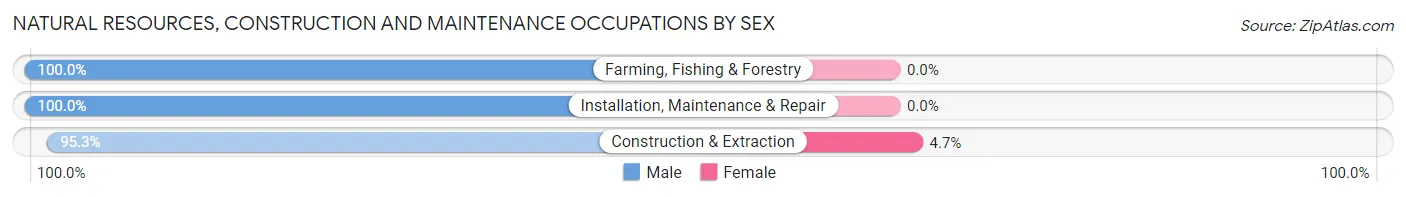
Natural Resources, Construction and Maintenance Occupations by Sex
| Occupation | Male | Female |
| Farming, Fishing & Forestry | 52 (100.0%) | 0 (0.0%) |
| Construction & Extraction | 121 (95.3%) | 6 (4.7%) |
| Installation, Maintenance & Repair | 71 (100.0%) | 0 (0.0%) |
| Total (Category) | 244 (97.6%) | 6 (2.4%) |
| Total (Overall) | 1,939 (49.6%) | 1,969 (50.4%) |
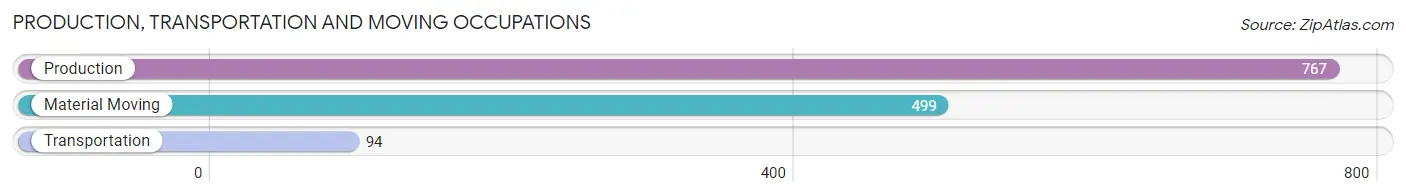
Production, Transportation and Moving Occupations
The most common Production, Transportation and Moving occupations in Brownsville are Production (767 | 19.6%), Material Moving (499 | 12.8%), and Transportation (94 | 2.4%).
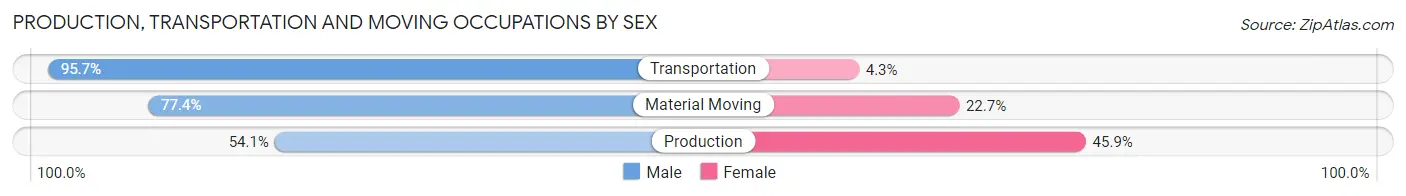
Production, Transportation and Moving Occupations by Sex
| Occupation | Male | Female |
| Production | 415 (54.1%) | 352 (45.9%) |
| Transportation | 90 (95.7%) | 4 (4.3%) |
| Material Moving | 386 (77.3%) | 113 (22.7%) |
| Total (Category) | 891 (65.5%) | 469 (34.5%) |
| Total (Overall) | 1,939 (49.6%) | 1,969 (50.4%) |
Employment Industries by Sex in Brownsville
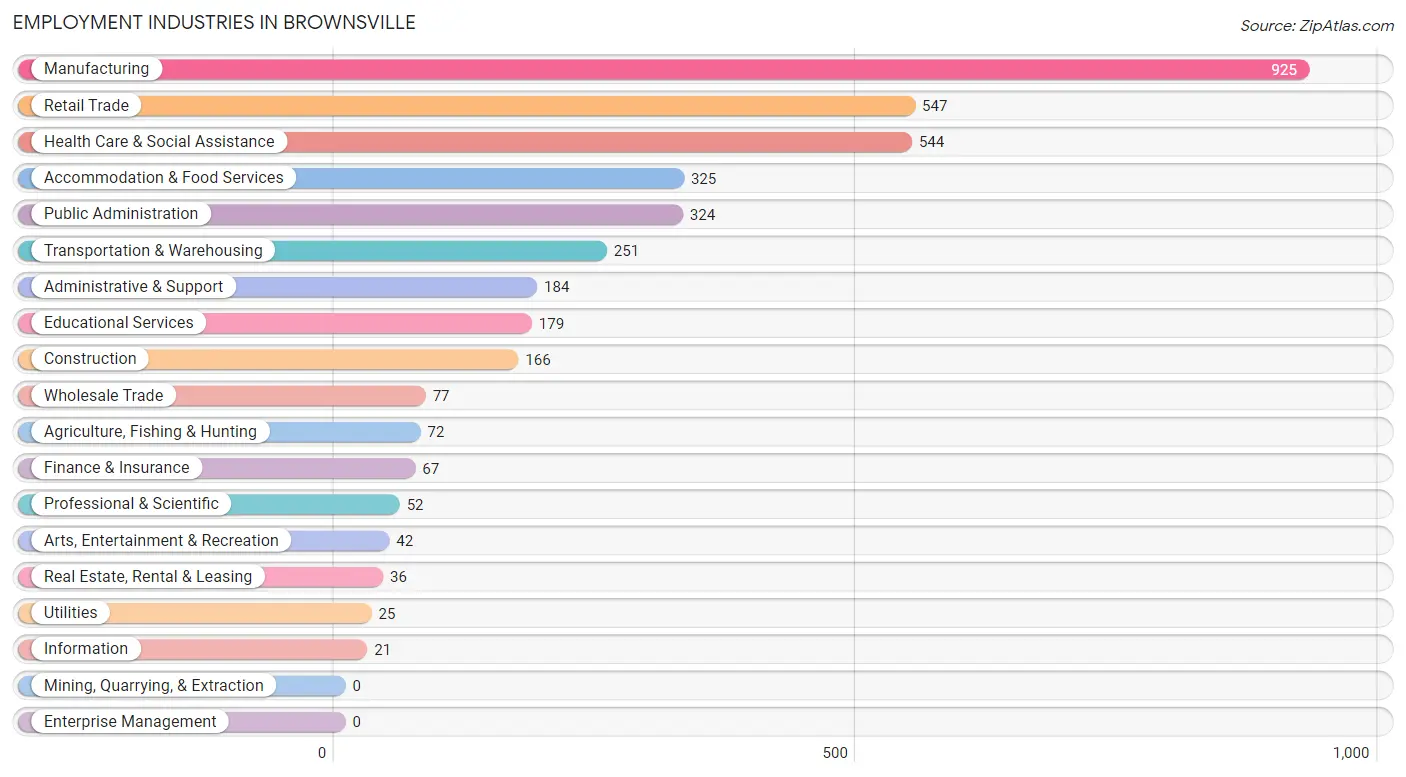
Employment Industries in Brownsville
The major employment industries in Brownsville include Manufacturing (925 | 23.7%), Retail Trade (547 | 14.0%), Health Care & Social Assistance (544 | 13.9%), Accommodation & Food Services (325 | 8.3%), and Public Administration (324 | 8.3%).
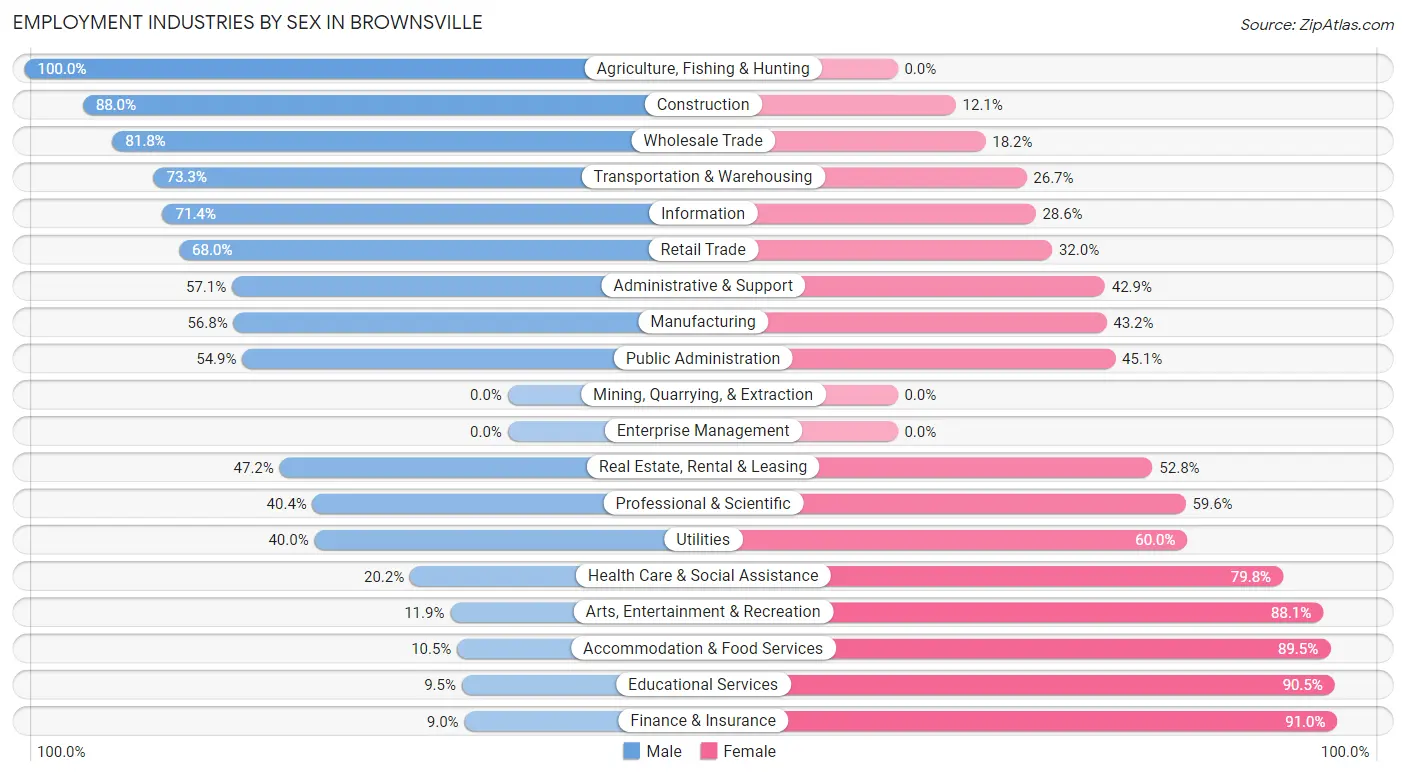
Employment Industries by Sex in Brownsville
The Brownsville industries that see more men than women are Agriculture, Fishing & Hunting (100.0%), Construction (87.9%), and Wholesale Trade (81.8%), whereas the industries that tend to have a higher number of women are Finance & Insurance (91.0%), Educational Services (90.5%), and Accommodation & Food Services (89.5%).
| Industry | Male | Female |
| Agriculture, Fishing & Hunting | 72 (100.0%) | 0 (0.0%) |
| Mining, Quarrying, & Extraction | 0 (0.0%) | 0 (0.0%) |
| Construction | 146 (87.9%) | 20 (12.0%) |
| Manufacturing | 525 (56.8%) | 400 (43.2%) |
| Wholesale Trade | 63 (81.8%) | 14 (18.2%) |
| Retail Trade | 372 (68.0%) | 175 (32.0%) |
| Transportation & Warehousing | 184 (73.3%) | 67 (26.7%) |
| Utilities | 10 (40.0%) | 15 (60.0%) |
| Information | 15 (71.4%) | 6 (28.6%) |
| Finance & Insurance | 6 (9.0%) | 61 (91.0%) |
| Real Estate, Rental & Leasing | 17 (47.2%) | 19 (52.8%) |
| Professional & Scientific | 21 (40.4%) | 31 (59.6%) |
| Enterprise Management | 0 (0.0%) | 0 (0.0%) |
| Administrative & Support | 105 (57.1%) | 79 (42.9%) |
| Educational Services | 17 (9.5%) | 162 (90.5%) |
| Health Care & Social Assistance | 110 (20.2%) | 434 (79.8%) |
| Arts, Entertainment & Recreation | 5 (11.9%) | 37 (88.1%) |
| Accommodation & Food Services | 34 (10.5%) | 291 (89.5%) |
| Public Administration | 178 (54.9%) | 146 (45.1%) |
| Total | 1,939 (49.6%) | 1,969 (50.4%) |
Education in Brownsville
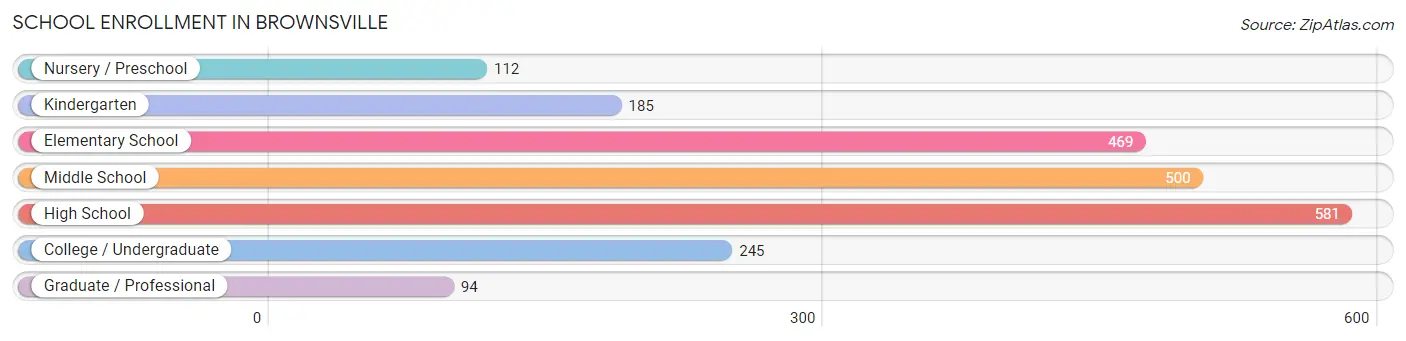
School Enrollment in Brownsville
The most common levels of schooling among the 2,186 students in Brownsville are high school (581 | 26.6%), middle school (500 | 22.9%), and elementary school (469 | 21.4%).
| School Level | # Students | % Students |
| Nursery / Preschool | 112 | 5.1% |
| Kindergarten | 185 | 8.5% |
| Elementary School | 469 | 21.4% |
| Middle School | 500 | 22.9% |
| High School | 581 | 26.6% |
| College / Undergraduate | 245 | 11.2% |
| Graduate / Professional | 94 | 4.3% |
| Total | 2,186 | 100.0% |
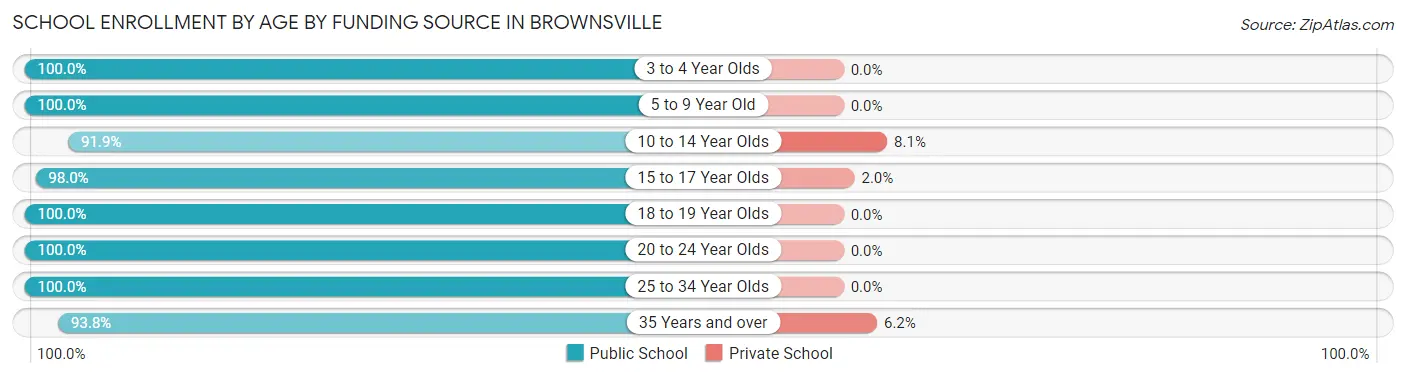
School Enrollment by Age by Funding Source in Brownsville
Out of a total of 2,186 students who are enrolled in schools in Brownsville, 66 (3.0%) attend a private institution, while the remaining 2,120 (97.0%) are enrolled in public schools. The age group of 10 to 14 year olds has the highest likelihood of being enrolled in private schools, with 47 (8.1% in the age bracket) enrolled. Conversely, the age group of 3 to 4 year olds has the lowest likelihood of being enrolled in a private school, with 72 (100.0% in the age bracket) attending a public institution.
| Age Bracket | Public School | Private School |
| 3 to 4 Year Olds | 72 (100.0%) | 0 (0.0%) |
| 5 to 9 Year Old | 682 (100.0%) | 0 (0.0%) |
| 10 to 14 Year Olds | 533 (91.9%) | 47 (8.1%) |
| 15 to 17 Year Olds | 436 (98.0%) | 9 (2.0%) |
| 18 to 19 Year Olds | 107 (100.0%) | 0 (0.0%) |
| 20 to 24 Year Olds | 14 (100.0%) | 0 (0.0%) |
| 25 to 34 Year Olds | 141 (100.0%) | 0 (0.0%) |
| 35 Years and over | 136 (93.8%) | 9 (6.2%) |
| Total | 2,120 (97.0%) | 66 (3.0%) |
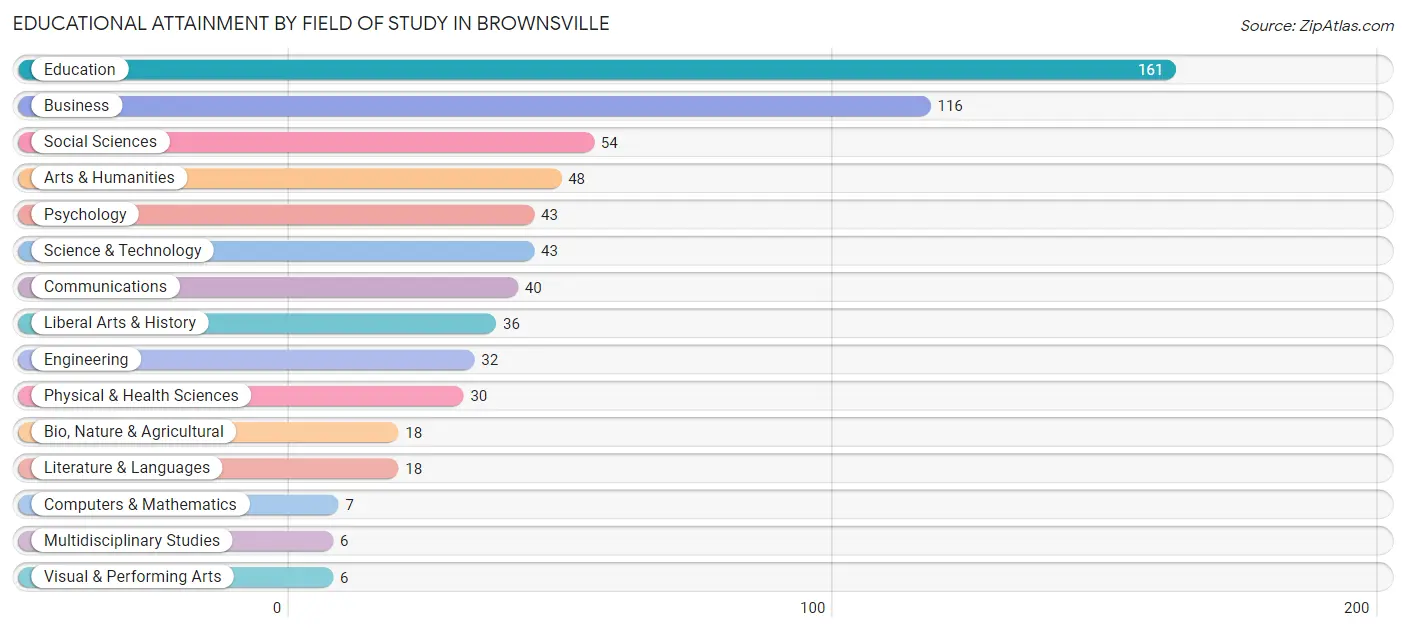
Educational Attainment by Field of Study in Brownsville
Education (161 | 24.5%), business (116 | 17.6%), social sciences (54 | 8.2%), arts & humanities (48 | 7.3%), and psychology (43 | 6.5%) are the most common fields of study among 658 individuals in Brownsville who have obtained a bachelor's degree or higher.
| Field of Study | # Graduates | % Graduates |
| Computers & Mathematics | 7 | 1.1% |
| Bio, Nature & Agricultural | 18 | 2.7% |
| Physical & Health Sciences | 30 | 4.6% |
| Psychology | 43 | 6.5% |
| Social Sciences | 54 | 8.2% |
| Engineering | 32 | 4.9% |
| Multidisciplinary Studies | 6 | 0.9% |
| Science & Technology | 43 | 6.5% |
| Business | 116 | 17.6% |
| Education | 161 | 24.5% |
| Literature & Languages | 18 | 2.7% |
| Liberal Arts & History | 36 | 5.5% |
| Visual & Performing Arts | 6 | 0.9% |
| Communications | 40 | 6.1% |
| Arts & Humanities | 48 | 7.3% |
| Total | 658 | 100.0% |
Transportation & Commute in Brownsville
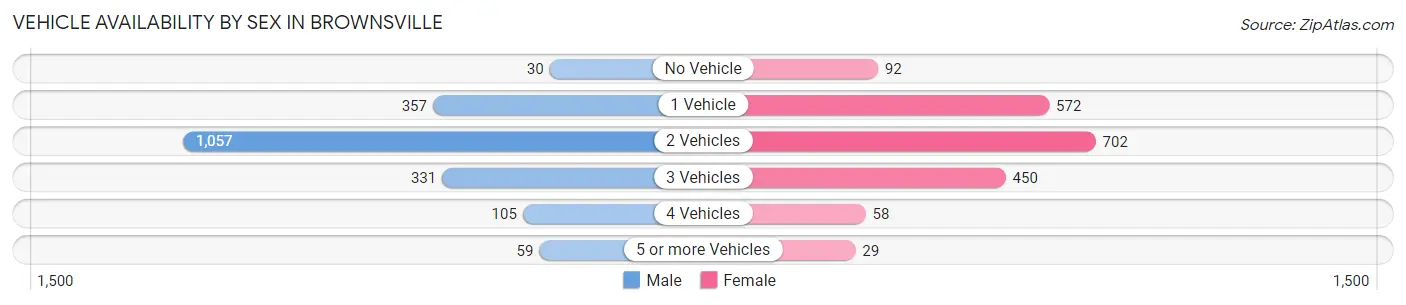
Vehicle Availability by Sex in Brownsville
The most prevalent vehicle ownership categories in Brownsville are males with 2 vehicles (1,057, accounting for 54.5%) and females with 2 vehicles (702, making up 55.5%).
| Vehicles Available | Male | Female |
| No Vehicle | 30 (1.5%) | 92 (4.8%) |
| 1 Vehicle | 357 (18.4%) | 572 (30.1%) |
| 2 Vehicles | 1,057 (54.5%) | 702 (36.9%) |
| 3 Vehicles | 331 (17.1%) | 450 (23.6%) |
| 4 Vehicles | 105 (5.4%) | 58 (3.0%) |
| 5 or more Vehicles | 59 (3.0%) | 29 (1.5%) |
| Total | 1,939 (100.0%) | 1,903 (100.0%) |
Commute Time in Brownsville
The most frequently occuring commute durations in Brownsville are 5 to 9 minutes (983 commuters, 26.2%), 30 to 34 minutes (596 commuters, 15.9%), and 10 to 14 minutes (493 commuters, 13.2%).
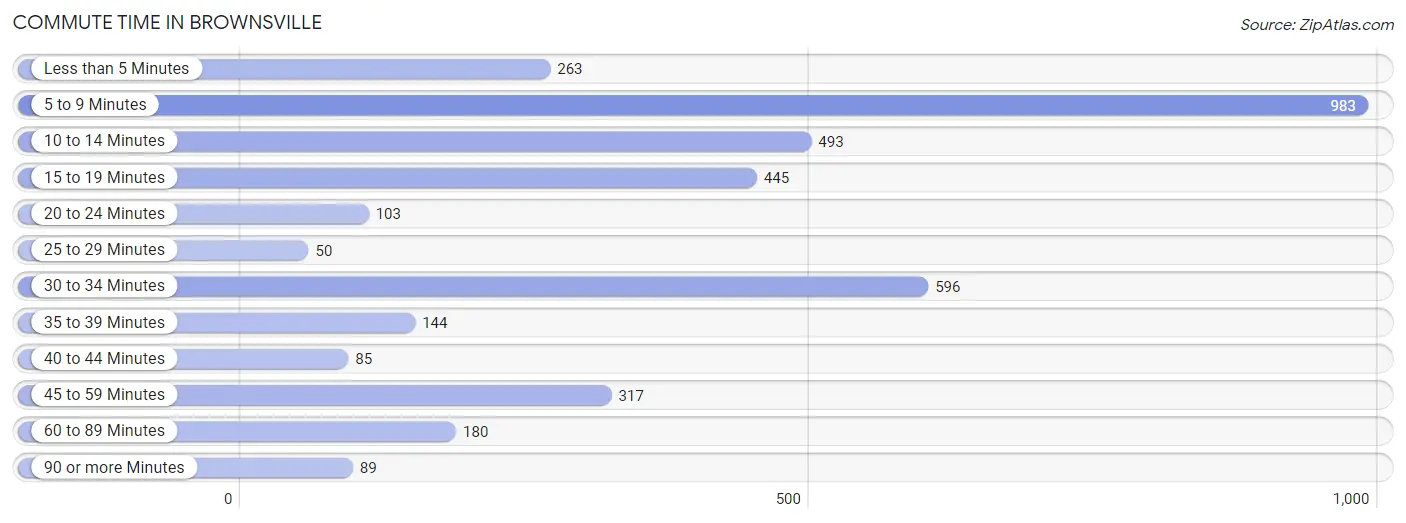
| Commute Time | # Commuters | % Commuters |
| Less than 5 Minutes | 263 | 7.0% |
| 5 to 9 Minutes | 983 | 26.2% |
| 10 to 14 Minutes | 493 | 13.2% |
| 15 to 19 Minutes | 445 | 11.9% |
| 20 to 24 Minutes | 103 | 2.8% |
| 25 to 29 Minutes | 50 | 1.3% |
| 30 to 34 Minutes | 596 | 15.9% |
| 35 to 39 Minutes | 144 | 3.8% |
| 40 to 44 Minutes | 85 | 2.3% |
| 45 to 59 Minutes | 317 | 8.5% |
| 60 to 89 Minutes | 180 | 4.8% |
| 90 or more Minutes | 89 | 2.4% |
Commute Time by Sex in Brownsville
The most common commute times in Brownsville are 5 to 9 minutes (573 commuters, 30.0%) for males and 5 to 9 minutes (410 commuters, 22.3%) for females.
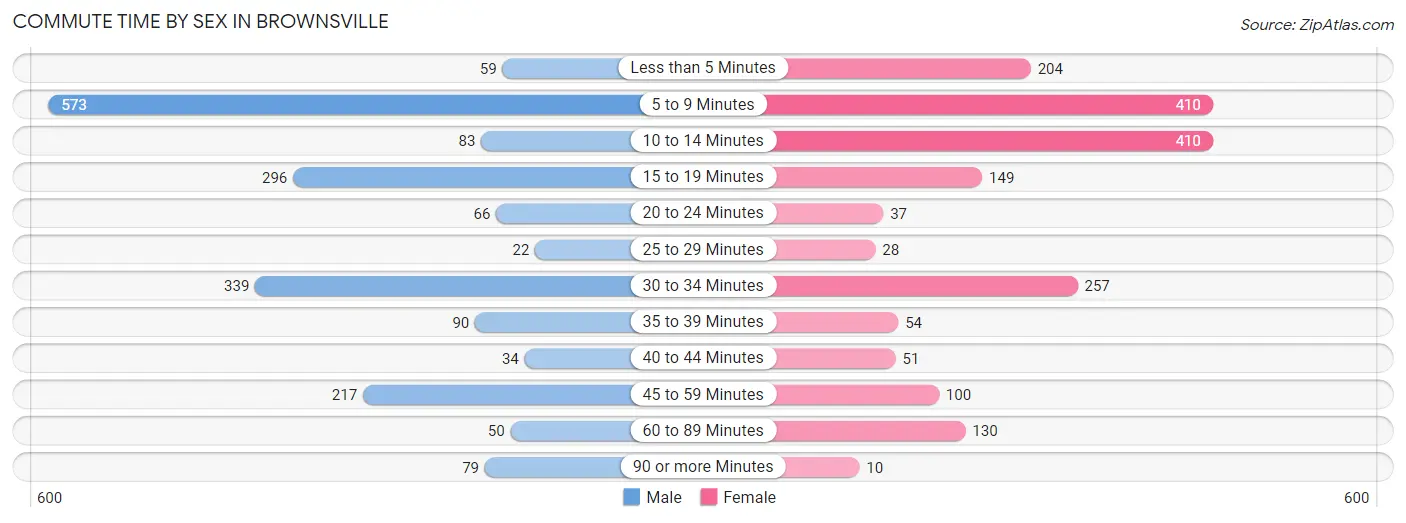
| Commute Time | Male | Female |
| Less than 5 Minutes | 59 (3.1%) | 204 (11.1%) |
| 5 to 9 Minutes | 573 (30.0%) | 410 (22.3%) |
| 10 to 14 Minutes | 83 (4.3%) | 410 (22.3%) |
| 15 to 19 Minutes | 296 (15.5%) | 149 (8.1%) |
| 20 to 24 Minutes | 66 (3.5%) | 37 (2.0%) |
| 25 to 29 Minutes | 22 (1.1%) | 28 (1.5%) |
| 30 to 34 Minutes | 339 (17.8%) | 257 (14.0%) |
| 35 to 39 Minutes | 90 (4.7%) | 54 (2.9%) |
| 40 to 44 Minutes | 34 (1.8%) | 51 (2.8%) |
| 45 to 59 Minutes | 217 (11.4%) | 100 (5.4%) |
| 60 to 89 Minutes | 50 (2.6%) | 130 (7.1%) |
| 90 or more Minutes | 79 (4.1%) | 10 (0.5%) |
Time of Departure to Work by Sex in Brownsville
The most frequent times of departure to work in Brownsville are 4:00 PM to 11:59 PM (287, 15.0%) for males and 7:30 AM to 7:59 AM (270, 14.7%) for females.
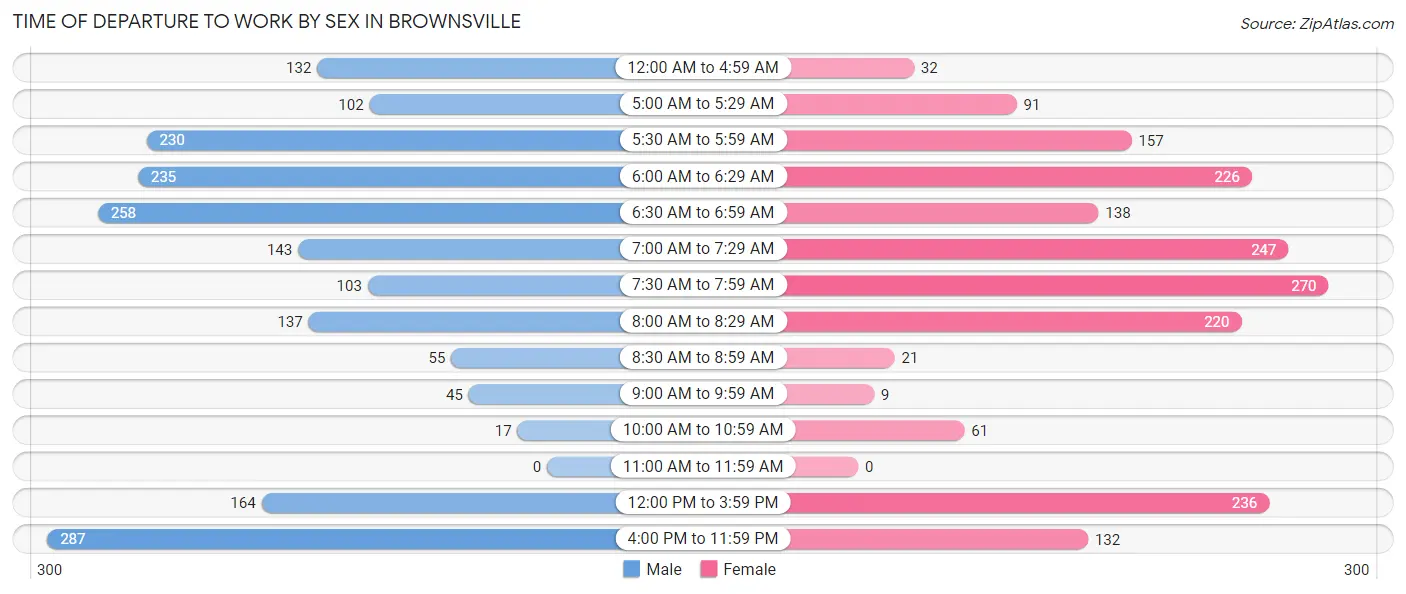
| Time of Departure | Male | Female |
| 12:00 AM to 4:59 AM | 132 (6.9%) | 32 (1.7%) |
| 5:00 AM to 5:29 AM | 102 (5.3%) | 91 (5.0%) |
| 5:30 AM to 5:59 AM | 230 (12.0%) | 157 (8.5%) |
| 6:00 AM to 6:29 AM | 235 (12.3%) | 226 (12.3%) |
| 6:30 AM to 6:59 AM | 258 (13.5%) | 138 (7.5%) |
| 7:00 AM to 7:29 AM | 143 (7.5%) | 247 (13.4%) |
| 7:30 AM to 7:59 AM | 103 (5.4%) | 270 (14.7%) |
| 8:00 AM to 8:29 AM | 137 (7.2%) | 220 (12.0%) |
| 8:30 AM to 8:59 AM | 55 (2.9%) | 21 (1.1%) |
| 9:00 AM to 9:59 AM | 45 (2.4%) | 9 (0.5%) |
| 10:00 AM to 10:59 AM | 17 (0.9%) | 61 (3.3%) |
| 11:00 AM to 11:59 AM | 0 (0.0%) | 0 (0.0%) |
| 12:00 PM to 3:59 PM | 164 (8.6%) | 236 (12.8%) |
| 4:00 PM to 11:59 PM | 287 (15.0%) | 132 (7.2%) |
| Total | 1,908 (100.0%) | 1,840 (100.0%) |
Housing Occupancy in Brownsville
Occupancy by Ownership in Brownsville
Of the total 3,934 dwellings in Brownsville, owner-occupied units account for 1,769 (45.0%), while renter-occupied units make up 2,165 (55.0%).
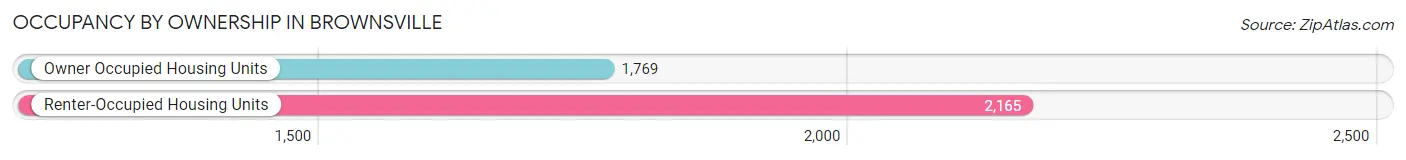
| Occupancy | # Housing Units | % Housing Units |
| Owner Occupied Housing Units | 1,769 | 45.0% |
| Renter-Occupied Housing Units | 2,165 | 55.0% |
| Total Occupied Housing Units | 3,934 | 100.0% |
Occupancy by Household Size in Brownsville
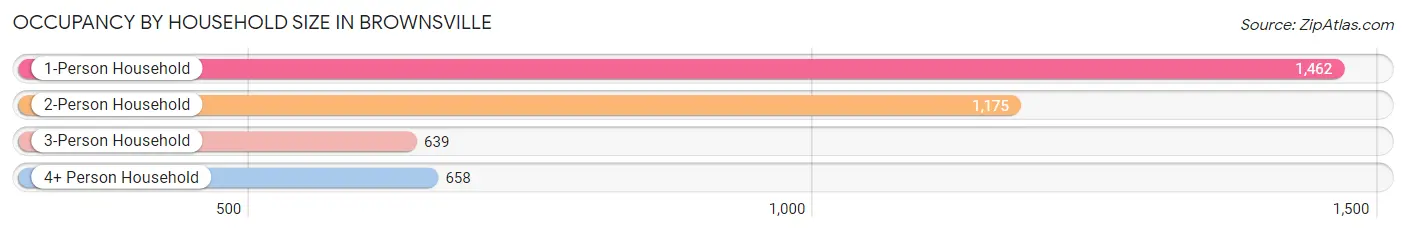
| Household Size | # Housing Units | % Housing Units |
| 1-Person Household | 1,462 | 37.2% |
| 2-Person Household | 1,175 | 29.9% |
| 3-Person Household | 639 | 16.2% |
| 4+ Person Household | 658 | 16.7% |
| Total Housing Units | 3,934 | 100.0% |
Occupancy by Ownership by Household Size in Brownsville
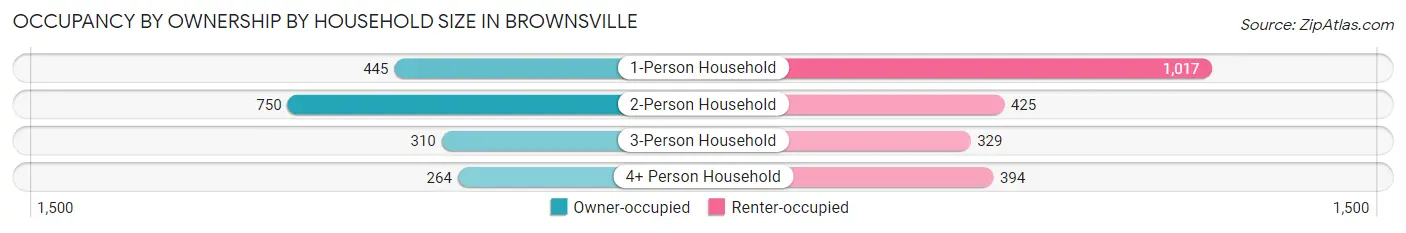
| Household Size | Owner-occupied | Renter-occupied |
| 1-Person Household | 445 (30.4%) | 1,017 (69.6%) |
| 2-Person Household | 750 (63.8%) | 425 (36.2%) |
| 3-Person Household | 310 (48.5%) | 329 (51.5%) |
| 4+ Person Household | 264 (40.1%) | 394 (59.9%) |
| Total Housing Units | 1,769 (45.0%) | 2,165 (55.0%) |
Occupancy by Educational Attainment in Brownsville
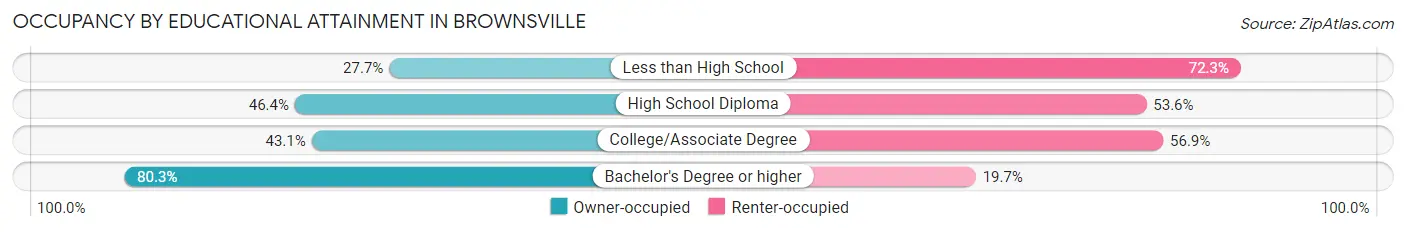
| Household Size | Owner-occupied | Renter-occupied |
| Less than High School | 222 (27.7%) | 579 (72.3%) |
| High School Diploma | 799 (46.4%) | 922 (53.6%) |
| College/Associate Degree | 447 (43.1%) | 590 (56.9%) |
| Bachelor's Degree or higher | 301 (80.3%) | 74 (19.7%) |
Occupancy by Age of Householder in Brownsville
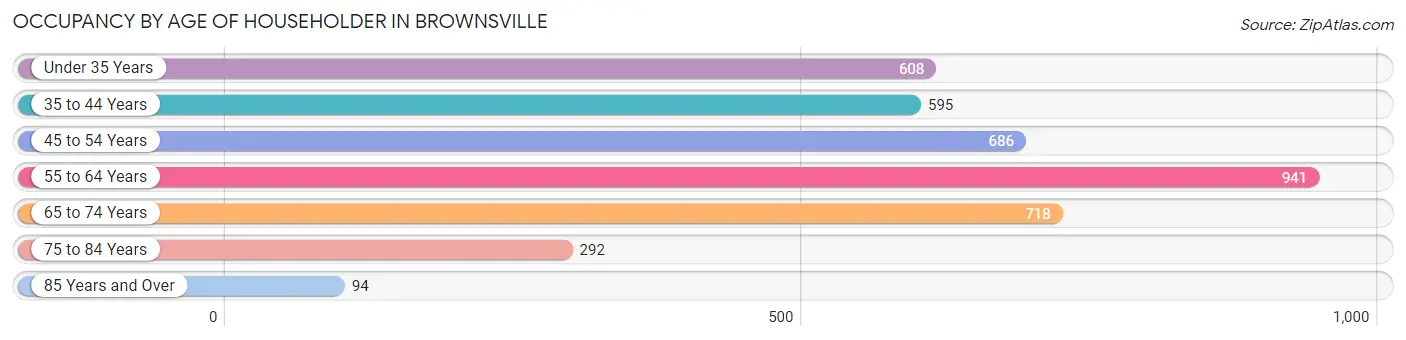
| Age Bracket | # Households | % Households |
| Under 35 Years | 608 | 15.5% |
| 35 to 44 Years | 595 | 15.1% |
| 45 to 54 Years | 686 | 17.4% |
| 55 to 64 Years | 941 | 23.9% |
| 65 to 74 Years | 718 | 18.2% |
| 75 to 84 Years | 292 | 7.4% |
| 85 Years and Over | 94 | 2.4% |
| Total | 3,934 | 100.0% |
Housing Finances in Brownsville
Median Income by Occupancy in Brownsville
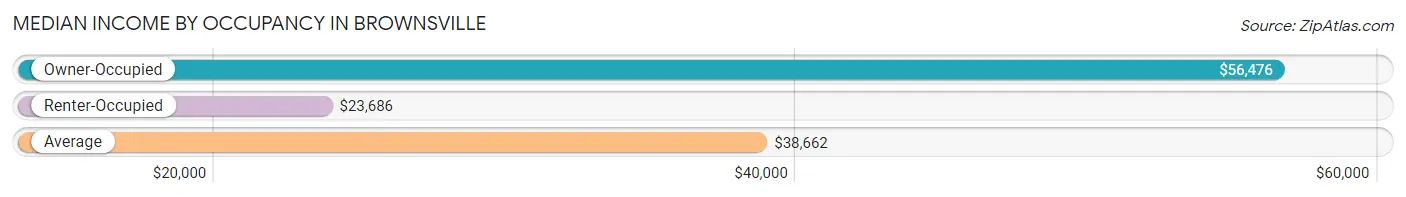
| Occupancy Type | # Households | Median Income |
| Owner-Occupied | 1,769 (45.0%) | $56,476 |
| Renter-Occupied | 2,165 (55.0%) | $23,686 |
| Average | 3,934 (100.0%) | $38,662 |
Occupancy by Householder Income Bracket in Brownsville
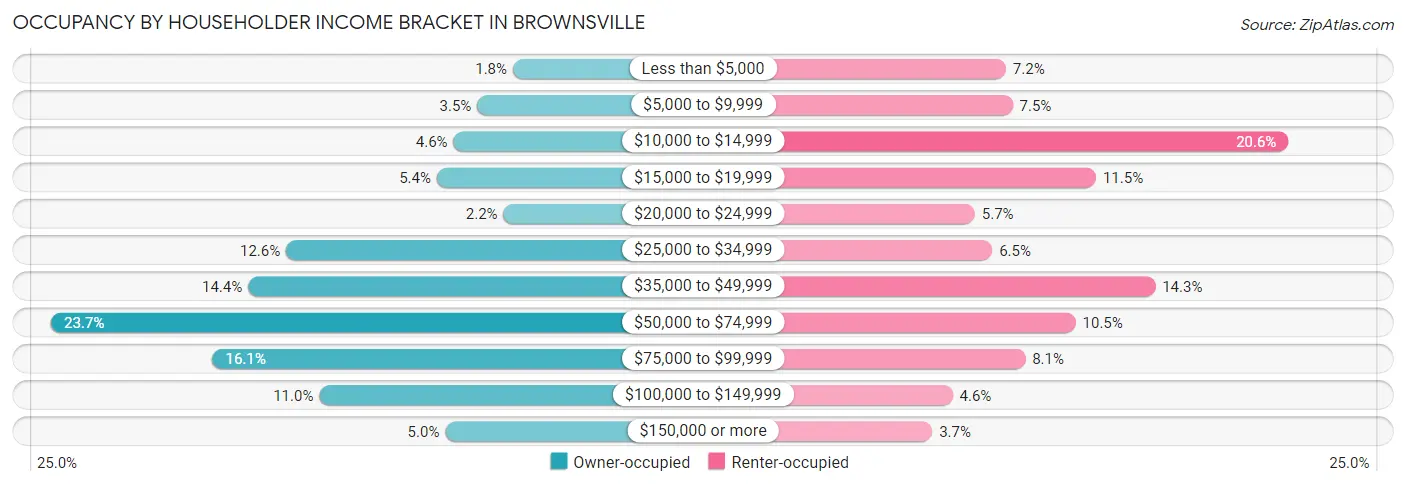
| Income Bracket | Owner-occupied | Renter-occupied |
| Less than $5,000 | 31 (1.8%) | 155 (7.2%) |
| $5,000 to $9,999 | 61 (3.5%) | 162 (7.5%) |
| $10,000 to $14,999 | 81 (4.6%) | 446 (20.6%) |
| $15,000 to $19,999 | 95 (5.4%) | 248 (11.5%) |
| $20,000 to $24,999 | 39 (2.2%) | 123 (5.7%) |
| $25,000 to $34,999 | 222 (12.6%) | 141 (6.5%) |
| $35,000 to $49,999 | 254 (14.4%) | 309 (14.3%) |
| $50,000 to $74,999 | 420 (23.7%) | 227 (10.5%) |
| $75,000 to $99,999 | 284 (16.1%) | 175 (8.1%) |
| $100,000 to $149,999 | 194 (11.0%) | 100 (4.6%) |
| $150,000 or more | 88 (5.0%) | 79 (3.6%) |
| Total | 1,769 (100.0%) | 2,165 (100.0%) |
Monthly Housing Cost Tiers in Brownsville
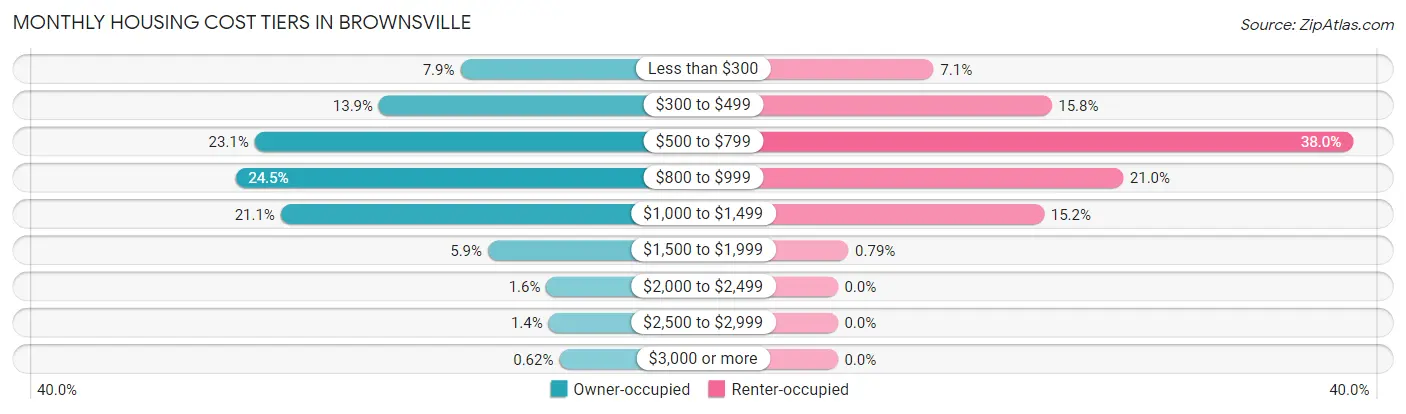
| Monthly Cost | Owner-occupied | Renter-occupied |
| Less than $300 | 140 (7.9%) | 153 (7.1%) |
| $300 to $499 | 246 (13.9%) | 341 (15.8%) |
| $500 to $799 | 408 (23.1%) | 822 (38.0%) |
| $800 to $999 | 433 (24.5%) | 455 (21.0%) |
| $1,000 to $1,499 | 374 (21.1%) | 329 (15.2%) |
| $1,500 to $1,999 | 104 (5.9%) | 17 (0.8%) |
| $2,000 to $2,499 | 28 (1.6%) | 0 (0.0%) |
| $2,500 to $2,999 | 25 (1.4%) | 0 (0.0%) |
| $3,000 or more | 11 (0.6%) | 0 (0.0%) |
| Total | 1,769 (100.0%) | 2,165 (100.0%) |
Physical Housing Characteristics in Brownsville
Housing Structures in Brownsville
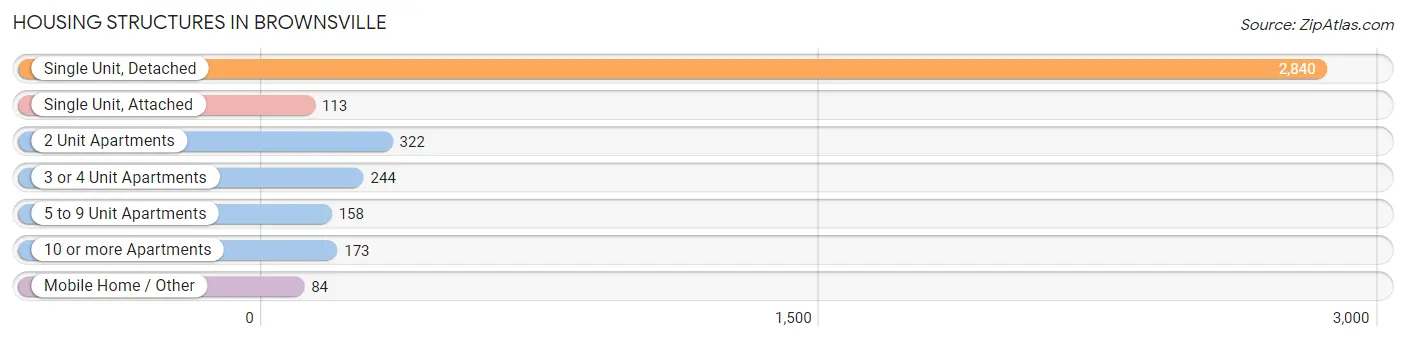
| Structure Type | # Housing Units | % Housing Units |
| Single Unit, Detached | 2,840 | 72.2% |
| Single Unit, Attached | 113 | 2.9% |
| 2 Unit Apartments | 322 | 8.2% |
| 3 or 4 Unit Apartments | 244 | 6.2% |
| 5 to 9 Unit Apartments | 158 | 4.0% |
| 10 or more Apartments | 173 | 4.4% |
| Mobile Home / Other | 84 | 2.1% |
| Total | 3,934 | 100.0% |
Housing Structures by Occupancy in Brownsville
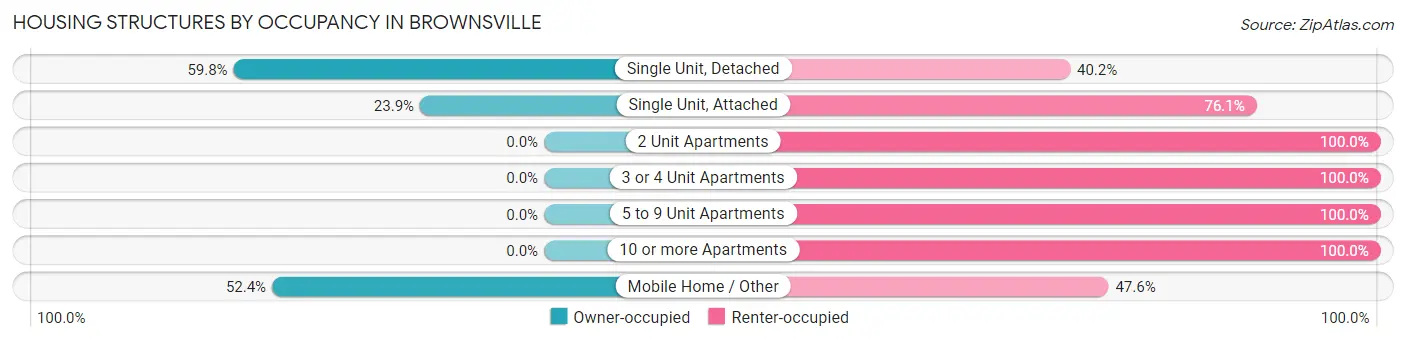
| Structure Type | Owner-occupied | Renter-occupied |
| Single Unit, Detached | 1,698 (59.8%) | 1,142 (40.2%) |
| Single Unit, Attached | 27 (23.9%) | 86 (76.1%) |
| 2 Unit Apartments | 0 (0.0%) | 322 (100.0%) |
| 3 or 4 Unit Apartments | 0 (0.0%) | 244 (100.0%) |
| 5 to 9 Unit Apartments | 0 (0.0%) | 158 (100.0%) |
| 10 or more Apartments | 0 (0.0%) | 173 (100.0%) |
| Mobile Home / Other | 44 (52.4%) | 40 (47.6%) |
| Total | 1,769 (45.0%) | 2,165 (55.0%) |
Housing Structures by Number of Rooms in Brownsville
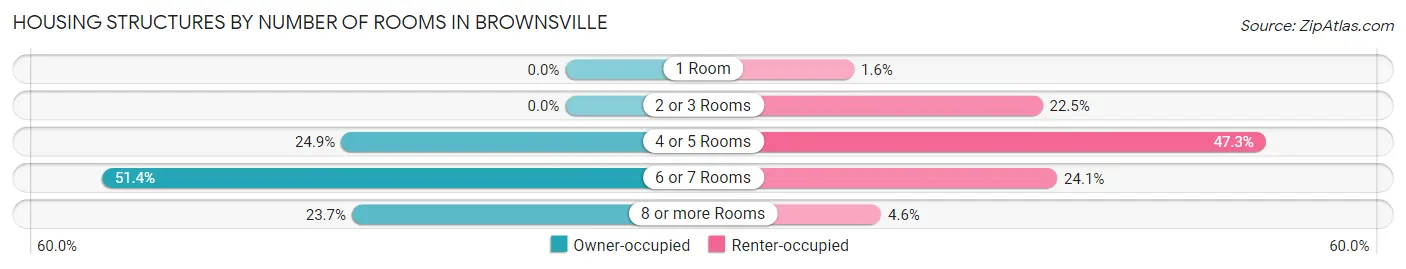
| Number of Rooms | Owner-occupied | Renter-occupied |
| 1 Room | 0 (0.0%) | 34 (1.6%) |
| 2 or 3 Rooms | 0 (0.0%) | 487 (22.5%) |
| 4 or 5 Rooms | 440 (24.9%) | 1,023 (47.2%) |
| 6 or 7 Rooms | 910 (51.4%) | 522 (24.1%) |
| 8 or more Rooms | 419 (23.7%) | 99 (4.6%) |
| Total | 1,769 (100.0%) | 2,165 (100.0%) |
Housing Structure by Heating Type in Brownsville
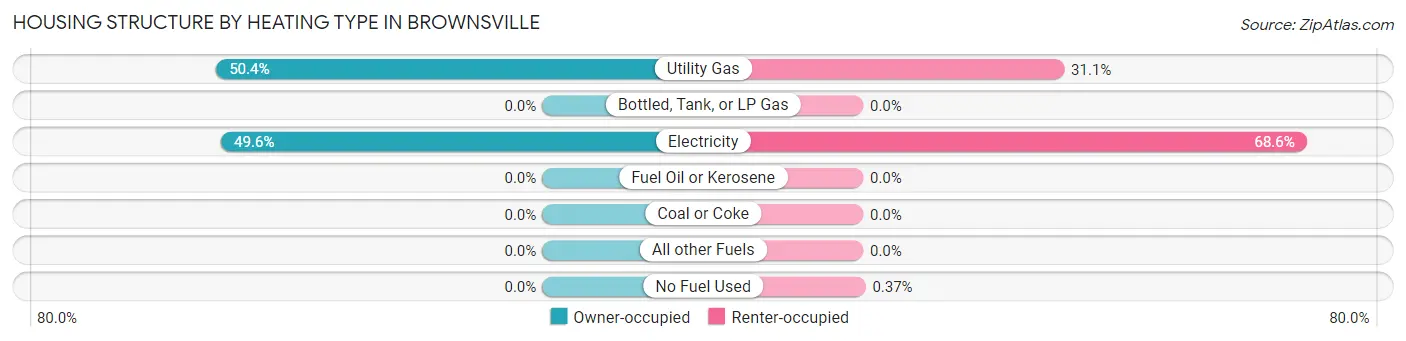
| Heating Type | Owner-occupied | Renter-occupied |
| Utility Gas | 891 (50.4%) | 673 (31.1%) |
| Bottled, Tank, or LP Gas | 0 (0.0%) | 0 (0.0%) |
| Electricity | 878 (49.6%) | 1,484 (68.5%) |
| Fuel Oil or Kerosene | 0 (0.0%) | 0 (0.0%) |
| Coal or Coke | 0 (0.0%) | 0 (0.0%) |
| All other Fuels | 0 (0.0%) | 0 (0.0%) |
| No Fuel Used | 0 (0.0%) | 8 (0.4%) |
| Total | 1,769 (100.0%) | 2,165 (100.0%) |
Household Vehicle Usage in Brownsville
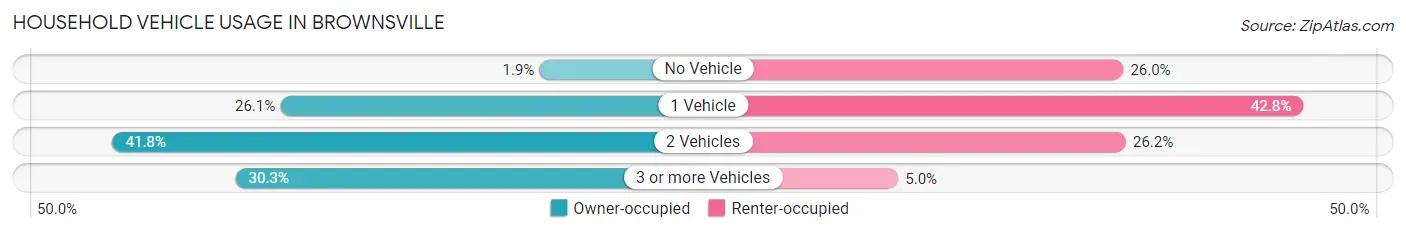
| Vehicles per Household | Owner-occupied | Renter-occupied |
| No Vehicle | 33 (1.9%) | 563 (26.0%) |
| 1 Vehicle | 461 (26.1%) | 926 (42.8%) |
| 2 Vehicles | 739 (41.8%) | 568 (26.2%) |
| 3 or more Vehicles | 536 (30.3%) | 108 (5.0%) |
| Total | 1,769 (100.0%) | 2,165 (100.0%) |
Real Estate & Mortgages in Brownsville
Real Estate and Mortgage Overview in Brownsville
| Characteristic | Without Mortgage | With Mortgage |
| Housing Units | 722 | 1,047 |
| Median Property Value | $95,400 | $115,500 |
| Median Household Income | $50,000 | $65 |
| Monthly Housing Costs | $487 | $11 |
| Real Estate Taxes | $1,026 | $31 |
Property Value by Mortgage Status in Brownsville
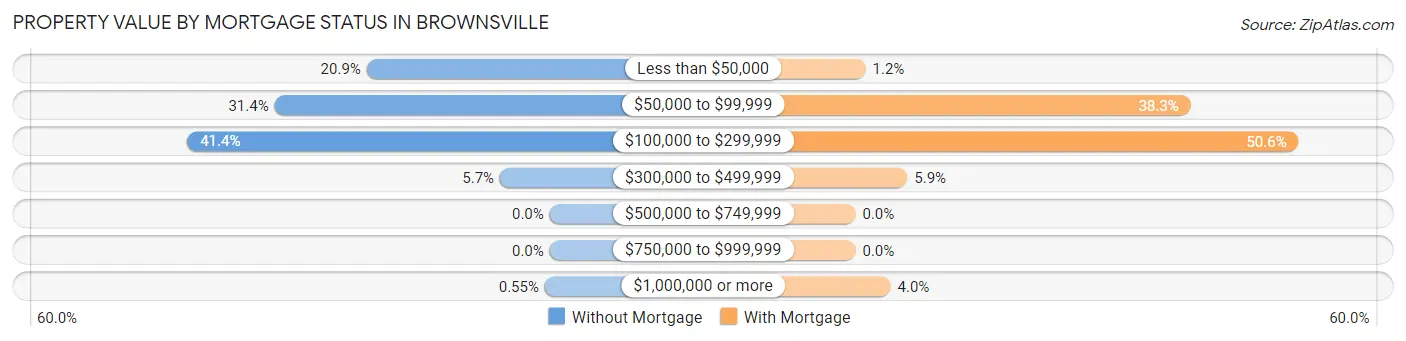
| Property Value | Without Mortgage | With Mortgage |
| Less than $50,000 | 151 (20.9%) | 12 (1.1%) |
| $50,000 to $99,999 | 227 (31.4%) | 401 (38.3%) |
| $100,000 to $299,999 | 299 (41.4%) | 530 (50.6%) |
| $300,000 to $499,999 | 41 (5.7%) | 62 (5.9%) |
| $500,000 to $749,999 | 0 (0.0%) | 0 (0.0%) |
| $750,000 to $999,999 | 0 (0.0%) | 0 (0.0%) |
| $1,000,000 or more | 4 (0.5%) | 42 (4.0%) |
| Total | 722 (100.0%) | 1,047 (100.0%) |
Household Income by Mortgage Status in Brownsville
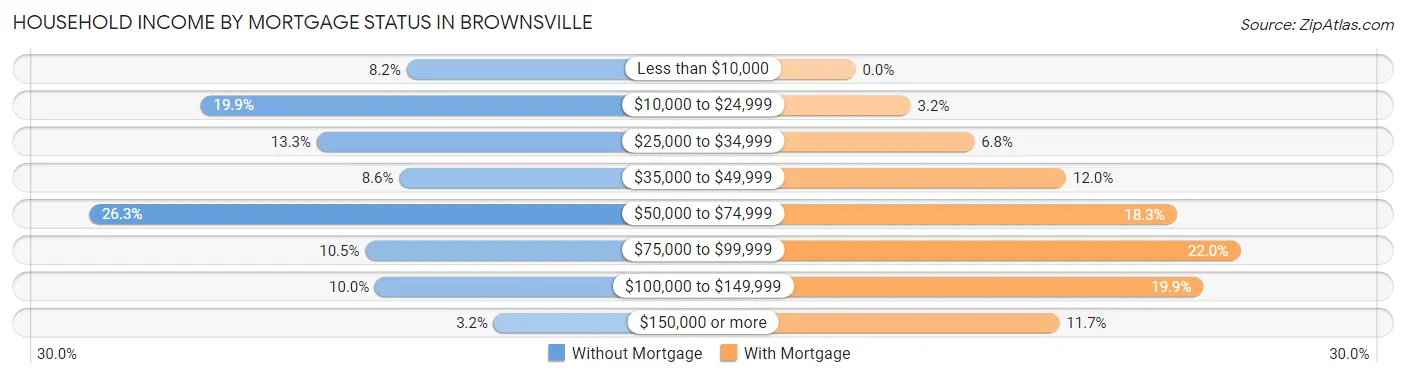
| Household Income | Without Mortgage | With Mortgage |
| Less than $10,000 | 59 (8.2%) | 0 (0.0%) |
| $10,000 to $24,999 | 144 (19.9%) | 33 (3.2%) |
| $25,000 to $34,999 | 96 (13.3%) | 71 (6.8%) |
| $35,000 to $49,999 | 62 (8.6%) | 126 (12.0%) |
| $50,000 to $74,999 | 190 (26.3%) | 192 (18.3%) |
| $75,000 to $99,999 | 76 (10.5%) | 230 (22.0%) |
| $100,000 to $149,999 | 72 (10.0%) | 208 (19.9%) |
| $150,000 or more | 23 (3.2%) | 122 (11.7%) |
| Total | 722 (100.0%) | 1,047 (100.0%) |
Property Value to Household Income Ratio in Brownsville
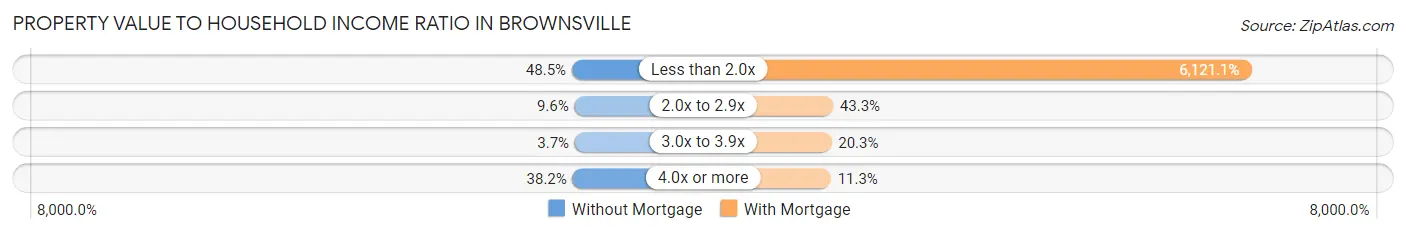
| Value-to-Income Ratio | Without Mortgage | With Mortgage |
| Less than 2.0x | 350 (48.5%) | 64,088 (6,121.1%) |
| 2.0x to 2.9x | 69 (9.6%) | 453 (43.3%) |
| 3.0x to 3.9x | 27 (3.7%) | 212 (20.3%) |
| 4.0x or more | 276 (38.2%) | 118 (11.3%) |
| Total | 722 (100.0%) | 1,047 (100.0%) |
Real Estate Taxes by Mortgage Status in Brownsville
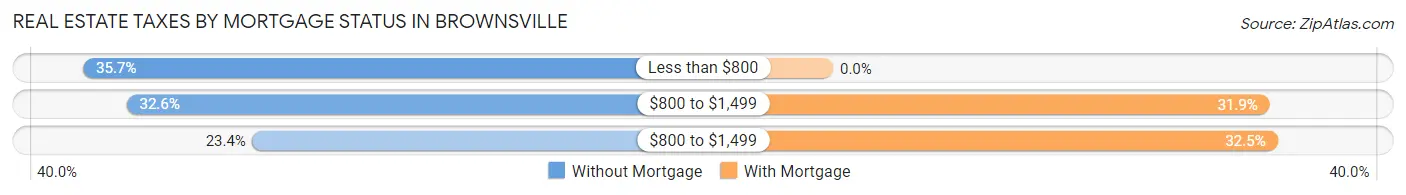
| Property Taxes | Without Mortgage | With Mortgage |
| Less than $800 | 258 (35.7%) | 0 (0.0%) |
| $800 to $1,499 | 235 (32.6%) | 334 (31.9%) |
| $800 to $1,499 | 169 (23.4%) | 340 (32.5%) |
| Total | 722 (100.0%) | 1,047 (100.0%) |
Health & Disability in Brownsville
Health Insurance Coverage by Age in Brownsville
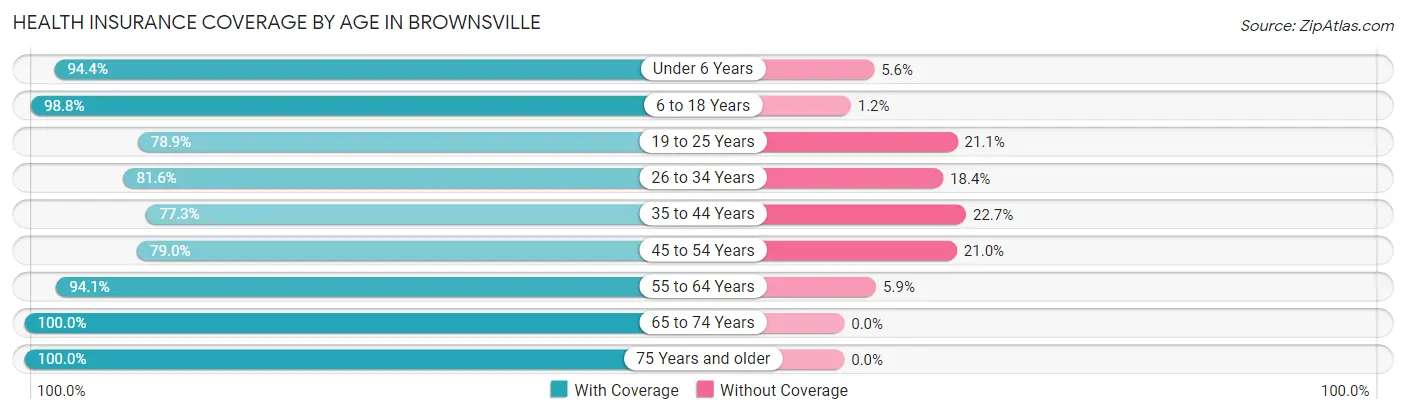
| Age Bracket | With Coverage | Without Coverage |
| Under 6 Years | 660 (94.4%) | 39 (5.6%) |
| 6 to 18 Years | 1,717 (98.8%) | 21 (1.2%) |
| 19 to 25 Years | 504 (78.9%) | 135 (21.1%) |
| 26 to 34 Years | 1,035 (81.6%) | 234 (18.4%) |
| 35 to 44 Years | 895 (77.3%) | 263 (22.7%) |
| 45 to 54 Years | 959 (79.0%) | 255 (21.0%) |
| 55 to 64 Years | 1,220 (94.1%) | 77 (5.9%) |
| 65 to 74 Years | 937 (100.0%) | 0 (0.0%) |
| 75 Years and older | 681 (100.0%) | 0 (0.0%) |
| Total | 8,608 (89.4%) | 1,024 (10.6%) |
Health Insurance Coverage by Citizenship Status in Brownsville
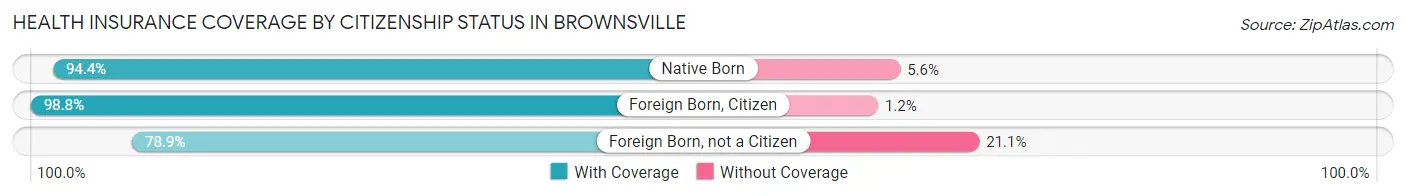
| Citizenship Status | With Coverage | Without Coverage |
| Native Born | 660 (94.4%) | 39 (5.6%) |
| Foreign Born, Citizen | 1,717 (98.8%) | 21 (1.2%) |
| Foreign Born, not a Citizen | 504 (78.9%) | 135 (21.1%) |
Health Insurance Coverage by Household Income in Brownsville
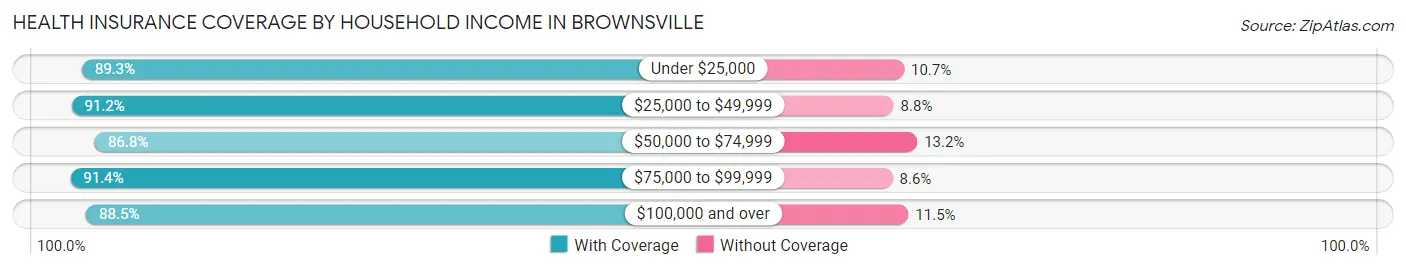
| Household Income | With Coverage | Without Coverage |
| Under $25,000 | 2,341 (89.3%) | 281 (10.7%) |
| $25,000 to $49,999 | 1,881 (91.2%) | 181 (8.8%) |
| $50,000 to $74,999 | 1,698 (86.8%) | 258 (13.2%) |
| $75,000 to $99,999 | 1,278 (91.4%) | 120 (8.6%) |
| $100,000 and over | 1,410 (88.5%) | 184 (11.5%) |
Public vs Private Health Insurance Coverage by Age in Brownsville
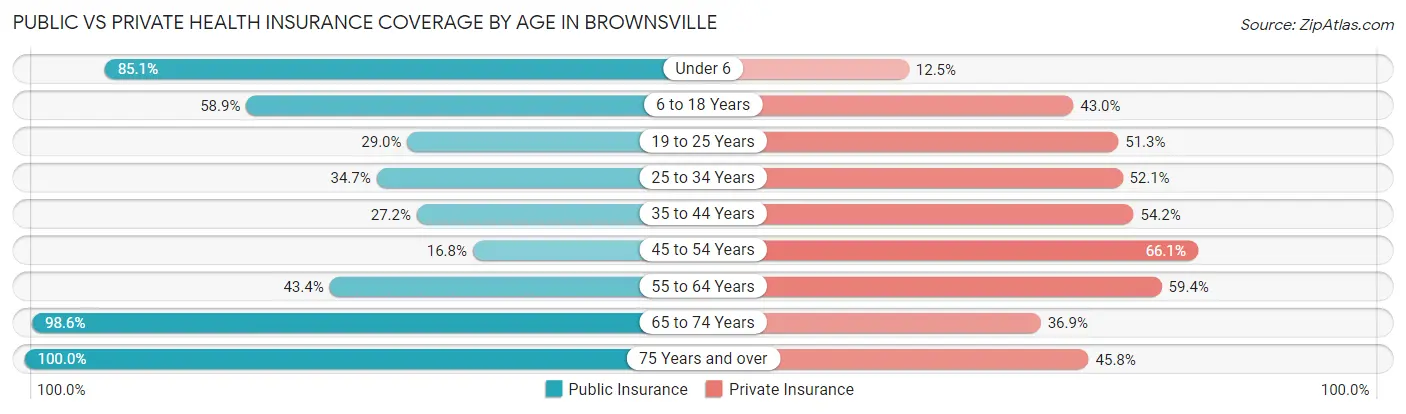
| Age Bracket | Public Insurance | Private Insurance |
| Under 6 | 595 (85.1%) | 87 (12.4%) |
| 6 to 18 Years | 1,023 (58.9%) | 747 (43.0%) |
| 19 to 25 Years | 185 (28.9%) | 328 (51.3%) |
| 25 to 34 Years | 440 (34.7%) | 661 (52.1%) |
| 35 to 44 Years | 315 (27.2%) | 627 (54.1%) |
| 45 to 54 Years | 204 (16.8%) | 802 (66.1%) |
| 55 to 64 Years | 563 (43.4%) | 770 (59.4%) |
| 65 to 74 Years | 924 (98.6%) | 346 (36.9%) |
| 75 Years and over | 681 (100.0%) | 312 (45.8%) |
| Total | 4,930 (51.2%) | 4,680 (48.6%) |
Disability Status by Sex by Age in Brownsville
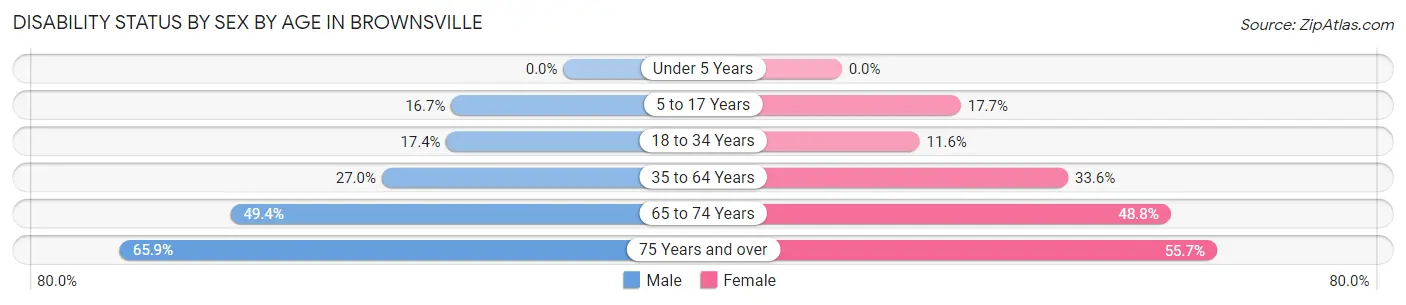
| Age Bracket | Male | Female |
| Under 5 Years | 0 (0.0%) | 0 (0.0%) |
| 5 to 17 Years | 143 (16.7%) | 156 (17.7%) |
| 18 to 34 Years | 171 (17.4%) | 118 (11.6%) |
| 35 to 64 Years | 458 (27.0%) | 662 (33.6%) |
| 65 to 74 Years | 213 (49.4%) | 247 (48.8%) |
| 75 Years and over | 135 (65.8%) | 265 (55.7%) |
Disability Class by Sex by Age in Brownsville
Disability Class: Hearing Difficulty
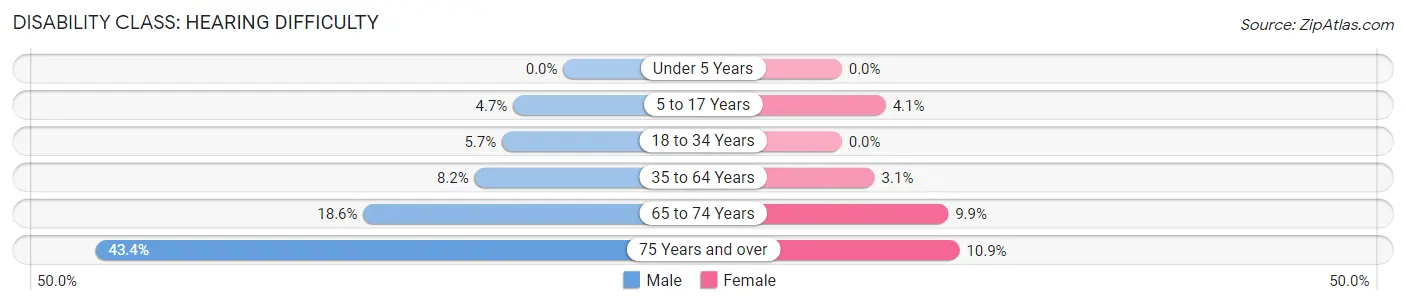
| Age Bracket | Male | Female |
| Under 5 Years | 0 (0.0%) | 0 (0.0%) |
| 5 to 17 Years | 40 (4.7%) | 36 (4.1%) |
| 18 to 34 Years | 56 (5.7%) | 0 (0.0%) |
| 35 to 64 Years | 140 (8.2%) | 60 (3.0%) |
| 65 to 74 Years | 80 (18.6%) | 50 (9.9%) |
| 75 Years and over | 89 (43.4%) | 52 (10.9%) |
Disability Class: Vision Difficulty
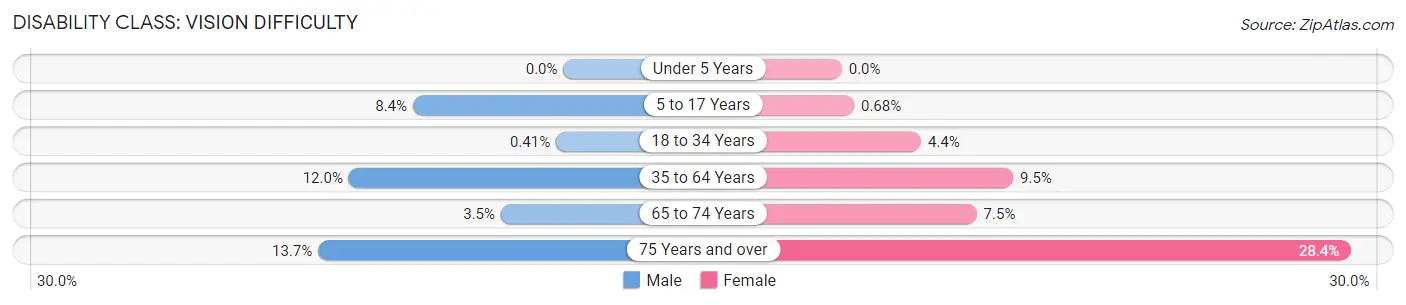
| Age Bracket | Male | Female |
| Under 5 Years | 0 (0.0%) | 0 (0.0%) |
| 5 to 17 Years | 72 (8.4%) | 6 (0.7%) |
| 18 to 34 Years | 4 (0.4%) | 45 (4.4%) |
| 35 to 64 Years | 203 (11.9%) | 188 (9.5%) |
| 65 to 74 Years | 15 (3.5%) | 38 (7.5%) |
| 75 Years and over | 28 (13.7%) | 135 (28.4%) |
Disability Class: Cognitive Difficulty
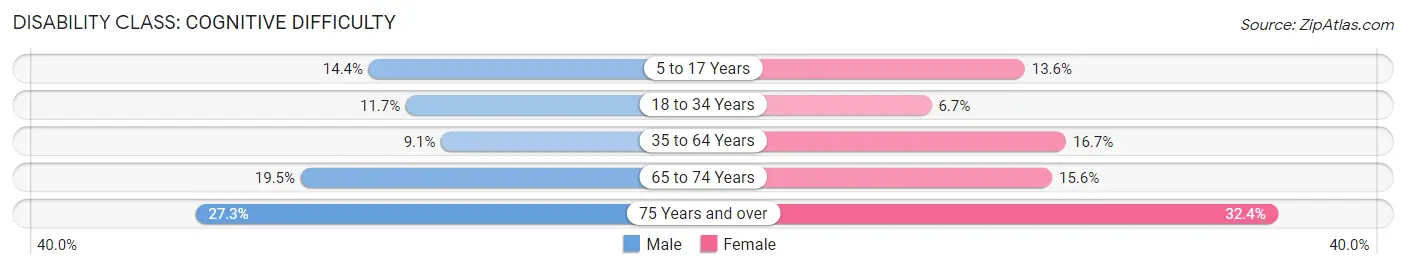
| Age Bracket | Male | Female |
| 5 to 17 Years | 124 (14.4%) | 120 (13.6%) |
| 18 to 34 Years | 115 (11.7%) | 68 (6.7%) |
| 35 to 64 Years | 154 (9.1%) | 328 (16.7%) |
| 65 to 74 Years | 84 (19.5%) | 79 (15.6%) |
| 75 Years and over | 56 (27.3%) | 154 (32.4%) |
Disability Class: Ambulatory Difficulty
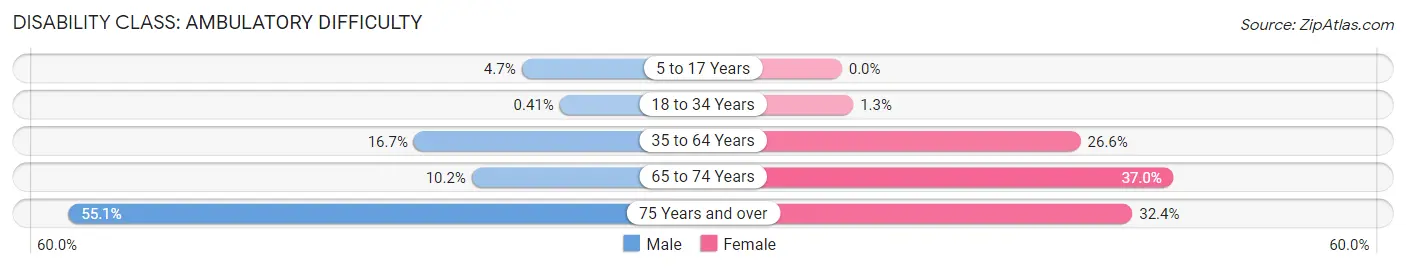
| Age Bracket | Male | Female |
| 5 to 17 Years | 40 (4.7%) | 0 (0.0%) |
| 18 to 34 Years | 4 (0.4%) | 13 (1.3%) |
| 35 to 64 Years | 283 (16.7%) | 524 (26.6%) |
| 65 to 74 Years | 44 (10.2%) | 187 (37.0%) |
| 75 Years and over | 113 (55.1%) | 154 (32.4%) |
Disability Class: Self-Care Difficulty
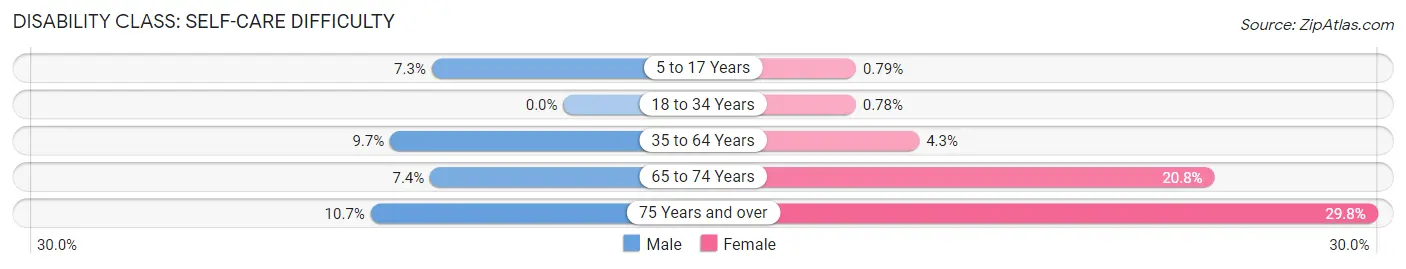
| Age Bracket | Male | Female |
| 5 to 17 Years | 63 (7.3%) | 7 (0.8%) |
| 18 to 34 Years | 0 (0.0%) | 8 (0.8%) |
| 35 to 64 Years | 164 (9.7%) | 85 (4.3%) |
| 65 to 74 Years | 32 (7.4%) | 105 (20.7%) |
| 75 Years and over | 22 (10.7%) | 142 (29.8%) |
Technology Access in Brownsville
Computing Device Access in Brownsville
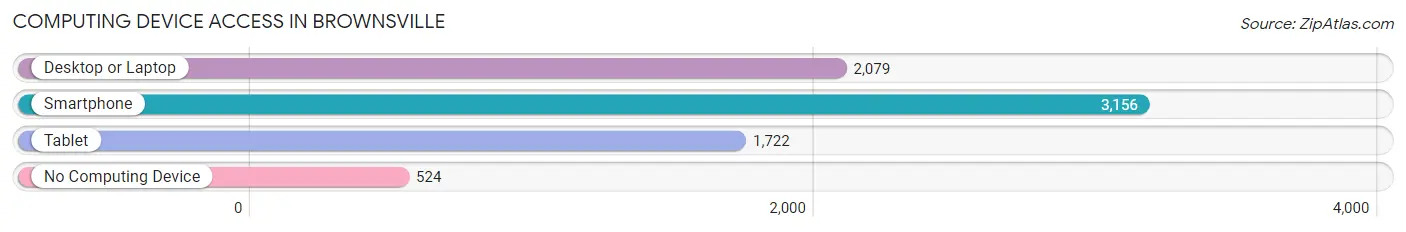
| Device Type | # Households | % Households |
| Desktop or Laptop | 2,079 | 52.8% |
| Smartphone | 3,156 | 80.2% |
| Tablet | 1,722 | 43.8% |
| No Computing Device | 524 | 13.3% |
| Total | 3,934 | 100.0% |
Internet Access in Brownsville
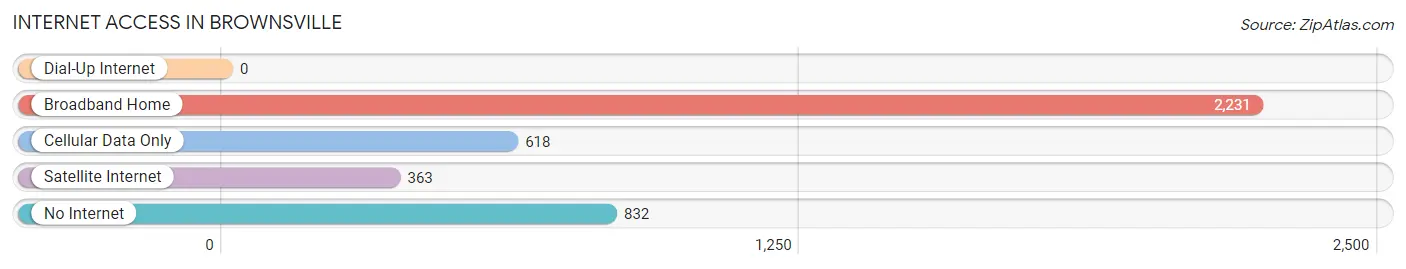
| Internet Type | # Households | % Households |
| Dial-Up Internet | 0 | 0.0% |
| Broadband Home | 2,231 | 56.7% |
| Cellular Data Only | 618 | 15.7% |
| Satellite Internet | 363 | 9.2% |
| No Internet | 832 | 21.1% |
| Total | 3,934 | 100.0% |
Brownsville Summary
Brownsville is a city located in Haywood County, Tennessee, United States. It is the county seat of Haywood County and is located in the western part of the state. The population of Brownsville was 10,292 at the 2010 census.
History
The area that is now Brownsville was first settled in 1823 by John and William Doak, two brothers from North Carolina. The Doaks named the settlement after their hometown of Brownsville, North Carolina. The town was officially incorporated in 1825 and was named the county seat of Haywood County in 1827.
In the early years of its existence, Brownsville was a small agricultural community. The town was home to several cotton plantations and was a major center for the production of cotton. The town also had a thriving lumber industry, with several sawmills located in the area.
In the late 19th century, Brownsville began to experience a period of growth and development. The town was connected to the rest of the state by the Memphis and Charleston Railroad in 1857. This allowed for the transportation of goods and people to and from the town. The railroad also helped to spur the growth of the town's economy.
In the early 20th century, Brownsville experienced a period of decline. The Great Depression of the 1930s caused many of the town's businesses to close and the population to decrease. The town was also affected by the decline of the cotton industry in the region.
In the late 20th century, Brownsville began to experience a period of revitalization. The town was designated as a Tennessee Main Street Community in 1989 and has since seen a resurgence in its economy. The town has also seen an increase in tourism due to its proximity to the Great Smoky Mountains National Park.
Geography
Brownsville is located in western Tennessee, in Haywood County. The city is situated at the intersection of U.S. Route 70 and State Route 76. The city is located approximately 50 miles east of Memphis and approximately 100 miles west of Nashville.
The city is located in the western part of the state, in the foothills of the Appalachian Mountains. The city is situated on the banks of the Hatchie River, which flows through the city. The city is located in a region of rolling hills and valleys.
Economy
The economy of Brownsville is largely based on agriculture and manufacturing. The city is home to several large agricultural operations, including cotton, soybeans, corn, and wheat. The city is also home to several manufacturing companies, including a furniture factory, a plastics factory, and a paper mill.
The city is also home to several retail stores, restaurants, and other businesses. The city is also home to several educational institutions, including the University of Tennessee at Martin, the University of Memphis, and the University of Tennessee at Chattanooga.
Demographics
As of the 2010 census, the population of Brownsville was 10,292. The racial makeup of the city was 65.3% White, 30.2% African American, 0.3% Native American, 0.7% Asian, 0.1% Pacific Islander, 1.7% from other races, and 1.9% from two or more races. Hispanic or Latino of any race were 3.3% of the population.
The median income for a household in the city was $30,945, and the median income for a family was $37,917. The per capita income for the city was $17,845. About 19.2% of families and 22.3% of the population were below the poverty line, including 33.2% of those under age 18 and 16.2% of those age 65 or over.
Common Questions
What is Per Capita Income in Brownsville?
Per Capita income in Brownsville is $22,379.
What is the Median Family Income in Brownsville?
Median Family Income in Brownsville is $41,731.
What is the Median Household income in Brownsville?
Median Household Income in Brownsville is $38,662.
What is Income or Wage Gap in Brownsville?
Income or Wage Gap in Brownsville is 28.4%.
Women in Brownsville earn 71.6 cents for every dollar earned by a man.
What is Family Income Deficit in Brownsville?
Family Income Deficit in Brownsville is $9,893.
Families that are below poverty line in Brownsville earn $9,893 less on average than the poverty threshold level.
What is Inequality or Gini Index in Brownsville?
Inequality or Gini Index in Brownsville is 0.48.
What is the Total Population of Brownsville?
Total Population of Brownsville is 9,739.
What is the Total Male Population of Brownsville?
Total Male Population of Brownsville is 4,506.
What is the Total Female Population of Brownsville?
Total Female Population of Brownsville is 5,233.
What is the Ratio of Males per 100 Females in Brownsville?
There are 86.11 Males per 100 Females in Brownsville.
What is the Ratio of Females per 100 Males in Brownsville?
There are 116.13 Females per 100 Males in Brownsville.
What is the Median Population Age in Brownsville?
Median Population Age in Brownsville is 41.1 Years.
What is the Average Family Size in Brownsville
Average Family Size in Brownsville is 3.2 People.
What is the Average Household Size in Brownsville
Average Household Size in Brownsville is 2.5 People.
How Large is the Labor Force in Brownsville?
There are 4,418 People in the Labor Forcein in Brownsville.
What is the Percentage of People in the Labor Force in Brownsville?
57.5% of People are in the Labor Force in Brownsville.
What is the Unemployment Rate in Brownsville?
Unemployment Rate in Brownsville is 11.5%.