Elizabethton, TN Map & Demographics
Elizabethton Map
Elizabethton Overview
$26,827
PER CAPITA INCOME
$53,214
AVG FAMILY INCOME
$44,252
AVG HOUSEHOLD INCOME
28.9%
WAGE / INCOME GAP [ % ]
71.1¢/ $1
WAGE / INCOME GAP [ $ ]
0.46
INEQUALITY / GINI INDEX
14,375
TOTAL POPULATION
6,802
MALE POPULATION
7,573
FEMALE POPULATION
89.82
MALES / 100 FEMALES
111.33
FEMALES / 100 MALES
39.4
MEDIAN AGE
3.0
AVG FAMILY SIZE
2.3
AVG HOUSEHOLD SIZE
5,952
LABOR FORCE [ PEOPLE ]
50.6%
PERCENT IN LABOR FORCE
6.9%
UNEMPLOYMENT RATE
Elizabethton Zip Codes
Elizabethton Area Codes
Income in Elizabethton
Income Overview in Elizabethton
Per Capita Income in Elizabethton is $26,827, while median incomes of families and households are $53,214 and $44,252 respectively.
| Characteristic | Number | Measure |
| Per Capita Income | 14,375 | $26,827 |
| Median Family Income | 3,314 | $53,214 |
| Mean Family Income | 3,314 | $72,099 |
| Median Household Income | 5,616 | $44,252 |
| Mean Household Income | 5,616 | $59,965 |
| Income Deficit | 3,314 | $0 |
| Wage / Income Gap (%) | 14,375 | 28.90% |
| Wage / Income Gap ($) | 14,375 | 71.10¢ per $1 |
| Gini / Inequality Index | 14,375 | 0.46 |
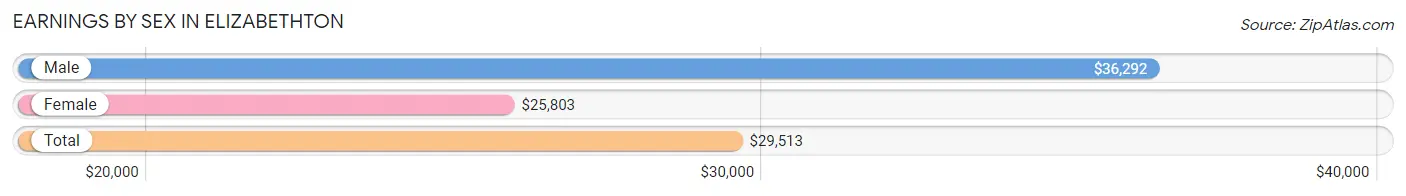
Earnings by Sex in Elizabethton
Average Earnings in Elizabethton are $29,513, $36,292 for men and $25,803 for women, a difference of 28.9%.
| Sex | Number | Average Earnings |
| Male | 3,236 (51.4%) | $36,292 |
| Female | 3,059 (48.6%) | $25,803 |
| Total | 6,295 (100.0%) | $29,513 |
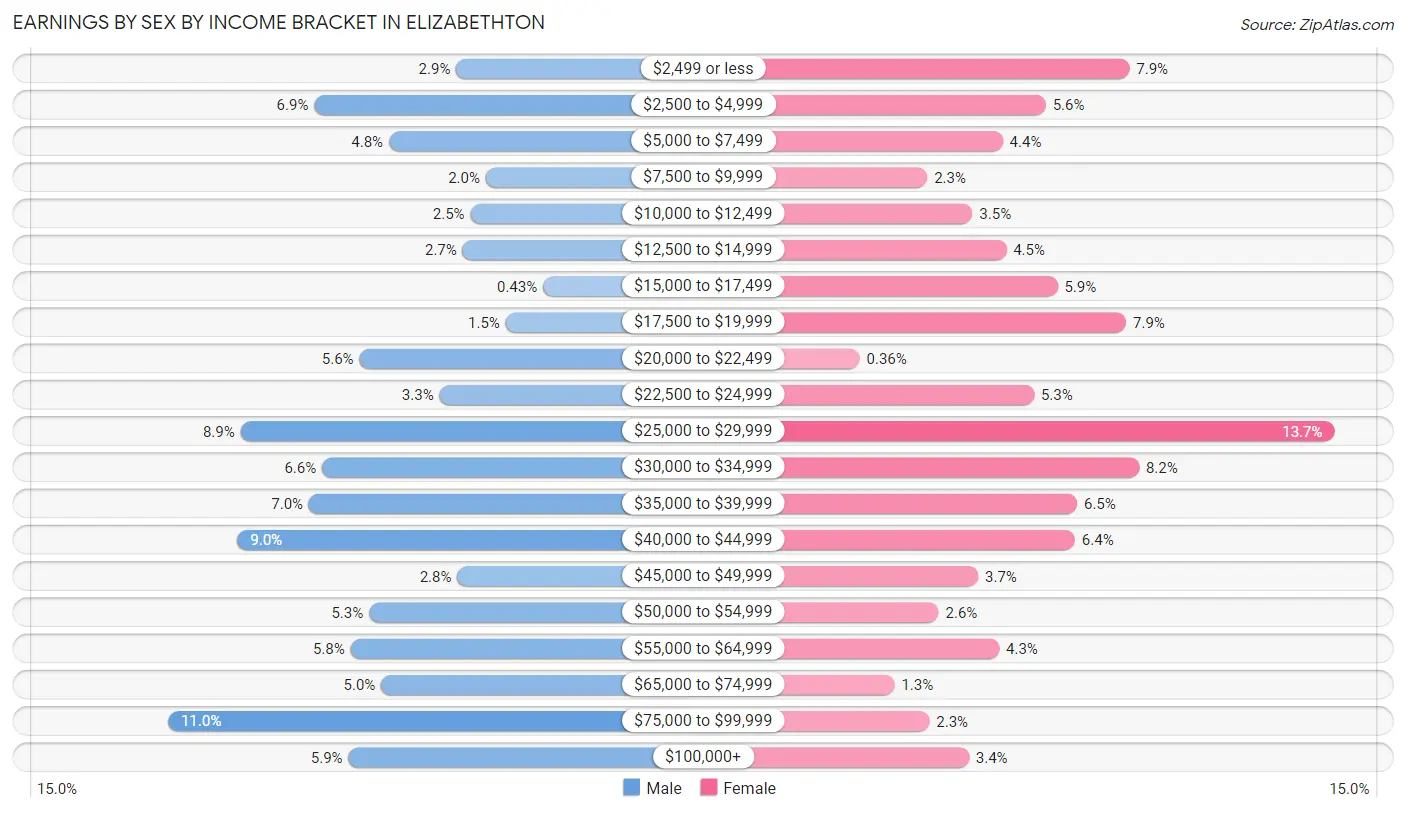
Earnings by Sex by Income Bracket in Elizabethton
The most common earnings brackets in Elizabethton are $75,000 to $99,999 for men (355 | 11.0%) and $25,000 to $29,999 for women (419 | 13.7%).
| Income | Male | Female |
| $2,499 or less | 93 (2.9%) | 243 (7.9%) |
| $2,500 to $4,999 | 222 (6.9%) | 171 (5.6%) |
| $5,000 to $7,499 | 154 (4.8%) | 134 (4.4%) |
| $7,500 to $9,999 | 66 (2.0%) | 69 (2.3%) |
| $10,000 to $12,499 | 80 (2.5%) | 108 (3.5%) |
| $12,500 to $14,999 | 87 (2.7%) | 137 (4.5%) |
| $15,000 to $17,499 | 14 (0.4%) | 181 (5.9%) |
| $17,500 to $19,999 | 48 (1.5%) | 240 (7.9%) |
| $20,000 to $22,499 | 181 (5.6%) | 11 (0.4%) |
| $22,500 to $24,999 | 108 (3.3%) | 161 (5.3%) |
| $25,000 to $29,999 | 289 (8.9%) | 419 (13.7%) |
| $30,000 to $34,999 | 215 (6.6%) | 251 (8.2%) |
| $35,000 to $39,999 | 227 (7.0%) | 198 (6.5%) |
| $40,000 to $44,999 | 292 (9.0%) | 196 (6.4%) |
| $45,000 to $49,999 | 92 (2.8%) | 113 (3.7%) |
| $50,000 to $54,999 | 172 (5.3%) | 79 (2.6%) |
| $55,000 to $64,999 | 189 (5.8%) | 131 (4.3%) |
| $65,000 to $74,999 | 161 (5.0%) | 41 (1.3%) |
| $75,000 to $99,999 | 355 (11.0%) | 71 (2.3%) |
| $100,000+ | 191 (5.9%) | 105 (3.4%) |
| Total | 3,236 (100.0%) | 3,059 (100.0%) |
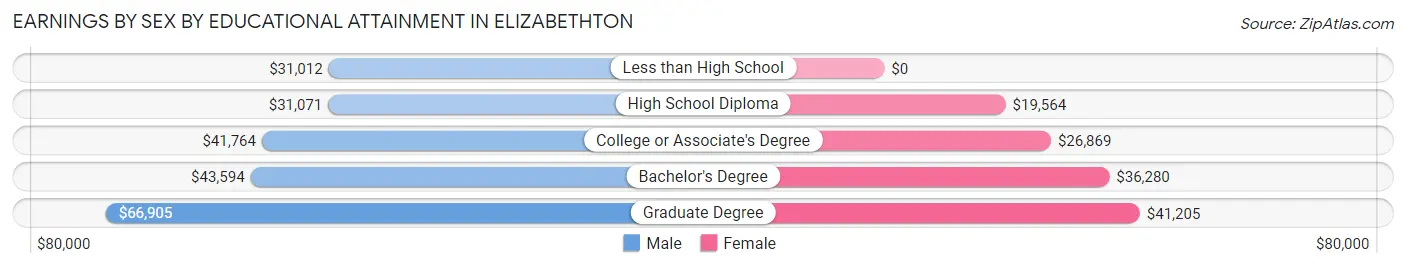
Earnings by Sex by Educational Attainment in Elizabethton
Average earnings in Elizabethton are $40,563 for men and $28,504 for women, a difference of 29.7%. Men with an educational attainment of graduate degree enjoy the highest average annual earnings of $66,905, while those with less than high school education earn the least with $31,012. Women with an educational attainment of graduate degree earn the most with the average annual earnings of $41,205, while those with high school diploma education have the smallest earnings of $19,564.
| Educational Attainment | Male Income | Female Income |
| Less than High School | $31,012 | $0 |
| High School Diploma | $31,071 | $19,564 |
| College or Associate's Degree | $41,764 | $26,869 |
| Bachelor's Degree | $43,594 | $36,280 |
| Graduate Degree | $66,905 | $41,205 |
| Total | $40,563 | $28,504 |
Family Income in Elizabethton
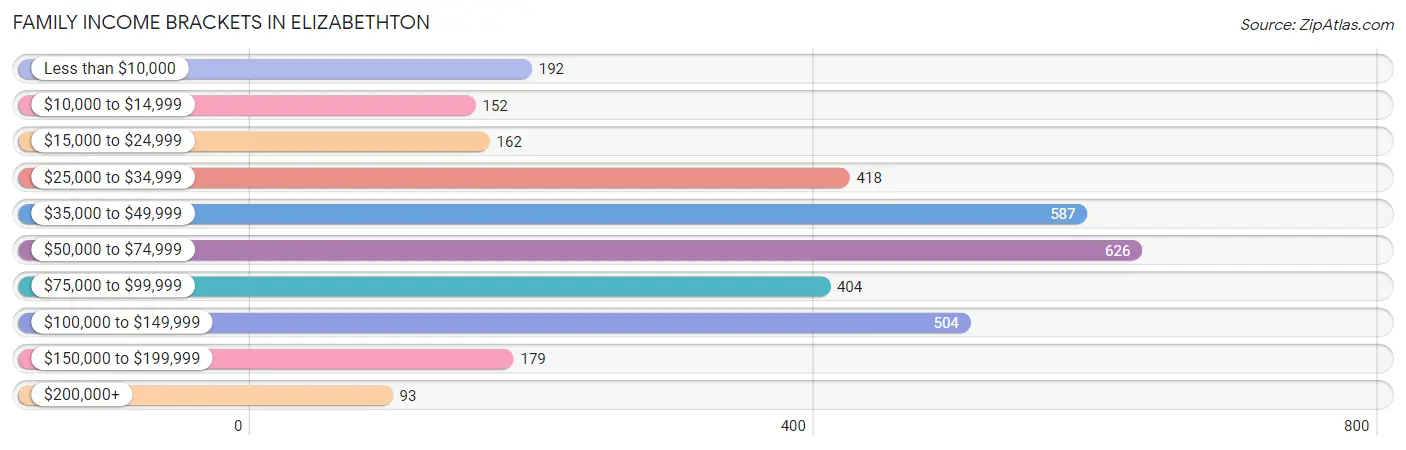
Family Income Brackets in Elizabethton
According to the Elizabethton family income data, there are 626 families falling into the $50,000 to $74,999 income range, which is the most common income bracket and makes up 18.9% of all families. Conversely, the $200,000+ income bracket is the least frequent group with only 93 families (2.8%) belonging to this category.
| Income Bracket | # Families | % Families |
| Less than $10,000 | 192 | 5.8% |
| $10,000 to $14,999 | 152 | 4.6% |
| $15,000 to $24,999 | 162 | 4.9% |
| $25,000 to $34,999 | 418 | 12.6% |
| $35,000 to $49,999 | 587 | 17.7% |
| $50,000 to $74,999 | 626 | 18.9% |
| $75,000 to $99,999 | 404 | 12.2% |
| $100,000 to $149,999 | 504 | 15.2% |
| $150,000 to $199,999 | 179 | 5.4% |
| $200,000+ | 93 | 2.8% |
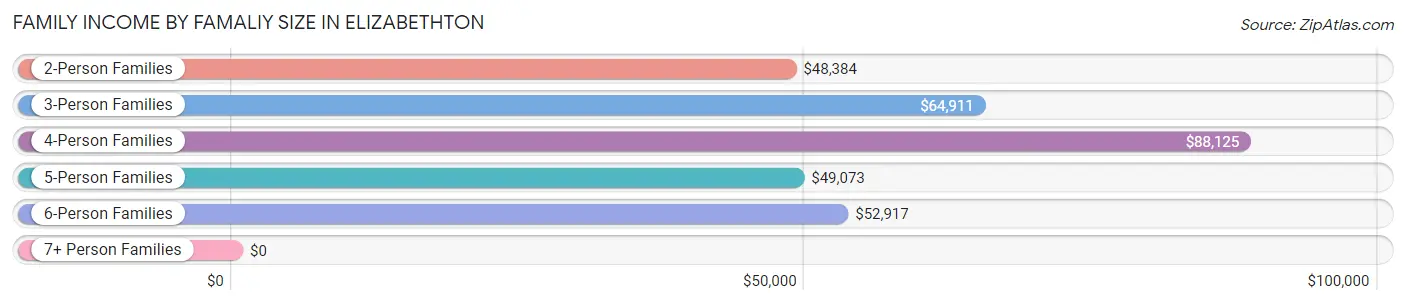
Family Income by Famaliy Size in Elizabethton
4-person families (416 | 12.6%) account for the highest median family income in Elizabethton with $88,125 per family, while 2-person families (1,794 | 54.1%) have the highest median income of $24,192 per family member.
| Income Bracket | # Families | Median Income |
| 2-Person Families | 1,794 (54.1%) | $48,384 |
| 3-Person Families | 699 (21.1%) | $64,911 |
| 4-Person Families | 416 (12.6%) | $88,125 |
| 5-Person Families | 287 (8.7%) | $49,073 |
| 6-Person Families | 88 (2.7%) | $52,917 |
| 7+ Person Families | 30 (0.9%) | $0 |
| Total | 3,314 (100.0%) | $53,214 |
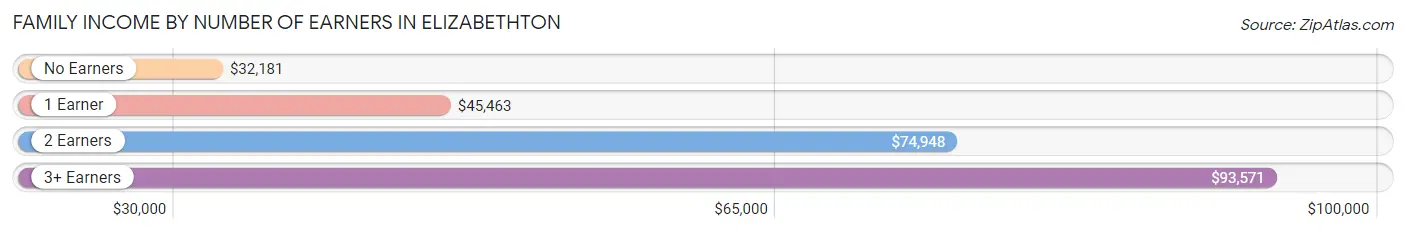
Family Income by Number of Earners in Elizabethton
The median family income in Elizabethton is $53,214, with families comprising 3+ earners (214) having the highest median family income of $93,571, while families with no earners (787) have the lowest median family income of $32,181, accounting for 6.5% and 23.7% of families, respectively.
| Number of Earners | # Families | Median Income |
| No Earners | 787 (23.7%) | $32,181 |
| 1 Earner | 1,170 (35.3%) | $45,463 |
| 2 Earners | 1,143 (34.5%) | $74,948 |
| 3+ Earners | 214 (6.5%) | $93,571 |
| Total | 3,314 (100.0%) | $53,214 |
Household Income in Elizabethton
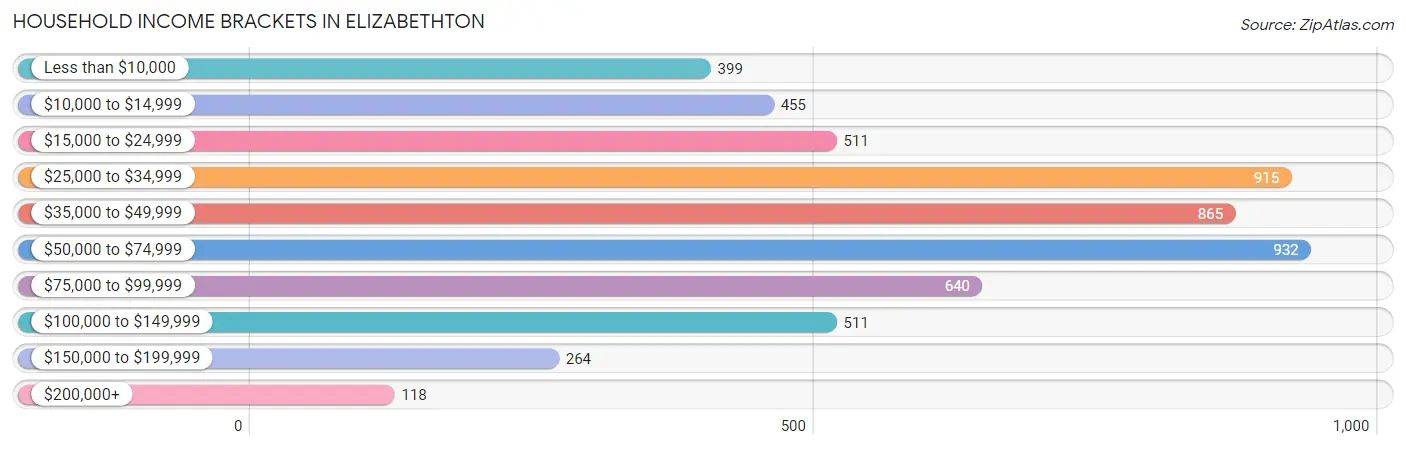
Household Income Brackets in Elizabethton
With 932 households falling in the category, the $50,000 to $74,999 income range is the most frequent in Elizabethton, accounting for 16.6% of all households. In contrast, only 118 households (2.1%) fall into the $200,000+ income bracket, making it the least populous group.
| Income Bracket | # Households | % Households |
| Less than $10,000 | 399 | 7.1% |
| $10,000 to $14,999 | 455 | 8.1% |
| $15,000 to $24,999 | 511 | 9.1% |
| $25,000 to $34,999 | 915 | 16.3% |
| $35,000 to $49,999 | 865 | 15.4% |
| $50,000 to $74,999 | 932 | 16.6% |
| $75,000 to $99,999 | 640 | 11.4% |
| $100,000 to $149,999 | 511 | 9.1% |
| $150,000 to $199,999 | 264 | 4.7% |
| $200,000+ | 118 | 2.1% |
Household Income by Householder Age in Elizabethton
The median household income in Elizabethton is $44,252, with the highest median household income of $54,329 found in the 45 to 64 years age bracket for the primary householder. A total of 1,798 households (32.0%) fall into this category. Meanwhile, the 65+ years age bracket for the primary householder has the lowest median household income of $34,521, with 1,691 households (30.1%) in this group.
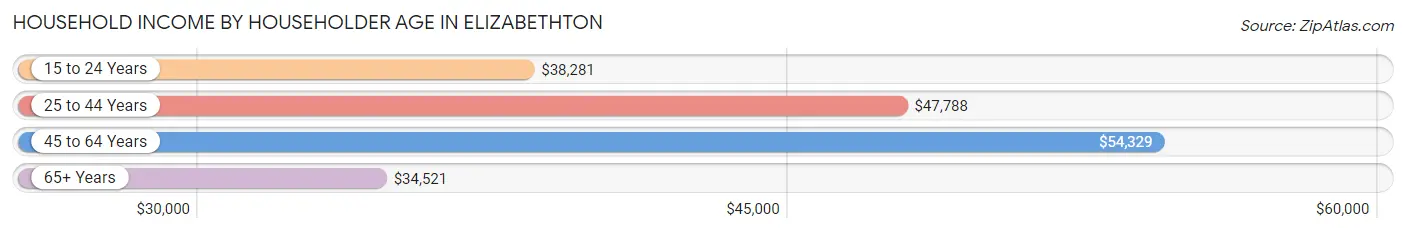
| Income Bracket | # Households | Median Income |
| 15 to 24 Years | 186 (3.3%) | $38,281 |
| 25 to 44 Years | 1,941 (34.6%) | $47,788 |
| 45 to 64 Years | 1,798 (32.0%) | $54,329 |
| 65+ Years | 1,691 (30.1%) | $34,521 |
| Total | 5,616 (100.0%) | $44,252 |
Poverty in Elizabethton
Income Below Poverty by Sex and Age in Elizabethton
With 18.3% poverty level for males and 22.8% for females among the residents of Elizabethton, 15 year old males and 5 year old females are the most vulnerable to poverty, with 39 males (100.0%) and 30 females (56.6%) in their respective age groups living below the poverty level.
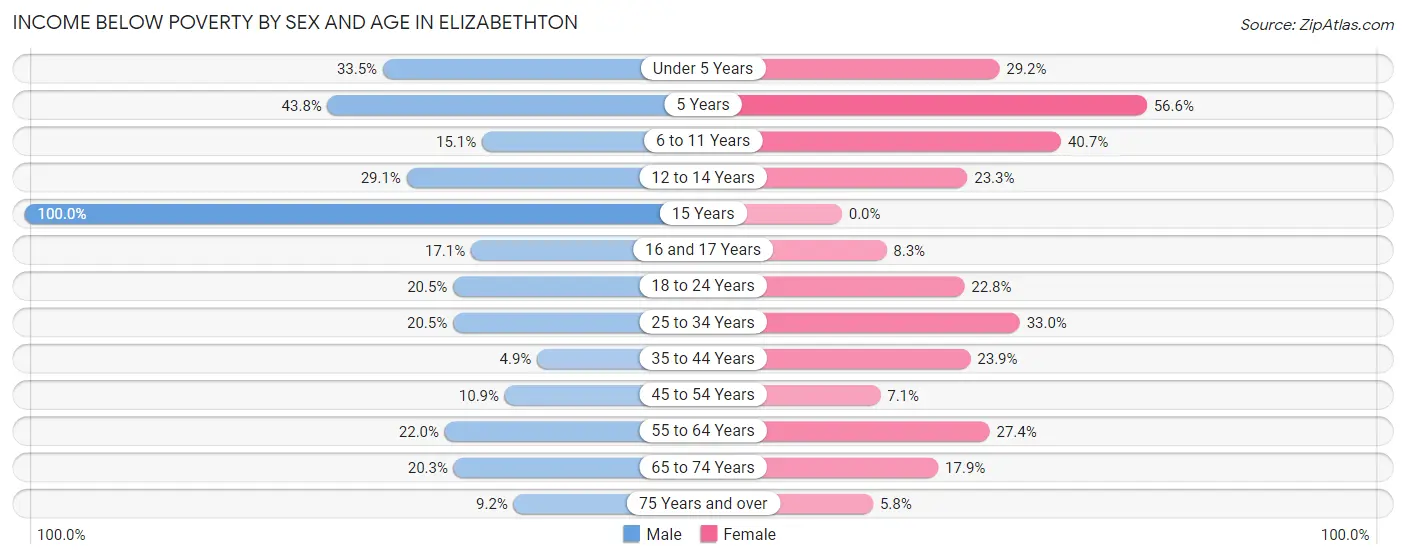
| Age Bracket | Male | Female |
| Under 5 Years | 140 (33.5%) | 112 (29.2%) |
| 5 Years | 28 (43.8%) | 30 (56.6%) |
| 6 to 11 Years | 72 (15.1%) | 223 (40.7%) |
| 12 to 14 Years | 57 (29.1%) | 51 (23.3%) |
| 15 Years | 39 (100.0%) | 0 (0.0%) |
| 16 and 17 Years | 42 (17.1%) | 11 (8.3%) |
| 18 to 24 Years | 72 (20.4%) | 96 (22.8%) |
| 25 to 34 Years | 226 (20.5%) | 346 (33.0%) |
| 35 to 44 Years | 25 (4.9%) | 214 (23.9%) |
| 45 to 54 Years | 115 (10.9%) | 46 (7.1%) |
| 55 to 64 Years | 170 (22.0%) | 229 (27.4%) |
| 65 to 74 Years | 99 (20.3%) | 134 (17.9%) |
| 75 Years and over | 40 (9.2%) | 43 (5.8%) |
| Total | 1,125 (18.3%) | 1,535 (22.8%) |
Income Above Poverty by Sex and Age in Elizabethton
According to the poverty statistics in Elizabethton, males aged 35 to 44 years and females aged 15 years are the age groups that are most secure financially, with 95.1% of males and 100.0% of females in these age groups living above the poverty line.
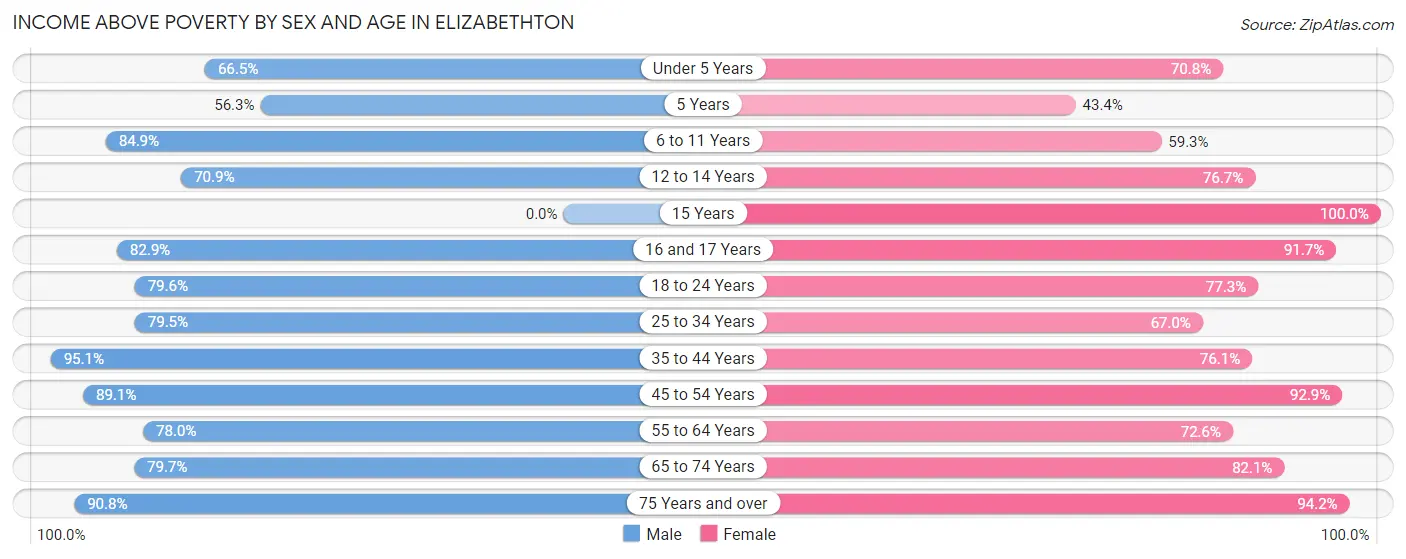
| Age Bracket | Male | Female |
| Under 5 Years | 278 (66.5%) | 271 (70.8%) |
| 5 Years | 36 (56.2%) | 23 (43.4%) |
| 6 to 11 Years | 405 (84.9%) | 325 (59.3%) |
| 12 to 14 Years | 139 (70.9%) | 168 (76.7%) |
| 15 Years | 0 (0.0%) | 66 (100.0%) |
| 16 and 17 Years | 203 (82.9%) | 122 (91.7%) |
| 18 to 24 Years | 280 (79.5%) | 326 (77.2%) |
| 25 to 34 Years | 878 (79.5%) | 702 (67.0%) |
| 35 to 44 Years | 489 (95.1%) | 683 (76.1%) |
| 45 to 54 Years | 944 (89.1%) | 598 (92.9%) |
| 55 to 64 Years | 603 (78.0%) | 606 (72.6%) |
| 65 to 74 Years | 388 (79.7%) | 615 (82.1%) |
| 75 Years and over | 394 (90.8%) | 701 (94.2%) |
| Total | 5,037 (81.7%) | 5,206 (77.2%) |
Income Below Poverty Among Married-Couple Families in Elizabethton
The poverty statistics for married-couple families in Elizabethton show that 4.9% or 109 of the total 2,242 families live below the poverty line. Families with 5 or more children have the highest poverty rate of 100.0%, comprising of 8 families. On the other hand, families with no children have the lowest poverty rate of 1.1%, which includes 16 families.
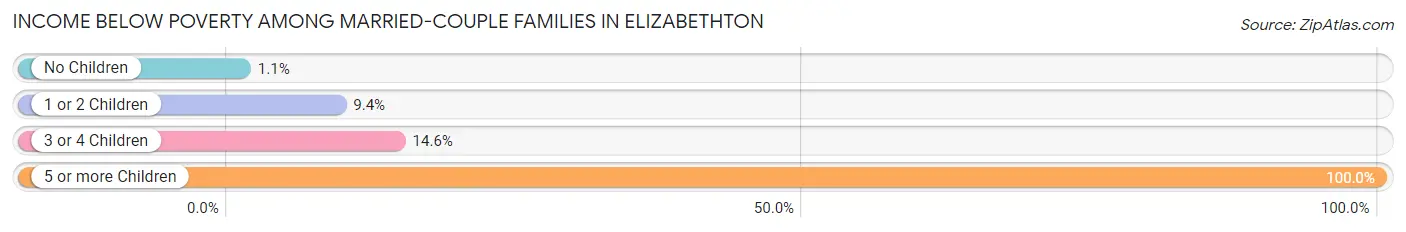
| Children | Above Poverty | Below Poverty |
| No Children | 1,418 (98.9%) | 16 (1.1%) |
| 1 or 2 Children | 557 (90.6%) | 58 (9.4%) |
| 3 or 4 Children | 158 (85.4%) | 27 (14.6%) |
| 5 or more Children | 0 (0.0%) | 8 (100.0%) |
| Total | 2,133 (95.1%) | 109 (4.9%) |
Income Below Poverty Among Single-Parent Households in Elizabethton
According to the poverty data in Elizabethton, 7.0% or 12 single-father households and 48.4% or 436 single-mother households are living below the poverty line. Among single-father households, those with 1 or 2 children have the highest poverty rate, with 12 households (9.3%) experiencing poverty. Likewise, among single-mother households, those with 5 or more children have the highest poverty rate, with 8 households (100.0%) falling below the poverty line.
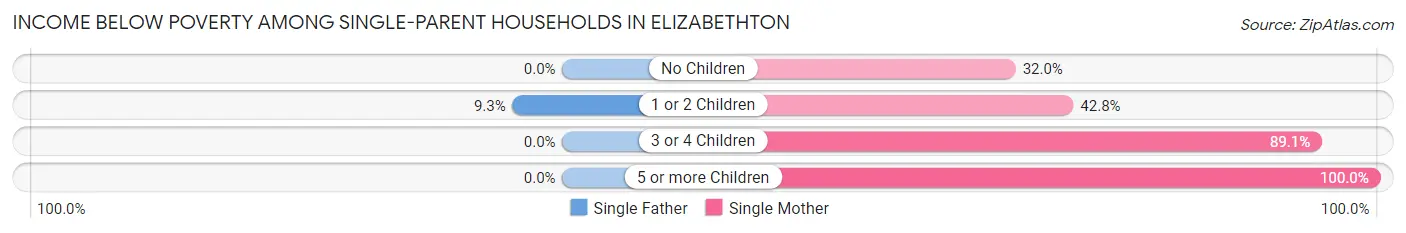
| Children | Single Father | Single Mother |
| No Children | 0 (0.0%) | 91 (32.0%) |
| 1 or 2 Children | 12 (9.3%) | 190 (42.8%) |
| 3 or 4 Children | 0 (0.0%) | 147 (89.1%) |
| 5 or more Children | 0 (0.0%) | 8 (100.0%) |
| Total | 12 (7.0%) | 436 (48.4%) |
Income Below Poverty Among Married-Couple vs Single-Parent Households in Elizabethton
The poverty data for Elizabethton shows that 109 of the married-couple family households (4.9%) and 448 of the single-parent households (41.8%) are living below the poverty level. Within the married-couple family households, those with 5 or more children have the highest poverty rate, with 8 households (100.0%) falling below the poverty line. Among the single-parent households, those with 5 or more children have the highest poverty rate, with 8 household (100.0%) living below poverty.
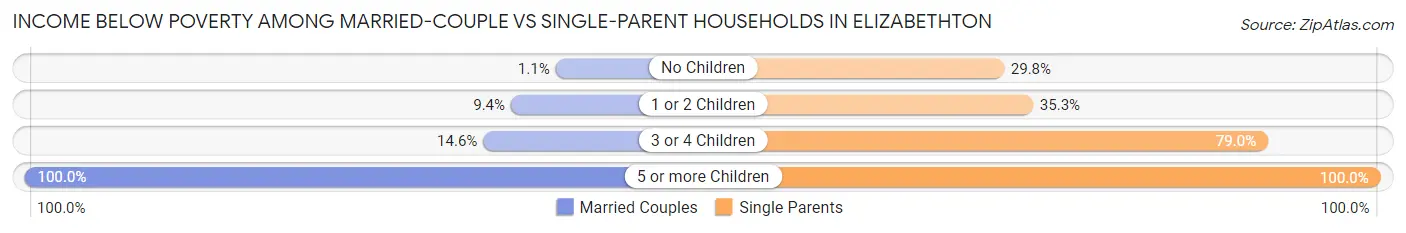
| Children | Married-Couple Families | Single-Parent Households |
| No Children | 16 (1.1%) | 91 (29.8%) |
| 1 or 2 Children | 58 (9.4%) | 202 (35.2%) |
| 3 or 4 Children | 27 (14.6%) | 147 (79.0%) |
| 5 or more Children | 8 (100.0%) | 8 (100.0%) |
| Total | 109 (4.9%) | 448 (41.8%) |
Race in Elizabethton
The most populous races in Elizabethton are White / Caucasian (12,813 | 89.1%), Black / African American (807 | 5.6%), and Hispanic or Latino (496 | 3.5%).
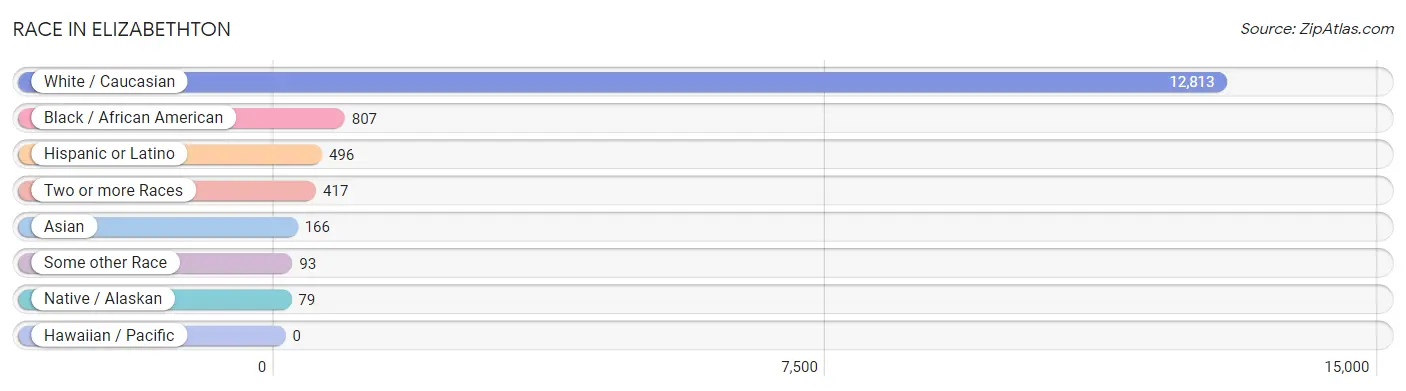
| Race | # Population | % Population |
| Asian | 166 | 1.1% |
| Black / African American | 807 | 5.6% |
| Hawaiian / Pacific | 0 | 0.0% |
| Hispanic or Latino | 496 | 3.5% |
| Native / Alaskan | 79 | 0.5% |
| White / Caucasian | 12,813 | 89.1% |
| Two or more Races | 417 | 2.9% |
| Some other Race | 93 | 0.6% |
| Total | 14,375 | 100.0% |
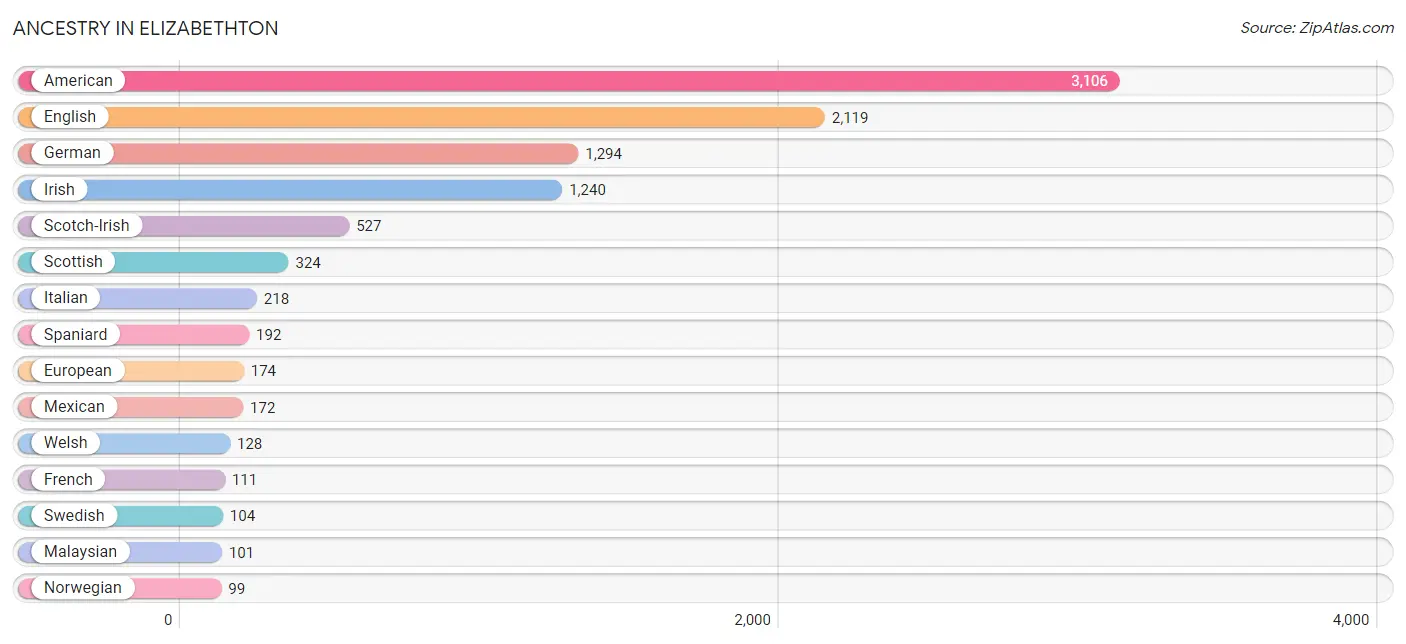
Ancestry in Elizabethton
The most populous ancestries reported in Elizabethton are American (3,106 | 21.6%), English (2,119 | 14.7%), German (1,294 | 9.0%), Irish (1,240 | 8.6%), and Scotch-Irish (527 | 3.7%), together accounting for 57.7% of all Elizabethton residents.
| Ancestry | # Population | % Population |
| African | 7 | 0.1% |
| American | 3,106 | 21.6% |
| Arab | 43 | 0.3% |
| Armenian | 16 | 0.1% |
| Bhutanese | 24 | 0.2% |
| Blackfeet | 8 | 0.1% |
| British | 69 | 0.5% |
| Burmese | 89 | 0.6% |
| Canadian | 57 | 0.4% |
| Central American | 91 | 0.6% |
| Central American Indian | 68 | 0.5% |
| Cherokee | 82 | 0.6% |
| Colombian | 9 | 0.1% |
| Cuban | 7 | 0.1% |
| Czech | 44 | 0.3% |
| Danish | 28 | 0.2% |
| Dutch | 94 | 0.6% |
| Eastern European | 15 | 0.1% |
| Egyptian | 37 | 0.3% |
| English | 2,119 | 14.7% |
| Estonian | 14 | 0.1% |
| Ethiopian | 71 | 0.5% |
| European | 174 | 1.2% |
| French | 111 | 0.8% |
| French Canadian | 27 | 0.2% |
| German | 1,294 | 9.0% |
| Greek | 27 | 0.2% |
| Guatemalan | 68 | 0.5% |
| Honduran | 23 | 0.2% |
| Hungarian | 70 | 0.5% |
| Indian (Asian) | 2 | 0.0% |
| Irish | 1,240 | 8.6% |
| Italian | 218 | 1.5% |
| Malaysian | 101 | 0.7% |
| Mexican | 172 | 1.2% |
| Native Hawaiian | 63 | 0.4% |
| Navajo | 1 | 0.0% |
| Northern European | 16 | 0.1% |
| Norwegian | 99 | 0.7% |
| Polish | 80 | 0.6% |
| Puerto Rican | 18 | 0.1% |
| Russian | 78 | 0.5% |
| Scandinavian | 29 | 0.2% |
| Scotch-Irish | 527 | 3.7% |
| Scottish | 324 | 2.2% |
| Slovak | 4 | 0.0% |
| Slovene | 9 | 0.1% |
| South American | 9 | 0.1% |
| Spaniard | 192 | 1.3% |
| Sri Lankan | 26 | 0.2% |
| Subsaharan African | 85 | 0.6% |
| Swedish | 104 | 0.7% |
| Swiss | 16 | 0.1% |
| Syrian | 6 | 0.0% |
| Thai | 31 | 0.2% |
| Turkish | 7 | 0.1% |
| Welsh | 128 | 0.9% |
| Zimbabwean | 7 | 0.1% | View All 58 Rows |
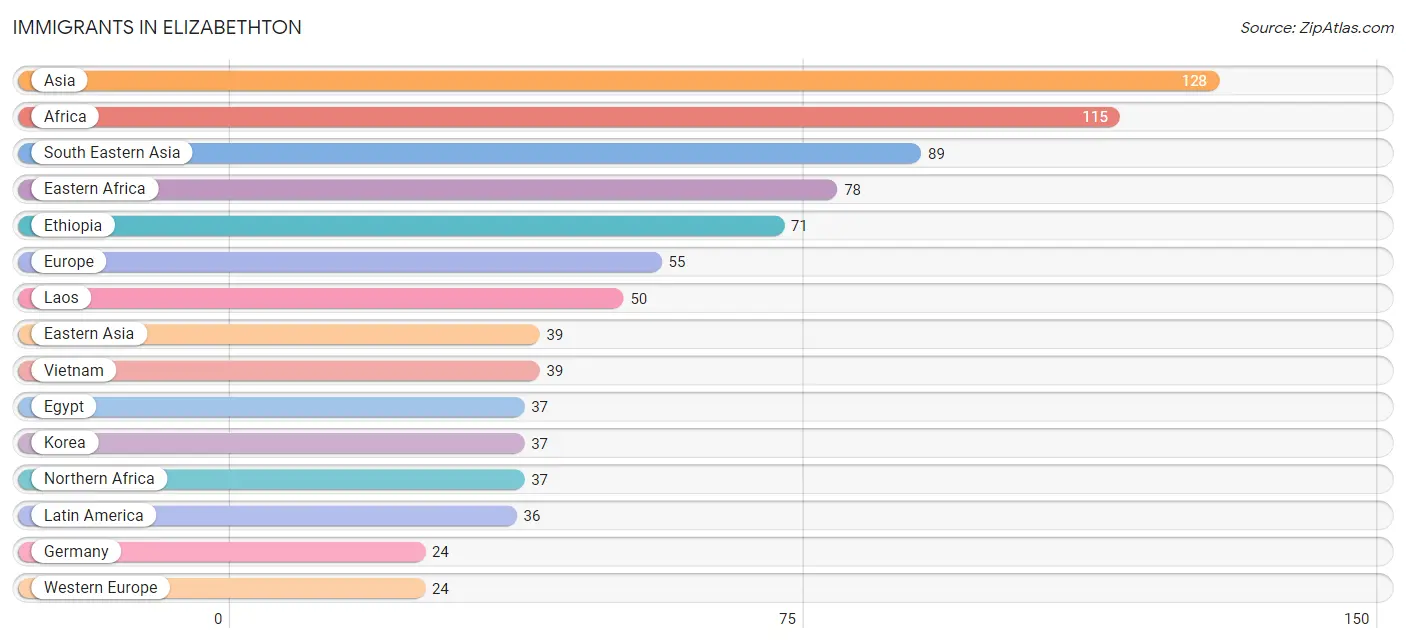
Immigrants in Elizabethton
The most numerous immigrant groups reported in Elizabethton came from Asia (128 | 0.9%), Africa (115 | 0.8%), South Eastern Asia (89 | 0.6%), Eastern Africa (78 | 0.5%), and Ethiopia (71 | 0.5%), together accounting for 3.3% of all Elizabethton residents.
| Immigration Origin | # Population | % Population |
| Africa | 115 | 0.8% |
| Asia | 128 | 0.9% |
| Caribbean | 21 | 0.2% |
| Central America | 15 | 0.1% |
| China | 2 | 0.0% |
| Cuba | 21 | 0.2% |
| Eastern Africa | 78 | 0.5% |
| Eastern Asia | 39 | 0.3% |
| Eastern Europe | 14 | 0.1% |
| Egypt | 37 | 0.3% |
| England | 6 | 0.0% |
| Ethiopia | 71 | 0.5% |
| Europe | 55 | 0.4% |
| Germany | 24 | 0.2% |
| Korea | 37 | 0.3% |
| Laos | 50 | 0.4% |
| Latin America | 36 | 0.3% |
| Mexico | 15 | 0.1% |
| Northern Africa | 37 | 0.3% |
| Northern Europe | 17 | 0.1% |
| Russia | 14 | 0.1% |
| South Eastern Asia | 89 | 0.6% |
| Taiwan | 2 | 0.0% |
| Vietnam | 39 | 0.3% |
| Western Europe | 24 | 0.2% |
| Zimbabwe | 7 | 0.1% | View All 26 Rows |
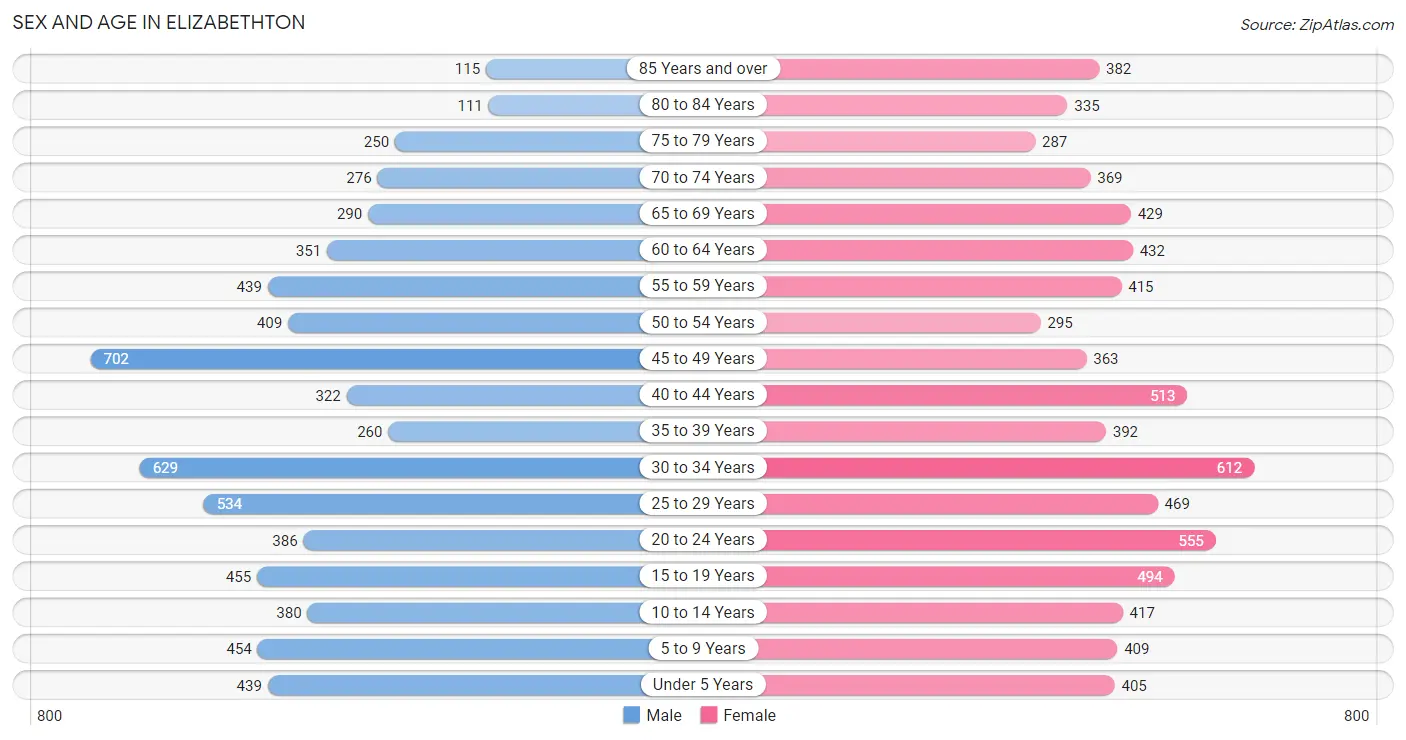
Sex and Age in Elizabethton
Sex and Age in Elizabethton
The most populous age groups in Elizabethton are 45 to 49 Years (702 | 10.3%) for men and 30 to 34 Years (612 | 8.1%) for women.
| Age Bracket | Male | Female |
| Under 5 Years | 439 (6.5%) | 405 (5.3%) |
| 5 to 9 Years | 454 (6.7%) | 409 (5.4%) |
| 10 to 14 Years | 380 (5.6%) | 417 (5.5%) |
| 15 to 19 Years | 455 (6.7%) | 494 (6.5%) |
| 20 to 24 Years | 386 (5.7%) | 555 (7.3%) |
| 25 to 29 Years | 534 (7.9%) | 469 (6.2%) |
| 30 to 34 Years | 629 (9.2%) | 612 (8.1%) |
| 35 to 39 Years | 260 (3.8%) | 392 (5.2%) |
| 40 to 44 Years | 322 (4.7%) | 513 (6.8%) |
| 45 to 49 Years | 702 (10.3%) | 363 (4.8%) |
| 50 to 54 Years | 409 (6.0%) | 295 (3.9%) |
| 55 to 59 Years | 439 (6.5%) | 415 (5.5%) |
| 60 to 64 Years | 351 (5.2%) | 432 (5.7%) |
| 65 to 69 Years | 290 (4.3%) | 429 (5.7%) |
| 70 to 74 Years | 276 (4.1%) | 369 (4.9%) |
| 75 to 79 Years | 250 (3.7%) | 287 (3.8%) |
| 80 to 84 Years | 111 (1.6%) | 335 (4.4%) |
| 85 Years and over | 115 (1.7%) | 382 (5.0%) |
| Total | 6,802 (100.0%) | 7,573 (100.0%) |
Families and Households in Elizabethton
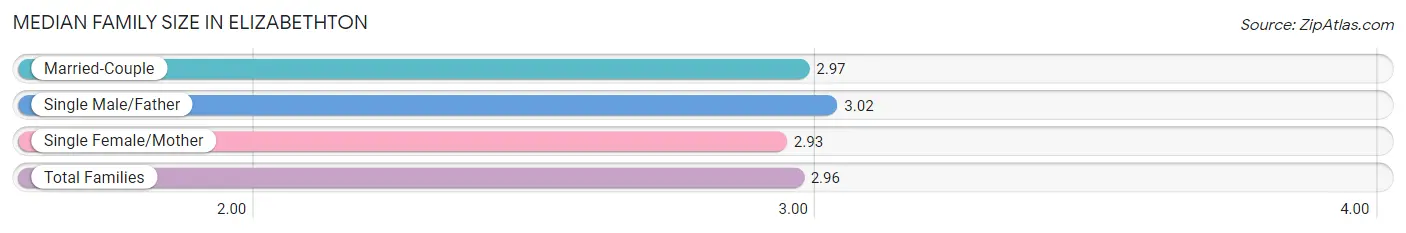
Median Family Size in Elizabethton
The median family size in Elizabethton is 2.96 persons per family, with single male/father families (171 | 5.2%) accounting for the largest median family size of 3.02 persons per family. On the other hand, single female/mother families (901 | 27.2%) represent the smallest median family size with 2.93 persons per family.
| Family Type | # Families | Family Size |
| Married-Couple | 2,242 (67.6%) | 2.97 |
| Single Male/Father | 171 (5.2%) | 3.02 |
| Single Female/Mother | 901 (27.2%) | 2.93 |
| Total Families | 3,314 (100.0%) | 2.96 |
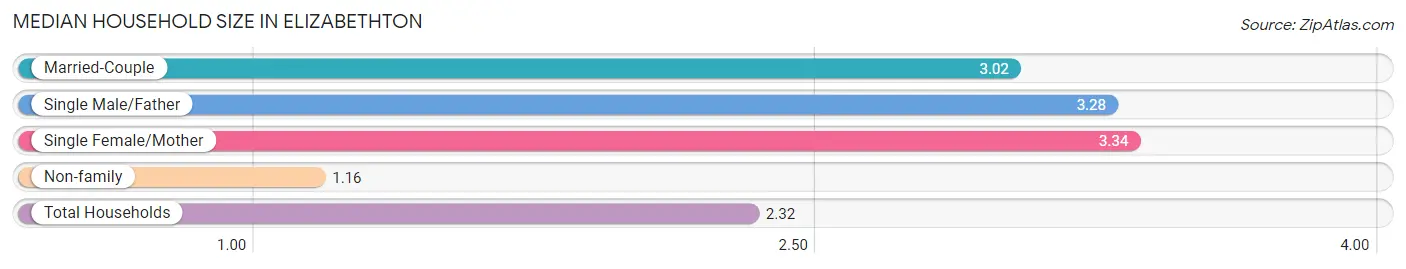
Median Household Size in Elizabethton
The median household size in Elizabethton is 2.32 persons per household, with single female/mother households (901 | 16.0%) accounting for the largest median household size of 3.34 persons per household. non-family households (2,302 | 41.0%) represent the smallest median household size with 1.16 persons per household.
| Household Type | # Households | Household Size |
| Married-Couple | 2,242 (39.9%) | 3.02 |
| Single Male/Father | 171 (3.0%) | 3.28 |
| Single Female/Mother | 901 (16.0%) | 3.34 |
| Non-family | 2,302 (41.0%) | 1.16 |
| Total Households | 5,616 (100.0%) | 2.32 |
Household Size by Marriage Status in Elizabethton
Out of a total of 5,616 households in Elizabethton, 3,314 (59.0%) are family households, while 2,302 (41.0%) are nonfamily households. The most numerous type of family households are 2-person households, comprising 1,659, and the most common type of nonfamily households are 1-person households, comprising 1,995.
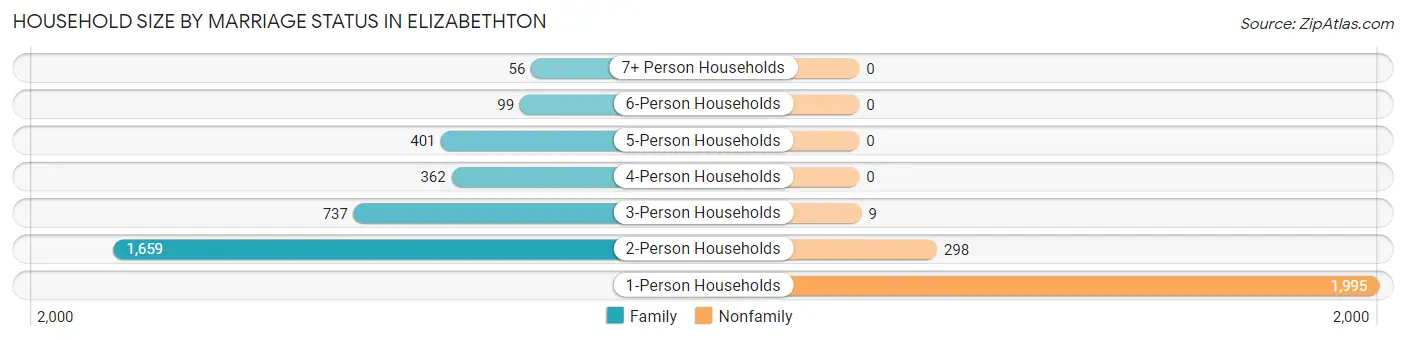
| Household Size | Family Households | Nonfamily Households |
| 1-Person Households | - | 1,995 (35.5%) |
| 2-Person Households | 1,659 (29.5%) | 298 (5.3%) |
| 3-Person Households | 737 (13.1%) | 9 (0.2%) |
| 4-Person Households | 362 (6.5%) | 0 (0.0%) |
| 5-Person Households | 401 (7.1%) | 0 (0.0%) |
| 6-Person Households | 99 (1.8%) | 0 (0.0%) |
| 7+ Person Households | 56 (1.0%) | 0 (0.0%) |
| Total | 3,314 (59.0%) | 2,302 (41.0%) |
Female Fertility in Elizabethton
Fertility by Age in Elizabethton
Average fertility rate in Elizabethton is 39.0 births per 1,000 women. Women in the age bracket of 20 to 34 years have the highest fertility rate with 75.0 births per 1,000 women. Women in the age bracket of 20 to 34 years acount for 89.7% of all women with births.
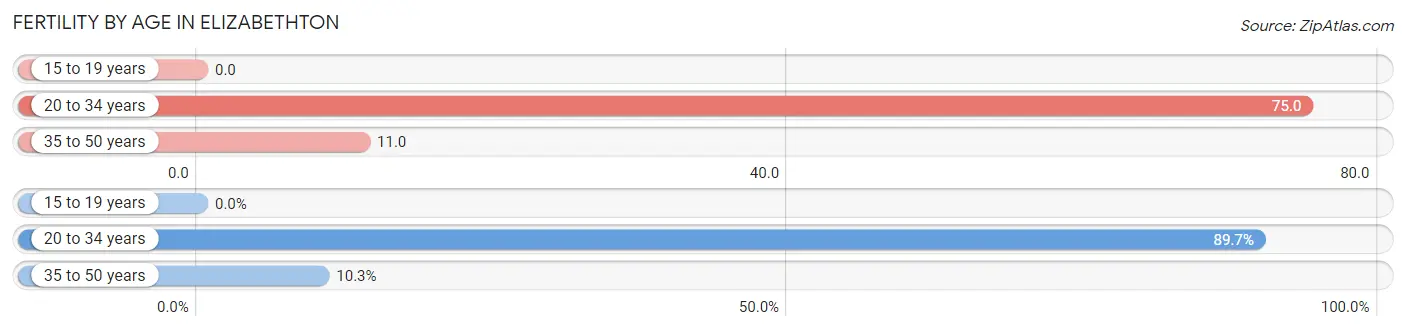
| Age Bracket | Women with Births | Births / 1,000 Women |
| 15 to 19 years | 0 (0.0%) | 0.0 |
| 20 to 34 years | 122 (89.7%) | 75.0 |
| 35 to 50 years | 14 (10.3%) | 11.0 |
| Total | 136 (100.0%) | 39.0 |
Fertility by Age by Marriage Status in Elizabethton
29.4% of women with births (136) in Elizabethton are married. The highest percentage of unmarried women with births falls into 35 to 50 years age bracket with 100.0% of them unmarried at the time of birth, while the lowest percentage of unmarried women with births belong to 20 to 34 years age bracket with 67.2% of them unmarried.
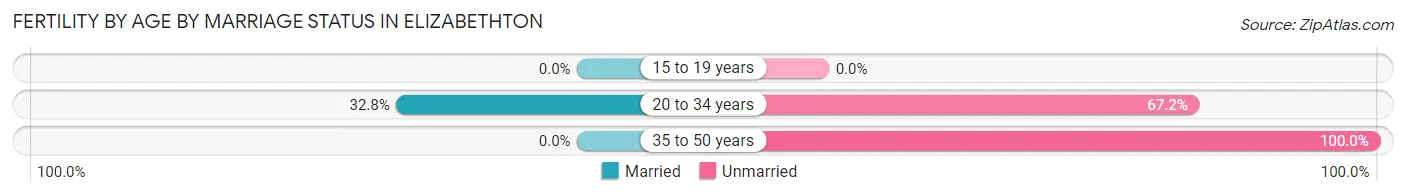
| Age Bracket | Married | Unmarried |
| 15 to 19 years | 0 (0.0%) | 0 (0.0%) |
| 20 to 34 years | 40 (32.8%) | 82 (67.2%) |
| 35 to 50 years | 0 (0.0%) | 14 (100.0%) |
| Total | 40 (29.4%) | 96 (70.6%) |
Fertility by Education in Elizabethton
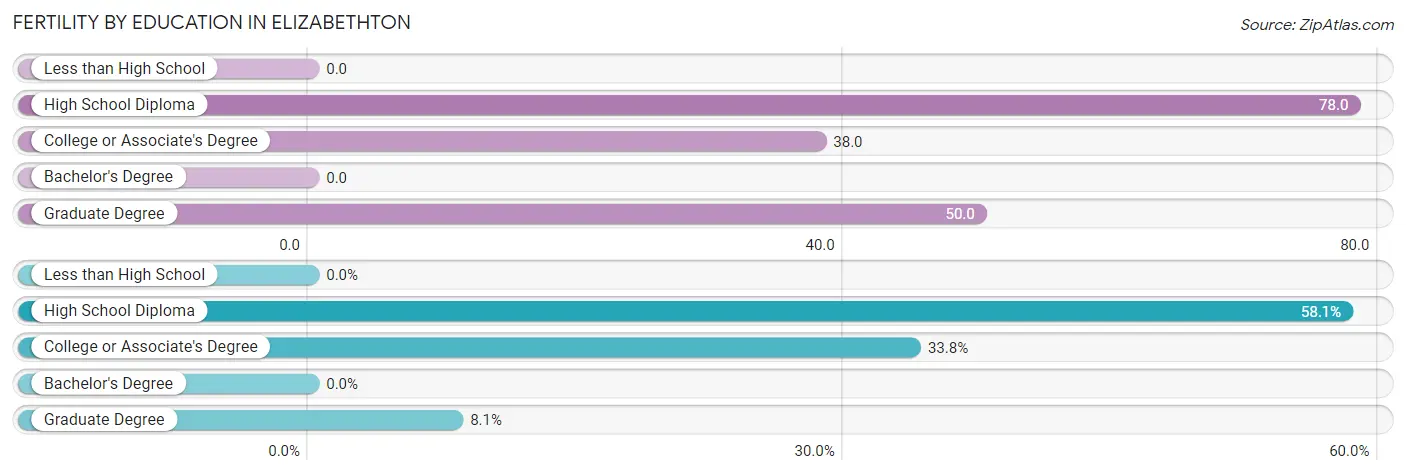
| Educational Attainment | Women with Births | Births / 1,000 Women |
| Less than High School | 0 (0.0%) | 0.0 |
| High School Diploma | 79 (58.1%) | 78.0 |
| College or Associate's Degree | 46 (33.8%) | 38.0 |
| Bachelor's Degree | 0 (0.0%) | 0.0 |
| Graduate Degree | 11 (8.1%) | 50.0 |
| Total | 136 (100.0%) | 39.0 |
Fertility by Education by Marriage Status in Elizabethton
70.6% of women with births in Elizabethton are unmarried. Women with the educational attainment of college or associate's degree are most likely to be married with 43.5% of them married at childbirth, while women with the educational attainment of graduate degree are least likely to be married with 81.8% of them unmarried at childbirth.
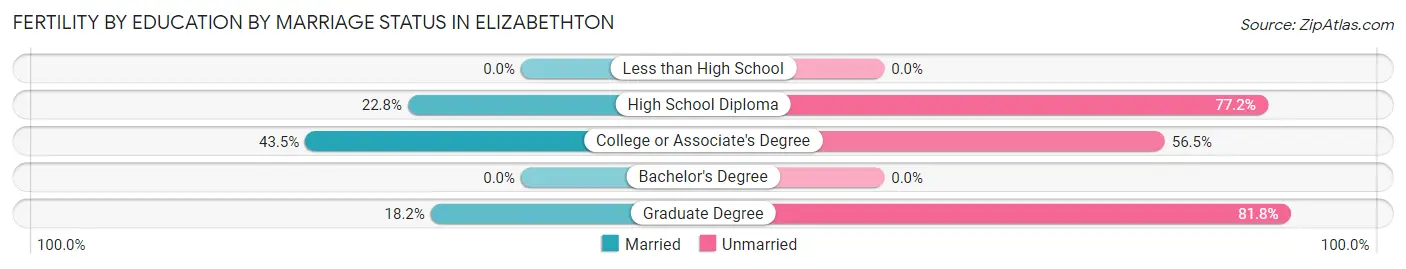
| Educational Attainment | Married | Unmarried |
| Less than High School | 0 (0.0%) | 0 (0.0%) |
| High School Diploma | 18 (22.8%) | 61 (77.2%) |
| College or Associate's Degree | 20 (43.5%) | 26 (56.5%) |
| Bachelor's Degree | 0 (0.0%) | 0 (0.0%) |
| Graduate Degree | 2 (18.2%) | 9 (81.8%) |
| Total | 40 (29.4%) | 96 (70.6%) |
Employment Characteristics in Elizabethton
Employment by Class of Employer in Elizabethton
Among the 5,429 employed individuals in Elizabethton, private company employees (3,492 | 64.3%), local government employees (513 | 9.5%), and not-for-profit organizations (465 | 8.6%) make up the most common classes of employment.
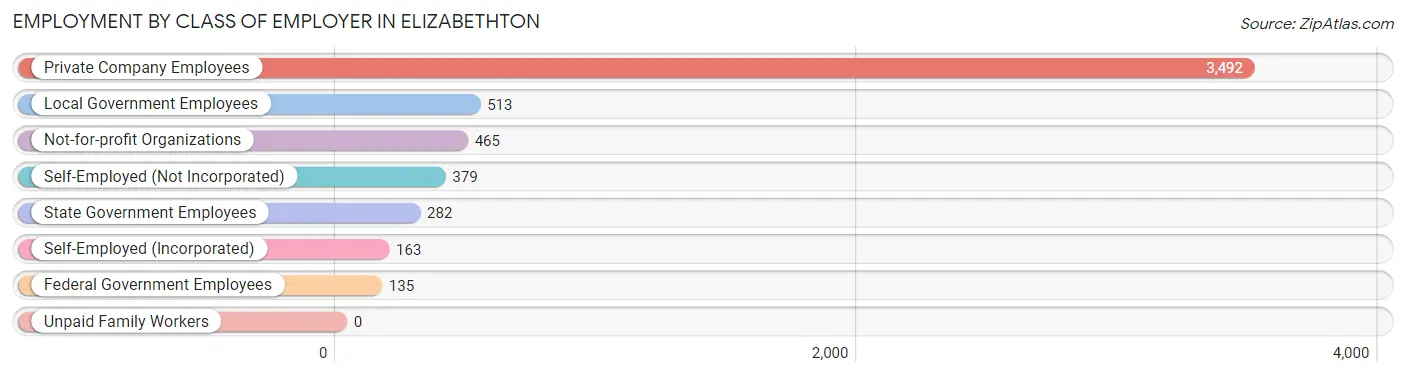
| Employer Class | # Employees | % Employees |
| Private Company Employees | 3,492 | 64.3% |
| Self-Employed (Incorporated) | 163 | 3.0% |
| Self-Employed (Not Incorporated) | 379 | 7.0% |
| Not-for-profit Organizations | 465 | 8.6% |
| Local Government Employees | 513 | 9.5% |
| State Government Employees | 282 | 5.2% |
| Federal Government Employees | 135 | 2.5% |
| Unpaid Family Workers | 0 | 0.0% |
| Total | 5,429 | 100.0% |
Employment Status by Age in Elizabethton
According to the labor force statistics for Elizabethton, out of the total population over 16 years of age (11,763), 50.6% or 5,952 individuals are in the labor force, with 6.9% or 411 of them unemployed. The age group with the highest labor force participation rate is 25 to 29 years, with 81.8% or 820 individuals in the labor force. Within the labor force, the 25 to 29 years age range has the highest percentage of unemployed individuals, with 15.7% or 129 of them being unemployed.
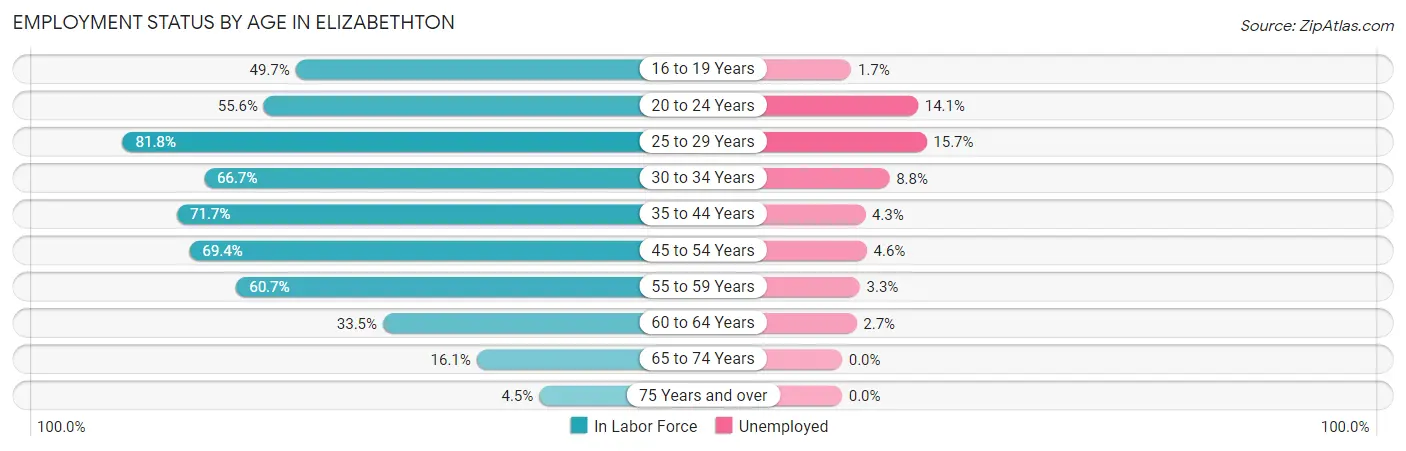
| Age Bracket | In Labor Force | Unemployed |
| 16 to 19 Years | 418 (49.7%) | 7 (1.7%) |
| 20 to 24 Years | 523 (55.6%) | 74 (14.1%) |
| 25 to 29 Years | 820 (81.8%) | 129 (15.7%) |
| 30 to 34 Years | 828 (66.7%) | 73 (8.8%) |
| 35 to 44 Years | 1,066 (71.7%) | 46 (4.3%) |
| 45 to 54 Years | 1,228 (69.4%) | 56 (4.6%) |
| 55 to 59 Years | 518 (60.7%) | 17 (3.3%) |
| 60 to 64 Years | 262 (33.5%) | 7 (2.7%) |
| 65 to 74 Years | 220 (16.1%) | 0 (0.0%) |
| 75 Years and over | 67 (4.5%) | 0 (0.0%) |
| Total | 5,952 (50.6%) | 411 (6.9%) |
Employment Status by Educational Attainment in Elizabethton
According to labor force statistics for Elizabethton, 66.2% of individuals (4,725) out of the total population between 25 and 64 years of age (7,137) are in the labor force, with 7.0% or 331 of them being unemployed. The group with the highest labor force participation rate are those with the educational attainment of bachelor's degree or higher, with 80.6% or 1,473 individuals in the labor force. Within the labor force, individuals with less than high school education have the highest percentage of unemployment, with 18.1% or 55 of them being unemployed.
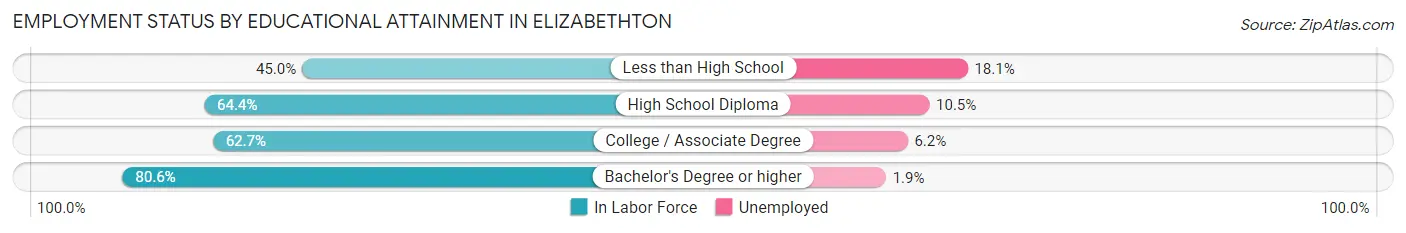
| Educational Attainment | In Labor Force | Unemployed |
| Less than High School | 304 (45.0%) | 122 (18.1%) |
| High School Diploma | 1,472 (64.4%) | 240 (10.5%) |
| College / Associate Degree | 1,472 (62.7%) | 146 (6.2%) |
| Bachelor's Degree or higher | 1,473 (80.6%) | 35 (1.9%) |
| Total | 4,725 (66.2%) | 500 (7.0%) |
Employment Occupations by Sex in Elizabethton
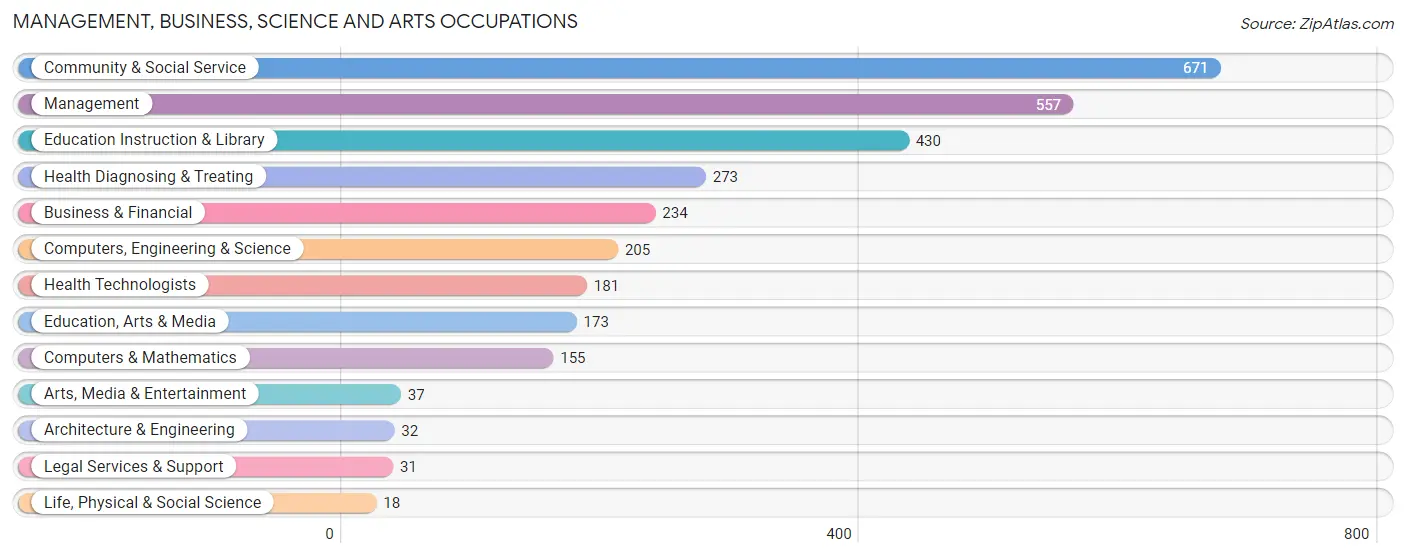
Management, Business, Science and Arts Occupations
The most common Management, Business, Science and Arts occupations in Elizabethton are Community & Social Service (671 | 12.1%), Management (557 | 10.1%), Education Instruction & Library (430 | 7.8%), Health Diagnosing & Treating (273 | 4.9%), and Business & Financial (234 | 4.2%).
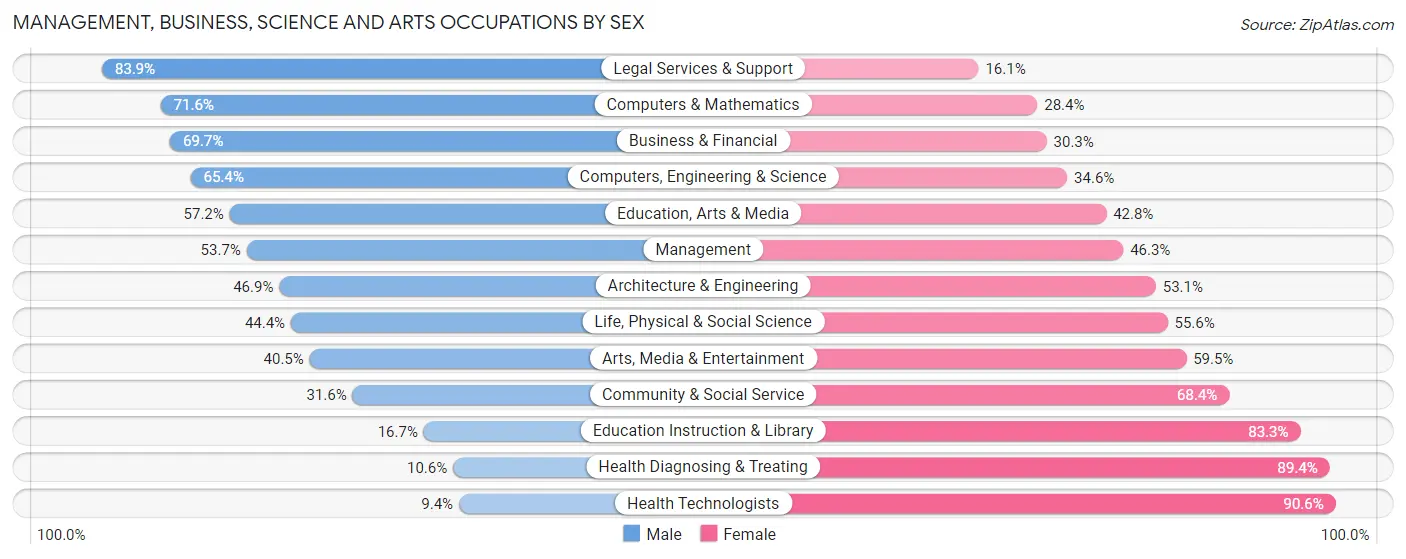
Management, Business, Science and Arts Occupations by Sex
Within the Management, Business, Science and Arts occupations in Elizabethton, the most male-oriented occupations are Legal Services & Support (83.9%), Computers & Mathematics (71.6%), and Business & Financial (69.7%), while the most female-oriented occupations are Health Technologists (90.6%), Health Diagnosing & Treating (89.4%), and Education Instruction & Library (83.3%).
| Occupation | Male | Female |
| Management | 299 (53.7%) | 258 (46.3%) |
| Business & Financial | 163 (69.7%) | 71 (30.3%) |
| Computers, Engineering & Science | 134 (65.4%) | 71 (34.6%) |
| Computers & Mathematics | 111 (71.6%) | 44 (28.4%) |
| Architecture & Engineering | 15 (46.9%) | 17 (53.1%) |
| Life, Physical & Social Science | 8 (44.4%) | 10 (55.6%) |
| Community & Social Service | 212 (31.6%) | 459 (68.4%) |
| Education, Arts & Media | 99 (57.2%) | 74 (42.8%) |
| Legal Services & Support | 26 (83.9%) | 5 (16.1%) |
| Education Instruction & Library | 72 (16.7%) | 358 (83.3%) |
| Arts, Media & Entertainment | 15 (40.5%) | 22 (59.5%) |
| Health Diagnosing & Treating | 29 (10.6%) | 244 (89.4%) |
| Health Technologists | 17 (9.4%) | 164 (90.6%) |
| Total (Category) | 837 (43.1%) | 1,103 (56.9%) |
| Total (Overall) | 2,788 (50.4%) | 2,739 (49.6%) |
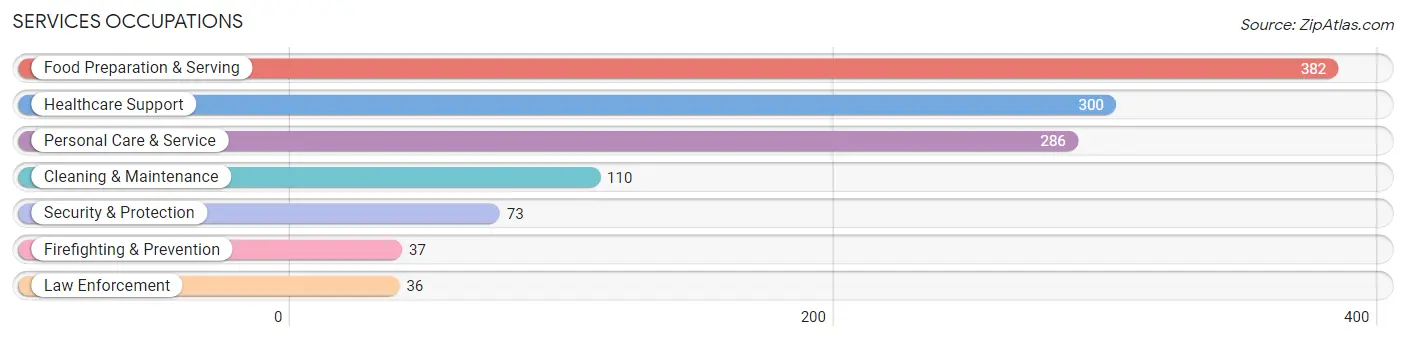
Services Occupations
The most common Services occupations in Elizabethton are Food Preparation & Serving (382 | 6.9%), Healthcare Support (300 | 5.4%), Personal Care & Service (286 | 5.2%), Cleaning & Maintenance (110 | 2.0%), and Security & Protection (73 | 1.3%).
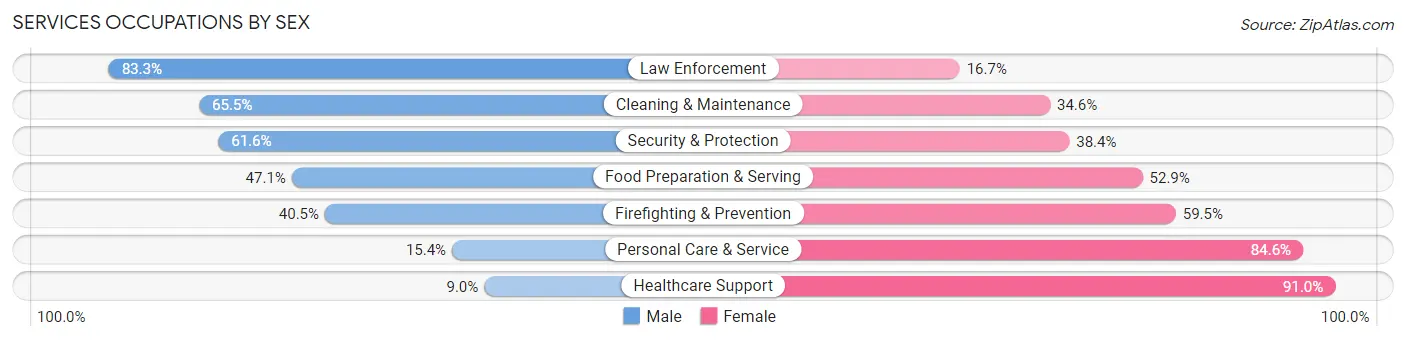
Services Occupations by Sex
Within the Services occupations in Elizabethton, the most male-oriented occupations are Law Enforcement (83.3%), Cleaning & Maintenance (65.4%), and Security & Protection (61.6%), while the most female-oriented occupations are Healthcare Support (91.0%), Personal Care & Service (84.6%), and Firefighting & Prevention (59.5%).
| Occupation | Male | Female |
| Healthcare Support | 27 (9.0%) | 273 (91.0%) |
| Security & Protection | 45 (61.6%) | 28 (38.4%) |
| Firefighting & Prevention | 15 (40.5%) | 22 (59.5%) |
| Law Enforcement | 30 (83.3%) | 6 (16.7%) |
| Food Preparation & Serving | 180 (47.1%) | 202 (52.9%) |
| Cleaning & Maintenance | 72 (65.4%) | 38 (34.5%) |
| Personal Care & Service | 44 (15.4%) | 242 (84.6%) |
| Total (Category) | 368 (32.0%) | 783 (68.0%) |
| Total (Overall) | 2,788 (50.4%) | 2,739 (49.6%) |
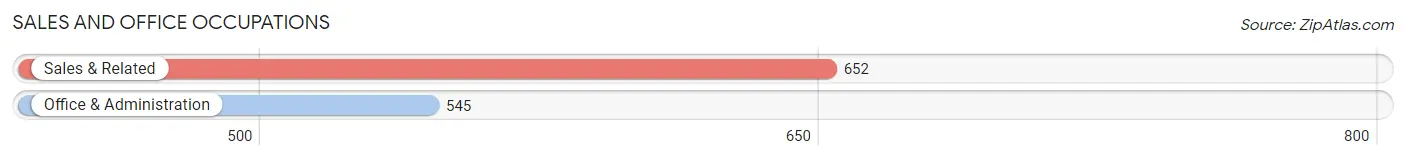
Sales and Office Occupations
The most common Sales and Office occupations in Elizabethton are Sales & Related (652 | 11.8%), and Office & Administration (545 | 9.9%).
Sales and Office Occupations by Sex
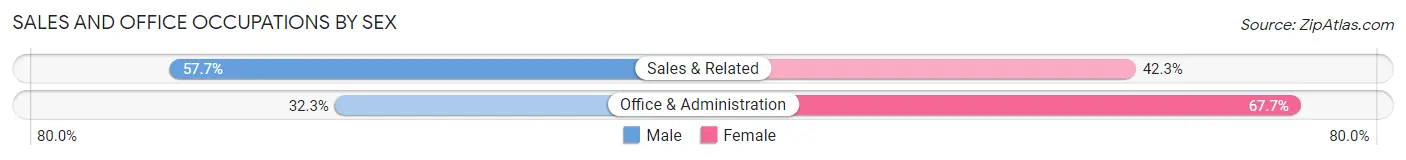
| Occupation | Male | Female |
| Sales & Related | 376 (57.7%) | 276 (42.3%) |
| Office & Administration | 176 (32.3%) | 369 (67.7%) |
| Total (Category) | 552 (46.1%) | 645 (53.9%) |
| Total (Overall) | 2,788 (50.4%) | 2,739 (49.6%) |
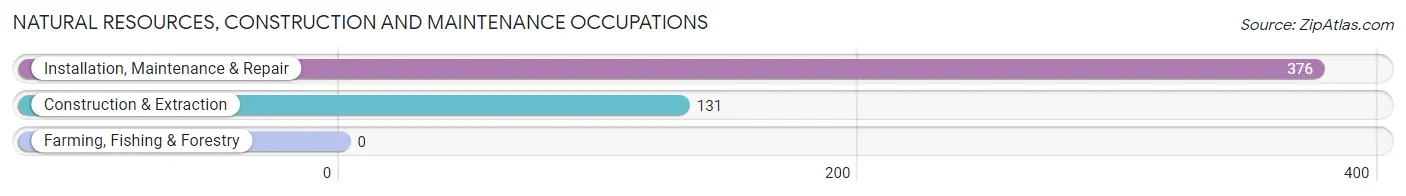
Natural Resources, Construction and Maintenance Occupations
The most common Natural Resources, Construction and Maintenance occupations in Elizabethton are Installation, Maintenance & Repair (376 | 6.8%), and Construction & Extraction (131 | 2.4%).
Natural Resources, Construction and Maintenance Occupations by Sex
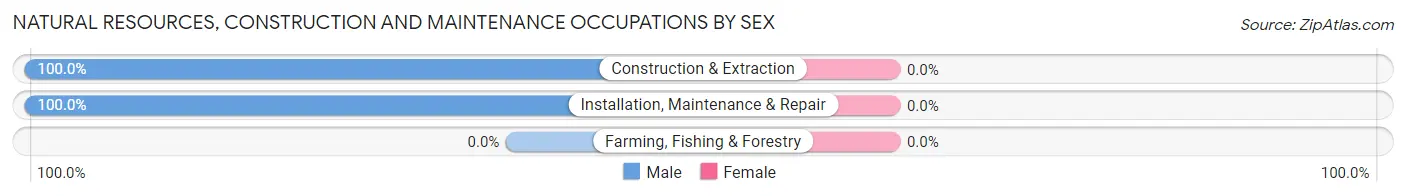
| Occupation | Male | Female |
| Farming, Fishing & Forestry | 0 (0.0%) | 0 (0.0%) |
| Construction & Extraction | 131 (100.0%) | 0 (0.0%) |
| Installation, Maintenance & Repair | 376 (100.0%) | 0 (0.0%) |
| Total (Category) | 507 (100.0%) | 0 (0.0%) |
| Total (Overall) | 2,788 (50.4%) | 2,739 (49.6%) |
Production, Transportation and Moving Occupations
The most common Production, Transportation and Moving occupations in Elizabethton are Production (372 | 6.7%), Transportation (237 | 4.3%), and Material Moving (123 | 2.2%).
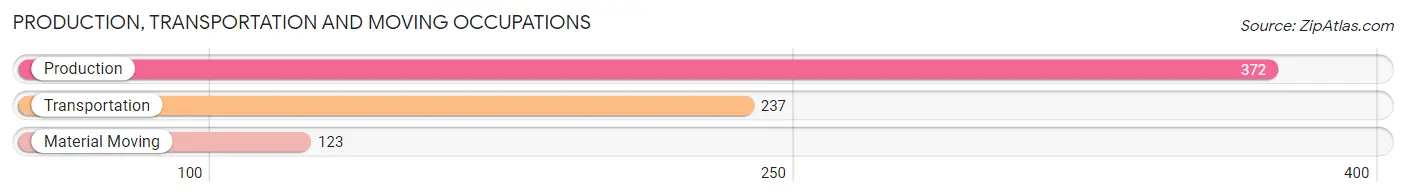
Production, Transportation and Moving Occupations by Sex
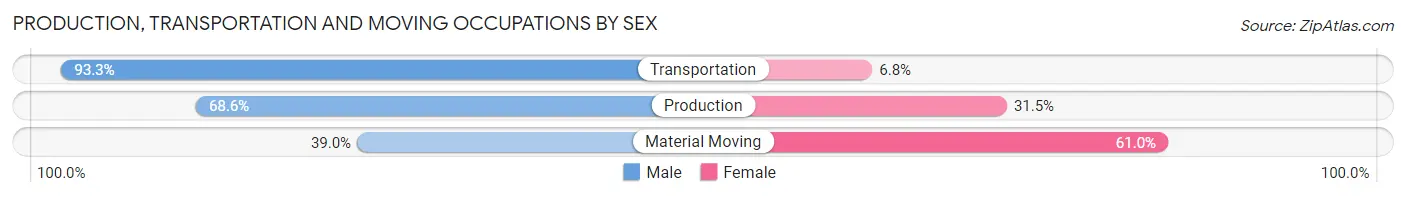
| Occupation | Male | Female |
| Production | 255 (68.5%) | 117 (31.5%) |
| Transportation | 221 (93.2%) | 16 (6.8%) |
| Material Moving | 48 (39.0%) | 75 (61.0%) |
| Total (Category) | 524 (71.6%) | 208 (28.4%) |
| Total (Overall) | 2,788 (50.4%) | 2,739 (49.6%) |
Employment Industries by Sex in Elizabethton
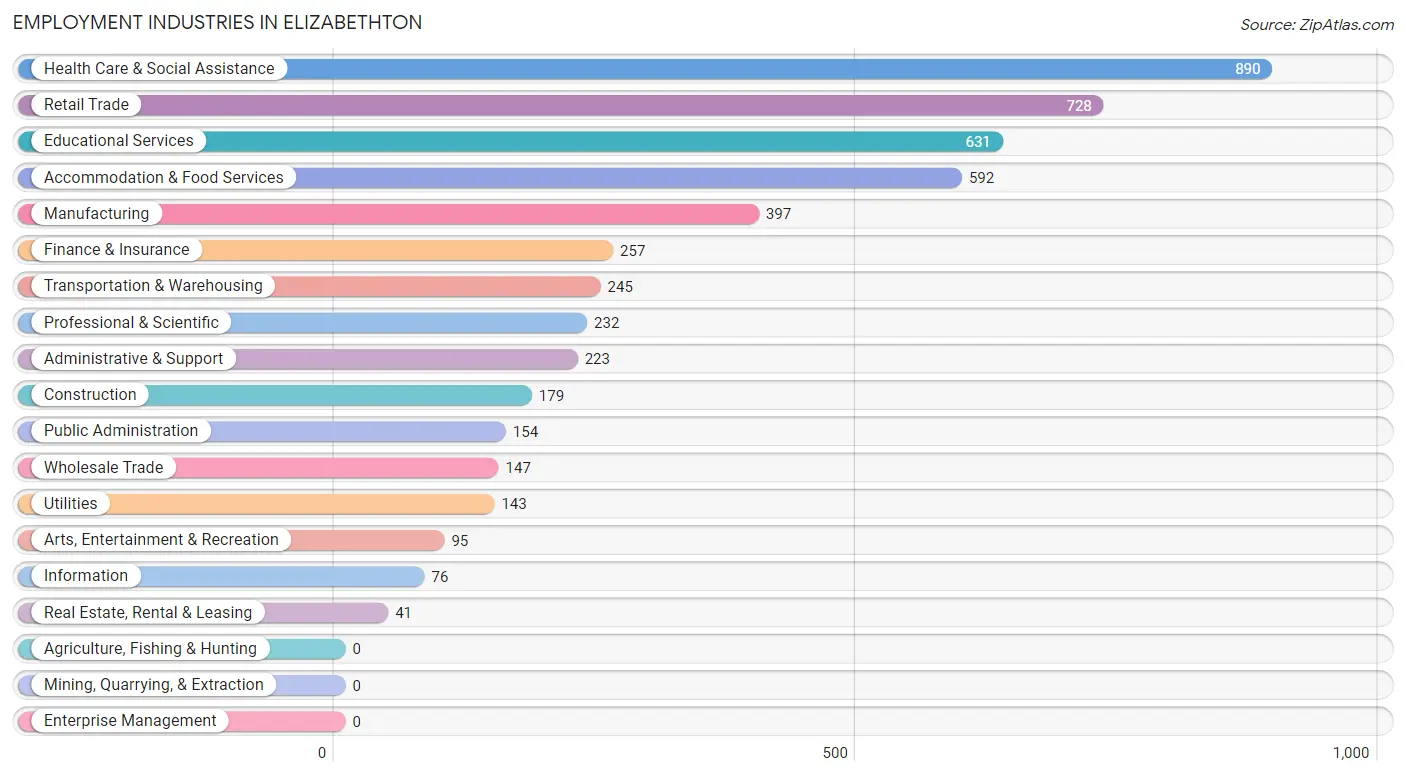
Employment Industries in Elizabethton
The major employment industries in Elizabethton include Health Care & Social Assistance (890 | 16.1%), Retail Trade (728 | 13.2%), Educational Services (631 | 11.4%), Accommodation & Food Services (592 | 10.7%), and Manufacturing (397 | 7.2%).
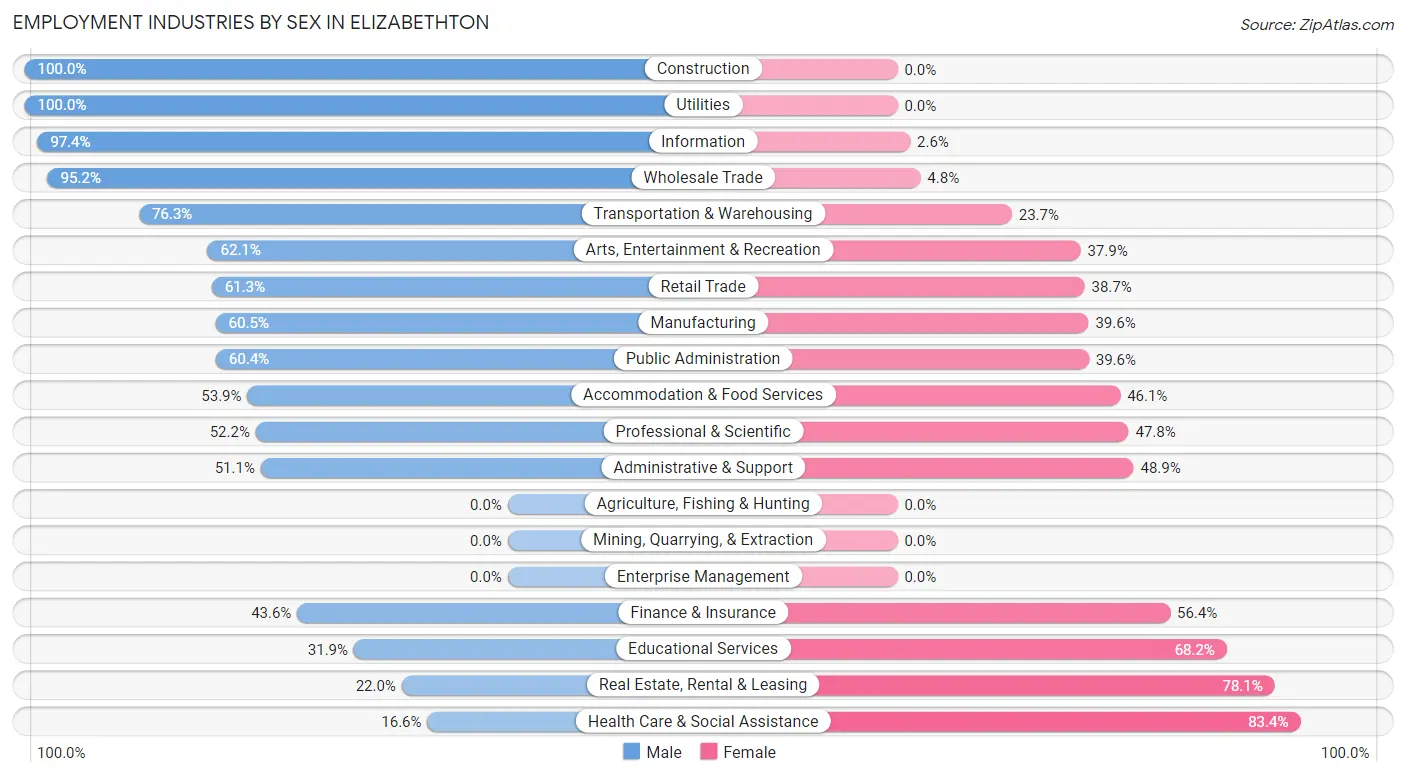
Employment Industries by Sex in Elizabethton
The Elizabethton industries that see more men than women are Construction (100.0%), Utilities (100.0%), and Information (97.4%), whereas the industries that tend to have a higher number of women are Health Care & Social Assistance (83.4%), Real Estate, Rental & Leasing (78.0%), and Educational Services (68.1%).
| Industry | Male | Female |
| Agriculture, Fishing & Hunting | 0 (0.0%) | 0 (0.0%) |
| Mining, Quarrying, & Extraction | 0 (0.0%) | 0 (0.0%) |
| Construction | 179 (100.0%) | 0 (0.0%) |
| Manufacturing | 240 (60.5%) | 157 (39.6%) |
| Wholesale Trade | 140 (95.2%) | 7 (4.8%) |
| Retail Trade | 446 (61.3%) | 282 (38.7%) |
| Transportation & Warehousing | 187 (76.3%) | 58 (23.7%) |
| Utilities | 143 (100.0%) | 0 (0.0%) |
| Information | 74 (97.4%) | 2 (2.6%) |
| Finance & Insurance | 112 (43.6%) | 145 (56.4%) |
| Real Estate, Rental & Leasing | 9 (22.0%) | 32 (78.0%) |
| Professional & Scientific | 121 (52.2%) | 111 (47.8%) |
| Enterprise Management | 0 (0.0%) | 0 (0.0%) |
| Administrative & Support | 114 (51.1%) | 109 (48.9%) |
| Educational Services | 201 (31.9%) | 430 (68.1%) |
| Health Care & Social Assistance | 148 (16.6%) | 742 (83.4%) |
| Arts, Entertainment & Recreation | 59 (62.1%) | 36 (37.9%) |
| Accommodation & Food Services | 319 (53.9%) | 273 (46.1%) |
| Public Administration | 93 (60.4%) | 61 (39.6%) |
| Total | 2,788 (50.4%) | 2,739 (49.6%) |
Education in Elizabethton
School Enrollment in Elizabethton
The most common levels of schooling among the 3,578 students in Elizabethton are college / undergraduate (1,093 | 30.5%), elementary school (783 | 21.9%), and middle school (585 | 16.4%).
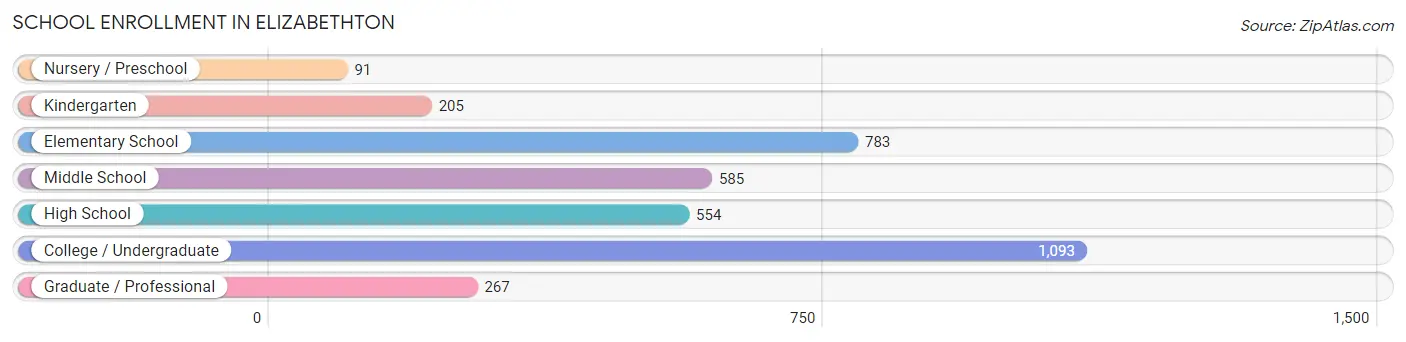
| School Level | # Students | % Students |
| Nursery / Preschool | 91 | 2.5% |
| Kindergarten | 205 | 5.7% |
| Elementary School | 783 | 21.9% |
| Middle School | 585 | 16.4% |
| High School | 554 | 15.5% |
| College / Undergraduate | 1,093 | 30.5% |
| Graduate / Professional | 267 | 7.5% |
| Total | 3,578 | 100.0% |
School Enrollment by Age by Funding Source in Elizabethton
Out of a total of 3,578 students who are enrolled in schools in Elizabethton, 1,220 (34.1%) attend a private institution, while the remaining 2,358 (65.9%) are enrolled in public schools. The age group of 18 to 19 year olds has the highest likelihood of being enrolled in private schools, with 304 (70.9% in the age bracket) enrolled. Conversely, the age group of 15 to 17 year olds has the lowest likelihood of being enrolled in a private school, with 411 (91.3% in the age bracket) attending a public institution.
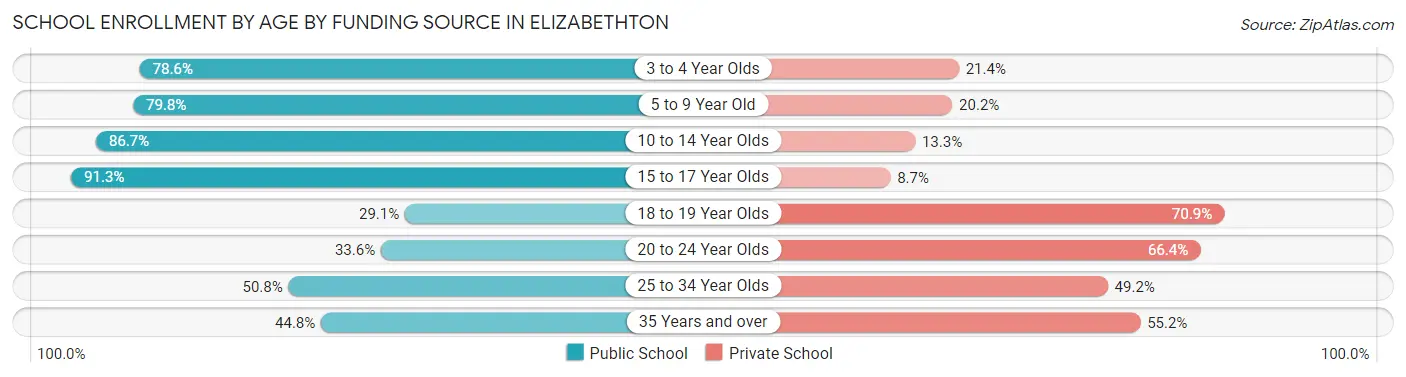
| Age Bracket | Public School | Private School |
| 3 to 4 Year Olds | 77 (78.6%) | 21 (21.4%) |
| 5 to 9 Year Old | 675 (79.8%) | 171 (20.2%) |
| 10 to 14 Year Olds | 653 (86.7%) | 100 (13.3%) |
| 15 to 17 Year Olds | 411 (91.3%) | 39 (8.7%) |
| 18 to 19 Year Olds | 125 (29.1%) | 304 (70.9%) |
| 20 to 24 Year Olds | 158 (33.6%) | 312 (66.4%) |
| 25 to 34 Year Olds | 183 (50.8%) | 177 (49.2%) |
| 35 Years and over | 77 (44.8%) | 95 (55.2%) |
| Total | 2,358 (65.9%) | 1,220 (34.1%) |
Educational Attainment by Field of Study in Elizabethton
Education (537 | 20.9%), business (453 | 17.6%), science & technology (301 | 11.7%), liberal arts & history (230 | 8.9%), and psychology (174 | 6.8%) are the most common fields of study among 2,572 individuals in Elizabethton who have obtained a bachelor's degree or higher.
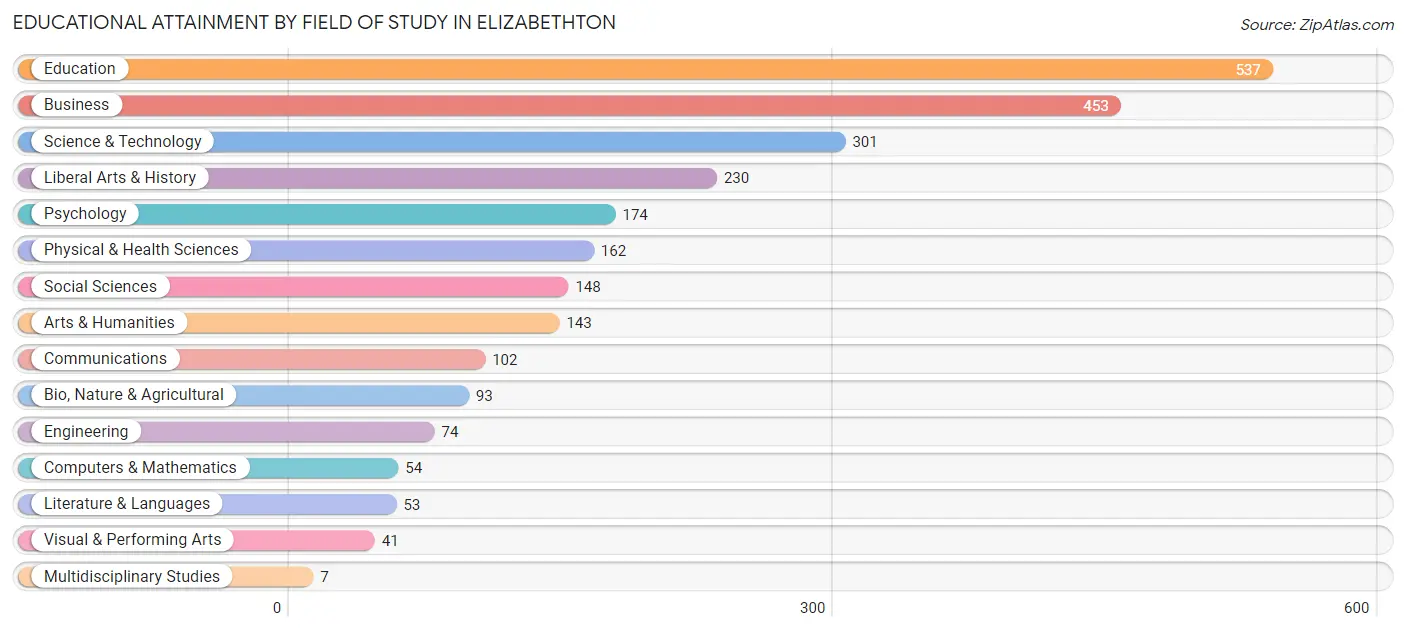
| Field of Study | # Graduates | % Graduates |
| Computers & Mathematics | 54 | 2.1% |
| Bio, Nature & Agricultural | 93 | 3.6% |
| Physical & Health Sciences | 162 | 6.3% |
| Psychology | 174 | 6.8% |
| Social Sciences | 148 | 5.8% |
| Engineering | 74 | 2.9% |
| Multidisciplinary Studies | 7 | 0.3% |
| Science & Technology | 301 | 11.7% |
| Business | 453 | 17.6% |
| Education | 537 | 20.9% |
| Literature & Languages | 53 | 2.1% |
| Liberal Arts & History | 230 | 8.9% |
| Visual & Performing Arts | 41 | 1.6% |
| Communications | 102 | 4.0% |
| Arts & Humanities | 143 | 5.6% |
| Total | 2,572 | 100.0% |
Transportation & Commute in Elizabethton
Vehicle Availability by Sex in Elizabethton
The most prevalent vehicle ownership categories in Elizabethton are males with 2 vehicles (1,285, accounting for 49.0%) and females with 2 vehicles (1,014, making up 49.7%).
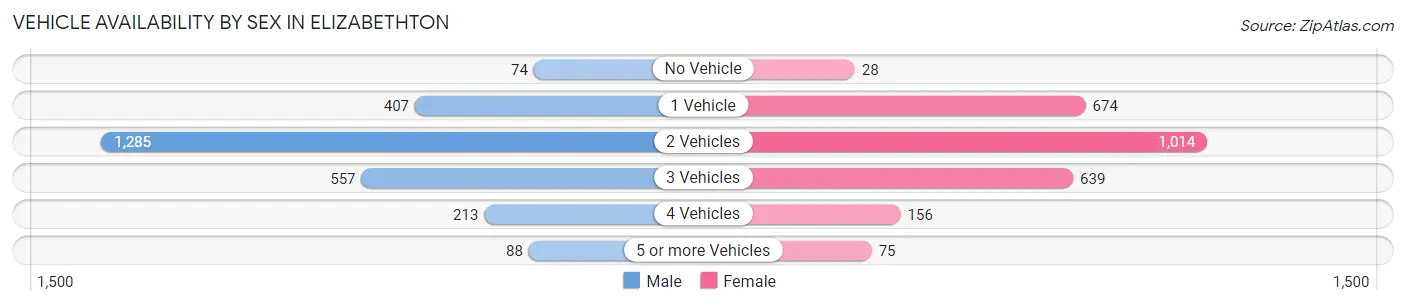
| Vehicles Available | Male | Female |
| No Vehicle | 74 (2.8%) | 28 (1.1%) |
| 1 Vehicle | 407 (15.5%) | 674 (26.1%) |
| 2 Vehicles | 1,285 (49.0%) | 1,014 (39.2%) |
| 3 Vehicles | 557 (21.2%) | 639 (24.7%) |
| 4 Vehicles | 213 (8.1%) | 156 (6.0%) |
| 5 or more Vehicles | 88 (3.4%) | 75 (2.9%) |
| Total | 2,624 (100.0%) | 2,586 (100.0%) |
Commute Time in Elizabethton
The most frequently occuring commute durations in Elizabethton are 5 to 9 minutes (983 commuters, 20.1%), 10 to 14 minutes (890 commuters, 18.2%), and 15 to 19 minutes (610 commuters, 12.5%).
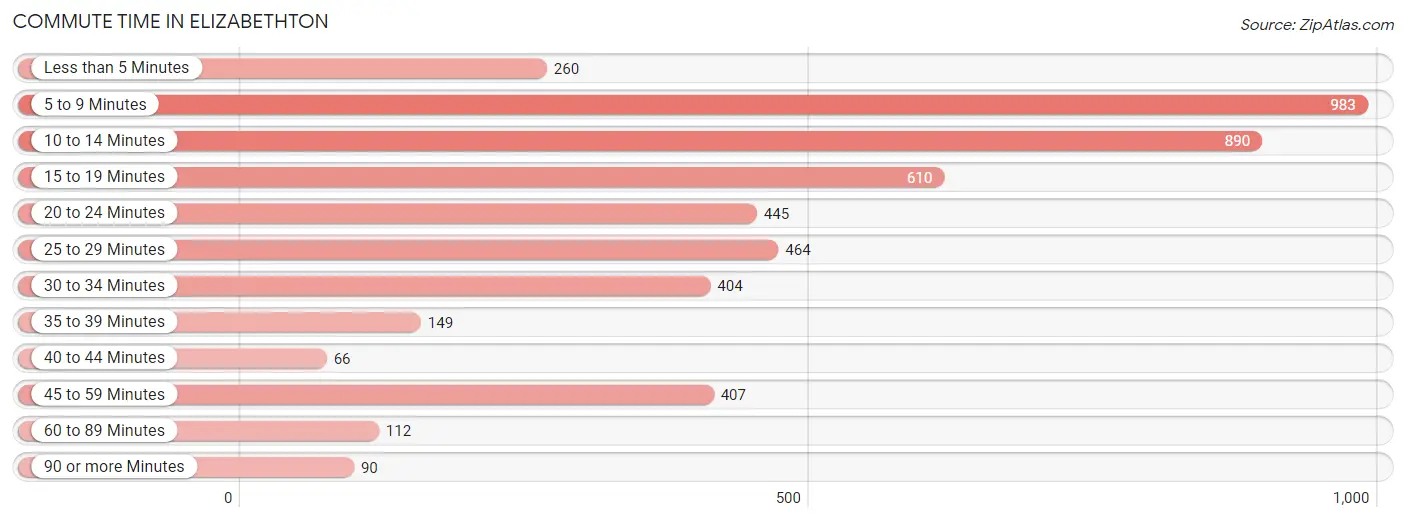
| Commute Time | # Commuters | % Commuters |
| Less than 5 Minutes | 260 | 5.3% |
| 5 to 9 Minutes | 983 | 20.1% |
| 10 to 14 Minutes | 890 | 18.2% |
| 15 to 19 Minutes | 610 | 12.5% |
| 20 to 24 Minutes | 445 | 9.1% |
| 25 to 29 Minutes | 464 | 9.5% |
| 30 to 34 Minutes | 404 | 8.3% |
| 35 to 39 Minutes | 149 | 3.0% |
| 40 to 44 Minutes | 66 | 1.3% |
| 45 to 59 Minutes | 407 | 8.3% |
| 60 to 89 Minutes | 112 | 2.3% |
| 90 or more Minutes | 90 | 1.8% |
Commute Time by Sex in Elizabethton
The most common commute times in Elizabethton are 5 to 9 minutes (438 commuters, 18.1%) for males and 5 to 9 minutes (545 commuters, 22.2%) for females.
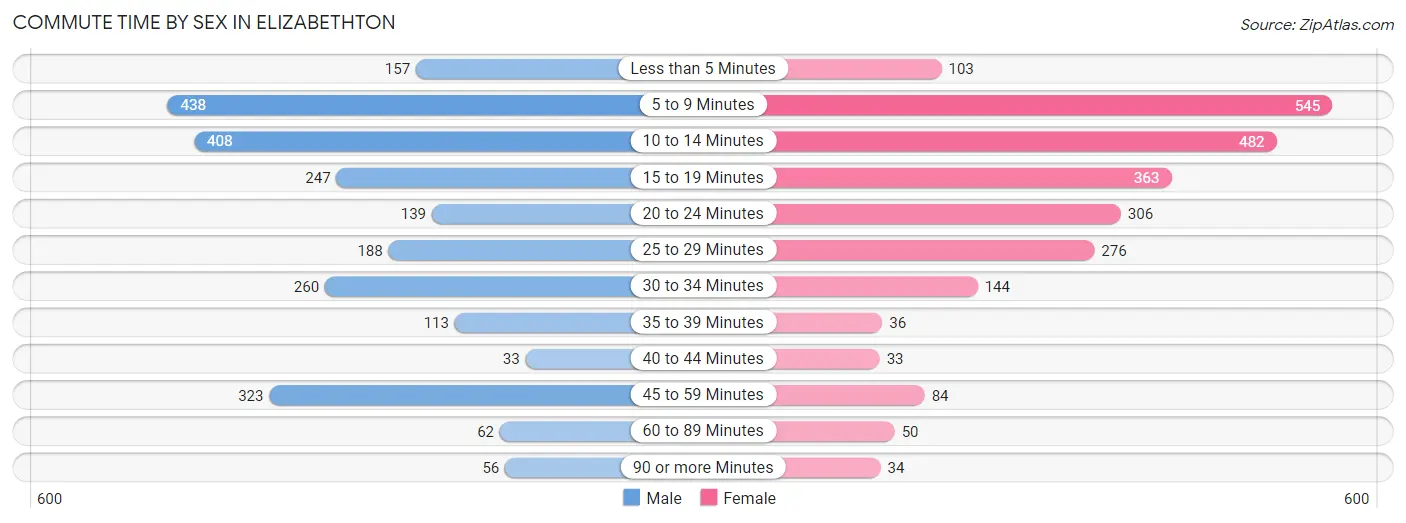
| Commute Time | Male | Female |
| Less than 5 Minutes | 157 (6.5%) | 103 (4.2%) |
| 5 to 9 Minutes | 438 (18.1%) | 545 (22.2%) |
| 10 to 14 Minutes | 408 (16.8%) | 482 (19.6%) |
| 15 to 19 Minutes | 247 (10.2%) | 363 (14.8%) |
| 20 to 24 Minutes | 139 (5.7%) | 306 (12.5%) |
| 25 to 29 Minutes | 188 (7.8%) | 276 (11.2%) |
| 30 to 34 Minutes | 260 (10.7%) | 144 (5.9%) |
| 35 to 39 Minutes | 113 (4.7%) | 36 (1.5%) |
| 40 to 44 Minutes | 33 (1.4%) | 33 (1.3%) |
| 45 to 59 Minutes | 323 (13.3%) | 84 (3.4%) |
| 60 to 89 Minutes | 62 (2.6%) | 50 (2.0%) |
| 90 or more Minutes | 56 (2.3%) | 34 (1.4%) |
Time of Departure to Work by Sex in Elizabethton
The most frequent times of departure to work in Elizabethton are 4:00 PM to 11:59 PM (293, 12.1%) for males and 7:30 AM to 7:59 AM (482, 19.6%) for females.
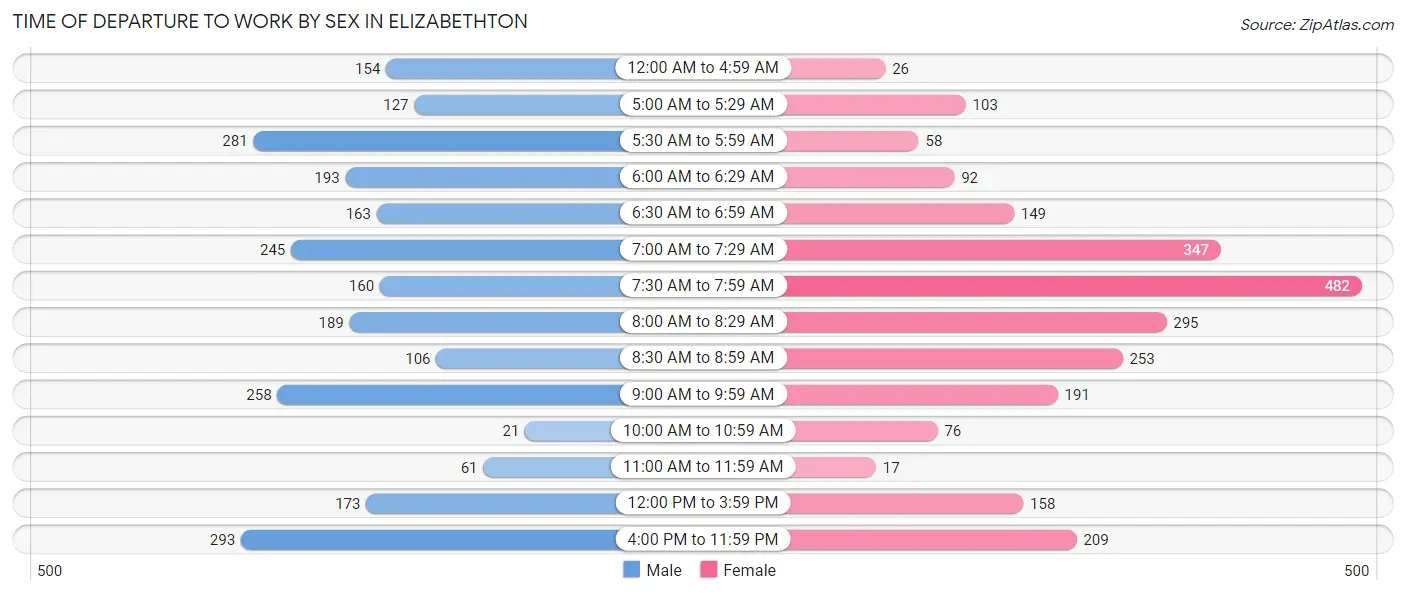
| Time of Departure | Male | Female |
| 12:00 AM to 4:59 AM | 154 (6.4%) | 26 (1.1%) |
| 5:00 AM to 5:29 AM | 127 (5.2%) | 103 (4.2%) |
| 5:30 AM to 5:59 AM | 281 (11.6%) | 58 (2.4%) |
| 6:00 AM to 6:29 AM | 193 (8.0%) | 92 (3.7%) |
| 6:30 AM to 6:59 AM | 163 (6.7%) | 149 (6.1%) |
| 7:00 AM to 7:29 AM | 245 (10.1%) | 347 (14.1%) |
| 7:30 AM to 7:59 AM | 160 (6.6%) | 482 (19.6%) |
| 8:00 AM to 8:29 AM | 189 (7.8%) | 295 (12.0%) |
| 8:30 AM to 8:59 AM | 106 (4.4%) | 253 (10.3%) |
| 9:00 AM to 9:59 AM | 258 (10.6%) | 191 (7.8%) |
| 10:00 AM to 10:59 AM | 21 (0.9%) | 76 (3.1%) |
| 11:00 AM to 11:59 AM | 61 (2.5%) | 17 (0.7%) |
| 12:00 PM to 3:59 PM | 173 (7.1%) | 158 (6.4%) |
| 4:00 PM to 11:59 PM | 293 (12.1%) | 209 (8.5%) |
| Total | 2,424 (100.0%) | 2,456 (100.0%) |
Housing Occupancy in Elizabethton
Occupancy by Ownership in Elizabethton
Of the total 5,616 dwellings in Elizabethton, owner-occupied units account for 3,445 (61.3%), while renter-occupied units make up 2,171 (38.7%).
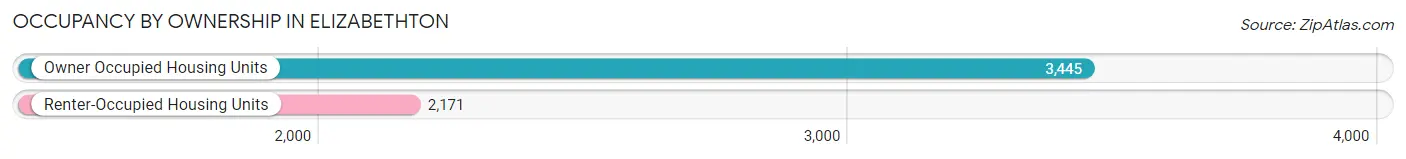
| Occupancy | # Housing Units | % Housing Units |
| Owner Occupied Housing Units | 3,445 | 61.3% |
| Renter-Occupied Housing Units | 2,171 | 38.7% |
| Total Occupied Housing Units | 5,616 | 100.0% |
Occupancy by Household Size in Elizabethton
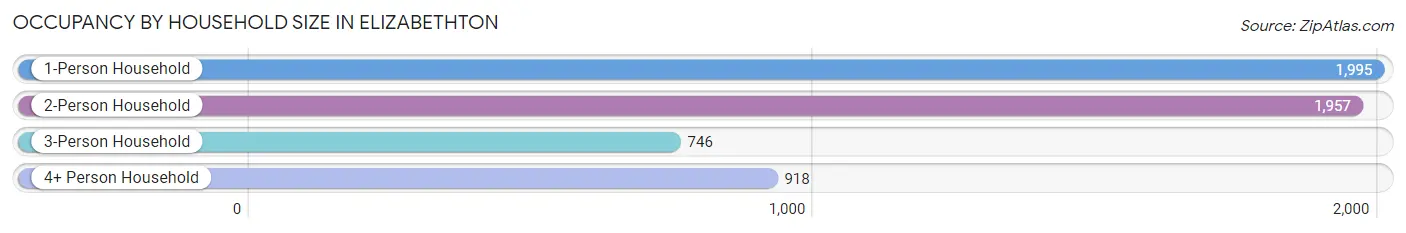
| Household Size | # Housing Units | % Housing Units |
| 1-Person Household | 1,995 | 35.5% |
| 2-Person Household | 1,957 | 34.8% |
| 3-Person Household | 746 | 13.3% |
| 4+ Person Household | 918 | 16.4% |
| Total Housing Units | 5,616 | 100.0% |
Occupancy by Ownership by Household Size in Elizabethton
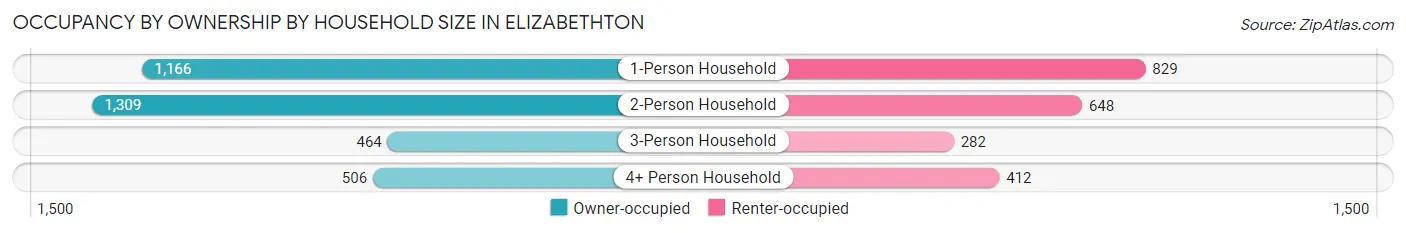
| Household Size | Owner-occupied | Renter-occupied |
| 1-Person Household | 1,166 (58.5%) | 829 (41.5%) |
| 2-Person Household | 1,309 (66.9%) | 648 (33.1%) |
| 3-Person Household | 464 (62.2%) | 282 (37.8%) |
| 4+ Person Household | 506 (55.1%) | 412 (44.9%) |
| Total Housing Units | 3,445 (61.3%) | 2,171 (38.7%) |
Occupancy by Educational Attainment in Elizabethton
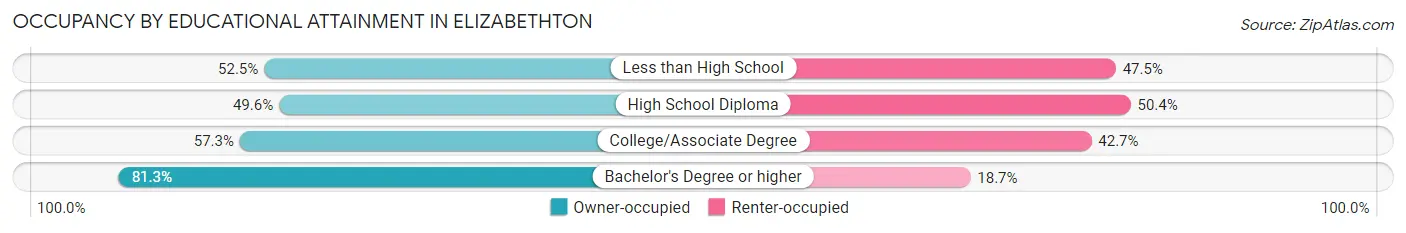
| Household Size | Owner-occupied | Renter-occupied |
| Less than High School | 262 (52.5%) | 237 (47.5%) |
| High School Diploma | 805 (49.6%) | 819 (50.4%) |
| College/Associate Degree | 1,106 (57.3%) | 823 (42.7%) |
| Bachelor's Degree or higher | 1,272 (81.3%) | 292 (18.7%) |
Occupancy by Age of Householder in Elizabethton
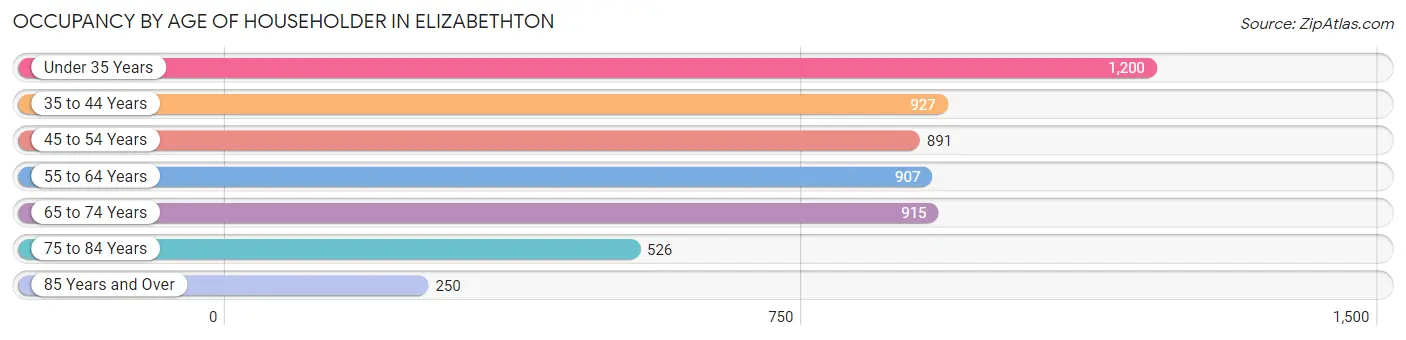
| Age Bracket | # Households | % Households |
| Under 35 Years | 1,200 | 21.4% |
| 35 to 44 Years | 927 | 16.5% |
| 45 to 54 Years | 891 | 15.9% |
| 55 to 64 Years | 907 | 16.2% |
| 65 to 74 Years | 915 | 16.3% |
| 75 to 84 Years | 526 | 9.4% |
| 85 Years and Over | 250 | 4.4% |
| Total | 5,616 | 100.0% |
Housing Finances in Elizabethton
Median Income by Occupancy in Elizabethton
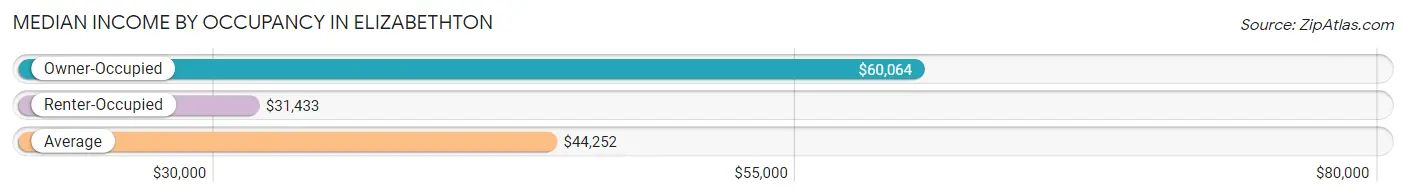
| Occupancy Type | # Households | Median Income |
| Owner-Occupied | 3,445 (61.3%) | $60,064 |
| Renter-Occupied | 2,171 (38.7%) | $31,433 |
| Average | 5,616 (100.0%) | $44,252 |
Occupancy by Householder Income Bracket in Elizabethton
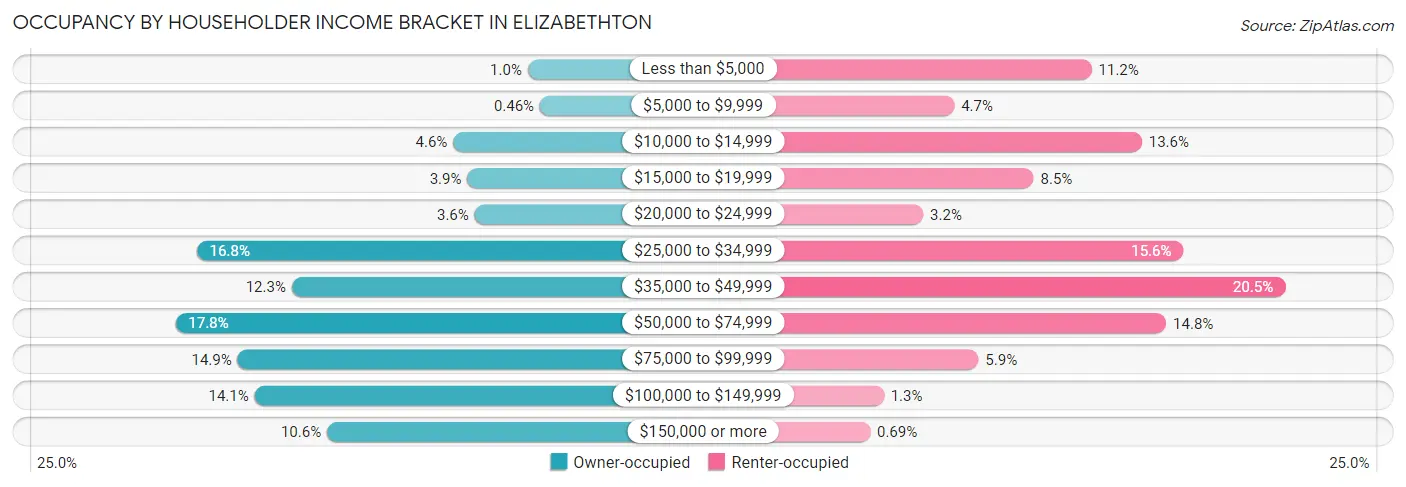
| Income Bracket | Owner-occupied | Renter-occupied |
| Less than $5,000 | 36 (1.0%) | 244 (11.2%) |
| $5,000 to $9,999 | 16 (0.5%) | 102 (4.7%) |
| $10,000 to $14,999 | 158 (4.6%) | 296 (13.6%) |
| $15,000 to $19,999 | 135 (3.9%) | 184 (8.5%) |
| $20,000 to $24,999 | 123 (3.6%) | 70 (3.2%) |
| $25,000 to $34,999 | 579 (16.8%) | 339 (15.6%) |
| $35,000 to $49,999 | 423 (12.3%) | 444 (20.4%) |
| $50,000 to $74,999 | 614 (17.8%) | 321 (14.8%) |
| $75,000 to $99,999 | 512 (14.9%) | 127 (5.9%) |
| $100,000 to $149,999 | 484 (14.1%) | 29 (1.3%) |
| $150,000 or more | 365 (10.6%) | 15 (0.7%) |
| Total | 3,445 (100.0%) | 2,171 (100.0%) |
Monthly Housing Cost Tiers in Elizabethton
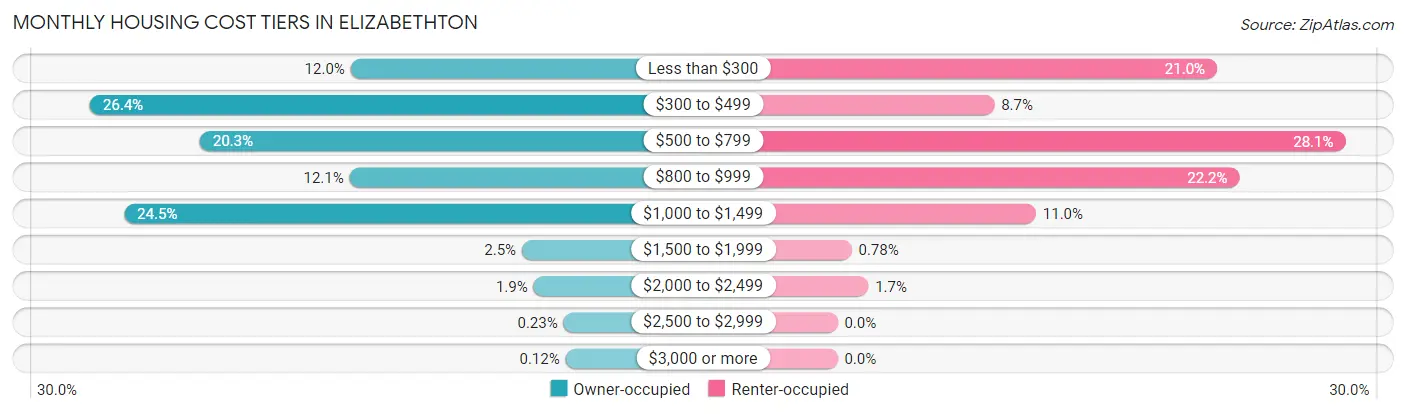
| Monthly Cost | Owner-occupied | Renter-occupied |
| Less than $300 | 413 (12.0%) | 455 (21.0%) |
| $300 to $499 | 909 (26.4%) | 188 (8.7%) |
| $500 to $799 | 700 (20.3%) | 609 (28.1%) |
| $800 to $999 | 415 (12.0%) | 482 (22.2%) |
| $1,000 to $1,499 | 844 (24.5%) | 238 (11.0%) |
| $1,500 to $1,999 | 87 (2.5%) | 17 (0.8%) |
| $2,000 to $2,499 | 65 (1.9%) | 37 (1.7%) |
| $2,500 to $2,999 | 8 (0.2%) | 0 (0.0%) |
| $3,000 or more | 4 (0.1%) | 0 (0.0%) |
| Total | 3,445 (100.0%) | 2,171 (100.0%) |
Physical Housing Characteristics in Elizabethton
Housing Structures in Elizabethton
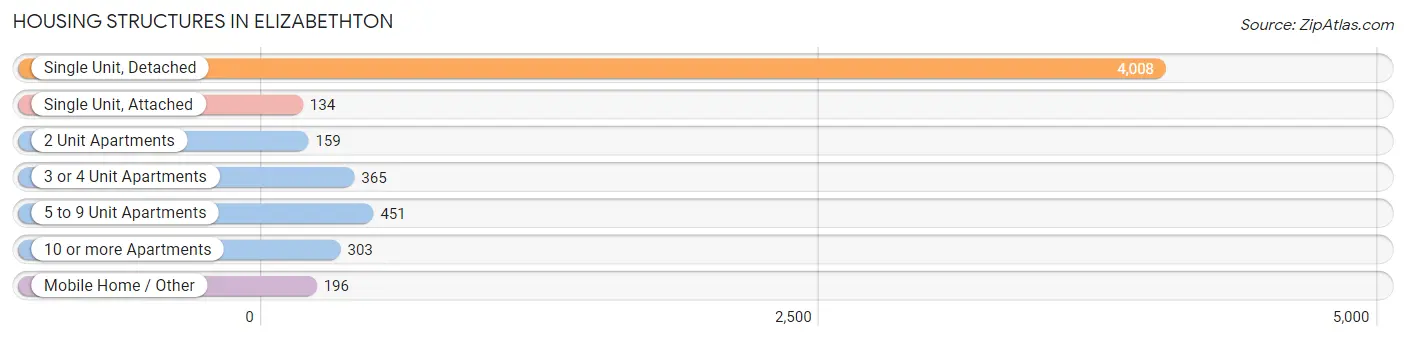
| Structure Type | # Housing Units | % Housing Units |
| Single Unit, Detached | 4,008 | 71.4% |
| Single Unit, Attached | 134 | 2.4% |
| 2 Unit Apartments | 159 | 2.8% |
| 3 or 4 Unit Apartments | 365 | 6.5% |
| 5 to 9 Unit Apartments | 451 | 8.0% |
| 10 or more Apartments | 303 | 5.4% |
| Mobile Home / Other | 196 | 3.5% |
| Total | 5,616 | 100.0% |
Housing Structures by Occupancy in Elizabethton
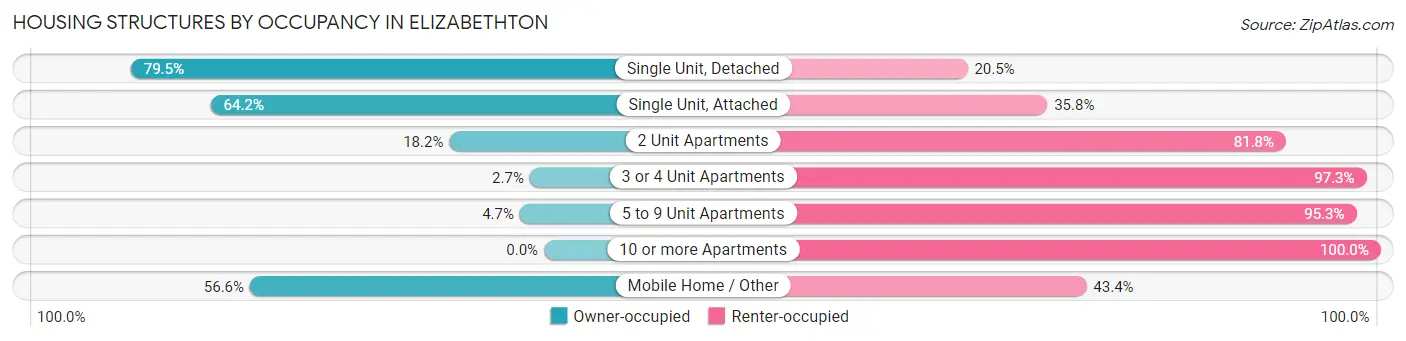
| Structure Type | Owner-occupied | Renter-occupied |
| Single Unit, Detached | 3,188 (79.5%) | 820 (20.5%) |
| Single Unit, Attached | 86 (64.2%) | 48 (35.8%) |
| 2 Unit Apartments | 29 (18.2%) | 130 (81.8%) |
| 3 or 4 Unit Apartments | 10 (2.7%) | 355 (97.3%) |
| 5 to 9 Unit Apartments | 21 (4.7%) | 430 (95.3%) |
| 10 or more Apartments | 0 (0.0%) | 303 (100.0%) |
| Mobile Home / Other | 111 (56.6%) | 85 (43.4%) |
| Total | 3,445 (61.3%) | 2,171 (38.7%) |
Housing Structures by Number of Rooms in Elizabethton
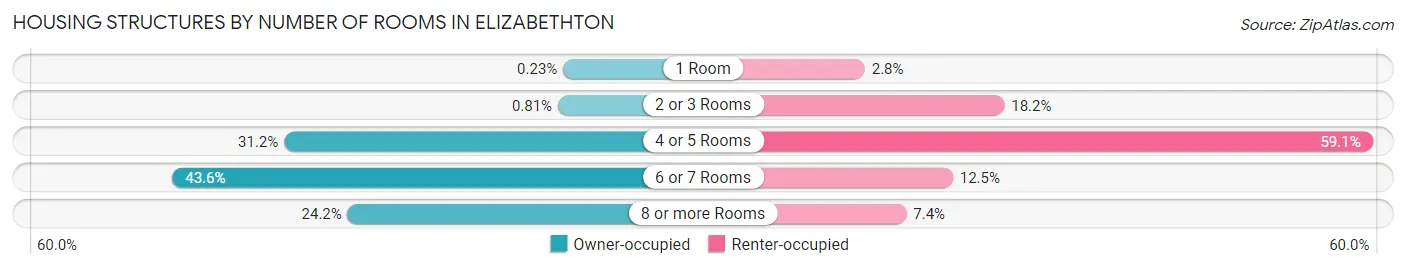
| Number of Rooms | Owner-occupied | Renter-occupied |
| 1 Room | 8 (0.2%) | 60 (2.8%) |
| 2 or 3 Rooms | 28 (0.8%) | 396 (18.2%) |
| 4 or 5 Rooms | 1,075 (31.2%) | 1,283 (59.1%) |
| 6 or 7 Rooms | 1,502 (43.6%) | 272 (12.5%) |
| 8 or more Rooms | 832 (24.1%) | 160 (7.4%) |
| Total | 3,445 (100.0%) | 2,171 (100.0%) |
Housing Structure by Heating Type in Elizabethton
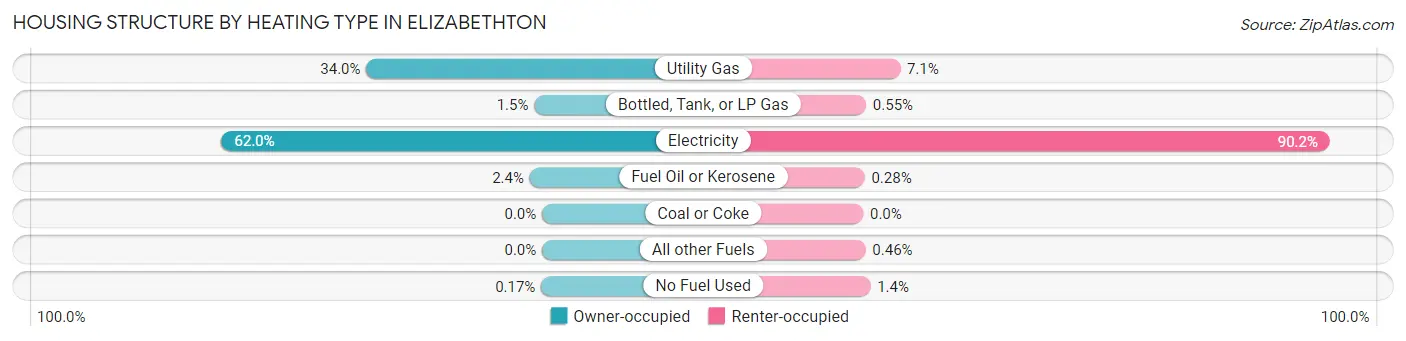
| Heating Type | Owner-occupied | Renter-occupied |
| Utility Gas | 1,170 (34.0%) | 155 (7.1%) |
| Bottled, Tank, or LP Gas | 52 (1.5%) | 12 (0.5%) |
| Electricity | 2,135 (62.0%) | 1,958 (90.2%) |
| Fuel Oil or Kerosene | 82 (2.4%) | 6 (0.3%) |
| Coal or Coke | 0 (0.0%) | 0 (0.0%) |
| All other Fuels | 0 (0.0%) | 10 (0.5%) |
| No Fuel Used | 6 (0.2%) | 30 (1.4%) |
| Total | 3,445 (100.0%) | 2,171 (100.0%) |
Household Vehicle Usage in Elizabethton
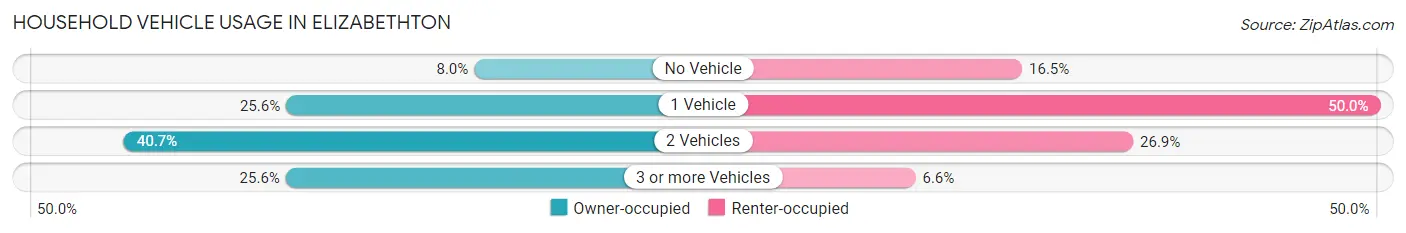
| Vehicles per Household | Owner-occupied | Renter-occupied |
| No Vehicle | 277 (8.0%) | 359 (16.5%) |
| 1 Vehicle | 882 (25.6%) | 1,085 (50.0%) |
| 2 Vehicles | 1,403 (40.7%) | 584 (26.9%) |
| 3 or more Vehicles | 883 (25.6%) | 143 (6.6%) |
| Total | 3,445 (100.0%) | 2,171 (100.0%) |
Real Estate & Mortgages in Elizabethton
Real Estate and Mortgage Overview in Elizabethton
| Characteristic | Without Mortgage | With Mortgage |
| Housing Units | 1,793 | 1,652 |
| Median Property Value | $150,800 | $149,500 |
| Median Household Income | $46,750 | $224 |
| Monthly Housing Costs | $416 | $4 |
| Real Estate Taxes | $1,177 | $13 |
Property Value by Mortgage Status in Elizabethton
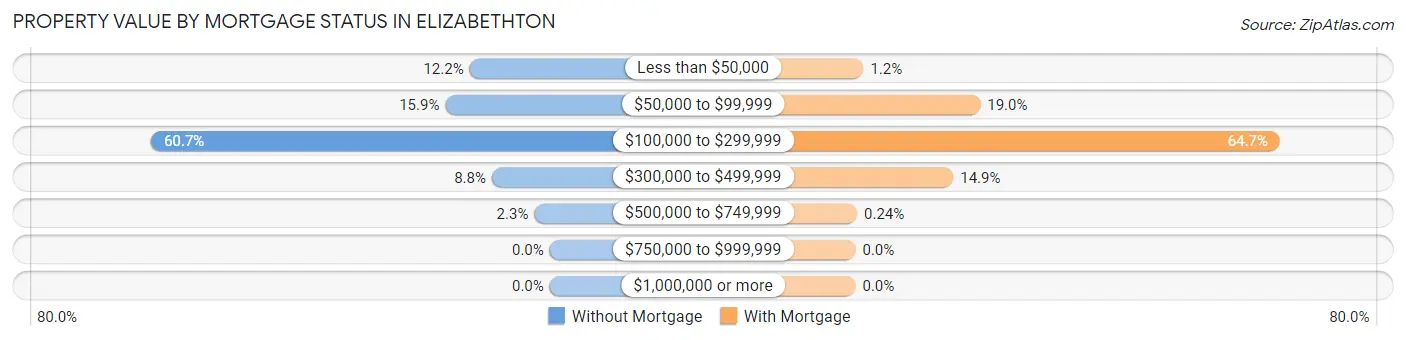
| Property Value | Without Mortgage | With Mortgage |
| Less than $50,000 | 219 (12.2%) | 20 (1.2%) |
| $50,000 to $99,999 | 285 (15.9%) | 314 (19.0%) |
| $100,000 to $299,999 | 1,089 (60.7%) | 1,068 (64.6%) |
| $300,000 to $499,999 | 158 (8.8%) | 246 (14.9%) |
| $500,000 to $749,999 | 42 (2.3%) | 4 (0.2%) |
| $750,000 to $999,999 | 0 (0.0%) | 0 (0.0%) |
| $1,000,000 or more | 0 (0.0%) | 0 (0.0%) |
| Total | 1,793 (100.0%) | 1,652 (100.0%) |
Household Income by Mortgage Status in Elizabethton
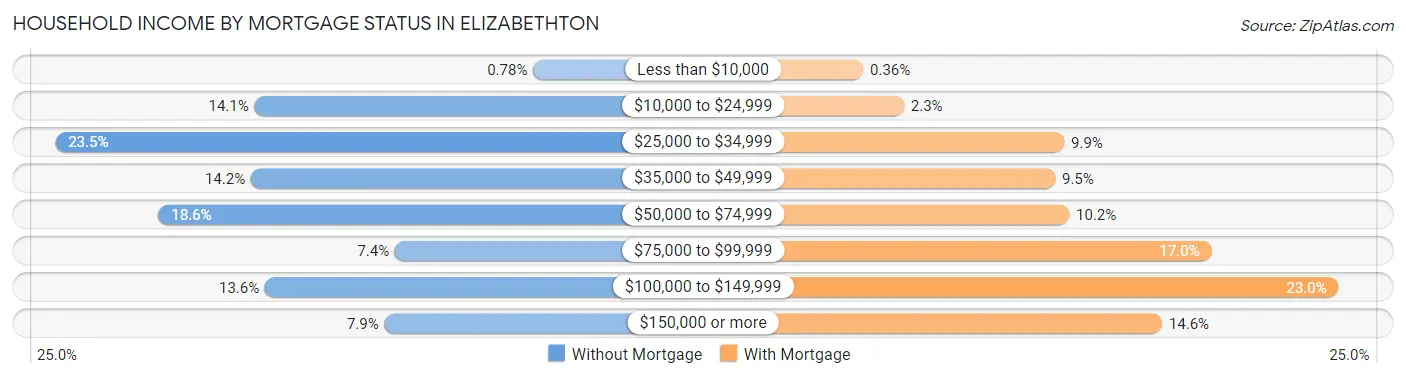
| Household Income | Without Mortgage | With Mortgage |
| Less than $10,000 | 14 (0.8%) | 6 (0.4%) |
| $10,000 to $24,999 | 252 (14.1%) | 38 (2.3%) |
| $25,000 to $34,999 | 422 (23.5%) | 164 (9.9%) |
| $35,000 to $49,999 | 255 (14.2%) | 157 (9.5%) |
| $50,000 to $74,999 | 334 (18.6%) | 168 (10.2%) |
| $75,000 to $99,999 | 132 (7.4%) | 280 (17.0%) |
| $100,000 to $149,999 | 243 (13.6%) | 380 (23.0%) |
| $150,000 or more | 141 (7.9%) | 241 (14.6%) |
| Total | 1,793 (100.0%) | 1,652 (100.0%) |
Property Value to Household Income Ratio in Elizabethton
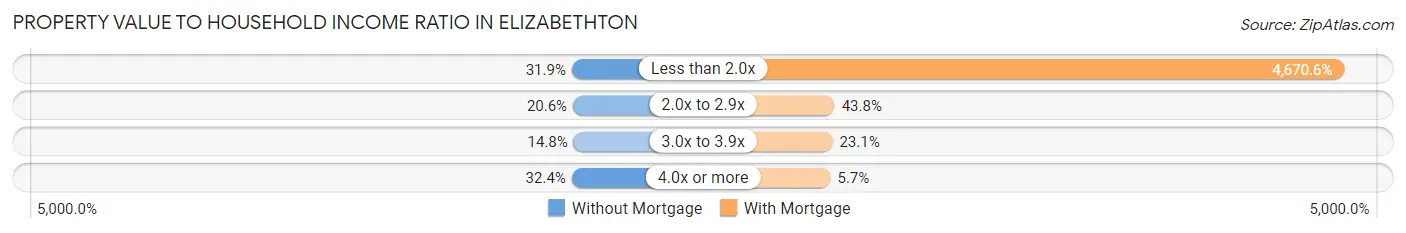
| Value-to-Income Ratio | Without Mortgage | With Mortgage |
| Less than 2.0x | 572 (31.9%) | 77,159 (4,670.6%) |
| 2.0x to 2.9x | 370 (20.6%) | 724 (43.8%) |
| 3.0x to 3.9x | 265 (14.8%) | 382 (23.1%) |
| 4.0x or more | 580 (32.4%) | 94 (5.7%) |
| Total | 1,793 (100.0%) | 1,652 (100.0%) |
Real Estate Taxes by Mortgage Status in Elizabethton
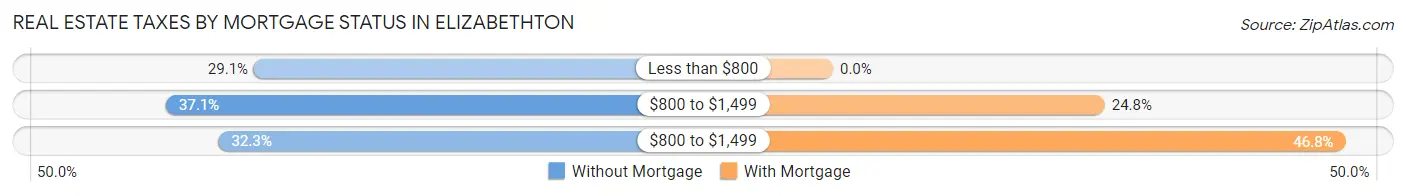
| Property Taxes | Without Mortgage | With Mortgage |
| Less than $800 | 521 (29.1%) | 0 (0.0%) |
| $800 to $1,499 | 665 (37.1%) | 410 (24.8%) |
| $800 to $1,499 | 579 (32.3%) | 773 (46.8%) |
| Total | 1,793 (100.0%) | 1,652 (100.0%) |
Health & Disability in Elizabethton
Health Insurance Coverage by Age in Elizabethton
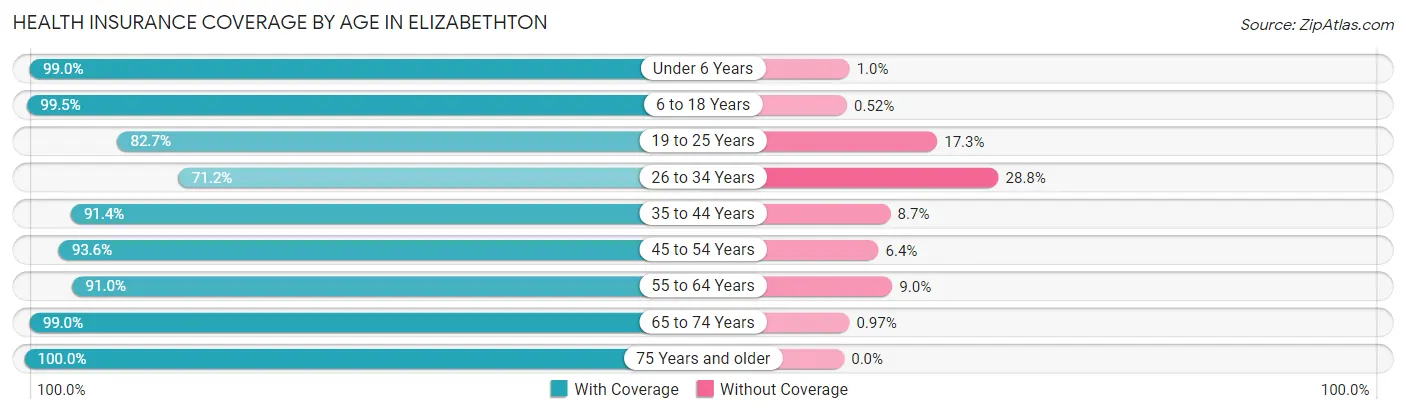
| Age Bracket | With Coverage | Without Coverage |
| Under 6 Years | 980 (99.0%) | 10 (1.0%) |
| 6 to 18 Years | 2,280 (99.5%) | 12 (0.5%) |
| 19 to 25 Years | 1,120 (82.7%) | 235 (17.3%) |
| 26 to 34 Years | 1,324 (71.2%) | 535 (28.8%) |
| 35 to 44 Years | 1,289 (91.3%) | 122 (8.6%) |
| 45 to 54 Years | 1,596 (93.6%) | 109 (6.4%) |
| 55 to 64 Years | 1,471 (91.0%) | 145 (9.0%) |
| 65 to 74 Years | 1,224 (99.0%) | 12 (1.0%) |
| 75 Years and older | 1,178 (100.0%) | 0 (0.0%) |
| Total | 12,462 (91.3%) | 1,180 (8.6%) |
Health Insurance Coverage by Citizenship Status in Elizabethton
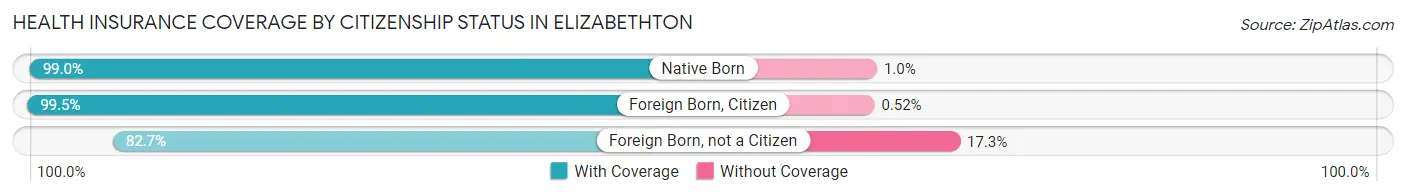
| Citizenship Status | With Coverage | Without Coverage |
| Native Born | 980 (99.0%) | 10 (1.0%) |
| Foreign Born, Citizen | 2,280 (99.5%) | 12 (0.5%) |
| Foreign Born, not a Citizen | 1,120 (82.7%) | 235 (17.3%) |
Health Insurance Coverage by Household Income in Elizabethton
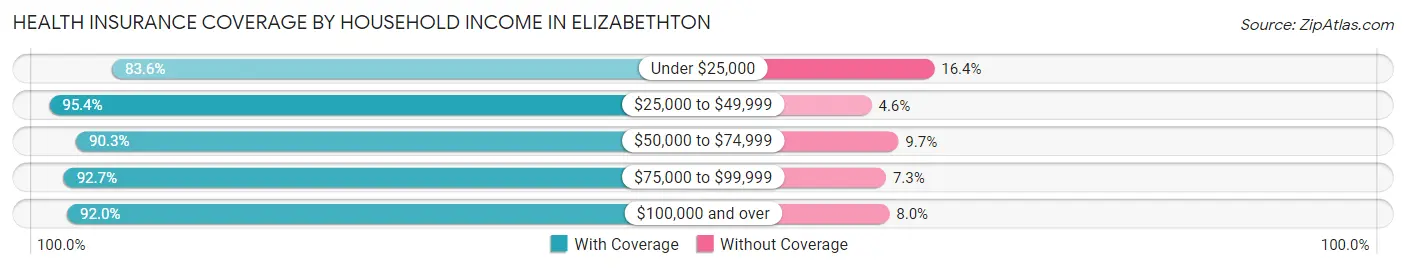
| Household Income | With Coverage | Without Coverage |
| Under $25,000 | 1,980 (83.6%) | 388 (16.4%) |
| $25,000 to $49,999 | 3,482 (95.4%) | 169 (4.6%) |
| $50,000 to $74,999 | 2,429 (90.3%) | 260 (9.7%) |
| $75,000 to $99,999 | 1,603 (92.7%) | 127 (7.3%) |
| $100,000 and over | 2,351 (92.0%) | 204 (8.0%) |
Public vs Private Health Insurance Coverage by Age in Elizabethton
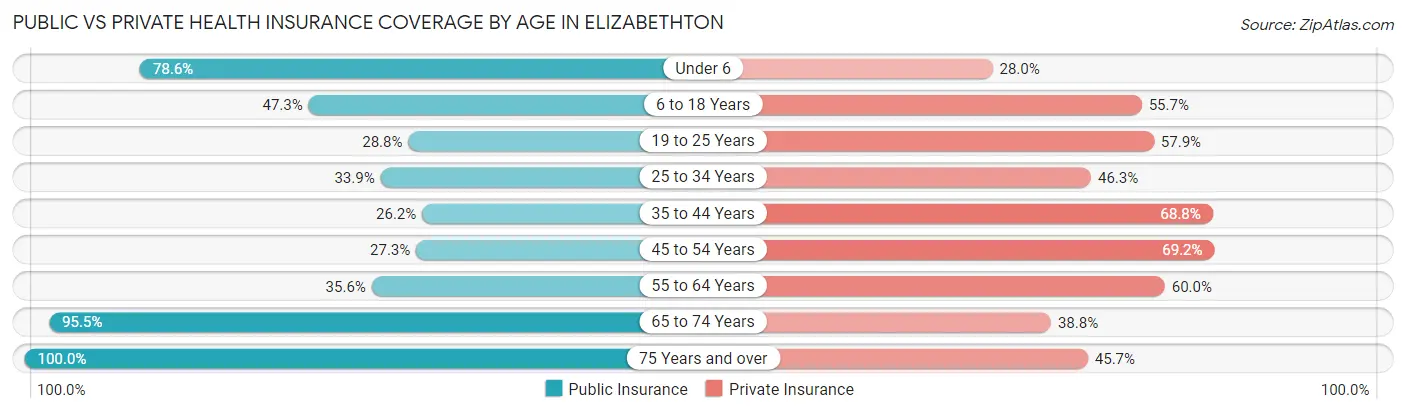
| Age Bracket | Public Insurance | Private Insurance |
| Under 6 | 778 (78.6%) | 277 (28.0%) |
| 6 to 18 Years | 1,084 (47.3%) | 1,276 (55.7%) |
| 19 to 25 Years | 390 (28.8%) | 785 (57.9%) |
| 25 to 34 Years | 631 (33.9%) | 860 (46.3%) |
| 35 to 44 Years | 370 (26.2%) | 971 (68.8%) |
| 45 to 54 Years | 466 (27.3%) | 1,179 (69.2%) |
| 55 to 64 Years | 575 (35.6%) | 969 (60.0%) |
| 65 to 74 Years | 1,180 (95.5%) | 480 (38.8%) |
| 75 Years and over | 1,178 (100.0%) | 538 (45.7%) |
| Total | 6,652 (48.8%) | 7,335 (53.8%) |
Disability Status by Sex by Age in Elizabethton
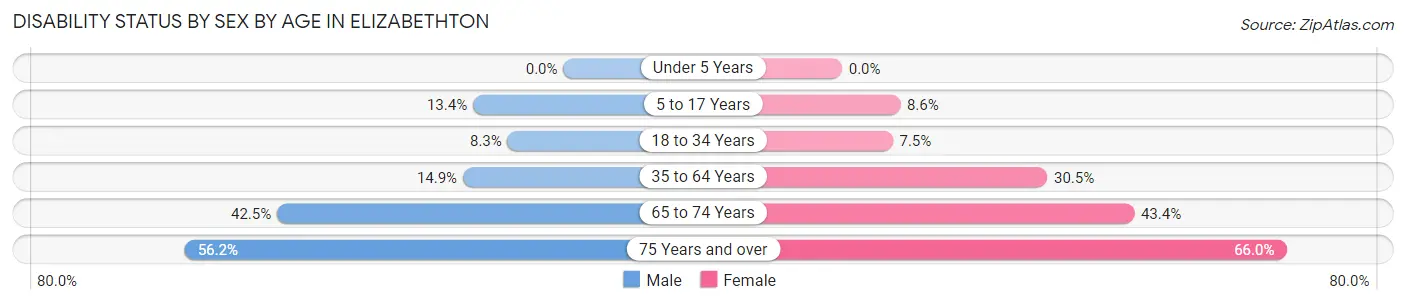
| Age Bracket | Male | Female |
| Under 5 Years | 0 (0.0%) | 0 (0.0%) |
| 5 to 17 Years | 150 (13.4%) | 88 (8.6%) |
| 18 to 34 Years | 135 (8.3%) | 142 (7.5%) |
| 35 to 64 Years | 348 (14.9%) | 731 (30.5%) |
| 65 to 74 Years | 207 (42.5%) | 325 (43.4%) |
| 75 Years and over | 244 (56.2%) | 491 (66.0%) |
Disability Class by Sex by Age in Elizabethton
Disability Class: Hearing Difficulty
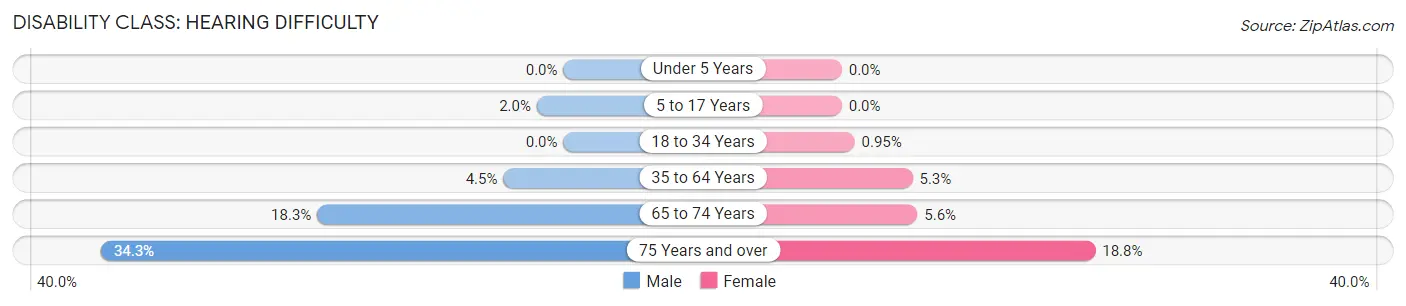
| Age Bracket | Male | Female |
| Under 5 Years | 0 (0.0%) | 0 (0.0%) |
| 5 to 17 Years | 22 (2.0%) | 0 (0.0%) |
| 18 to 34 Years | 0 (0.0%) | 18 (0.9%) |
| 35 to 64 Years | 104 (4.5%) | 126 (5.2%) |
| 65 to 74 Years | 89 (18.3%) | 42 (5.6%) |
| 75 Years and over | 149 (34.3%) | 140 (18.8%) |
Disability Class: Vision Difficulty
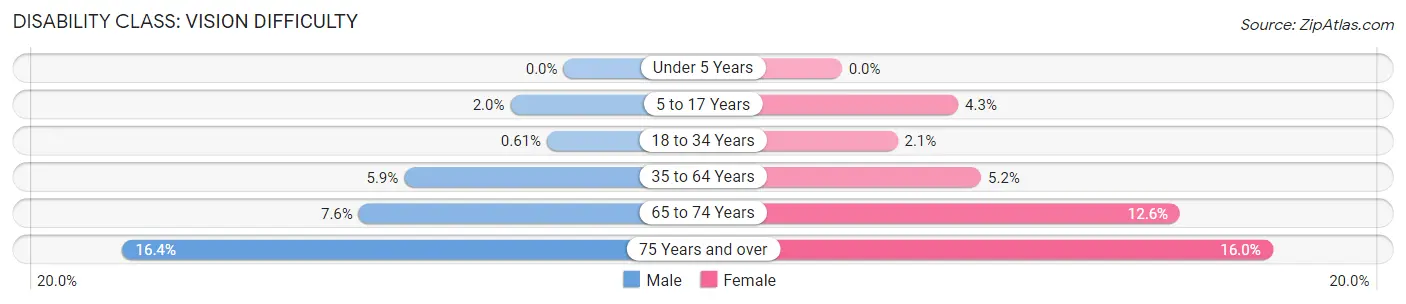
| Age Bracket | Male | Female |
| Under 5 Years | 0 (0.0%) | 0 (0.0%) |
| 5 to 17 Years | 22 (2.0%) | 44 (4.3%) |
| 18 to 34 Years | 10 (0.6%) | 39 (2.1%) |
| 35 to 64 Years | 138 (5.9%) | 124 (5.2%) |
| 65 to 74 Years | 37 (7.6%) | 94 (12.6%) |
| 75 Years and over | 71 (16.4%) | 119 (16.0%) |
Disability Class: Cognitive Difficulty
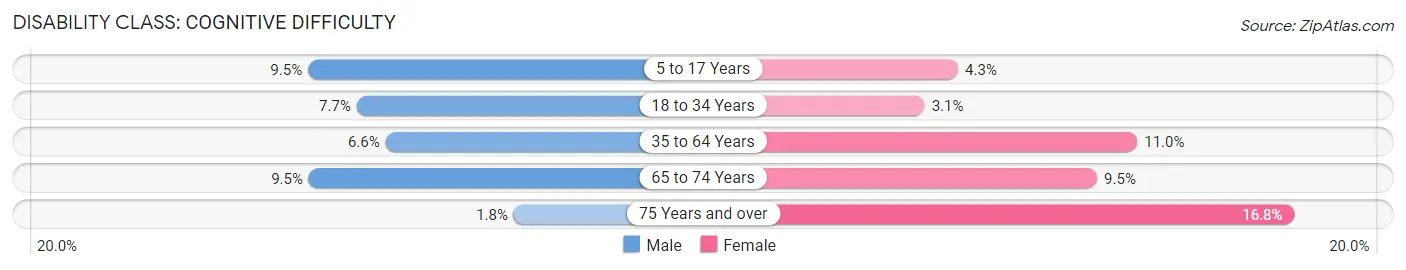
| Age Bracket | Male | Female |
| 5 to 17 Years | 106 (9.5%) | 44 (4.3%) |
| 18 to 34 Years | 125 (7.7%) | 58 (3.1%) |
| 35 to 64 Years | 154 (6.6%) | 263 (11.0%) |
| 65 to 74 Years | 46 (9.5%) | 71 (9.5%) |
| 75 Years and over | 8 (1.8%) | 125 (16.8%) |
Disability Class: Ambulatory Difficulty
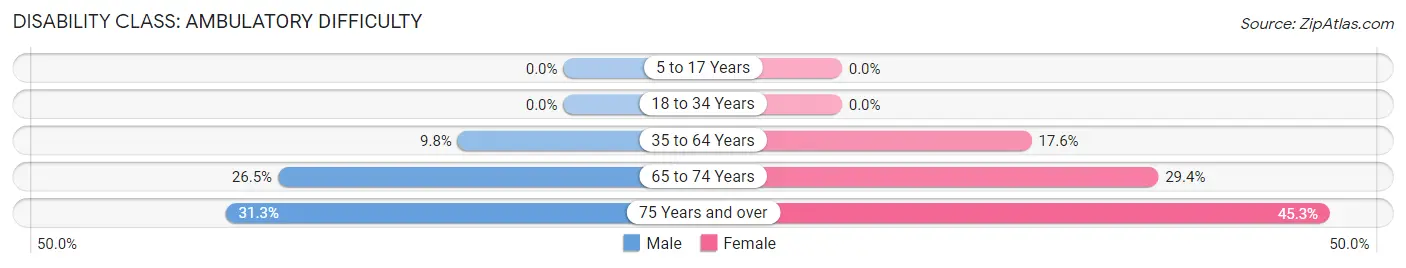
| Age Bracket | Male | Female |
| 5 to 17 Years | 0 (0.0%) | 0 (0.0%) |
| 18 to 34 Years | 0 (0.0%) | 0 (0.0%) |
| 35 to 64 Years | 229 (9.8%) | 422 (17.6%) |
| 65 to 74 Years | 129 (26.5%) | 220 (29.4%) |
| 75 Years and over | 136 (31.3%) | 337 (45.3%) |
Disability Class: Self-Care Difficulty
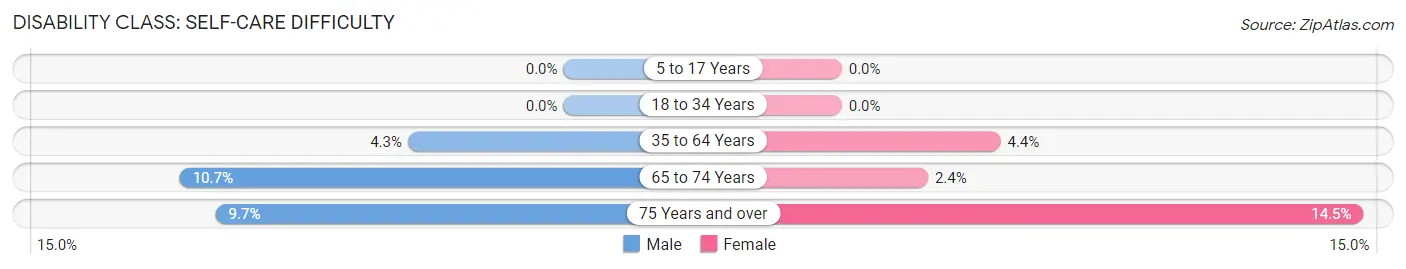
| Age Bracket | Male | Female |
| 5 to 17 Years | 0 (0.0%) | 0 (0.0%) |
| 18 to 34 Years | 0 (0.0%) | 0 (0.0%) |
| 35 to 64 Years | 101 (4.3%) | 106 (4.4%) |
| 65 to 74 Years | 52 (10.7%) | 18 (2.4%) |
| 75 Years and over | 42 (9.7%) | 108 (14.5%) |
Technology Access in Elizabethton
Computing Device Access in Elizabethton
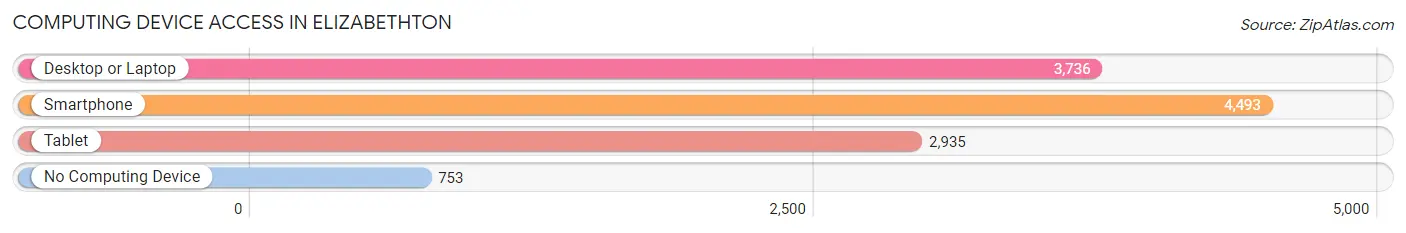
| Device Type | # Households | % Households |
| Desktop or Laptop | 3,736 | 66.5% |
| Smartphone | 4,493 | 80.0% |
| Tablet | 2,935 | 52.3% |
| No Computing Device | 753 | 13.4% |
| Total | 5,616 | 100.0% |
Internet Access in Elizabethton
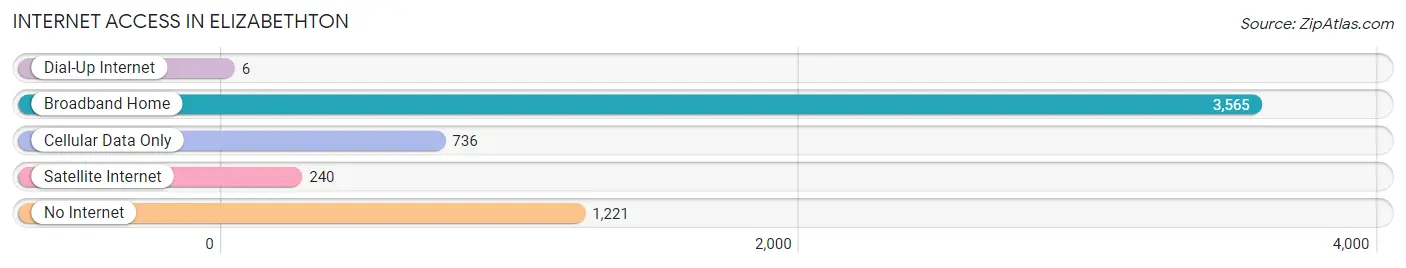
| Internet Type | # Households | % Households |
| Dial-Up Internet | 6 | 0.1% |
| Broadband Home | 3,565 | 63.5% |
| Cellular Data Only | 736 | 13.1% |
| Satellite Internet | 240 | 4.3% |
| No Internet | 1,221 | 21.7% |
| Total | 5,616 | 100.0% |
Elizabethton Summary
Elizabethton, Tennessee is a small city located in the northeastern corner of the state, in Carter County. It is situated in the Appalachian Mountains, and is the county seat of Carter County. The city is located along the Watauga River, and is bordered by Johnson City to the west, and the Cherokee National Forest to the east. The city has a population of 14,176, according to the 2010 census.
History
Elizabethton was founded in 1760 by William Carter, a settler from Virginia. The city was named after his wife, Elizabeth MacLin Carter. The city was incorporated in 1819, and was the first city in Tennessee to be incorporated by the state legislature.
The city was an important center of commerce during the 19th century, and was the site of the first railroad in the state. The railroad connected Elizabethton to Johnson City, and was instrumental in the development of the city.
The city was also the site of the Battle of Elizabethton, which was fought during the Civil War. The battle was a Confederate victory, and resulted in the Union forces retreating from the city.
Geography
Elizabethton is located in the northeastern corner of Tennessee, in Carter County. The city is situated in the Appalachian Mountains, and is bordered by Johnson City to the west, and the Cherokee National Forest to the east. The city is located along the Watauga River, and is surrounded by the Unaka Mountains.
The city has a total area of 8.3 square miles, of which 8.2 square miles is land and 0.1 square miles is water. The city has a humid subtropical climate, with hot, humid summers and mild winters.
Economy
Elizabethton is a small city, and its economy is largely based on tourism and manufacturing. The city is home to several manufacturing companies, including Eastman Chemical Company, which is the largest employer in the city. Other major employers in the city include the Elizabethton Electric Department, the Elizabethton City Schools, and the Elizabethton Medical Center.
The city is also home to several tourist attractions, including the Sycamore Shoals State Historic Park, the Elizabethton Covered Bridge, and the Watauga River.
Demographics
According to the 2010 census, Elizabethton has a population of 14,176. The racial makeup of the city is 87.3% White, 8.2% African American, 0.4% Native American, 0.7% Asian, 0.1% Pacific Islander, 1.2% from other races, and 2.1% from two or more races. Hispanic or Latino of any race were 2.7% of the population.
The median income for a household in the city was $30,945, and the median income for a family was $37,945. The per capita income for the city was $17,845. About 17.2% of families and 20.3% of the population were below the poverty line, including 28.2% of those under age 18 and 14.2% of those age 65 or over.
Common Questions
What is Per Capita Income in Elizabethton?
Per Capita income in Elizabethton is $26,827.
What is the Median Family Income in Elizabethton?
Median Family Income in Elizabethton is $53,214.
What is the Median Household income in Elizabethton?
Median Household Income in Elizabethton is $44,252.
What is Income or Wage Gap in Elizabethton?
Income or Wage Gap in Elizabethton is 28.9%.
Women in Elizabethton earn 71.1 cents for every dollar earned by a man.
What is Inequality or Gini Index in Elizabethton?
Inequality or Gini Index in Elizabethton is 0.46.
What is the Total Population of Elizabethton?
Total Population of Elizabethton is 14,375.
What is the Total Male Population of Elizabethton?
Total Male Population of Elizabethton is 6,802.
What is the Total Female Population of Elizabethton?
Total Female Population of Elizabethton is 7,573.
What is the Ratio of Males per 100 Females in Elizabethton?
There are 89.82 Males per 100 Females in Elizabethton.
What is the Ratio of Females per 100 Males in Elizabethton?
There are 111.33 Females per 100 Males in Elizabethton.
What is the Median Population Age in Elizabethton?
Median Population Age in Elizabethton is 39.4 Years.
What is the Average Family Size in Elizabethton
Average Family Size in Elizabethton is 3.0 People.
What is the Average Household Size in Elizabethton
Average Household Size in Elizabethton is 2.3 People.
How Large is the Labor Force in Elizabethton?
There are 5,952 People in the Labor Forcein in Elizabethton.
What is the Percentage of People in the Labor Force in Elizabethton?
50.6% of People are in the Labor Force in Elizabethton.
What is the Unemployment Rate in Elizabethton?
Unemployment Rate in Elizabethton is 6.9%.