Brighton, TN Map & Demographics
Brighton Map
Brighton Overview
$29,948
PER CAPITA INCOME
$82,619
AVG FAMILY INCOME
$76,202
AVG HOUSEHOLD INCOME
27.8%
WAGE / INCOME GAP [ % ]
72.2¢/ $1
WAGE / INCOME GAP [ $ ]
0.40
INEQUALITY / GINI INDEX
2,878
TOTAL POPULATION
1,432
MALE POPULATION
1,446
FEMALE POPULATION
99.03
MALES / 100 FEMALES
100.98
FEMALES / 100 MALES
30.8
MEDIAN AGE
3.1
AVG FAMILY SIZE
2.9
AVG HOUSEHOLD SIZE
1,467
LABOR FORCE [ PEOPLE ]
71.0%
PERCENT IN LABOR FORCE
4.8%
UNEMPLOYMENT RATE
Brighton Zip Codes
Brighton Area Codes
Income in Brighton
Income Overview in Brighton
Per Capita Income in Brighton is $29,948, while median incomes of families and households are $82,619 and $76,202 respectively.
| Characteristic | Number | Measure |
| Per Capita Income | 2,878 | $29,948 |
| Median Family Income | 814 | $82,619 |
| Mean Family Income | 814 | $92,897 |
| Median Household Income | 1,005 | $76,202 |
| Mean Household Income | 1,005 | $86,042 |
| Income Deficit | 814 | $0 |
| Wage / Income Gap (%) | 2,878 | 27.83% |
| Wage / Income Gap ($) | 2,878 | 72.17¢ per $1 |
| Gini / Inequality Index | 2,878 | 0.40 |
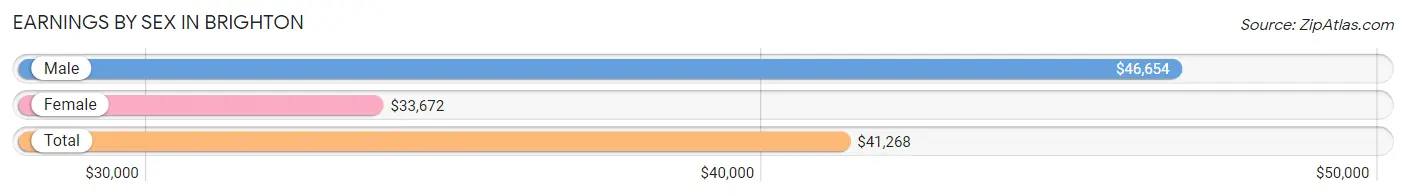
Earnings by Sex in Brighton
Average Earnings in Brighton are $41,268, $46,654 for men and $33,672 for women, a difference of 27.8%.
| Sex | Number | Average Earnings |
| Male | 725 (48.5%) | $46,654 |
| Female | 771 (51.5%) | $33,672 |
| Total | 1,496 (100.0%) | $41,268 |
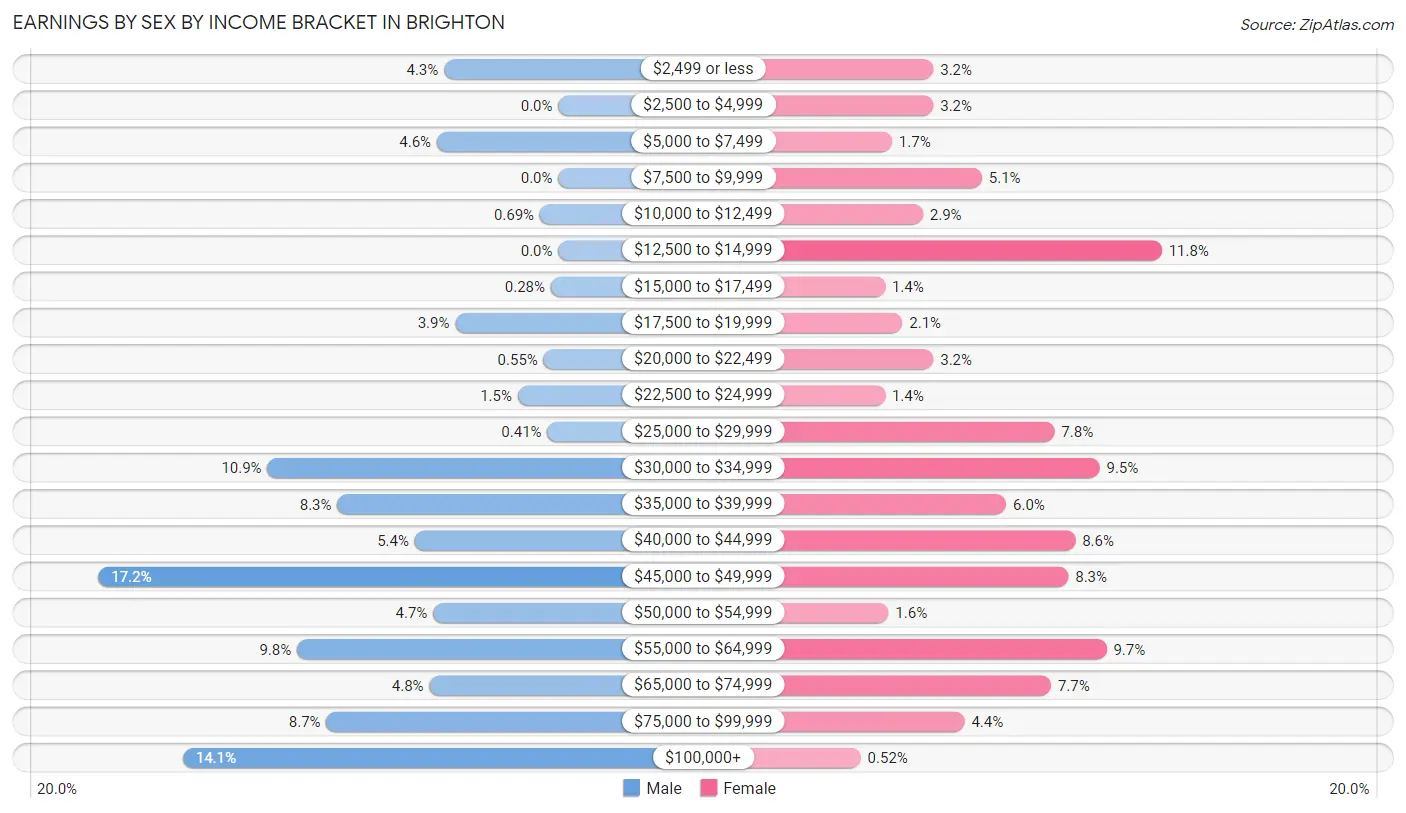
Earnings by Sex by Income Bracket in Brighton
The most common earnings brackets in Brighton are $45,000 to $49,999 for men (125 | 17.2%) and $12,500 to $14,999 for women (91 | 11.8%).
| Income | Male | Female |
| $2,499 or less | 31 (4.3%) | 25 (3.2%) |
| $2,500 to $4,999 | 0 (0.0%) | 25 (3.2%) |
| $5,000 to $7,499 | 33 (4.5%) | 13 (1.7%) |
| $7,500 to $9,999 | 0 (0.0%) | 39 (5.1%) |
| $10,000 to $12,499 | 5 (0.7%) | 22 (2.9%) |
| $12,500 to $14,999 | 0 (0.0%) | 91 (11.8%) |
| $15,000 to $17,499 | 2 (0.3%) | 11 (1.4%) |
| $17,500 to $19,999 | 28 (3.9%) | 16 (2.1%) |
| $20,000 to $22,499 | 4 (0.5%) | 25 (3.2%) |
| $22,500 to $24,999 | 11 (1.5%) | 11 (1.4%) |
| $25,000 to $29,999 | 3 (0.4%) | 60 (7.8%) |
| $30,000 to $34,999 | 79 (10.9%) | 73 (9.5%) |
| $35,000 to $39,999 | 60 (8.3%) | 46 (6.0%) |
| $40,000 to $44,999 | 39 (5.4%) | 66 (8.6%) |
| $45,000 to $49,999 | 125 (17.2%) | 64 (8.3%) |
| $50,000 to $54,999 | 34 (4.7%) | 12 (1.6%) |
| $55,000 to $64,999 | 71 (9.8%) | 75 (9.7%) |
| $65,000 to $74,999 | 35 (4.8%) | 59 (7.6%) |
| $75,000 to $99,999 | 63 (8.7%) | 34 (4.4%) |
| $100,000+ | 102 (14.1%) | 4 (0.5%) |
| Total | 725 (100.0%) | 771 (100.0%) |
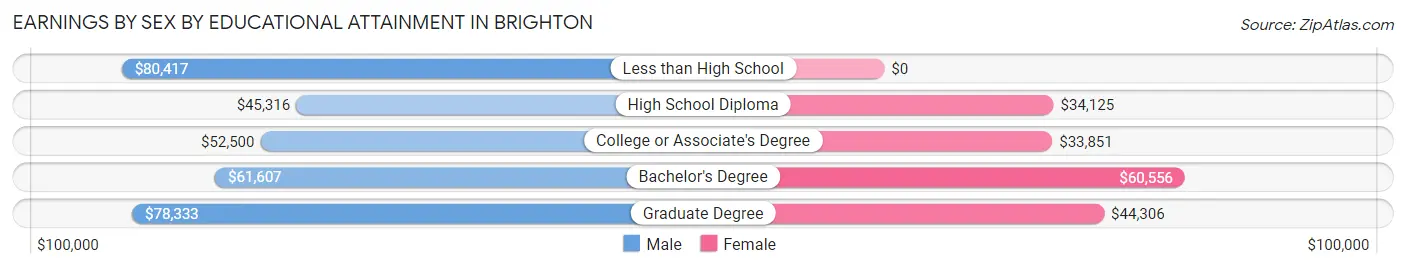
Earnings by Sex by Educational Attainment in Brighton
Average earnings in Brighton are $47,554 for men and $35,450 for women, a difference of 25.5%. Men with an educational attainment of less than high school enjoy the highest average annual earnings of $80,417, while those with high school diploma education earn the least with $45,316. Women with an educational attainment of bachelor's degree earn the most with the average annual earnings of $60,556, while those with college or associate's degree education have the smallest earnings of $33,851.
| Educational Attainment | Male Income | Female Income |
| Less than High School | $80,417 | $0 |
| High School Diploma | $45,316 | $34,125 |
| College or Associate's Degree | $52,500 | $33,851 |
| Bachelor's Degree | $61,607 | $60,556 |
| Graduate Degree | $78,333 | $44,306 |
| Total | $47,554 | $35,450 |
Family Income in Brighton
Family Income Brackets in Brighton
According to the Brighton family income data, there are 177 families falling into the $75,000 to $99,999 income range, which is the most common income bracket and makes up 21.7% of all families. Conversely, the $15,000 to $24,999 income bracket is the least frequent group with only 9 families (1.1%) belonging to this category.
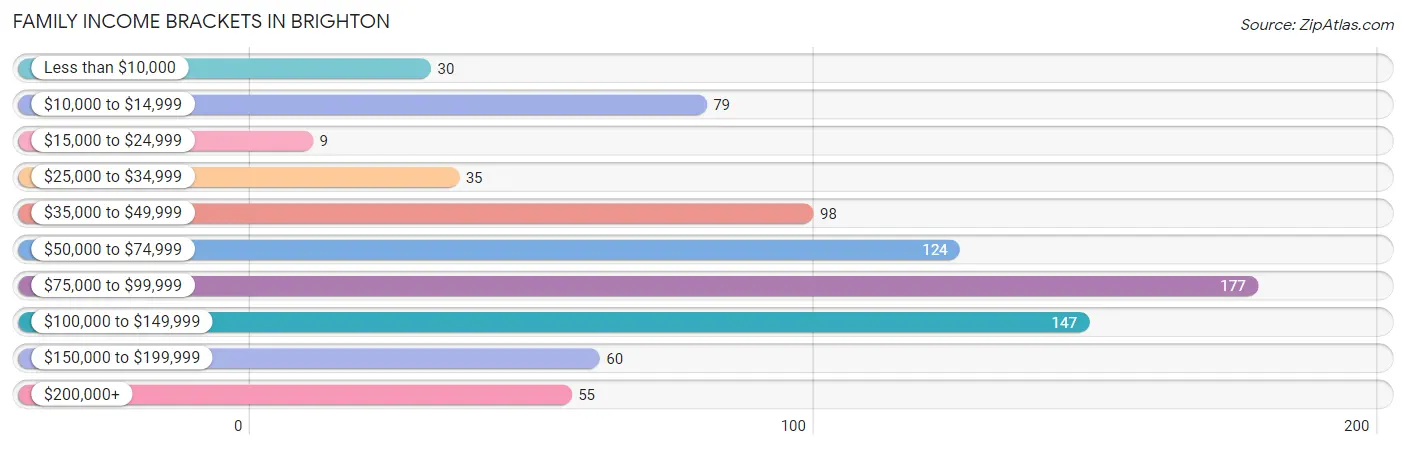
| Income Bracket | # Families | % Families |
| Less than $10,000 | 30 | 3.7% |
| $10,000 to $14,999 | 79 | 9.7% |
| $15,000 to $24,999 | 9 | 1.1% |
| $25,000 to $34,999 | 35 | 4.3% |
| $35,000 to $49,999 | 98 | 12.0% |
| $50,000 to $74,999 | 124 | 15.2% |
| $75,000 to $99,999 | 177 | 21.7% |
| $100,000 to $149,999 | 147 | 18.1% |
| $150,000 to $199,999 | 60 | 7.4% |
| $200,000+ | 55 | 6.8% |
Family Income by Famaliy Size in Brighton
4-person families (157 | 19.3%) account for the highest median family income in Brighton with $105,313 per family, while 2-person families (261 | 32.1%) have the highest median income of $33,925 per family member.
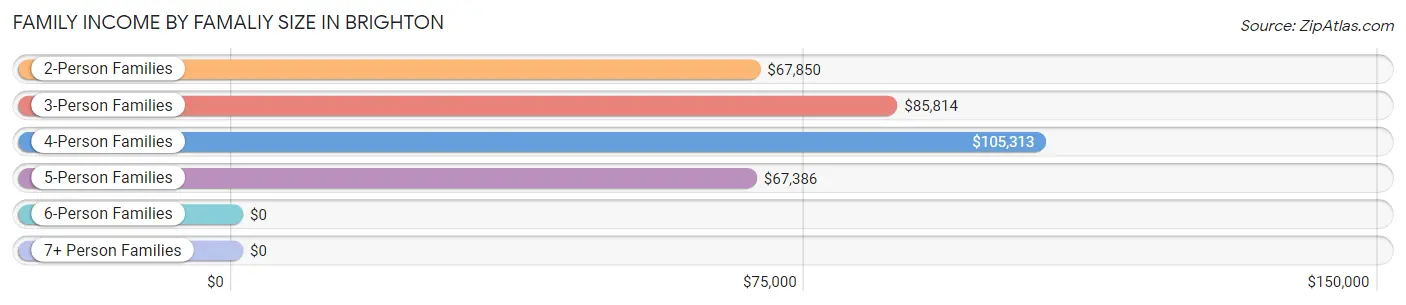
| Income Bracket | # Families | Median Income |
| 2-Person Families | 261 (32.1%) | $67,850 |
| 3-Person Families | 278 (34.2%) | $85,814 |
| 4-Person Families | 157 (19.3%) | $105,313 |
| 5-Person Families | 103 (12.7%) | $67,386 |
| 6-Person Families | 0 (0.0%) | $0 |
| 7+ Person Families | 15 (1.8%) | $0 |
| Total | 814 (100.0%) | $82,619 |
Family Income by Number of Earners in Brighton
The median family income in Brighton is $82,619, with families comprising 3+ earners (102) having the highest median family income of $132,292, while families with no earners (56) have the lowest median family income of $26,964, accounting for 12.5% and 6.9% of families, respectively.
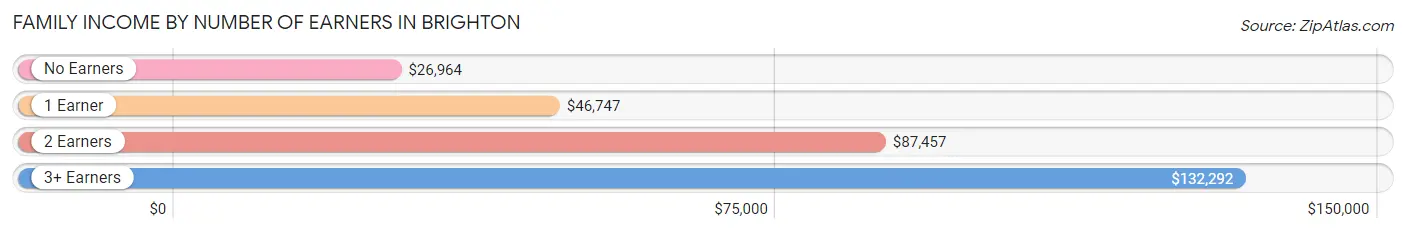
| Number of Earners | # Families | Median Income |
| No Earners | 56 (6.9%) | $26,964 |
| 1 Earner | 324 (39.8%) | $46,747 |
| 2 Earners | 332 (40.8%) | $87,457 |
| 3+ Earners | 102 (12.5%) | $132,292 |
| Total | 814 (100.0%) | $82,619 |
Household Income in Brighton
Household Income Brackets in Brighton
With 240 households falling in the category, the $75,000 to $99,999 income range is the most frequent in Brighton, accounting for 23.9% of all households. In contrast, only 43 households (4.3%) fall into the less than $10,000 income bracket, making it the least populous group.
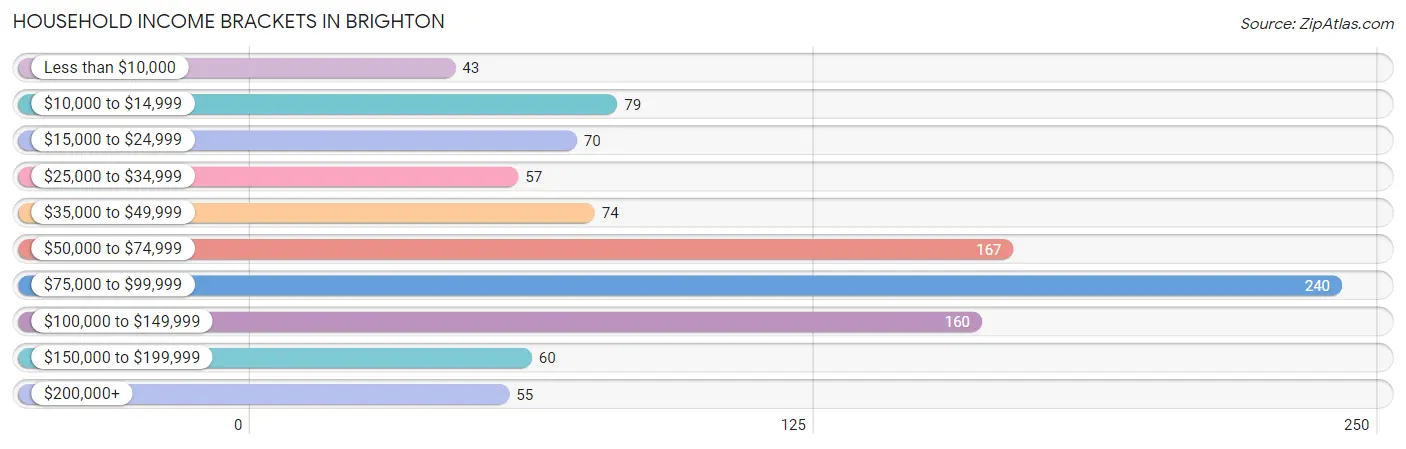
| Income Bracket | # Households | % Households |
| Less than $10,000 | 43 | 4.3% |
| $10,000 to $14,999 | 79 | 7.9% |
| $15,000 to $24,999 | 70 | 7.0% |
| $25,000 to $34,999 | 57 | 5.7% |
| $35,000 to $49,999 | 74 | 7.4% |
| $50,000 to $74,999 | 167 | 16.6% |
| $75,000 to $99,999 | 240 | 23.9% |
| $100,000 to $149,999 | 160 | 15.9% |
| $150,000 to $199,999 | 60 | 6.0% |
| $200,000+ | 55 | 5.5% |
Household Income by Householder Age in Brighton
The median household income in Brighton is $76,202, with the highest median household income of $107,159 found in the 45 to 64 years age bracket for the primary householder. A total of 241 households (24.0%) fall into this category. Meanwhile, the 65+ years age bracket for the primary householder has the lowest median household income of $30,000, with 268 households (26.7%) in this group.
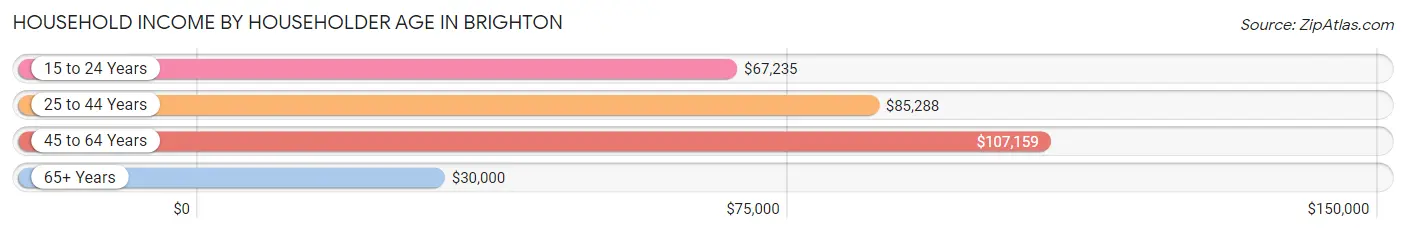
| Income Bracket | # Households | Median Income |
| 15 to 24 Years | 59 (5.9%) | $67,235 |
| 25 to 44 Years | 437 (43.5%) | $85,288 |
| 45 to 64 Years | 241 (24.0%) | $107,159 |
| 65+ Years | 268 (26.7%) | $30,000 |
| Total | 1,005 (100.0%) | $76,202 |
Poverty in Brighton
Income Below Poverty by Sex and Age in Brighton
With 8.3% poverty level for males and 17.2% for females among the residents of Brighton, 6 to 11 year old males and 16 and 17 year old females are the most vulnerable to poverty, with 47 males (26.6%) and 19 females (35.8%) in their respective age groups living below the poverty level.
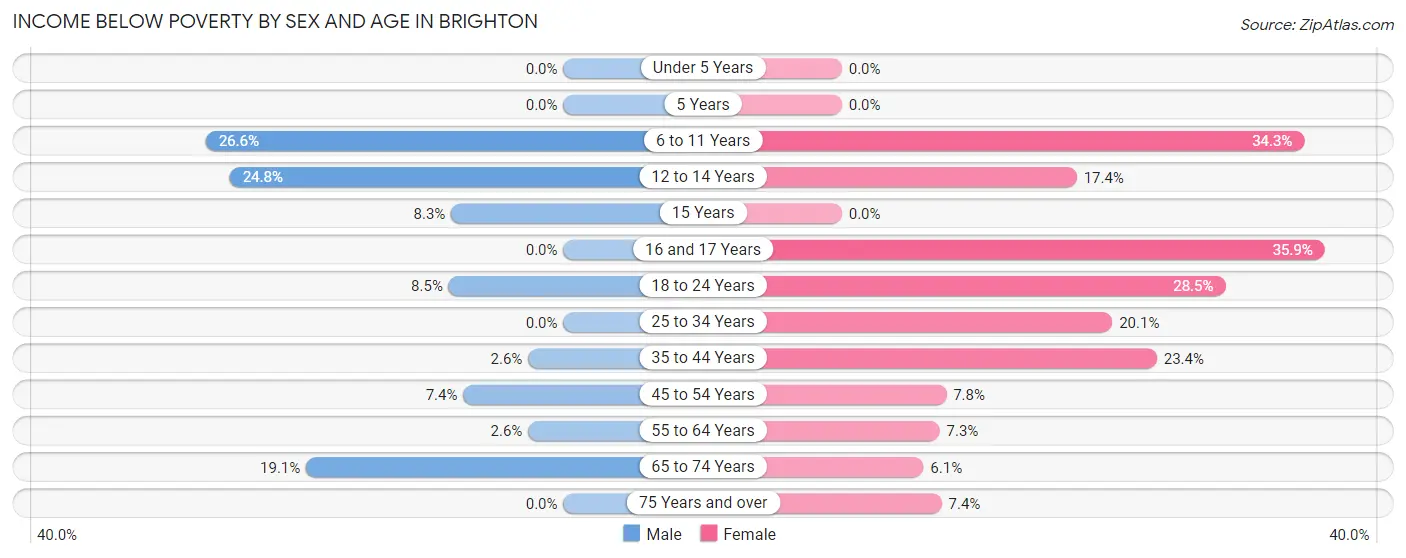
| Age Bracket | Male | Female |
| Under 5 Years | 0 (0.0%) | 0 (0.0%) |
| 5 Years | 0 (0.0%) | 0 (0.0%) |
| 6 to 11 Years | 47 (26.6%) | 46 (34.3%) |
| 12 to 14 Years | 27 (24.8%) | 15 (17.4%) |
| 15 Years | 2 (8.3%) | 0 (0.0%) |
| 16 and 17 Years | 0 (0.0%) | 19 (35.8%) |
| 18 to 24 Years | 8 (8.5%) | 39 (28.5%) |
| 25 to 34 Years | 0 (0.0%) | 53 (20.1%) |
| 35 to 44 Years | 3 (2.6%) | 40 (23.4%) |
| 45 to 54 Years | 11 (7.4%) | 11 (7.7%) |
| 55 to 64 Years | 3 (2.6%) | 9 (7.3%) |
| 65 to 74 Years | 17 (19.1%) | 10 (6.1%) |
| 75 Years and over | 0 (0.0%) | 6 (7.4%) |
| Total | 118 (8.3%) | 248 (17.2%) |
Income Above Poverty by Sex and Age in Brighton
According to the poverty statistics in Brighton, males aged under 5 years and females aged under 5 years are the age groups that are most secure financially, with 100.0% of males and 100.0% of females in these age groups living above the poverty line.
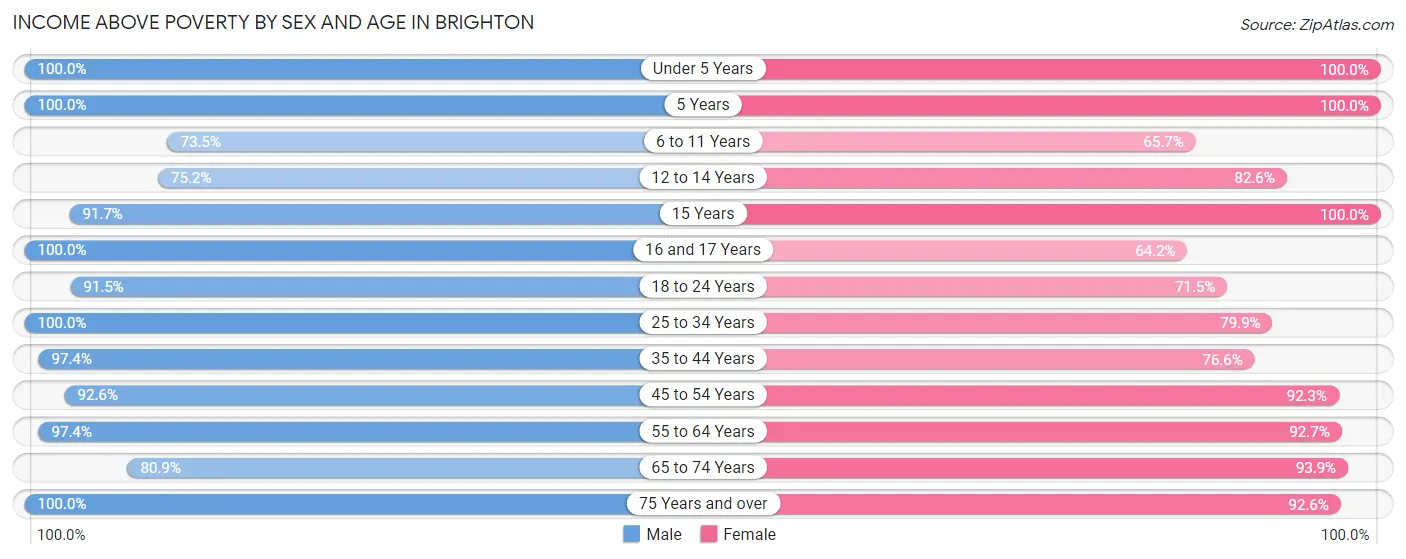
| Age Bracket | Male | Female |
| Under 5 Years | 172 (100.0%) | 68 (100.0%) |
| 5 Years | 8 (100.0%) | 9 (100.0%) |
| 6 to 11 Years | 130 (73.5%) | 88 (65.7%) |
| 12 to 14 Years | 82 (75.2%) | 71 (82.6%) |
| 15 Years | 22 (91.7%) | 6 (100.0%) |
| 16 and 17 Years | 61 (100.0%) | 34 (64.1%) |
| 18 to 24 Years | 86 (91.5%) | 98 (71.5%) |
| 25 to 34 Years | 287 (100.0%) | 211 (79.9%) |
| 35 to 44 Years | 112 (97.4%) | 131 (76.6%) |
| 45 to 54 Years | 137 (92.6%) | 131 (92.2%) |
| 55 to 64 Years | 112 (97.4%) | 115 (92.7%) |
| 65 to 74 Years | 72 (80.9%) | 155 (93.9%) |
| 75 Years and over | 20 (100.0%) | 75 (92.6%) |
| Total | 1,301 (91.7%) | 1,192 (82.8%) |
Income Below Poverty Among Married-Couple Families in Brighton
The poverty statistics for married-couple families in Brighton show that 2.2% or 11 of the total 494 families live below the poverty line. Families with no children have the highest poverty rate of 3.9%, comprising of 8 families. On the other hand, families with 3 or 4 children have the lowest poverty rate of 0.0%, which includes 0 families.
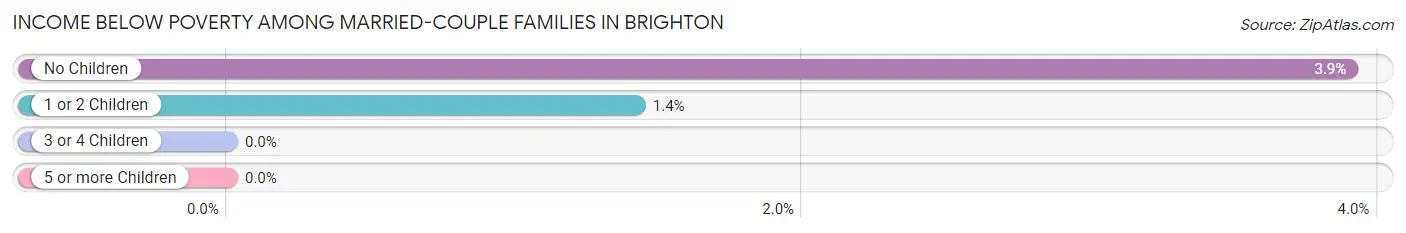
| Children | Above Poverty | Below Poverty |
| No Children | 197 (96.1%) | 8 (3.9%) |
| 1 or 2 Children | 208 (98.6%) | 3 (1.4%) |
| 3 or 4 Children | 63 (100.0%) | 0 (0.0%) |
| 5 or more Children | 15 (100.0%) | 0 (0.0%) |
| Total | 483 (97.8%) | 11 (2.2%) |
Income Below Poverty Among Single-Parent Households in Brighton
According to the poverty data in Brighton, 16.2% or 17 single-father households and 40.9% or 88 single-mother households are living below the poverty line. Among single-father households, those with 1 or 2 children have the highest poverty rate, with 17 households (21.0%) experiencing poverty. Likewise, among single-mother households, those with 1 or 2 children have the highest poverty rate, with 44 households (50.6%) falling below the poverty line.
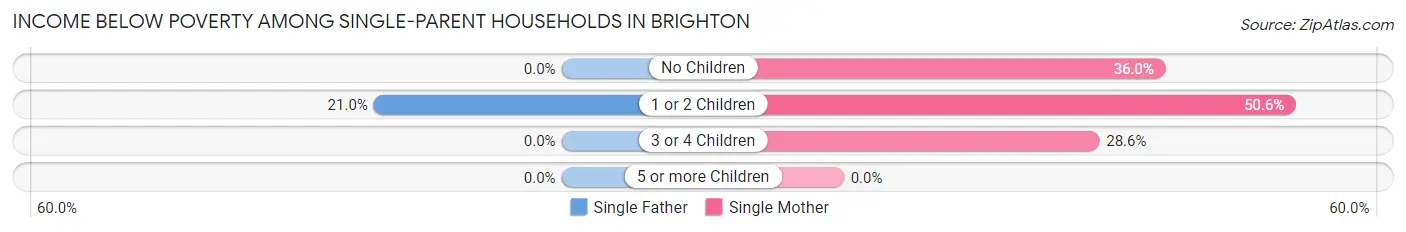
| Children | Single Father | Single Mother |
| No Children | 0 (0.0%) | 36 (36.0%) |
| 1 or 2 Children | 17 (21.0%) | 44 (50.6%) |
| 3 or 4 Children | 0 (0.0%) | 8 (28.6%) |
| 5 or more Children | 0 (0.0%) | 0 (0.0%) |
| Total | 17 (16.2%) | 88 (40.9%) |
Income Below Poverty Among Married-Couple vs Single-Parent Households in Brighton
The poverty data for Brighton shows that 11 of the married-couple family households (2.2%) and 105 of the single-parent households (32.8%) are living below the poverty level. Within the married-couple family households, those with no children have the highest poverty rate, with 8 households (3.9%) falling below the poverty line. Among the single-parent households, those with 1 or 2 children have the highest poverty rate, with 61 household (36.3%) living below poverty.
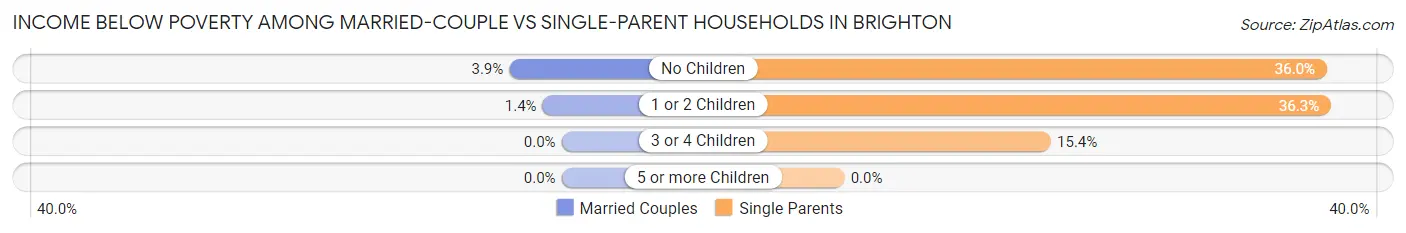
| Children | Married-Couple Families | Single-Parent Households |
| No Children | 8 (3.9%) | 36 (36.0%) |
| 1 or 2 Children | 3 (1.4%) | 61 (36.3%) |
| 3 or 4 Children | 0 (0.0%) | 8 (15.4%) |
| 5 or more Children | 0 (0.0%) | 0 (0.0%) |
| Total | 11 (2.2%) | 105 (32.8%) |
Race in Brighton
The most populous races in Brighton are White / Caucasian (2,268 | 78.8%), Black / African American (540 | 18.8%), and Hispanic or Latino (76 | 2.6%).
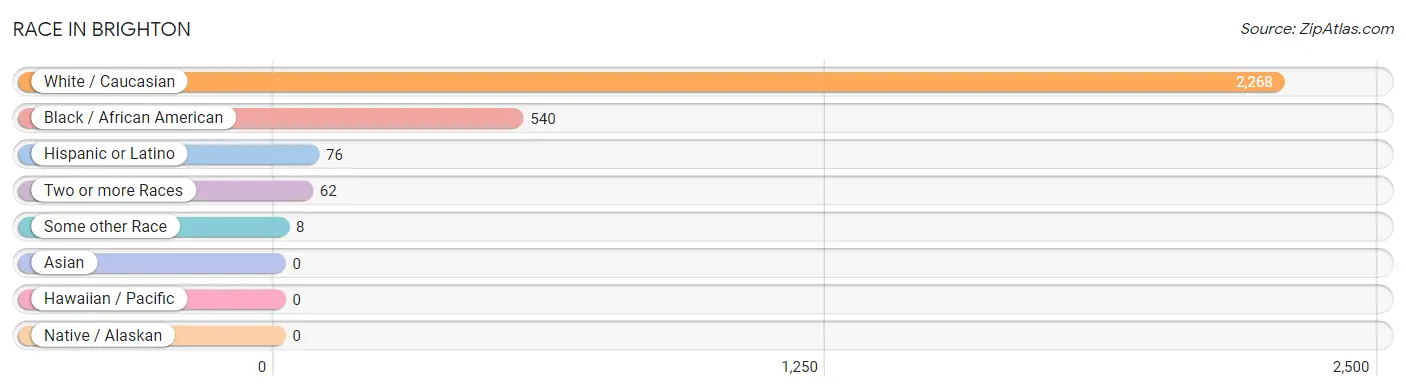
| Race | # Population | % Population |
| Asian | 0 | 0.0% |
| Black / African American | 540 | 18.8% |
| Hawaiian / Pacific | 0 | 0.0% |
| Hispanic or Latino | 76 | 2.6% |
| Native / Alaskan | 0 | 0.0% |
| White / Caucasian | 2,268 | 78.8% |
| Two or more Races | 62 | 2.1% |
| Some other Race | 8 | 0.3% |
| Total | 2,878 | 100.0% |
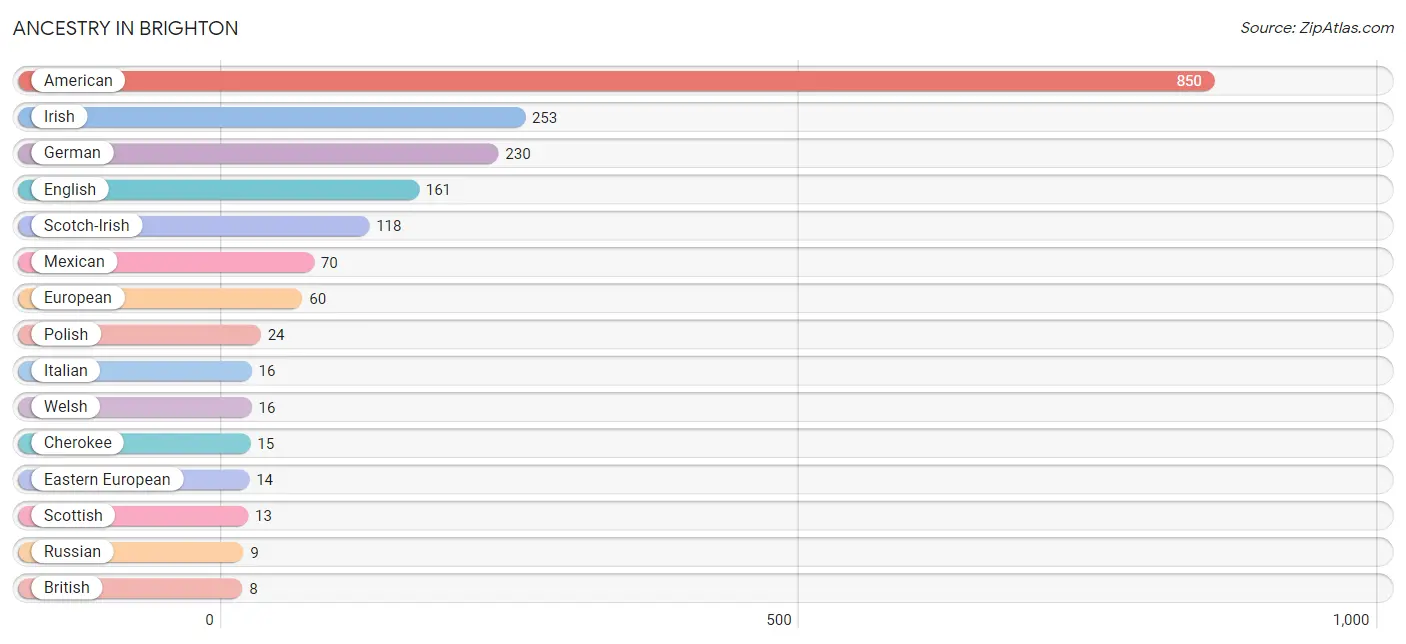
Ancestry in Brighton
The most populous ancestries reported in Brighton are American (850 | 29.5%), Irish (253 | 8.8%), German (230 | 8.0%), English (161 | 5.6%), and Scotch-Irish (118 | 4.1%), together accounting for 56.0% of all Brighton residents.
| Ancestry | # Population | % Population |
| American | 850 | 29.5% |
| Arab | 4 | 0.1% |
| British | 8 | 0.3% |
| Cherokee | 15 | 0.5% |
| Croatian | 3 | 0.1% |
| Dutch | 1 | 0.0% |
| Eastern European | 14 | 0.5% |
| English | 161 | 5.6% |
| European | 60 | 2.1% |
| French | 8 | 0.3% |
| German | 230 | 8.0% |
| Hungarian | 8 | 0.3% |
| Irish | 253 | 8.8% |
| Italian | 16 | 0.6% |
| Lebanese | 4 | 0.1% |
| Mexican | 70 | 2.4% |
| Polish | 24 | 0.8% |
| Russian | 9 | 0.3% |
| Scandinavian | 8 | 0.3% |
| Scotch-Irish | 118 | 4.1% |
| Scottish | 13 | 0.4% |
| Spaniard | 6 | 0.2% |
| Swedish | 7 | 0.2% |
| Welsh | 16 | 0.6% | View All 24 Rows |
Immigrants in Brighton
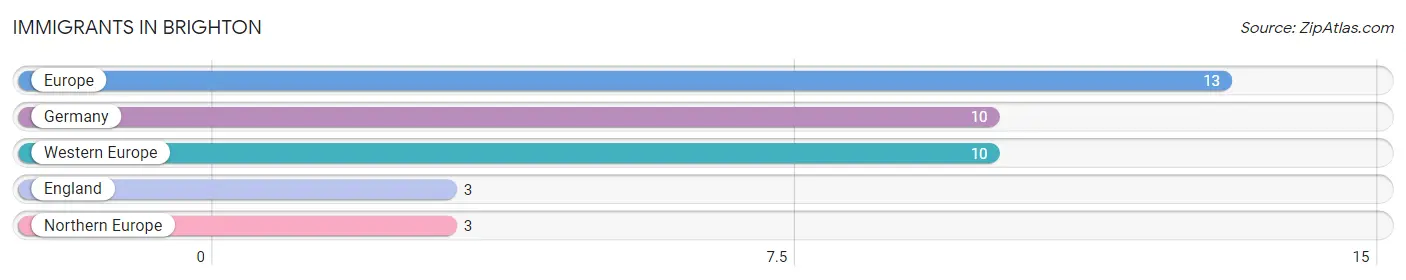
The most numerous immigrant groups reported in Brighton came from Europe (13 | 0.4%), Germany (10 | 0.4%), Western Europe (10 | 0.4%), England (3 | 0.1%), and Northern Europe (3 | 0.1%), together accounting for 1.4% of all Brighton residents.
| Immigration Origin | # Population | % Population |
| England | 3 | 0.1% |
| Europe | 13 | 0.4% |
| Germany | 10 | 0.4% |
| Northern Europe | 3 | 0.1% |
| Western Europe | 10 | 0.4% | View All 5 Rows |
Sex and Age in Brighton
Sex and Age in Brighton
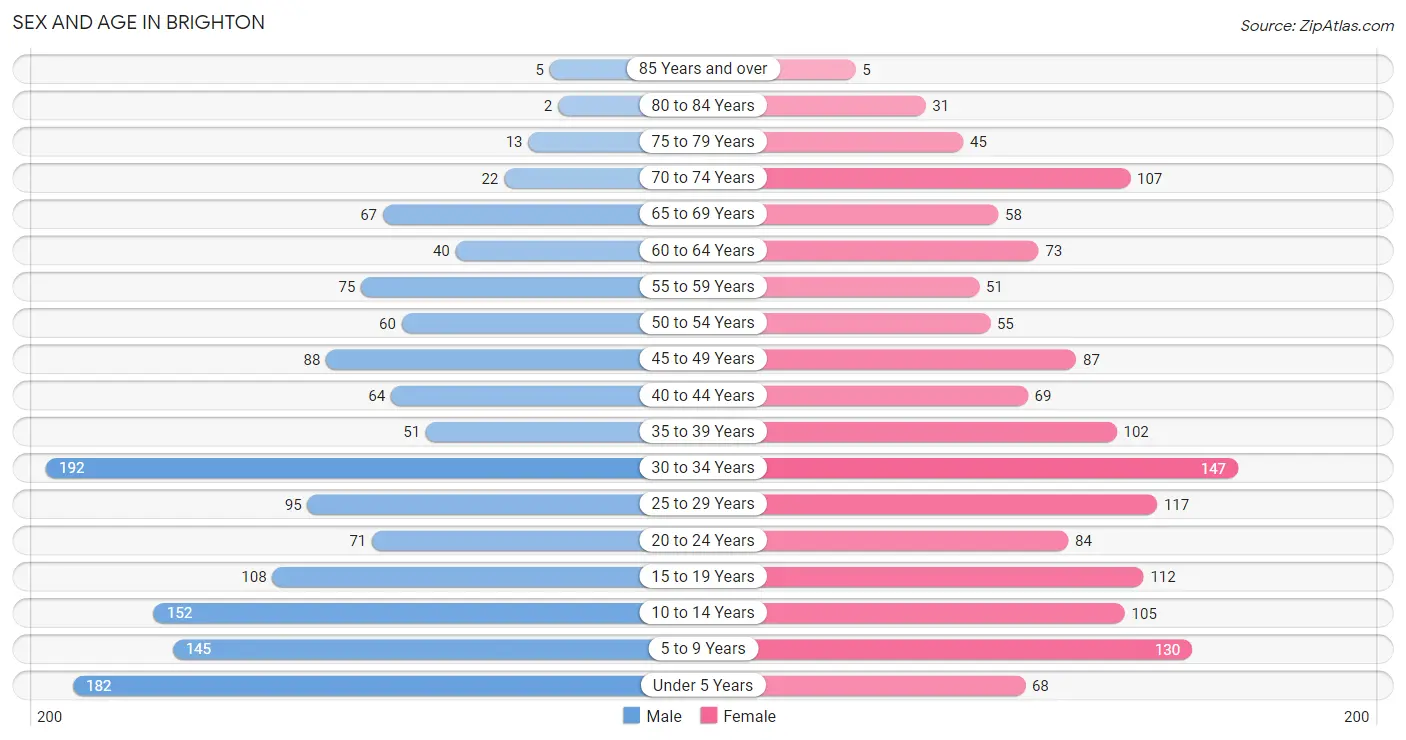
The most populous age groups in Brighton are 30 to 34 Years (192 | 13.4%) for men and 30 to 34 Years (147 | 10.2%) for women.
| Age Bracket | Male | Female |
| Under 5 Years | 182 (12.7%) | 68 (4.7%) |
| 5 to 9 Years | 145 (10.1%) | 130 (9.0%) |
| 10 to 14 Years | 152 (10.6%) | 105 (7.3%) |
| 15 to 19 Years | 108 (7.5%) | 112 (7.7%) |
| 20 to 24 Years | 71 (5.0%) | 84 (5.8%) |
| 25 to 29 Years | 95 (6.6%) | 117 (8.1%) |
| 30 to 34 Years | 192 (13.4%) | 147 (10.2%) |
| 35 to 39 Years | 51 (3.6%) | 102 (7.0%) |
| 40 to 44 Years | 64 (4.5%) | 69 (4.8%) |
| 45 to 49 Years | 88 (6.1%) | 87 (6.0%) |
| 50 to 54 Years | 60 (4.2%) | 55 (3.8%) |
| 55 to 59 Years | 75 (5.2%) | 51 (3.5%) |
| 60 to 64 Years | 40 (2.8%) | 73 (5.1%) |
| 65 to 69 Years | 67 (4.7%) | 58 (4.0%) |
| 70 to 74 Years | 22 (1.5%) | 107 (7.4%) |
| 75 to 79 Years | 13 (0.9%) | 45 (3.1%) |
| 80 to 84 Years | 2 (0.1%) | 31 (2.1%) |
| 85 Years and over | 5 (0.4%) | 5 (0.4%) |
| Total | 1,432 (100.0%) | 1,446 (100.0%) |
Families and Households in Brighton
Median Family Size in Brighton
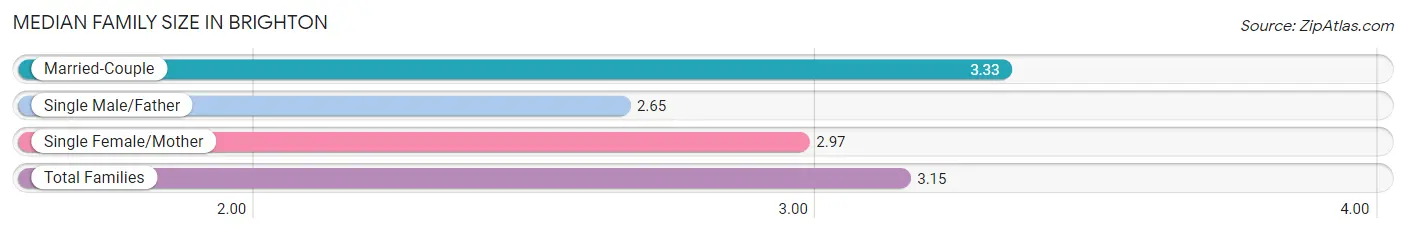
The median family size in Brighton is 3.15 persons per family, with married-couple families (494 | 60.7%) accounting for the largest median family size of 3.33 persons per family. On the other hand, single male/father families (105 | 12.9%) represent the smallest median family size with 2.65 persons per family.
| Family Type | # Families | Family Size |
| Married-Couple | 494 (60.7%) | 3.33 |
| Single Male/Father | 105 (12.9%) | 2.65 |
| Single Female/Mother | 215 (26.4%) | 2.97 |
| Total Families | 814 (100.0%) | 3.15 |
Median Household Size in Brighton
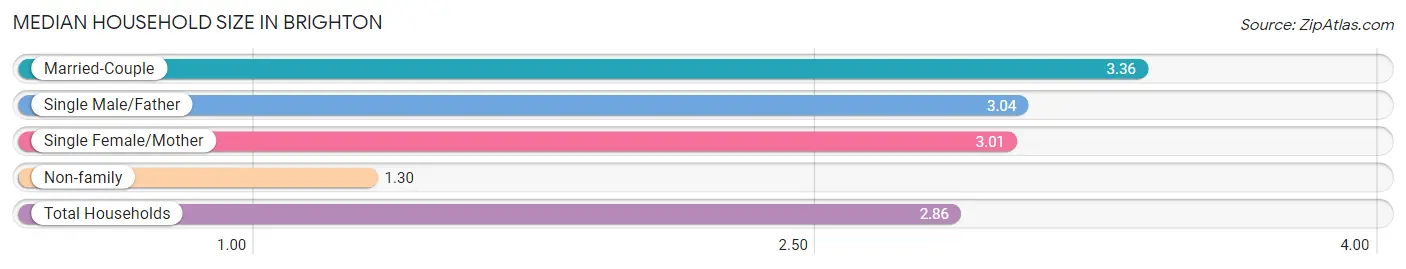
The median household size in Brighton is 2.86 persons per household, with married-couple households (494 | 49.1%) accounting for the largest median household size of 3.36 persons per household. non-family households (191 | 19.0%) represent the smallest median household size with 1.30 persons per household.
| Household Type | # Households | Household Size |
| Married-Couple | 494 (49.1%) | 3.36 |
| Single Male/Father | 105 (10.4%) | 3.04 |
| Single Female/Mother | 215 (21.4%) | 3.01 |
| Non-family | 191 (19.0%) | 1.30 |
| Total Households | 1,005 (100.0%) | 2.86 |
Household Size by Marriage Status in Brighton
Out of a total of 1,005 households in Brighton, 814 (81.0%) are family households, while 191 (19.0%) are nonfamily households. The most numerous type of family households are 3-person households, comprising 322, and the most common type of nonfamily households are 1-person households, comprising 153.
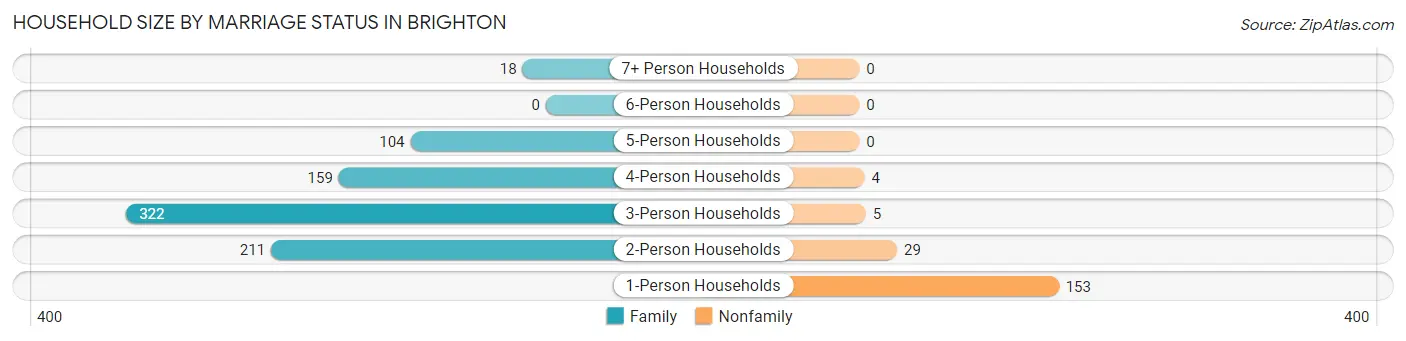
| Household Size | Family Households | Nonfamily Households |
| 1-Person Households | - | 153 (15.2%) |
| 2-Person Households | 211 (21.0%) | 29 (2.9%) |
| 3-Person Households | 322 (32.0%) | 5 (0.5%) |
| 4-Person Households | 159 (15.8%) | 4 (0.4%) |
| 5-Person Households | 104 (10.3%) | 0 (0.0%) |
| 6-Person Households | 0 (0.0%) | 0 (0.0%) |
| 7+ Person Households | 18 (1.8%) | 0 (0.0%) |
| Total | 814 (81.0%) | 191 (19.0%) |
Female Fertility in Brighton
Fertility by Age in Brighton
Average fertility rate in Brighton is 80.0 births per 1,000 women. Women in the age bracket of 20 to 34 years have the highest fertility rate with 155.0 births per 1,000 women. Women in the age bracket of 20 to 34 years acount for 91.5% of all women with births.
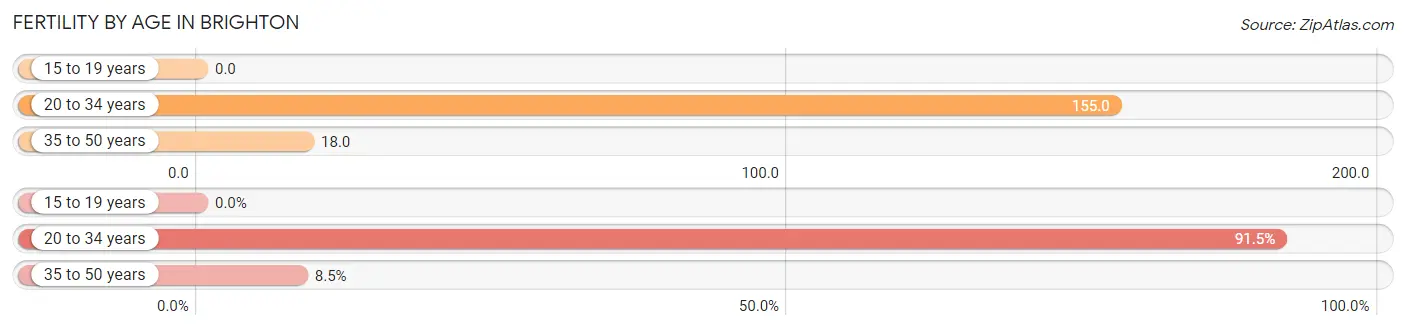
| Age Bracket | Women with Births | Births / 1,000 Women |
| 15 to 19 years | 0 (0.0%) | 0.0 |
| 20 to 34 years | 54 (91.5%) | 155.0 |
| 35 to 50 years | 5 (8.5%) | 18.0 |
| Total | 59 (100.0%) | 80.0 |
Fertility by Age by Marriage Status in Brighton
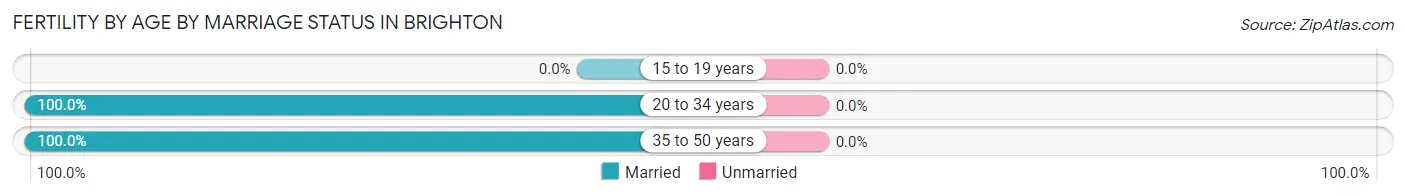
| Age Bracket | Married | Unmarried |
| 15 to 19 years | 0 (0.0%) | 0 (0.0%) |
| 20 to 34 years | 54 (100.0%) | 0 (0.0%) |
| 35 to 50 years | 5 (100.0%) | 0 (0.0%) |
| Total | 59 (100.0%) | 0 (0.0%) |
Fertility by Education in Brighton
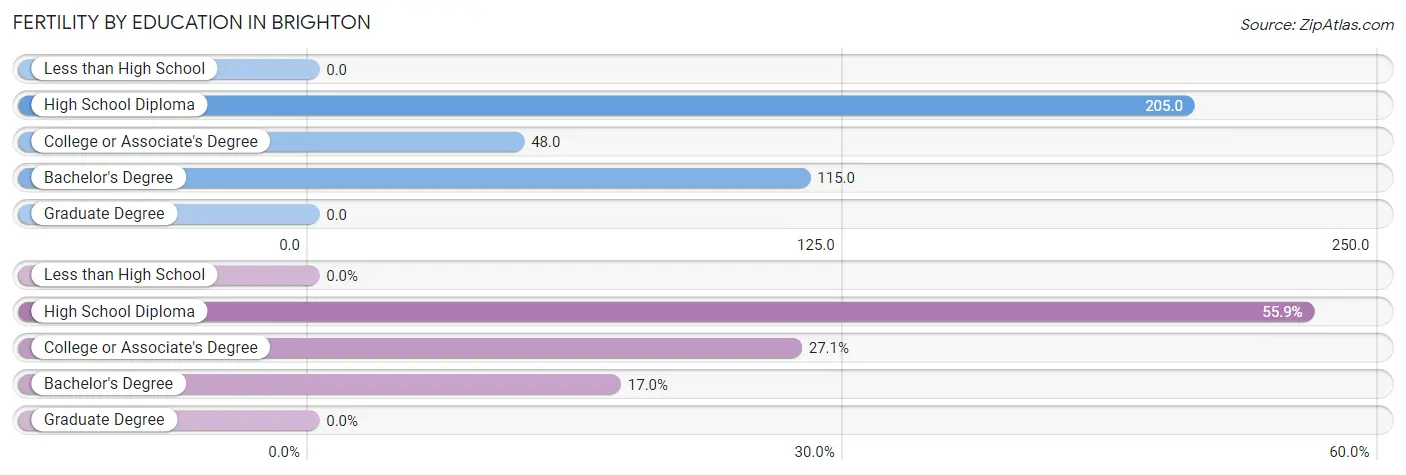
| Educational Attainment | Women with Births | Births / 1,000 Women |
| Less than High School | 0 (0.0%) | 0.0 |
| High School Diploma | 33 (55.9%) | 205.0 |
| College or Associate's Degree | 16 (27.1%) | 48.0 |
| Bachelor's Degree | 10 (17.0%) | 115.0 |
| Graduate Degree | 0 (0.0%) | 0.0 |
| Total | 59 (100.0%) | 80.0 |
Fertility by Education by Marriage Status in Brighton
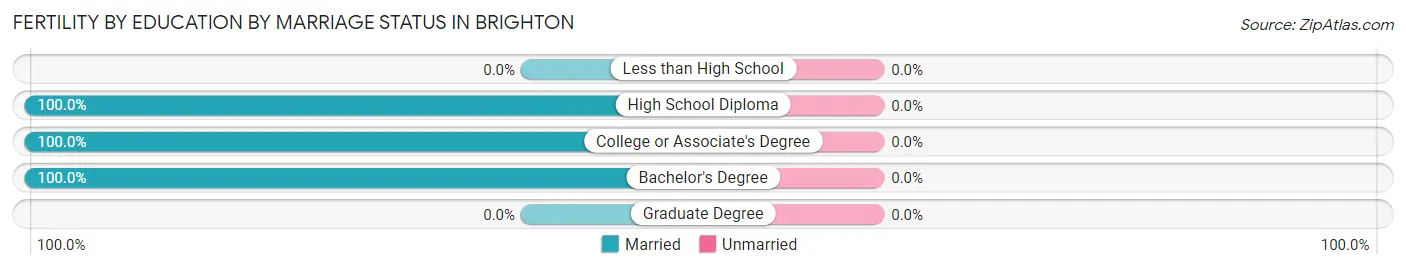
| Educational Attainment | Married | Unmarried |
| Less than High School | 0 (0.0%) | 0 (0.0%) |
| High School Diploma | 33 (100.0%) | 0 (0.0%) |
| College or Associate's Degree | 16 (100.0%) | 0 (0.0%) |
| Bachelor's Degree | 10 (100.0%) | 0 (0.0%) |
| Graduate Degree | 0 (0.0%) | 0 (0.0%) |
| Total | 59 (100.0%) | 0 (0.0%) |
Employment Characteristics in Brighton
Employment by Class of Employer in Brighton
Among the 1,384 employed individuals in Brighton, private company employees (990 | 71.5%), not-for-profit organizations (129 | 9.3%), and federal government employees (108 | 7.8%) make up the most common classes of employment.
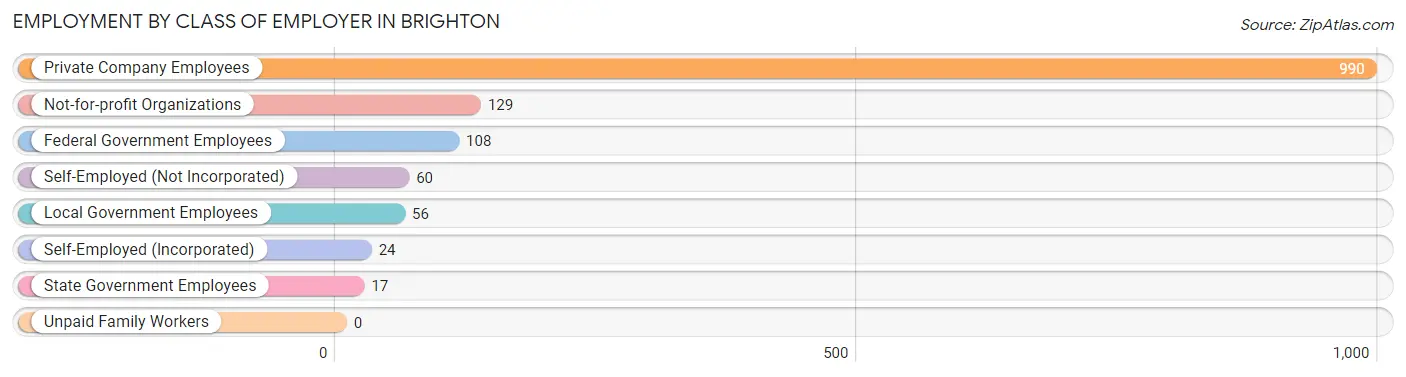
| Employer Class | # Employees | % Employees |
| Private Company Employees | 990 | 71.5% |
| Self-Employed (Incorporated) | 24 | 1.7% |
| Self-Employed (Not Incorporated) | 60 | 4.3% |
| Not-for-profit Organizations | 129 | 9.3% |
| Local Government Employees | 56 | 4.1% |
| State Government Employees | 17 | 1.2% |
| Federal Government Employees | 108 | 7.8% |
| Unpaid Family Workers | 0 | 0.0% |
| Total | 1,384 | 100.0% |
Employment Status by Age in Brighton
According to the labor force statistics for Brighton, out of the total population over 16 years of age (2,066), 71.0% or 1,467 individuals are in the labor force, with 4.8% or 70 of them unemployed. The age group with the highest labor force participation rate is 30 to 34 years, with 100.0% or 339 individuals in the labor force. Within the labor force, the 65 to 74 years age range has the highest percentage of unemployed individuals, with 11.4% or 15 of them being unemployed.
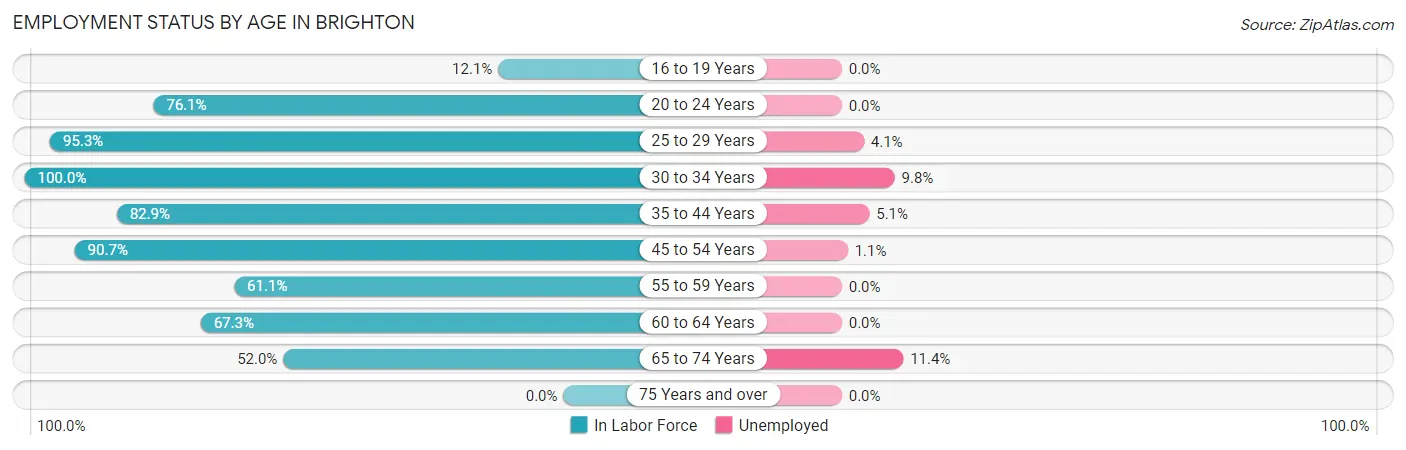
| Age Bracket | In Labor Force | Unemployed |
| 16 to 19 Years | 23 (12.1%) | 0 (0.0%) |
| 20 to 24 Years | 118 (76.1%) | 0 (0.0%) |
| 25 to 29 Years | 202 (95.3%) | 8 (4.1%) |
| 30 to 34 Years | 339 (100.0%) | 33 (9.8%) |
| 35 to 44 Years | 237 (82.9%) | 12 (5.1%) |
| 45 to 54 Years | 263 (90.7%) | 3 (1.1%) |
| 55 to 59 Years | 77 (61.1%) | 0 (0.0%) |
| 60 to 64 Years | 76 (67.3%) | 0 (0.0%) |
| 65 to 74 Years | 132 (52.0%) | 15 (11.4%) |
| 75 Years and over | 0 (0.0%) | 0 (0.0%) |
| Total | 1,467 (71.0%) | 70 (4.8%) |
Employment Status by Educational Attainment in Brighton
According to labor force statistics for Brighton, 87.4% of individuals (1,194) out of the total population between 25 and 64 years of age (1,366) are in the labor force, with 4.7% or 56 of them being unemployed. The group with the highest labor force participation rate are those with the educational attainment of college / associate degree, with 94.9% or 502 individuals in the labor force. Within the labor force, individuals with less than high school education have the highest percentage of unemployment, with 10.3% or 3 of them being unemployed.
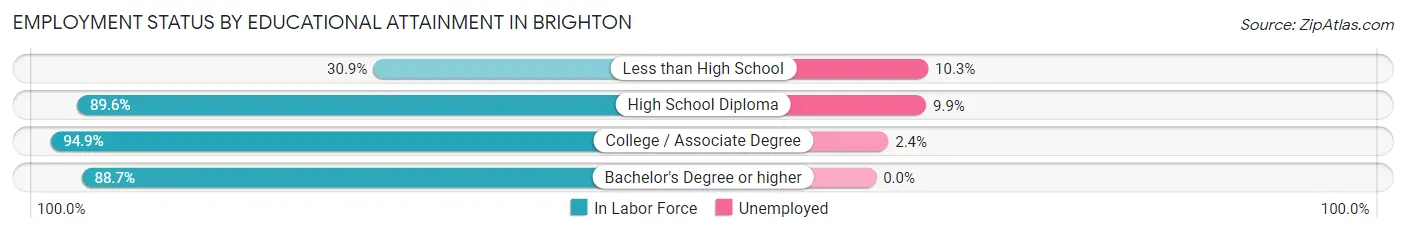
| Educational Attainment | In Labor Force | Unemployed |
| Less than High School | 29 (30.9%) | 10 (10.3%) |
| High School Diploma | 420 (89.6%) | 46 (9.9%) |
| College / Associate Degree | 502 (94.9%) | 13 (2.4%) |
| Bachelor's Degree or higher | 243 (88.7%) | 0 (0.0%) |
| Total | 1,194 (87.4%) | 64 (4.7%) |
Employment Occupations by Sex in Brighton
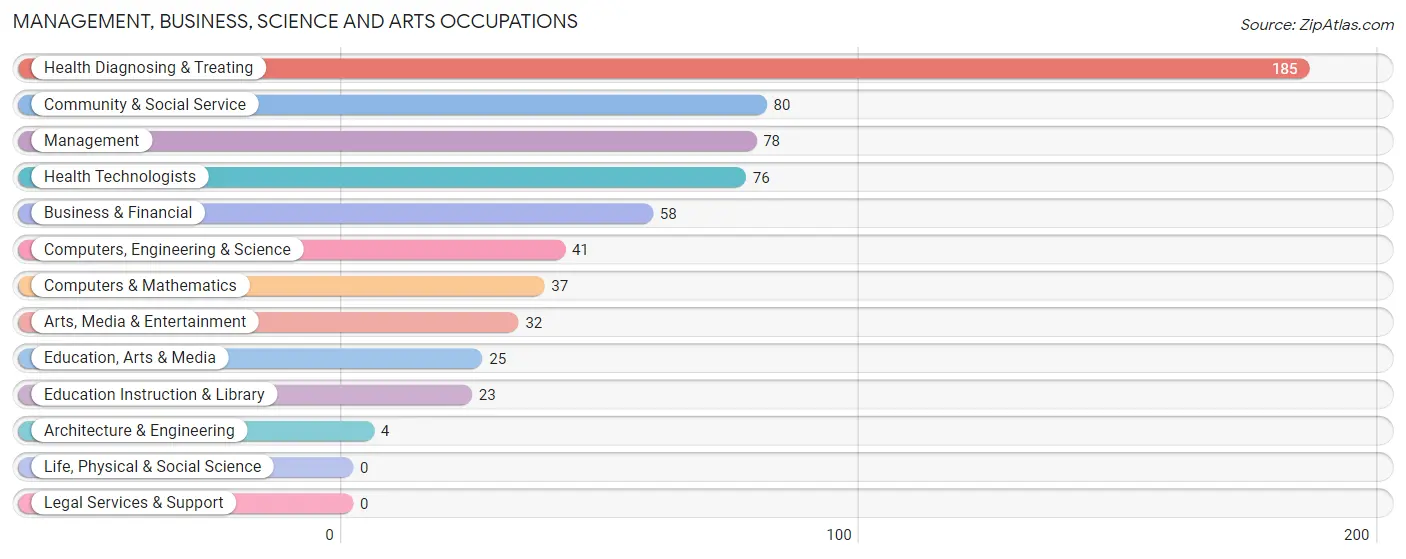
Management, Business, Science and Arts Occupations
The most common Management, Business, Science and Arts occupations in Brighton are Health Diagnosing & Treating (185 | 13.5%), Community & Social Service (80 | 5.8%), Management (78 | 5.7%), Health Technologists (76 | 5.5%), and Business & Financial (58 | 4.2%).
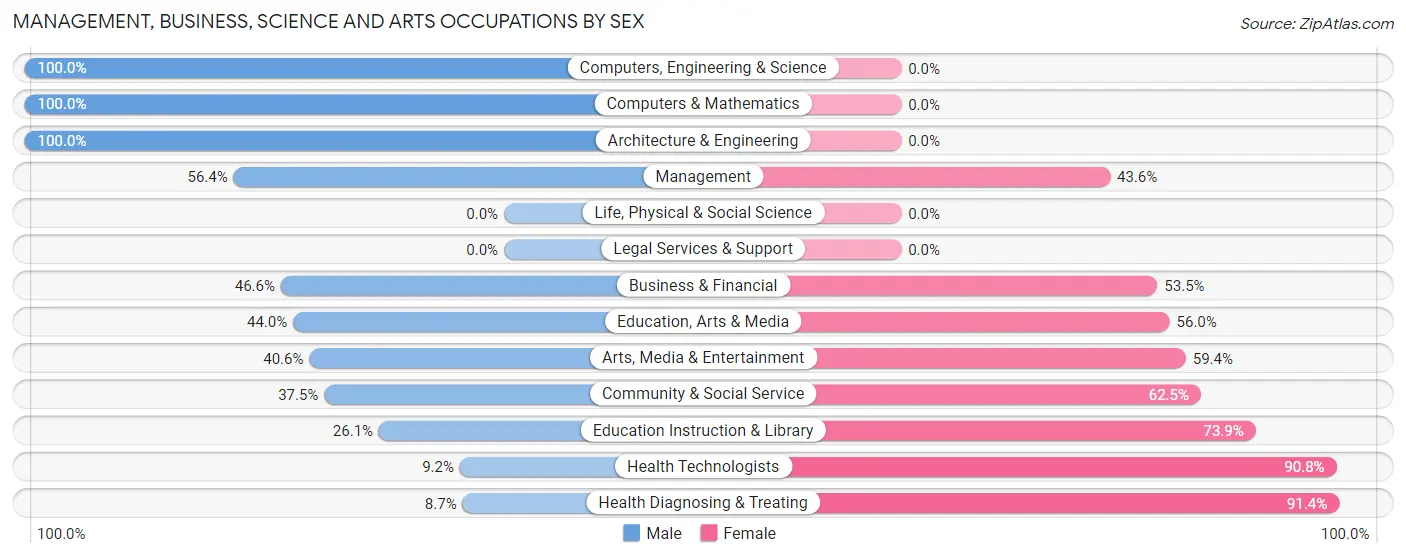
Management, Business, Science and Arts Occupations by Sex
Within the Management, Business, Science and Arts occupations in Brighton, the most male-oriented occupations are Computers, Engineering & Science (100.0%), Computers & Mathematics (100.0%), and Architecture & Engineering (100.0%), while the most female-oriented occupations are Health Diagnosing & Treating (91.3%), Health Technologists (90.8%), and Education Instruction & Library (73.9%).
| Occupation | Male | Female |
| Management | 44 (56.4%) | 34 (43.6%) |
| Business & Financial | 27 (46.6%) | 31 (53.4%) |
| Computers, Engineering & Science | 41 (100.0%) | 0 (0.0%) |
| Computers & Mathematics | 37 (100.0%) | 0 (0.0%) |
| Architecture & Engineering | 4 (100.0%) | 0 (0.0%) |
| Life, Physical & Social Science | 0 (0.0%) | 0 (0.0%) |
| Community & Social Service | 30 (37.5%) | 50 (62.5%) |
| Education, Arts & Media | 11 (44.0%) | 14 (56.0%) |
| Legal Services & Support | 0 (0.0%) | 0 (0.0%) |
| Education Instruction & Library | 6 (26.1%) | 17 (73.9%) |
| Arts, Media & Entertainment | 13 (40.6%) | 19 (59.4%) |
| Health Diagnosing & Treating | 16 (8.6%) | 169 (91.3%) |
| Health Technologists | 7 (9.2%) | 69 (90.8%) |
| Total (Category) | 158 (35.7%) | 284 (64.2%) |
| Total (Overall) | 663 (48.2%) | 712 (51.8%) |
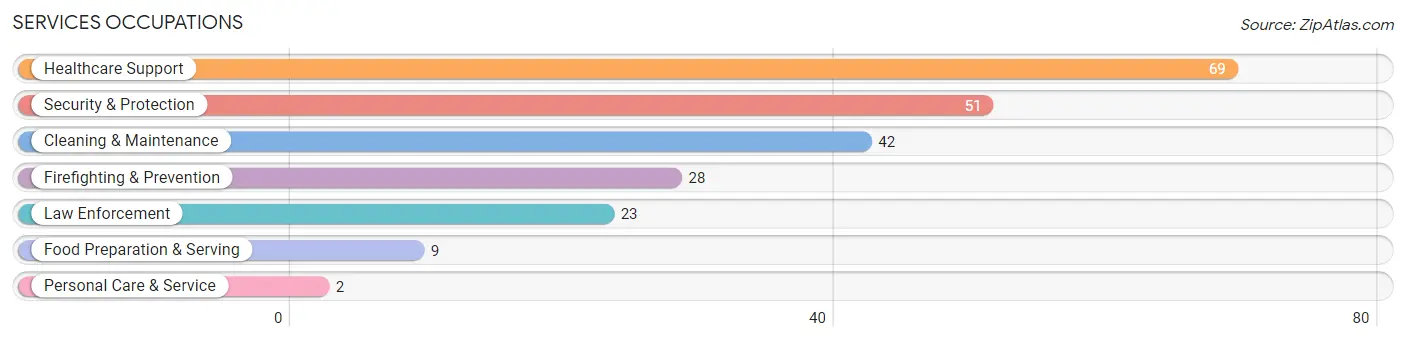
Services Occupations
The most common Services occupations in Brighton are Healthcare Support (69 | 5.0%), Security & Protection (51 | 3.7%), Cleaning & Maintenance (42 | 3.0%), Firefighting & Prevention (28 | 2.0%), and Law Enforcement (23 | 1.7%).
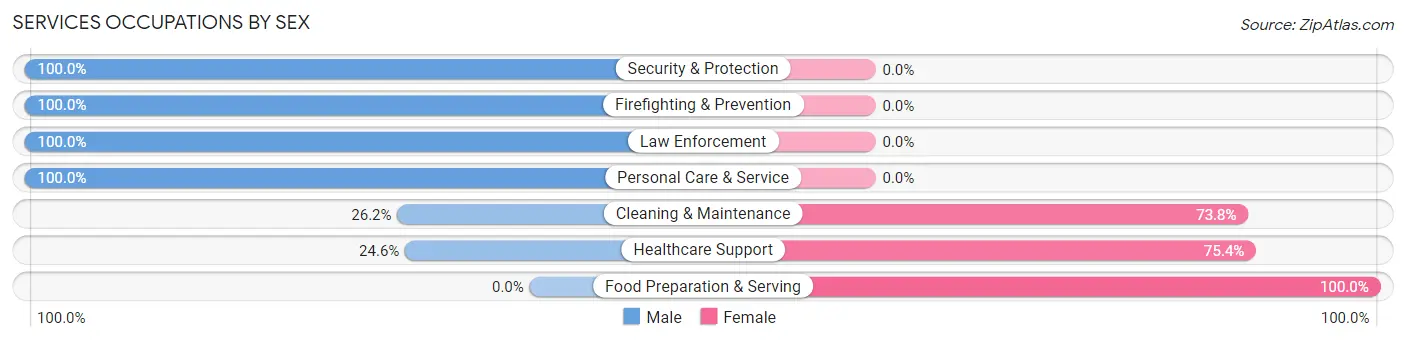
Services Occupations by Sex
Within the Services occupations in Brighton, the most male-oriented occupations are Security & Protection (100.0%), Firefighting & Prevention (100.0%), and Law Enforcement (100.0%), while the most female-oriented occupations are Food Preparation & Serving (100.0%), Healthcare Support (75.4%), and Cleaning & Maintenance (73.8%).
| Occupation | Male | Female |
| Healthcare Support | 17 (24.6%) | 52 (75.4%) |
| Security & Protection | 51 (100.0%) | 0 (0.0%) |
| Firefighting & Prevention | 28 (100.0%) | 0 (0.0%) |
| Law Enforcement | 23 (100.0%) | 0 (0.0%) |
| Food Preparation & Serving | 0 (0.0%) | 9 (100.0%) |
| Cleaning & Maintenance | 11 (26.2%) | 31 (73.8%) |
| Personal Care & Service | 2 (100.0%) | 0 (0.0%) |
| Total (Category) | 81 (46.8%) | 92 (53.2%) |
| Total (Overall) | 663 (48.2%) | 712 (51.8%) |
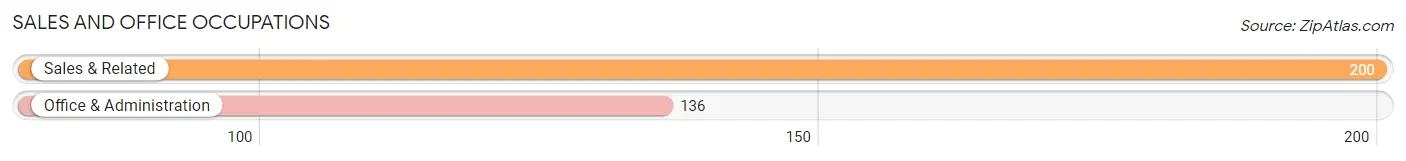
Sales and Office Occupations
The most common Sales and Office occupations in Brighton are Sales & Related (200 | 14.5%), and Office & Administration (136 | 9.9%).
Sales and Office Occupations by Sex
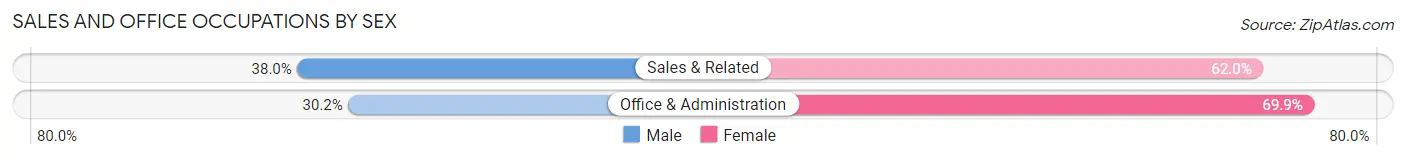
| Occupation | Male | Female |
| Sales & Related | 76 (38.0%) | 124 (62.0%) |
| Office & Administration | 41 (30.1%) | 95 (69.9%) |
| Total (Category) | 117 (34.8%) | 219 (65.2%) |
| Total (Overall) | 663 (48.2%) | 712 (51.8%) |
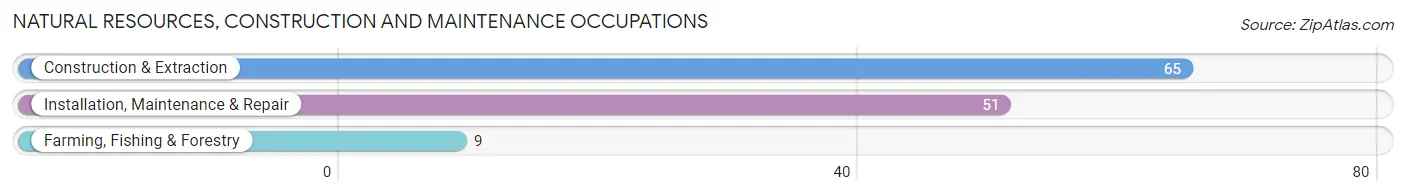
Natural Resources, Construction and Maintenance Occupations
The most common Natural Resources, Construction and Maintenance occupations in Brighton are Construction & Extraction (65 | 4.7%), Installation, Maintenance & Repair (51 | 3.7%), and Farming, Fishing & Forestry (9 | 0.6%).
Natural Resources, Construction and Maintenance Occupations by Sex
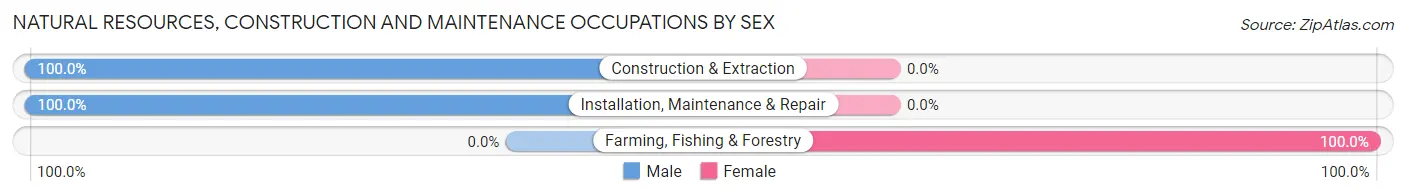
| Occupation | Male | Female |
| Farming, Fishing & Forestry | 0 (0.0%) | 9 (100.0%) |
| Construction & Extraction | 65 (100.0%) | 0 (0.0%) |
| Installation, Maintenance & Repair | 51 (100.0%) | 0 (0.0%) |
| Total (Category) | 116 (92.8%) | 9 (7.2%) |
| Total (Overall) | 663 (48.2%) | 712 (51.8%) |
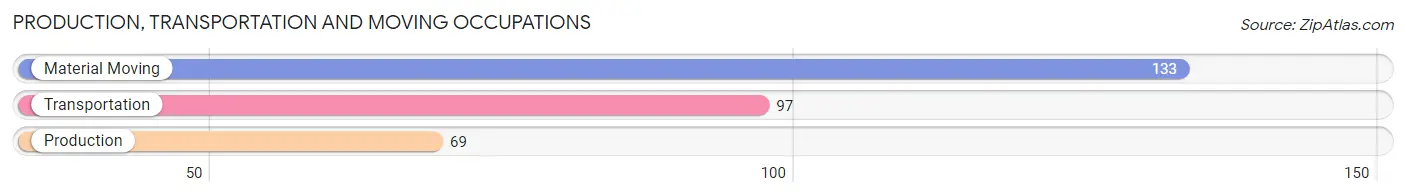
Production, Transportation and Moving Occupations
The most common Production, Transportation and Moving occupations in Brighton are Material Moving (133 | 9.7%), Transportation (97 | 7.0%), and Production (69 | 5.0%).
Production, Transportation and Moving Occupations by Sex
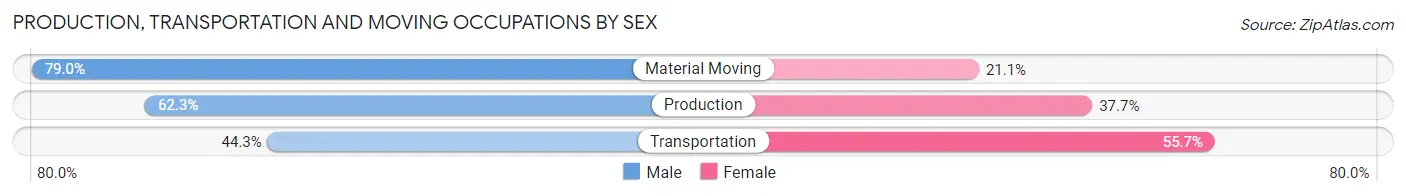
| Occupation | Male | Female |
| Production | 43 (62.3%) | 26 (37.7%) |
| Transportation | 43 (44.3%) | 54 (55.7%) |
| Material Moving | 105 (78.9%) | 28 (21.0%) |
| Total (Category) | 191 (63.9%) | 108 (36.1%) |
| Total (Overall) | 663 (48.2%) | 712 (51.8%) |
Employment Industries by Sex in Brighton
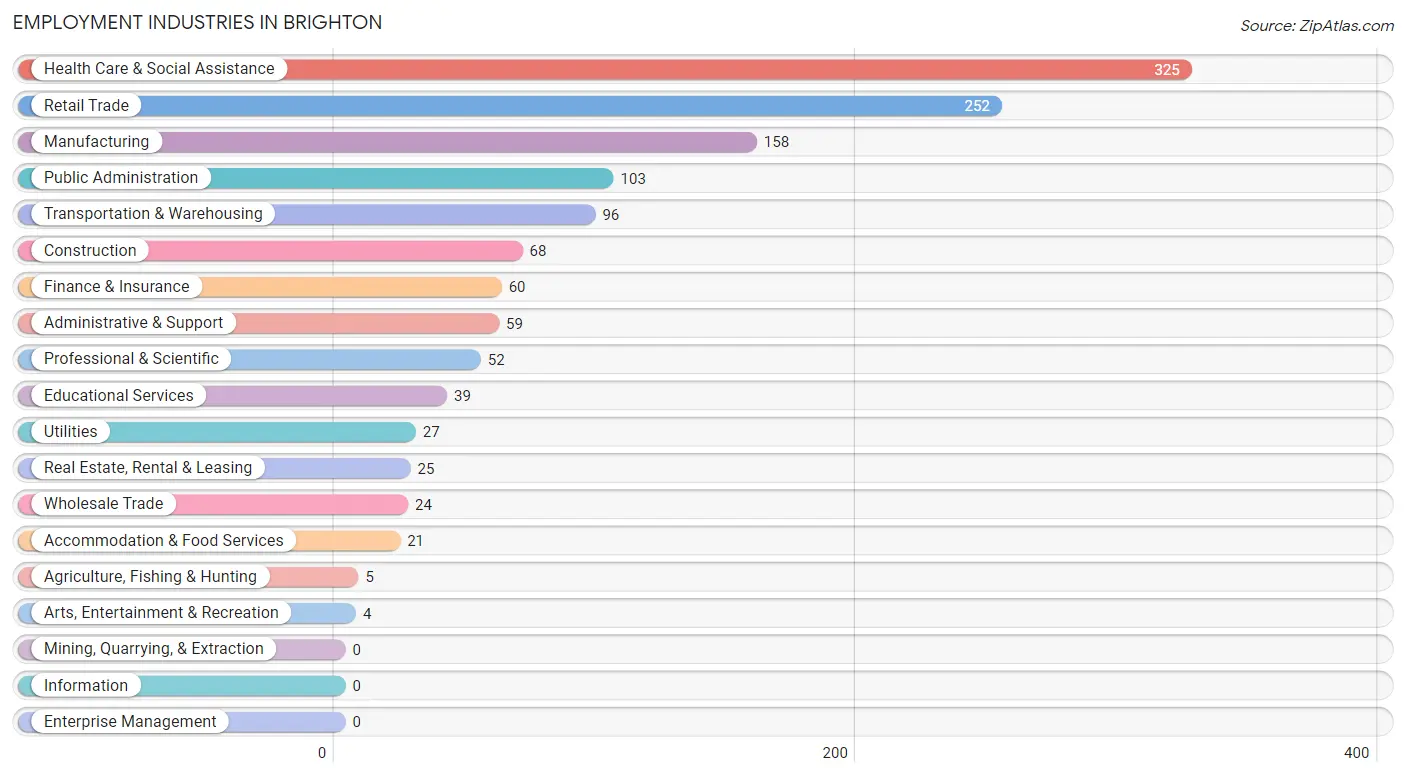
Employment Industries in Brighton
The major employment industries in Brighton include Health Care & Social Assistance (325 | 23.6%), Retail Trade (252 | 18.3%), Manufacturing (158 | 11.5%), Public Administration (103 | 7.5%), and Transportation & Warehousing (96 | 7.0%).
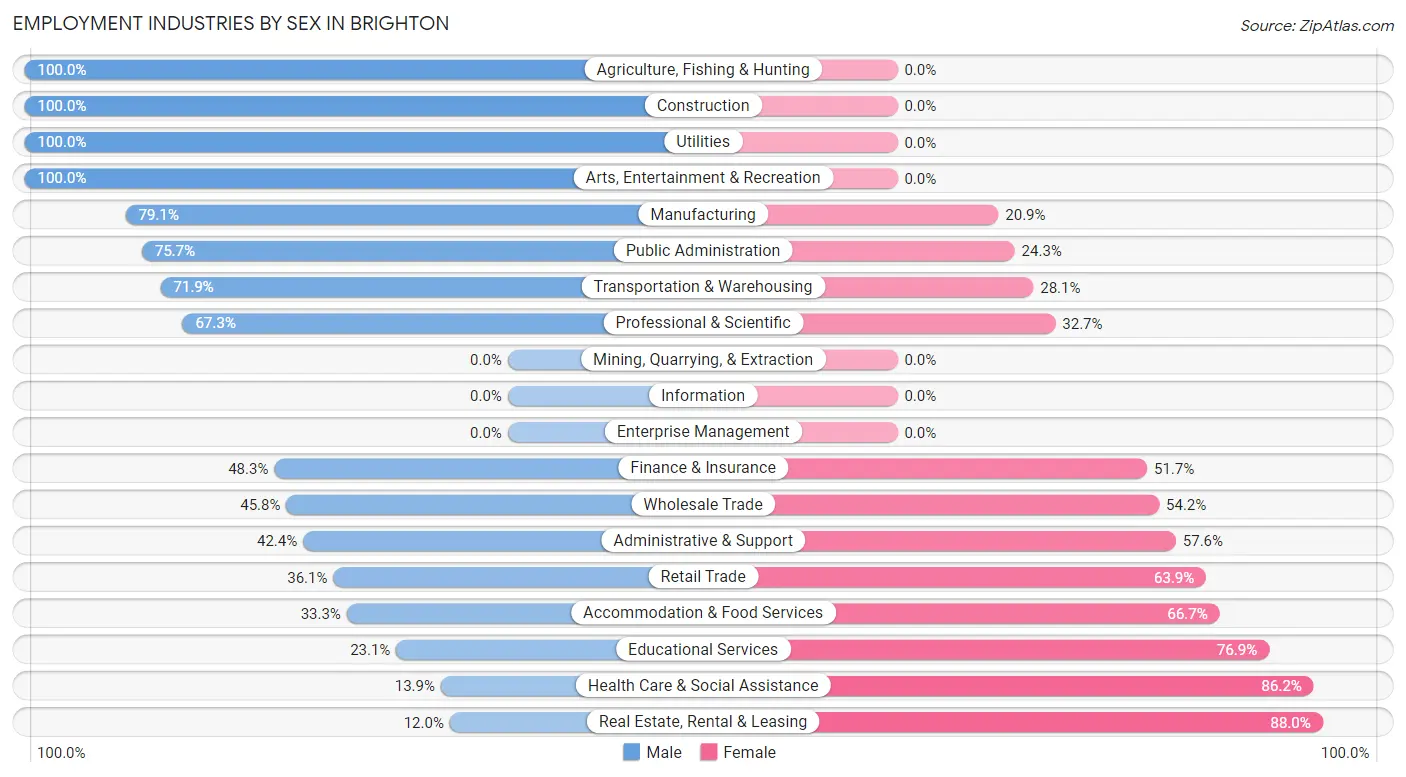
Employment Industries by Sex in Brighton
The Brighton industries that see more men than women are Agriculture, Fishing & Hunting (100.0%), Construction (100.0%), and Utilities (100.0%), whereas the industries that tend to have a higher number of women are Real Estate, Rental & Leasing (88.0%), Health Care & Social Assistance (86.2%), and Educational Services (76.9%).
| Industry | Male | Female |
| Agriculture, Fishing & Hunting | 5 (100.0%) | 0 (0.0%) |
| Mining, Quarrying, & Extraction | 0 (0.0%) | 0 (0.0%) |
| Construction | 68 (100.0%) | 0 (0.0%) |
| Manufacturing | 125 (79.1%) | 33 (20.9%) |
| Wholesale Trade | 11 (45.8%) | 13 (54.2%) |
| Retail Trade | 91 (36.1%) | 161 (63.9%) |
| Transportation & Warehousing | 69 (71.9%) | 27 (28.1%) |
| Utilities | 27 (100.0%) | 0 (0.0%) |
| Information | 0 (0.0%) | 0 (0.0%) |
| Finance & Insurance | 29 (48.3%) | 31 (51.7%) |
| Real Estate, Rental & Leasing | 3 (12.0%) | 22 (88.0%) |
| Professional & Scientific | 35 (67.3%) | 17 (32.7%) |
| Enterprise Management | 0 (0.0%) | 0 (0.0%) |
| Administrative & Support | 25 (42.4%) | 34 (57.6%) |
| Educational Services | 9 (23.1%) | 30 (76.9%) |
| Health Care & Social Assistance | 45 (13.9%) | 280 (86.2%) |
| Arts, Entertainment & Recreation | 4 (100.0%) | 0 (0.0%) |
| Accommodation & Food Services | 7 (33.3%) | 14 (66.7%) |
| Public Administration | 78 (75.7%) | 25 (24.3%) |
| Total | 663 (48.2%) | 712 (51.8%) |
Education in Brighton
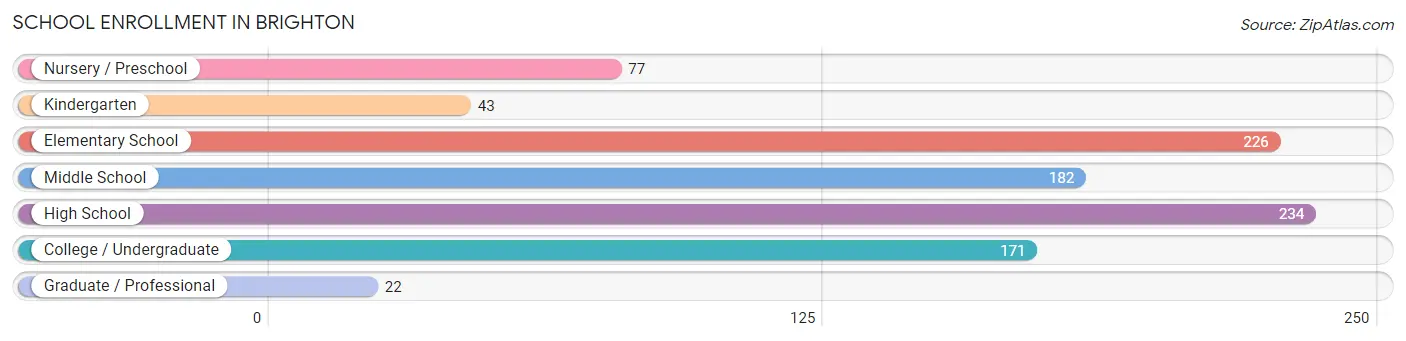
School Enrollment in Brighton
The most common levels of schooling among the 955 students in Brighton are high school (234 | 24.5%), elementary school (226 | 23.7%), and middle school (182 | 19.1%).
| School Level | # Students | % Students |
| Nursery / Preschool | 77 | 8.1% |
| Kindergarten | 43 | 4.5% |
| Elementary School | 226 | 23.7% |
| Middle School | 182 | 19.1% |
| High School | 234 | 24.5% |
| College / Undergraduate | 171 | 17.9% |
| Graduate / Professional | 22 | 2.3% |
| Total | 955 | 100.0% |
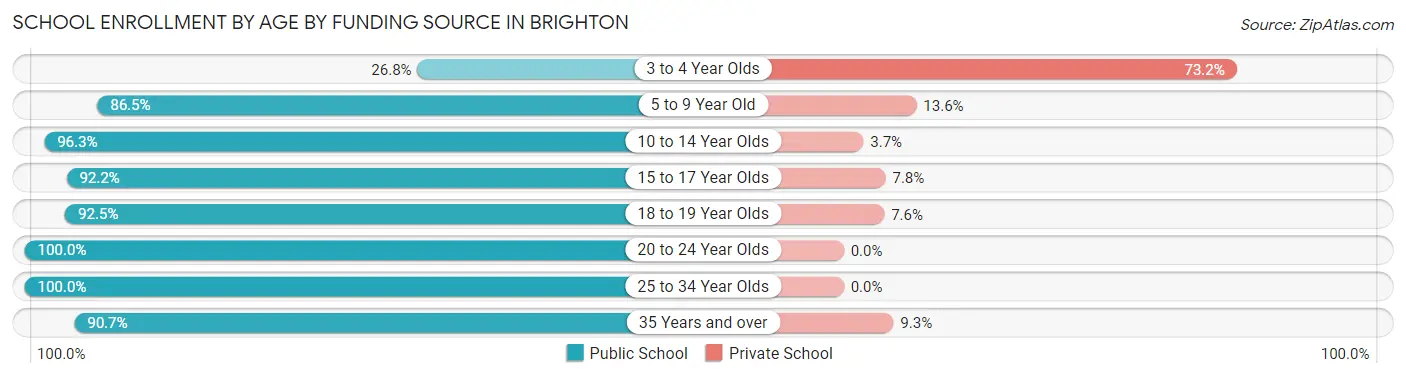
School Enrollment by Age by Funding Source in Brighton
Out of a total of 955 students who are enrolled in schools in Brighton, 123 (12.9%) attend a private institution, while the remaining 832 (87.1%) are enrolled in public schools. The age group of 3 to 4 year olds has the highest likelihood of being enrolled in private schools, with 60 (73.2% in the age bracket) enrolled. Conversely, the age group of 20 to 24 year olds has the lowest likelihood of being enrolled in a private school, with 112 (100.0% in the age bracket) attending a public institution.
| Age Bracket | Public School | Private School |
| 3 to 4 Year Olds | 22 (26.8%) | 60 (73.2%) |
| 5 to 9 Year Old | 217 (86.5%) | 34 (13.6%) |
| 10 to 14 Year Olds | 237 (96.3%) | 9 (3.7%) |
| 15 to 17 Year Olds | 130 (92.2%) | 11 (7.8%) |
| 18 to 19 Year Olds | 49 (92.4%) | 4 (7.5%) |
| 20 to 24 Year Olds | 112 (100.0%) | 0 (0.0%) |
| 25 to 34 Year Olds | 16 (100.0%) | 0 (0.0%) |
| 35 Years and over | 49 (90.7%) | 5 (9.3%) |
| Total | 832 (87.1%) | 123 (12.9%) |
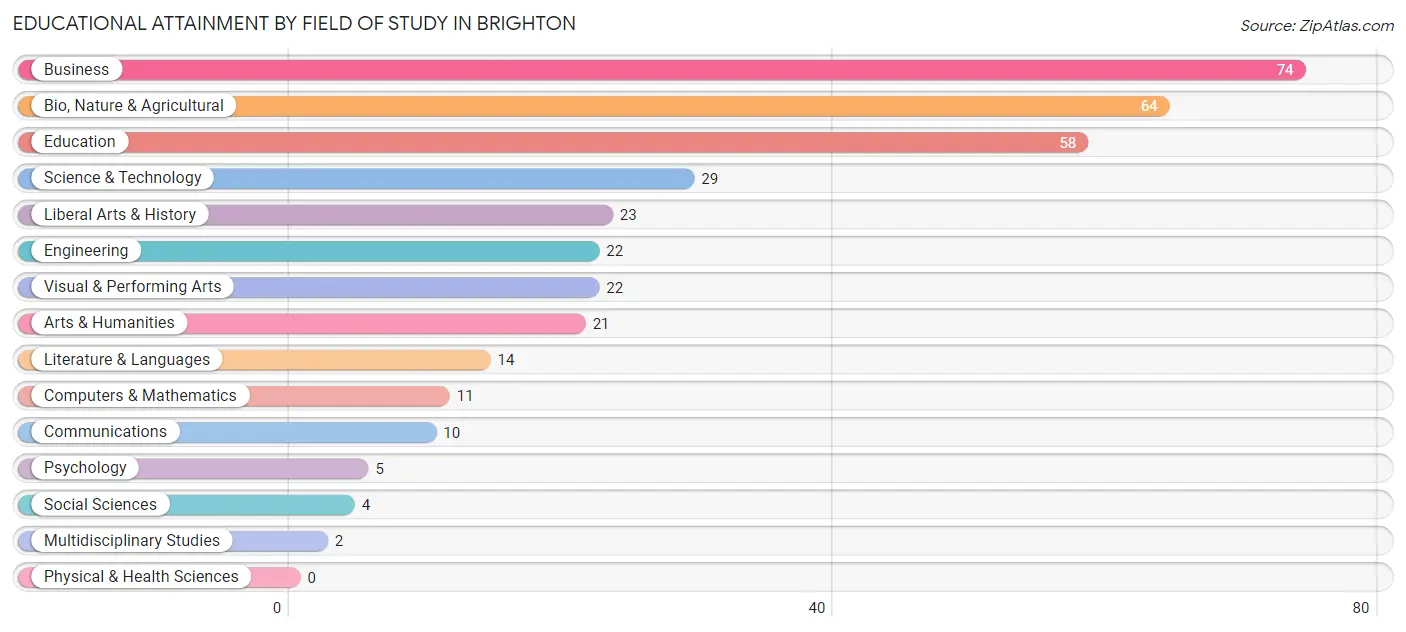
Educational Attainment by Field of Study in Brighton
Business (74 | 20.6%), bio, nature & agricultural (64 | 17.8%), education (58 | 16.2%), science & technology (29 | 8.1%), and liberal arts & history (23 | 6.4%) are the most common fields of study among 359 individuals in Brighton who have obtained a bachelor's degree or higher.
| Field of Study | # Graduates | % Graduates |
| Computers & Mathematics | 11 | 3.1% |
| Bio, Nature & Agricultural | 64 | 17.8% |
| Physical & Health Sciences | 0 | 0.0% |
| Psychology | 5 | 1.4% |
| Social Sciences | 4 | 1.1% |
| Engineering | 22 | 6.1% |
| Multidisciplinary Studies | 2 | 0.6% |
| Science & Technology | 29 | 8.1% |
| Business | 74 | 20.6% |
| Education | 58 | 16.2% |
| Literature & Languages | 14 | 3.9% |
| Liberal Arts & History | 23 | 6.4% |
| Visual & Performing Arts | 22 | 6.1% |
| Communications | 10 | 2.8% |
| Arts & Humanities | 21 | 5.9% |
| Total | 359 | 100.0% |
Transportation & Commute in Brighton
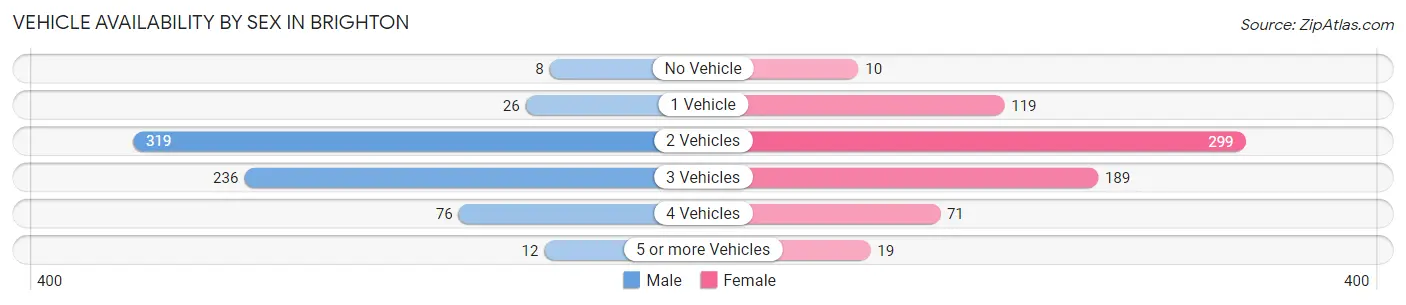
Vehicle Availability by Sex in Brighton
The most prevalent vehicle ownership categories in Brighton are males with 2 vehicles (319, accounting for 47.1%) and females with 2 vehicles (299, making up 45.1%).
| Vehicles Available | Male | Female |
| No Vehicle | 8 (1.2%) | 10 (1.4%) |
| 1 Vehicle | 26 (3.8%) | 119 (16.8%) |
| 2 Vehicles | 319 (47.1%) | 299 (42.3%) |
| 3 Vehicles | 236 (34.9%) | 189 (26.7%) |
| 4 Vehicles | 76 (11.2%) | 71 (10.0%) |
| 5 or more Vehicles | 12 (1.8%) | 19 (2.7%) |
| Total | 677 (100.0%) | 707 (100.0%) |
Commute Time in Brighton
The most frequently occuring commute durations in Brighton are 45 to 59 minutes (242 commuters, 19.1%), 20 to 24 minutes (188 commuters, 14.8%), and 40 to 44 minutes (186 commuters, 14.7%).
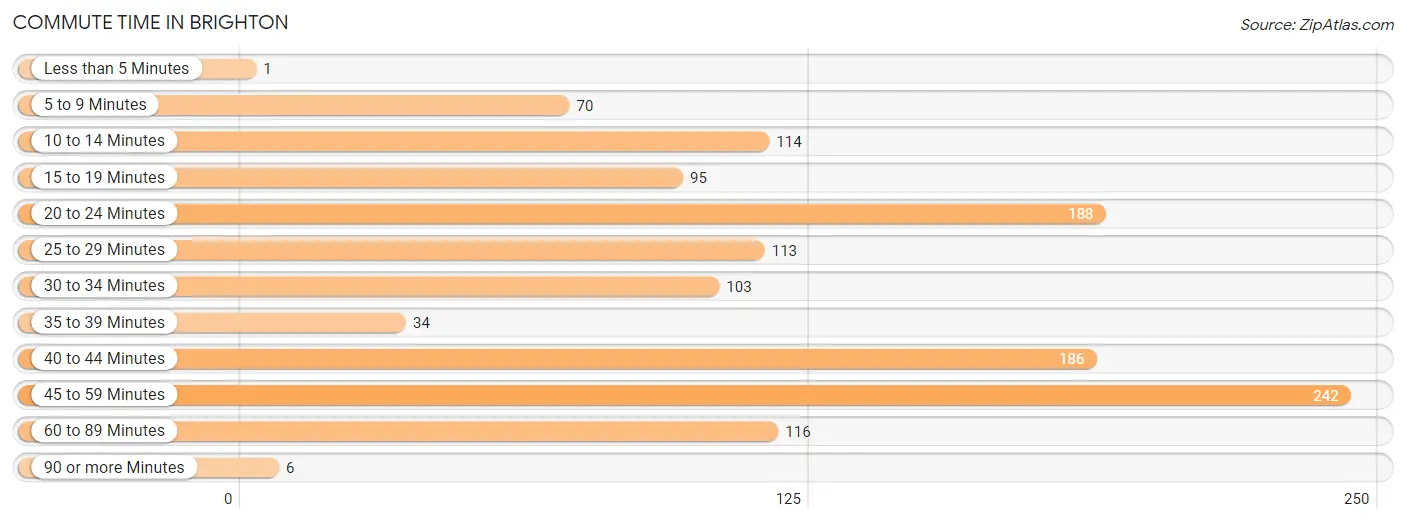
| Commute Time | # Commuters | % Commuters |
| Less than 5 Minutes | 1 | 0.1% |
| 5 to 9 Minutes | 70 | 5.5% |
| 10 to 14 Minutes | 114 | 9.0% |
| 15 to 19 Minutes | 95 | 7.5% |
| 20 to 24 Minutes | 188 | 14.8% |
| 25 to 29 Minutes | 113 | 8.9% |
| 30 to 34 Minutes | 103 | 8.1% |
| 35 to 39 Minutes | 34 | 2.7% |
| 40 to 44 Minutes | 186 | 14.7% |
| 45 to 59 Minutes | 242 | 19.1% |
| 60 to 89 Minutes | 116 | 9.1% |
| 90 or more Minutes | 6 | 0.5% |
Commute Time by Sex in Brighton
The most common commute times in Brighton are 45 to 59 minutes (130 commuters, 20.9%) for males and 40 to 44 minutes (122 commuters, 18.9%) for females.
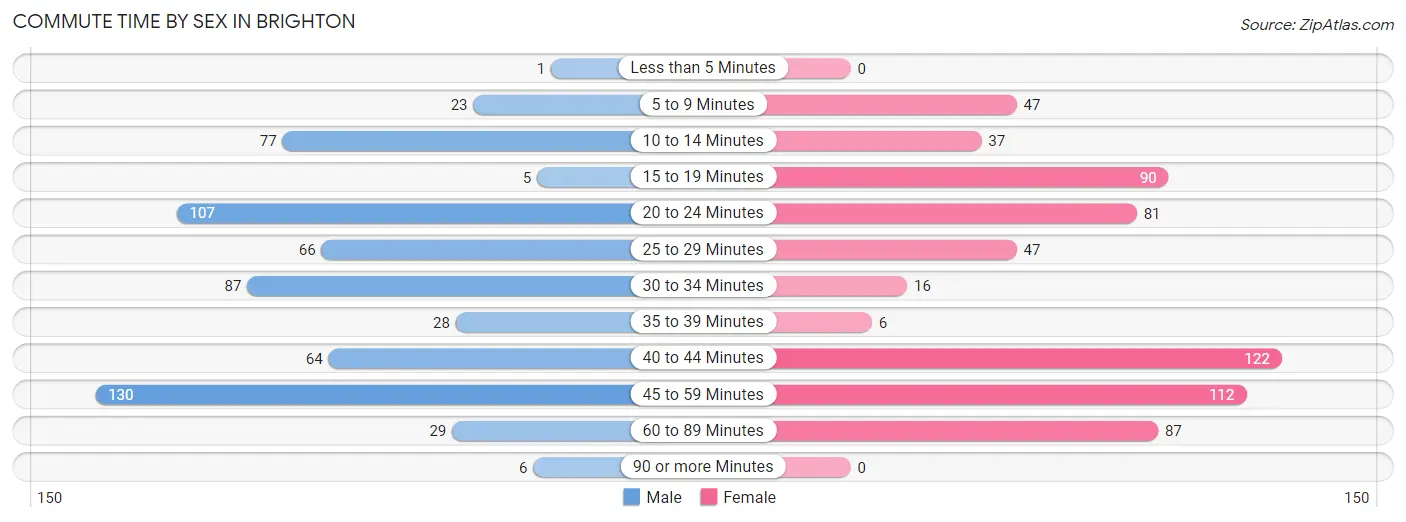
| Commute Time | Male | Female |
| Less than 5 Minutes | 1 (0.2%) | 0 (0.0%) |
| 5 to 9 Minutes | 23 (3.7%) | 47 (7.3%) |
| 10 to 14 Minutes | 77 (12.4%) | 37 (5.7%) |
| 15 to 19 Minutes | 5 (0.8%) | 90 (14.0%) |
| 20 to 24 Minutes | 107 (17.2%) | 81 (12.6%) |
| 25 to 29 Minutes | 66 (10.6%) | 47 (7.3%) |
| 30 to 34 Minutes | 87 (14.0%) | 16 (2.5%) |
| 35 to 39 Minutes | 28 (4.5%) | 6 (0.9%) |
| 40 to 44 Minutes | 64 (10.3%) | 122 (18.9%) |
| 45 to 59 Minutes | 130 (20.9%) | 112 (17.4%) |
| 60 to 89 Minutes | 29 (4.6%) | 87 (13.5%) |
| 90 or more Minutes | 6 (1.0%) | 0 (0.0%) |
Time of Departure to Work by Sex in Brighton
The most frequent times of departure to work in Brighton are 6:00 AM to 6:29 AM (171, 27.5%) for males and 7:00 AM to 7:29 AM (193, 29.9%) for females.
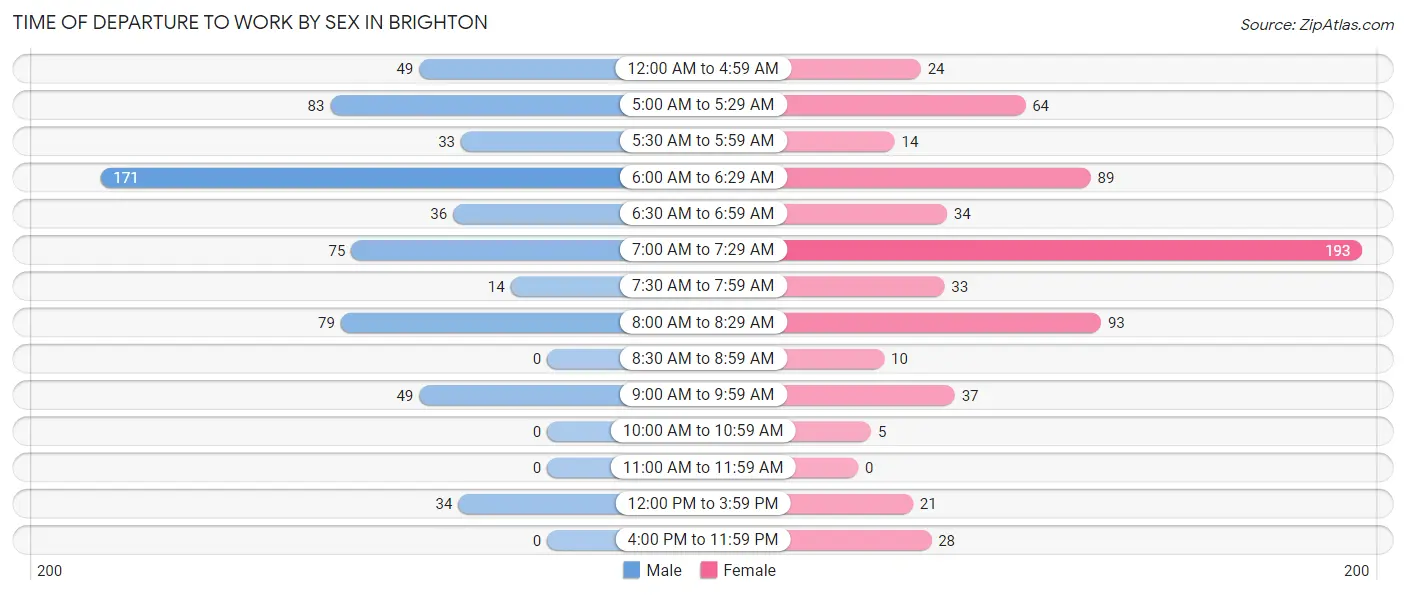
| Time of Departure | Male | Female |
| 12:00 AM to 4:59 AM | 49 (7.9%) | 24 (3.7%) |
| 5:00 AM to 5:29 AM | 83 (13.3%) | 64 (9.9%) |
| 5:30 AM to 5:59 AM | 33 (5.3%) | 14 (2.2%) |
| 6:00 AM to 6:29 AM | 171 (27.5%) | 89 (13.8%) |
| 6:30 AM to 6:59 AM | 36 (5.8%) | 34 (5.3%) |
| 7:00 AM to 7:29 AM | 75 (12.0%) | 193 (29.9%) |
| 7:30 AM to 7:59 AM | 14 (2.2%) | 33 (5.1%) |
| 8:00 AM to 8:29 AM | 79 (12.7%) | 93 (14.4%) |
| 8:30 AM to 8:59 AM | 0 (0.0%) | 10 (1.5%) |
| 9:00 AM to 9:59 AM | 49 (7.9%) | 37 (5.7%) |
| 10:00 AM to 10:59 AM | 0 (0.0%) | 5 (0.8%) |
| 11:00 AM to 11:59 AM | 0 (0.0%) | 0 (0.0%) |
| 12:00 PM to 3:59 PM | 34 (5.5%) | 21 (3.3%) |
| 4:00 PM to 11:59 PM | 0 (0.0%) | 28 (4.3%) |
| Total | 623 (100.0%) | 645 (100.0%) |
Housing Occupancy in Brighton
Occupancy by Ownership in Brighton
Of the total 1,005 dwellings in Brighton, owner-occupied units account for 803 (79.9%), while renter-occupied units make up 202 (20.1%).
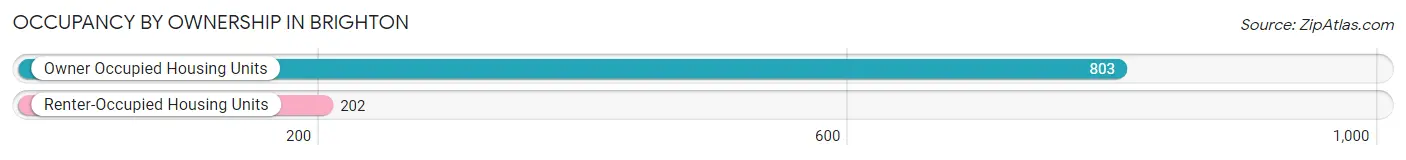
| Occupancy | # Housing Units | % Housing Units |
| Owner Occupied Housing Units | 803 | 79.9% |
| Renter-Occupied Housing Units | 202 | 20.1% |
| Total Occupied Housing Units | 1,005 | 100.0% |
Occupancy by Household Size in Brighton
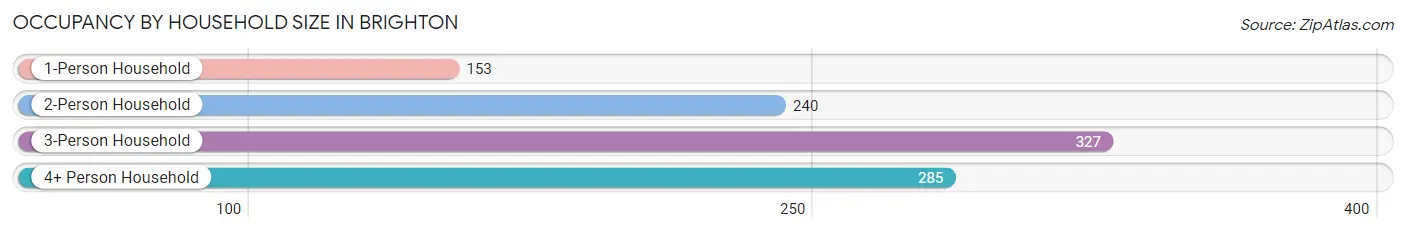
| Household Size | # Housing Units | % Housing Units |
| 1-Person Household | 153 | 15.2% |
| 2-Person Household | 240 | 23.9% |
| 3-Person Household | 327 | 32.5% |
| 4+ Person Household | 285 | 28.4% |
| Total Housing Units | 1,005 | 100.0% |
Occupancy by Ownership by Household Size in Brighton
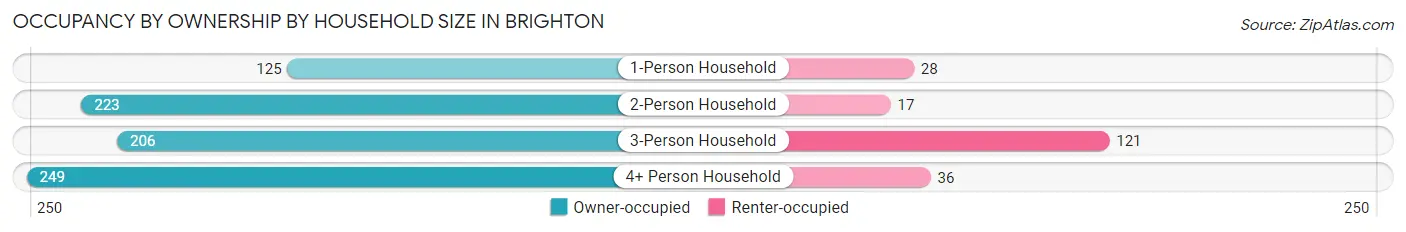
| Household Size | Owner-occupied | Renter-occupied |
| 1-Person Household | 125 (81.7%) | 28 (18.3%) |
| 2-Person Household | 223 (92.9%) | 17 (7.1%) |
| 3-Person Household | 206 (63.0%) | 121 (37.0%) |
| 4+ Person Household | 249 (87.4%) | 36 (12.6%) |
| Total Housing Units | 803 (79.9%) | 202 (20.1%) |
Occupancy by Educational Attainment in Brighton
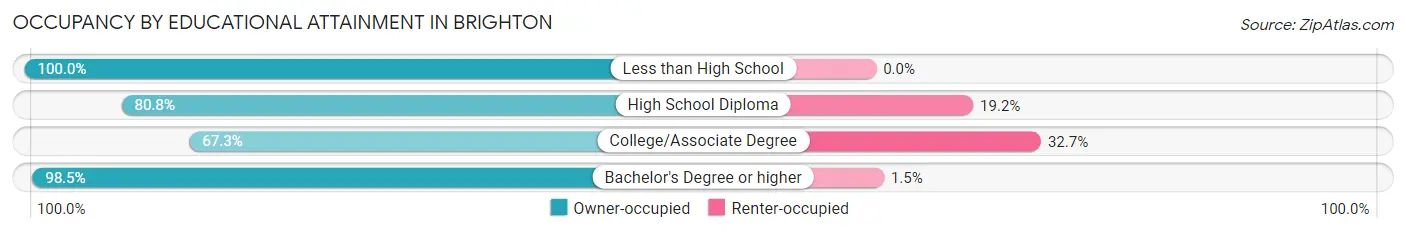
| Household Size | Owner-occupied | Renter-occupied |
| Less than High School | 62 (100.0%) | 0 (0.0%) |
| High School Diploma | 273 (80.8%) | 65 (19.2%) |
| College/Associate Degree | 276 (67.3%) | 134 (32.7%) |
| Bachelor's Degree or higher | 192 (98.5%) | 3 (1.5%) |
Occupancy by Age of Householder in Brighton
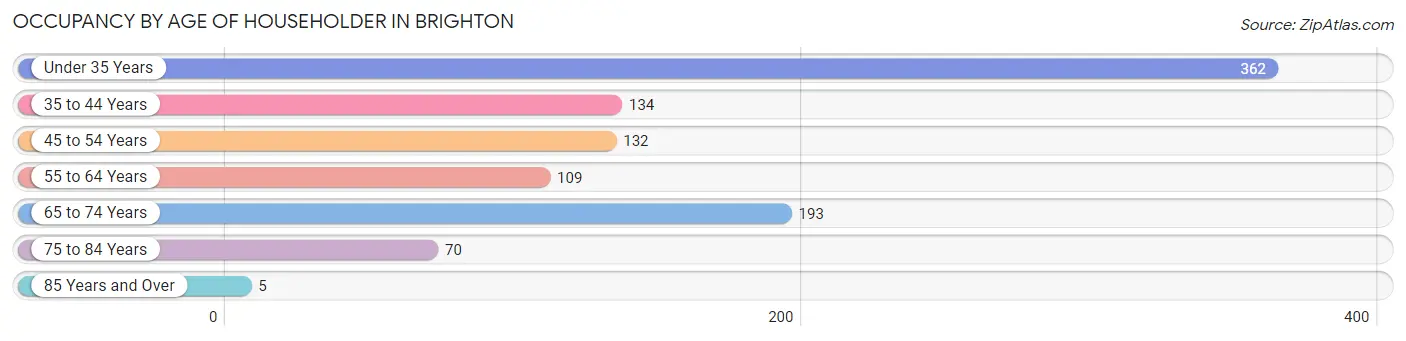
| Age Bracket | # Households | % Households |
| Under 35 Years | 362 | 36.0% |
| 35 to 44 Years | 134 | 13.3% |
| 45 to 54 Years | 132 | 13.1% |
| 55 to 64 Years | 109 | 10.8% |
| 65 to 74 Years | 193 | 19.2% |
| 75 to 84 Years | 70 | 7.0% |
| 85 Years and Over | 5 | 0.5% |
| Total | 1,005 | 100.0% |
Housing Finances in Brighton
Median Income by Occupancy in Brighton
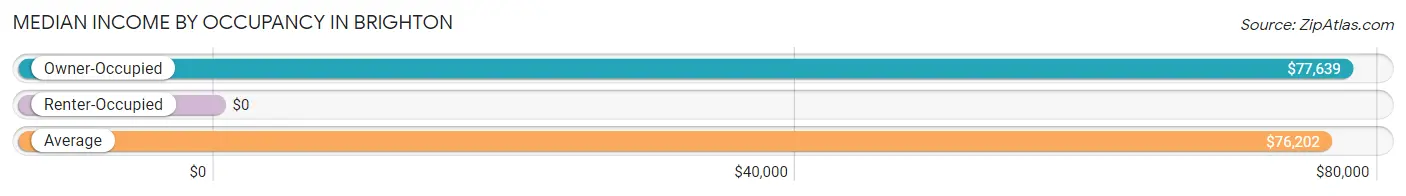
| Occupancy Type | # Households | Median Income |
| Owner-Occupied | 803 (79.9%) | $77,639 |
| Renter-Occupied | 202 (20.1%) | $0 |
| Average | 1,005 (100.0%) | $76,202 |
Occupancy by Householder Income Bracket in Brighton
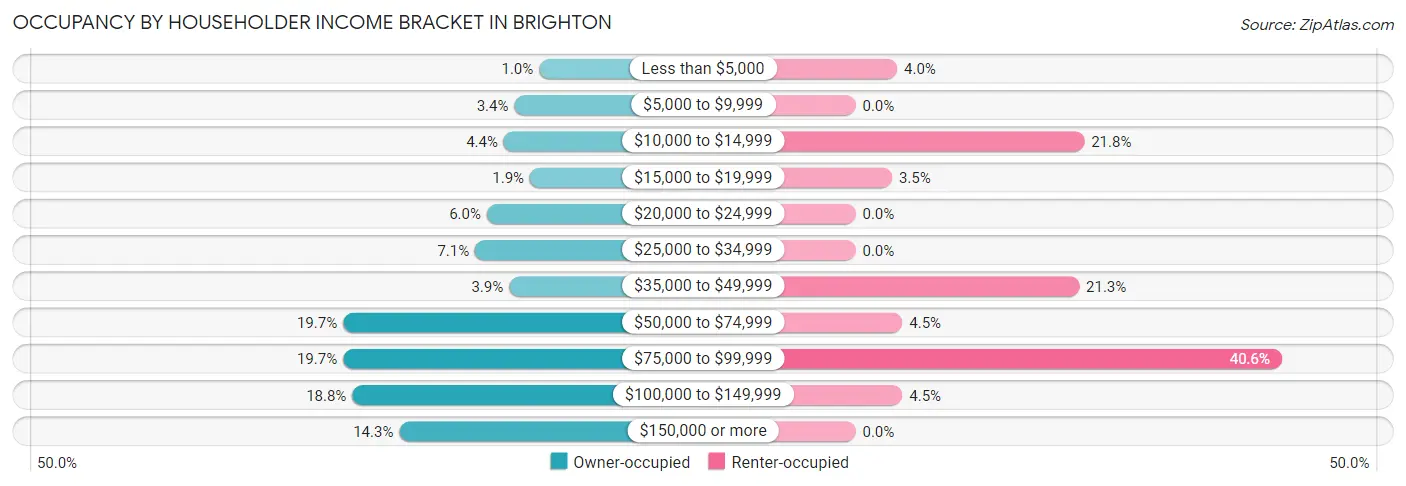
| Income Bracket | Owner-occupied | Renter-occupied |
| Less than $5,000 | 8 (1.0%) | 8 (4.0%) |
| $5,000 to $9,999 | 27 (3.4%) | 0 (0.0%) |
| $10,000 to $14,999 | 35 (4.4%) | 44 (21.8%) |
| $15,000 to $19,999 | 15 (1.9%) | 7 (3.5%) |
| $20,000 to $24,999 | 48 (6.0%) | 0 (0.0%) |
| $25,000 to $34,999 | 57 (7.1%) | 0 (0.0%) |
| $35,000 to $49,999 | 31 (3.9%) | 43 (21.3%) |
| $50,000 to $74,999 | 158 (19.7%) | 9 (4.5%) |
| $75,000 to $99,999 | 158 (19.7%) | 82 (40.6%) |
| $100,000 to $149,999 | 151 (18.8%) | 9 (4.5%) |
| $150,000 or more | 115 (14.3%) | 0 (0.0%) |
| Total | 803 (100.0%) | 202 (100.0%) |
Monthly Housing Cost Tiers in Brighton
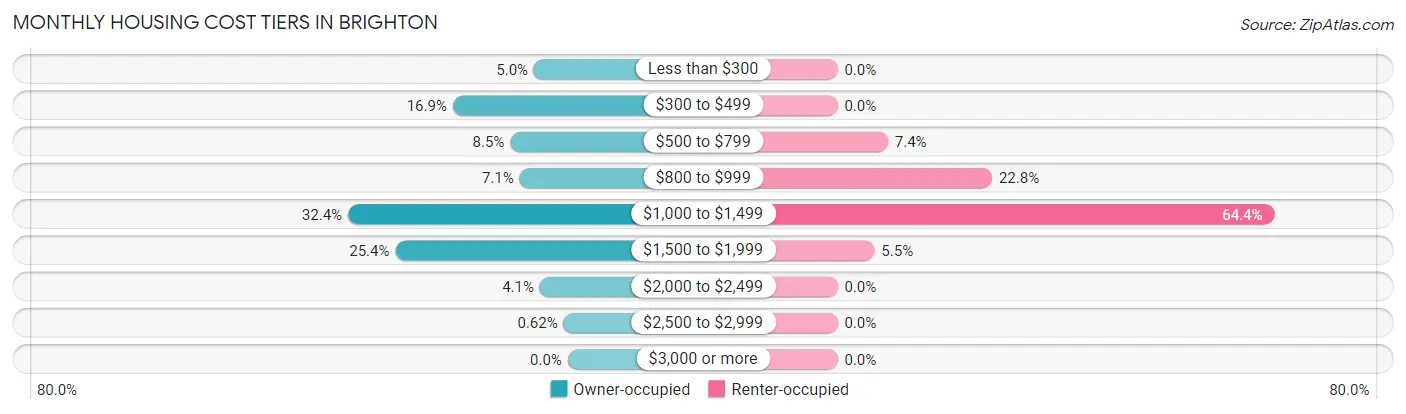
| Monthly Cost | Owner-occupied | Renter-occupied |
| Less than $300 | 40 (5.0%) | 0 (0.0%) |
| $300 to $499 | 136 (16.9%) | 0 (0.0%) |
| $500 to $799 | 68 (8.5%) | 15 (7.4%) |
| $800 to $999 | 57 (7.1%) | 46 (22.8%) |
| $1,000 to $1,499 | 260 (32.4%) | 130 (64.4%) |
| $1,500 to $1,999 | 204 (25.4%) | 11 (5.4%) |
| $2,000 to $2,499 | 33 (4.1%) | 0 (0.0%) |
| $2,500 to $2,999 | 5 (0.6%) | 0 (0.0%) |
| $3,000 or more | 0 (0.0%) | 0 (0.0%) |
| Total | 803 (100.0%) | 202 (100.0%) |
Physical Housing Characteristics in Brighton
Housing Structures in Brighton
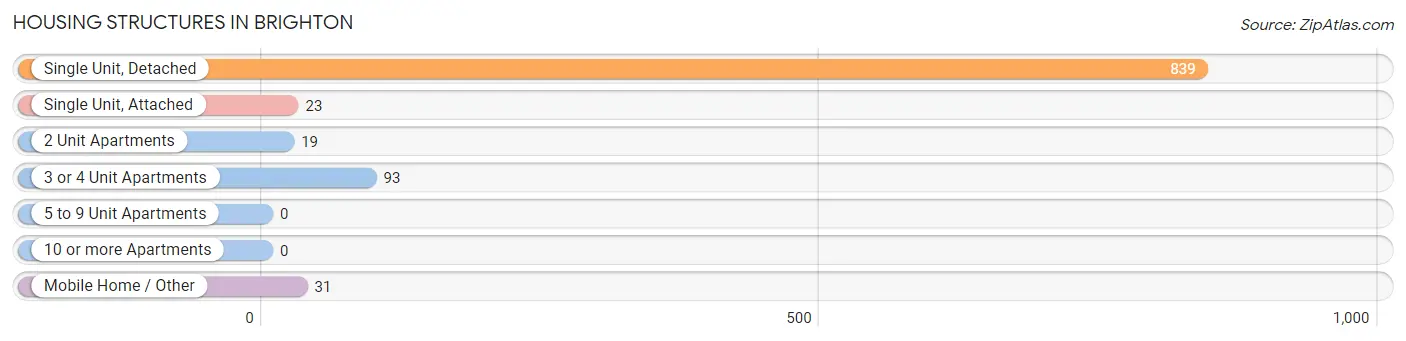
| Structure Type | # Housing Units | % Housing Units |
| Single Unit, Detached | 839 | 83.5% |
| Single Unit, Attached | 23 | 2.3% |
| 2 Unit Apartments | 19 | 1.9% |
| 3 or 4 Unit Apartments | 93 | 9.2% |
| 5 to 9 Unit Apartments | 0 | 0.0% |
| 10 or more Apartments | 0 | 0.0% |
| Mobile Home / Other | 31 | 3.1% |
| Total | 1,005 | 100.0% |
Housing Structures by Occupancy in Brighton
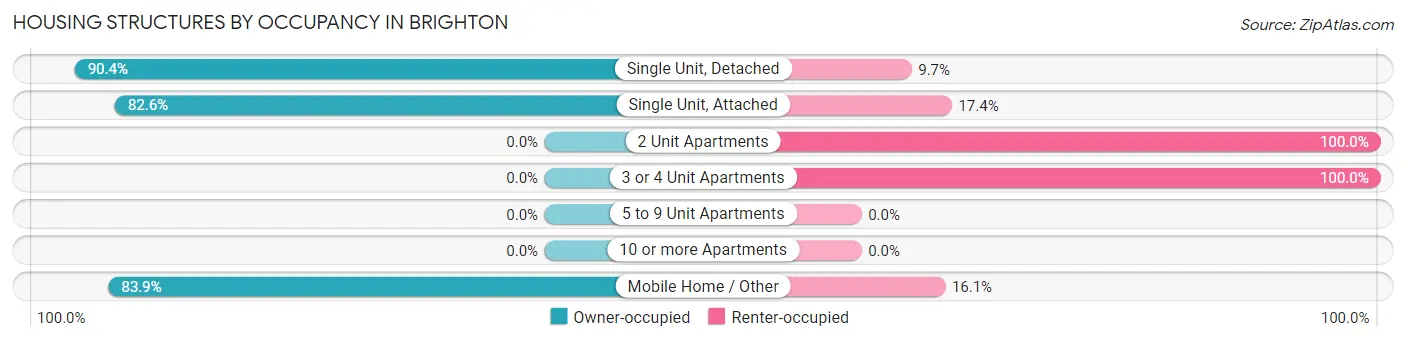
| Structure Type | Owner-occupied | Renter-occupied |
| Single Unit, Detached | 758 (90.3%) | 81 (9.7%) |
| Single Unit, Attached | 19 (82.6%) | 4 (17.4%) |
| 2 Unit Apartments | 0 (0.0%) | 19 (100.0%) |
| 3 or 4 Unit Apartments | 0 (0.0%) | 93 (100.0%) |
| 5 to 9 Unit Apartments | 0 (0.0%) | 0 (0.0%) |
| 10 or more Apartments | 0 (0.0%) | 0 (0.0%) |
| Mobile Home / Other | 26 (83.9%) | 5 (16.1%) |
| Total | 803 (79.9%) | 202 (20.1%) |
Housing Structures by Number of Rooms in Brighton
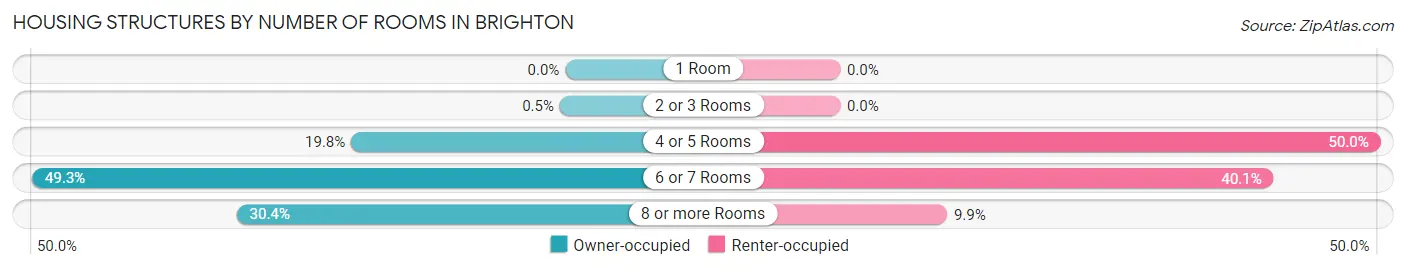
| Number of Rooms | Owner-occupied | Renter-occupied |
| 1 Room | 0 (0.0%) | 0 (0.0%) |
| 2 or 3 Rooms | 4 (0.5%) | 0 (0.0%) |
| 4 or 5 Rooms | 159 (19.8%) | 101 (50.0%) |
| 6 or 7 Rooms | 396 (49.3%) | 81 (40.1%) |
| 8 or more Rooms | 244 (30.4%) | 20 (9.9%) |
| Total | 803 (100.0%) | 202 (100.0%) |
Housing Structure by Heating Type in Brighton
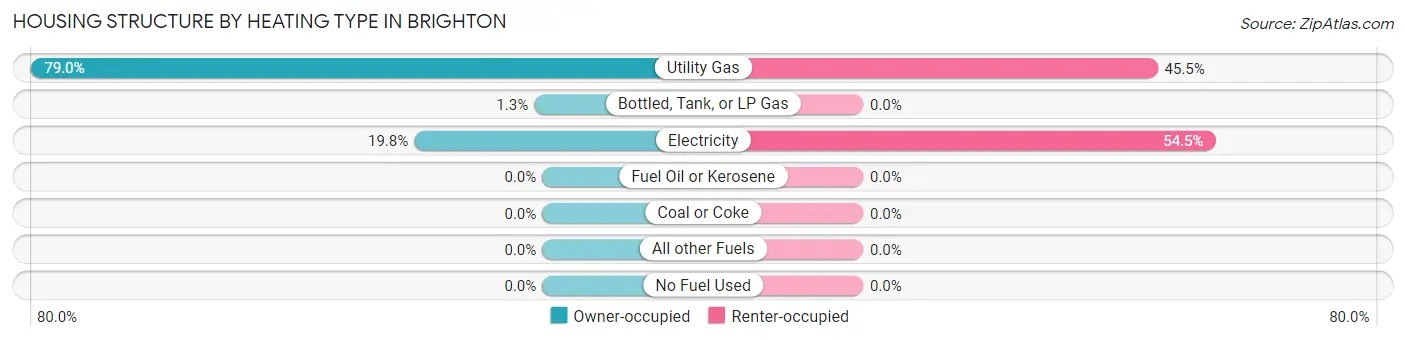
| Heating Type | Owner-occupied | Renter-occupied |
| Utility Gas | 634 (78.9%) | 92 (45.5%) |
| Bottled, Tank, or LP Gas | 10 (1.3%) | 0 (0.0%) |
| Electricity | 159 (19.8%) | 110 (54.5%) |
| Fuel Oil or Kerosene | 0 (0.0%) | 0 (0.0%) |
| Coal or Coke | 0 (0.0%) | 0 (0.0%) |
| All other Fuels | 0 (0.0%) | 0 (0.0%) |
| No Fuel Used | 0 (0.0%) | 0 (0.0%) |
| Total | 803 (100.0%) | 202 (100.0%) |
Household Vehicle Usage in Brighton
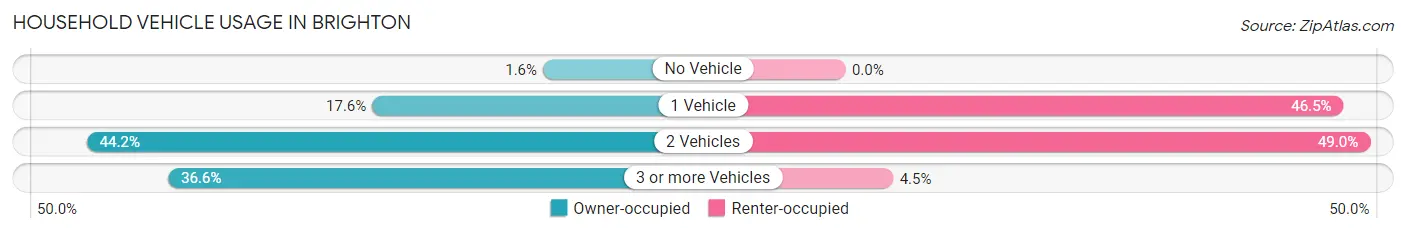
| Vehicles per Household | Owner-occupied | Renter-occupied |
| No Vehicle | 13 (1.6%) | 0 (0.0%) |
| 1 Vehicle | 141 (17.6%) | 94 (46.5%) |
| 2 Vehicles | 355 (44.2%) | 99 (49.0%) |
| 3 or more Vehicles | 294 (36.6%) | 9 (4.5%) |
| Total | 803 (100.0%) | 202 (100.0%) |
Real Estate & Mortgages in Brighton
Real Estate and Mortgage Overview in Brighton
| Characteristic | Without Mortgage | With Mortgage |
| Housing Units | 235 | 568 |
| Median Property Value | $157,600 | $196,500 |
| Median Household Income | - | - |
| Monthly Housing Costs | $387 | $0 |
| Real Estate Taxes | $1,113 | $0 |
Property Value by Mortgage Status in Brighton
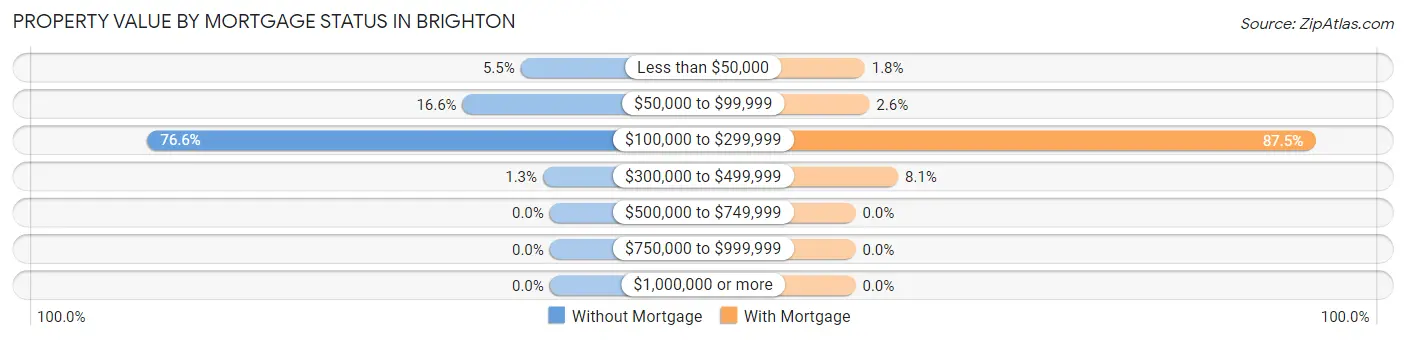
| Property Value | Without Mortgage | With Mortgage |
| Less than $50,000 | 13 (5.5%) | 10 (1.8%) |
| $50,000 to $99,999 | 39 (16.6%) | 15 (2.6%) |
| $100,000 to $299,999 | 180 (76.6%) | 497 (87.5%) |
| $300,000 to $499,999 | 3 (1.3%) | 46 (8.1%) |
| $500,000 to $749,999 | 0 (0.0%) | 0 (0.0%) |
| $750,000 to $999,999 | 0 (0.0%) | 0 (0.0%) |
| $1,000,000 or more | 0 (0.0%) | 0 (0.0%) |
| Total | 235 (100.0%) | 568 (100.0%) |
Household Income by Mortgage Status in Brighton
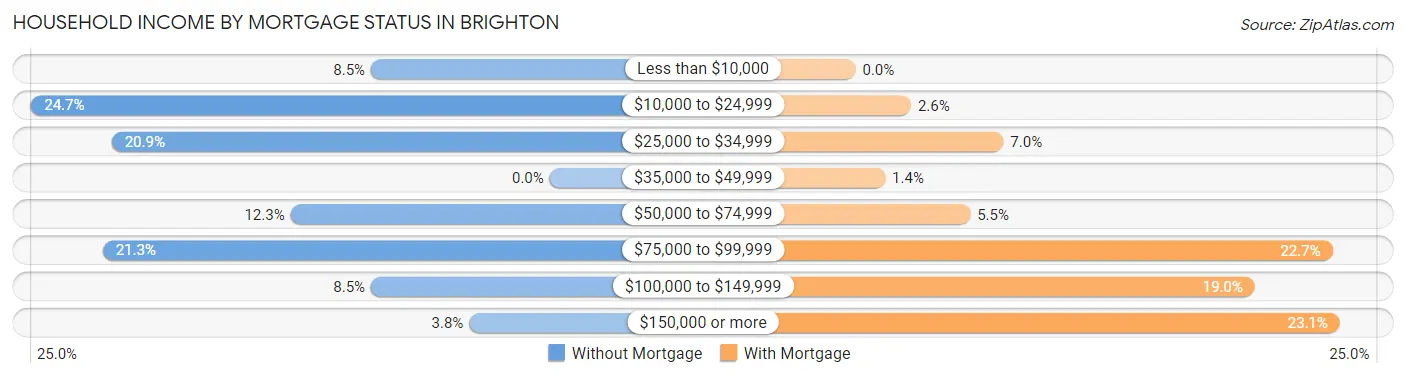
| Household Income | Without Mortgage | With Mortgage |
| Less than $10,000 | 20 (8.5%) | 0 (0.0%) |
| $10,000 to $24,999 | 58 (24.7%) | 15 (2.6%) |
| $25,000 to $34,999 | 49 (20.8%) | 40 (7.0%) |
| $35,000 to $49,999 | 0 (0.0%) | 8 (1.4%) |
| $50,000 to $74,999 | 29 (12.3%) | 31 (5.5%) |
| $75,000 to $99,999 | 50 (21.3%) | 129 (22.7%) |
| $100,000 to $149,999 | 20 (8.5%) | 108 (19.0%) |
| $150,000 or more | 9 (3.8%) | 131 (23.1%) |
| Total | 235 (100.0%) | 568 (100.0%) |
Property Value to Household Income Ratio in Brighton
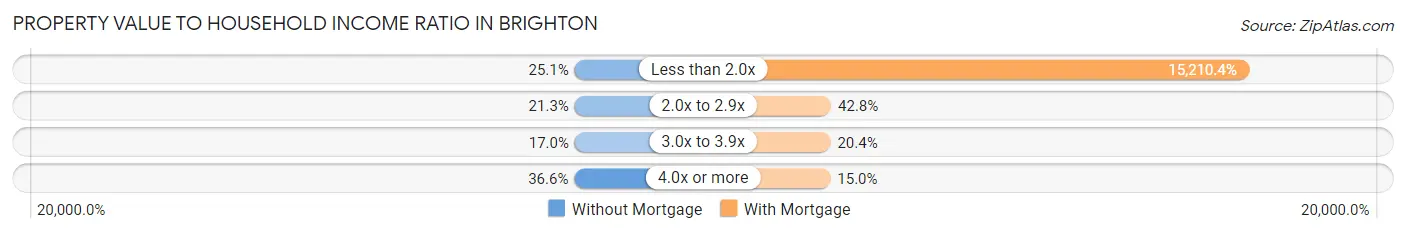
| Value-to-Income Ratio | Without Mortgage | With Mortgage |
| Less than 2.0x | 59 (25.1%) | 86,395 (15,210.4%) |
| 2.0x to 2.9x | 50 (21.3%) | 243 (42.8%) |
| 3.0x to 3.9x | 40 (17.0%) | 116 (20.4%) |
| 4.0x or more | 86 (36.6%) | 85 (15.0%) |
| Total | 235 (100.0%) | 568 (100.0%) |
Real Estate Taxes by Mortgage Status in Brighton
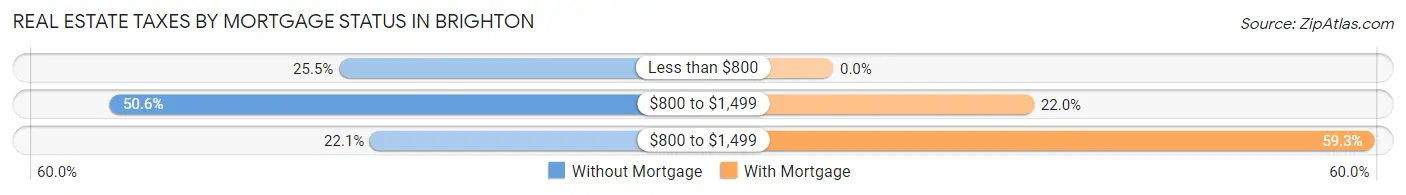
| Property Taxes | Without Mortgage | With Mortgage |
| Less than $800 | 60 (25.5%) | 0 (0.0%) |
| $800 to $1,499 | 119 (50.6%) | 125 (22.0%) |
| $800 to $1,499 | 52 (22.1%) | 337 (59.3%) |
| Total | 235 (100.0%) | 568 (100.0%) |
Health & Disability in Brighton
Health Insurance Coverage by Age in Brighton
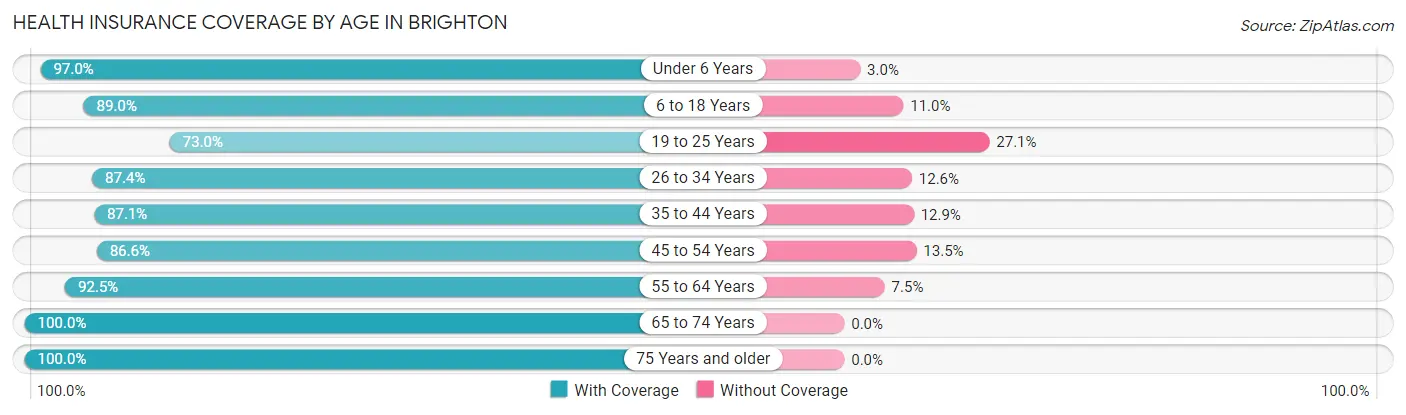
| Age Bracket | With Coverage | Without Coverage |
| Under 6 Years | 262 (97.0%) | 8 (3.0%) |
| 6 to 18 Years | 631 (89.0%) | 78 (11.0%) |
| 19 to 25 Years | 151 (73.0%) | 56 (27.1%) |
| 26 to 34 Years | 437 (87.4%) | 63 (12.6%) |
| 35 to 44 Years | 249 (87.1%) | 37 (12.9%) |
| 45 to 54 Years | 251 (86.6%) | 39 (13.5%) |
| 55 to 64 Years | 221 (92.5%) | 18 (7.5%) |
| 65 to 74 Years | 254 (100.0%) | 0 (0.0%) |
| 75 Years and older | 101 (100.0%) | 0 (0.0%) |
| Total | 2,557 (89.5%) | 299 (10.5%) |
Health Insurance Coverage by Citizenship Status in Brighton
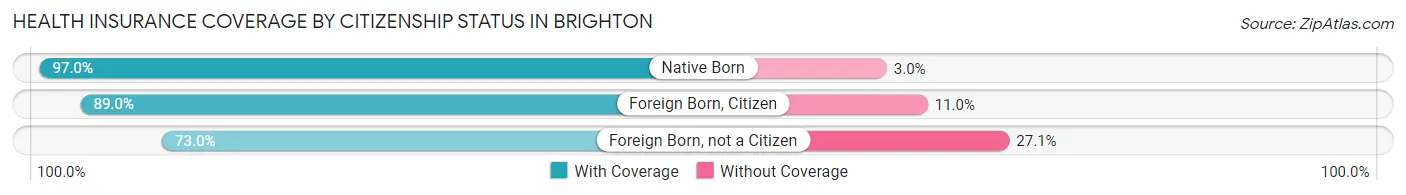
| Citizenship Status | With Coverage | Without Coverage |
| Native Born | 262 (97.0%) | 8 (3.0%) |
| Foreign Born, Citizen | 631 (89.0%) | 78 (11.0%) |
| Foreign Born, not a Citizen | 151 (73.0%) | 56 (27.1%) |
Health Insurance Coverage by Household Income in Brighton
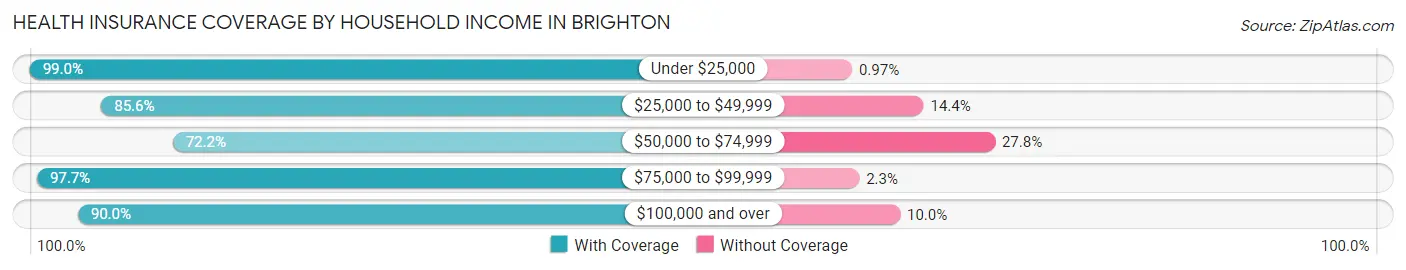
| Household Income | With Coverage | Without Coverage |
| Under $25,000 | 407 (99.0%) | 4 (1.0%) |
| $25,000 to $49,999 | 262 (85.6%) | 44 (14.4%) |
| $50,000 to $74,999 | 354 (72.2%) | 136 (27.8%) |
| $75,000 to $99,999 | 631 (97.7%) | 15 (2.3%) |
| $100,000 and over | 903 (90.0%) | 100 (10.0%) |
Public vs Private Health Insurance Coverage by Age in Brighton
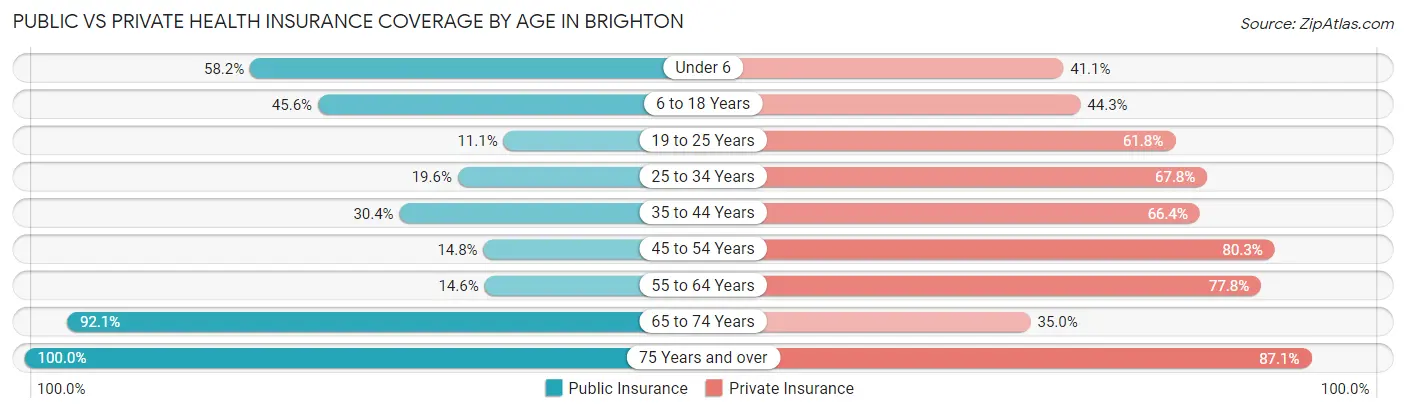
| Age Bracket | Public Insurance | Private Insurance |
| Under 6 | 157 (58.2%) | 111 (41.1%) |
| 6 to 18 Years | 323 (45.6%) | 314 (44.3%) |
| 19 to 25 Years | 23 (11.1%) | 128 (61.8%) |
| 25 to 34 Years | 98 (19.6%) | 339 (67.8%) |
| 35 to 44 Years | 87 (30.4%) | 190 (66.4%) |
| 45 to 54 Years | 43 (14.8%) | 233 (80.3%) |
| 55 to 64 Years | 35 (14.6%) | 186 (77.8%) |
| 65 to 74 Years | 234 (92.1%) | 89 (35.0%) |
| 75 Years and over | 101 (100.0%) | 88 (87.1%) |
| Total | 1,101 (38.6%) | 1,678 (58.8%) |
Disability Status by Sex by Age in Brighton

| Age Bracket | Male | Female |
| Under 5 Years | 0 (0.0%) | 0 (0.0%) |
| 5 to 17 Years | 41 (10.7%) | 0 (0.0%) |
| 18 to 34 Years | 48 (13.1%) | 42 (10.7%) |
| 35 to 64 Years | 97 (25.7%) | 56 (12.8%) |
| 65 to 74 Years | 43 (48.3%) | 80 (48.5%) |
| 75 Years and over | 20 (100.0%) | 48 (59.3%) |
Disability Class by Sex by Age in Brighton
Disability Class: Hearing Difficulty
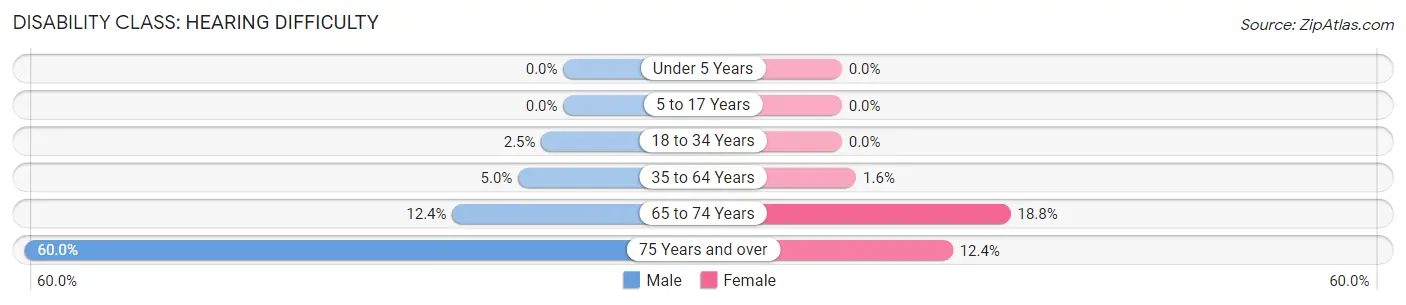
| Age Bracket | Male | Female |
| Under 5 Years | 0 (0.0%) | 0 (0.0%) |
| 5 to 17 Years | 0 (0.0%) | 0 (0.0%) |
| 18 to 34 Years | 9 (2.5%) | 0 (0.0%) |
| 35 to 64 Years | 19 (5.0%) | 7 (1.6%) |
| 65 to 74 Years | 11 (12.4%) | 31 (18.8%) |
| 75 Years and over | 12 (60.0%) | 10 (12.3%) |
Disability Class: Vision Difficulty
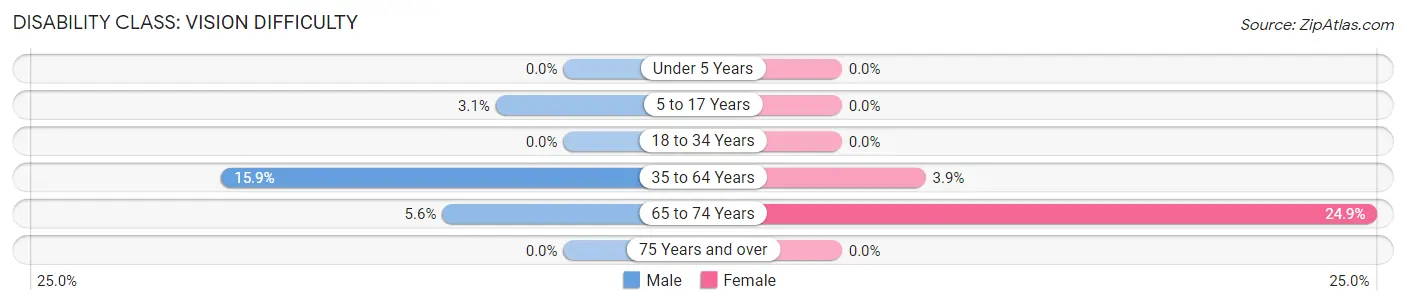
| Age Bracket | Male | Female |
| Under 5 Years | 0 (0.0%) | 0 (0.0%) |
| 5 to 17 Years | 12 (3.1%) | 0 (0.0%) |
| 18 to 34 Years | 0 (0.0%) | 0 (0.0%) |
| 35 to 64 Years | 60 (15.9%) | 17 (3.9%) |
| 65 to 74 Years | 5 (5.6%) | 41 (24.8%) |
| 75 Years and over | 0 (0.0%) | 0 (0.0%) |
Disability Class: Cognitive Difficulty
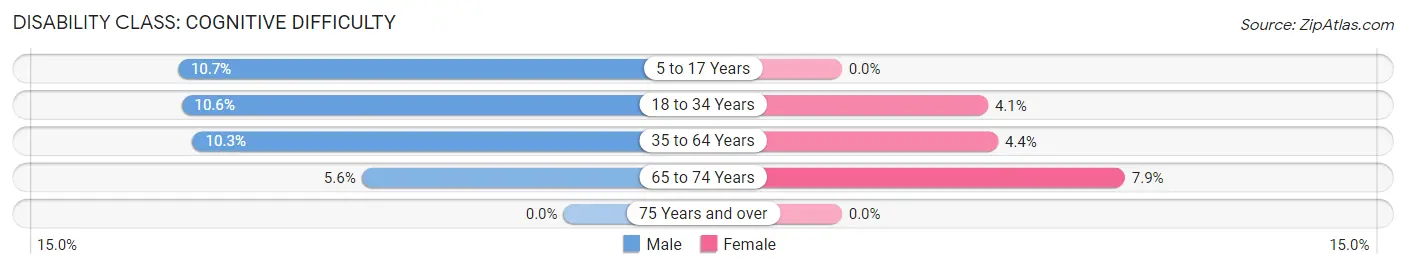
| Age Bracket | Male | Female |
| 5 to 17 Years | 41 (10.7%) | 0 (0.0%) |
| 18 to 34 Years | 39 (10.6%) | 16 (4.1%) |
| 35 to 64 Years | 39 (10.3%) | 19 (4.3%) |
| 65 to 74 Years | 5 (5.6%) | 13 (7.9%) |
| 75 Years and over | 0 (0.0%) | 0 (0.0%) |
Disability Class: Ambulatory Difficulty
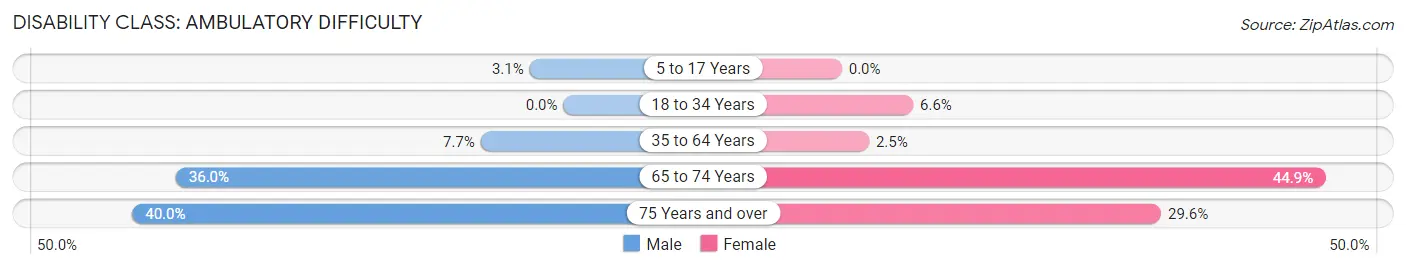
| Age Bracket | Male | Female |
| 5 to 17 Years | 12 (3.1%) | 0 (0.0%) |
| 18 to 34 Years | 0 (0.0%) | 26 (6.6%) |
| 35 to 64 Years | 29 (7.7%) | 11 (2.5%) |
| 65 to 74 Years | 32 (36.0%) | 74 (44.9%) |
| 75 Years and over | 8 (40.0%) | 24 (29.6%) |
Disability Class: Self-Care Difficulty
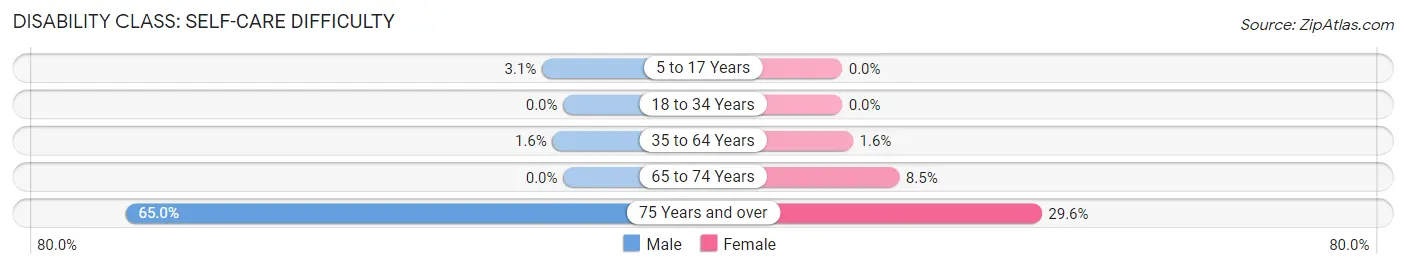
| Age Bracket | Male | Female |
| 5 to 17 Years | 12 (3.1%) | 0 (0.0%) |
| 18 to 34 Years | 0 (0.0%) | 0 (0.0%) |
| 35 to 64 Years | 6 (1.6%) | 7 (1.6%) |
| 65 to 74 Years | 0 (0.0%) | 14 (8.5%) |
| 75 Years and over | 13 (65.0%) | 24 (29.6%) |
Technology Access in Brighton
Computing Device Access in Brighton
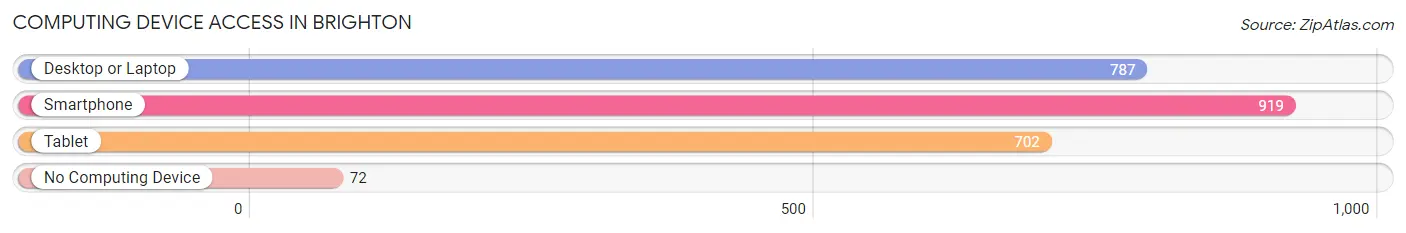
| Device Type | # Households | % Households |
| Desktop or Laptop | 787 | 78.3% |
| Smartphone | 919 | 91.4% |
| Tablet | 702 | 69.9% |
| No Computing Device | 72 | 7.2% |
| Total | 1,005 | 100.0% |
Internet Access in Brighton
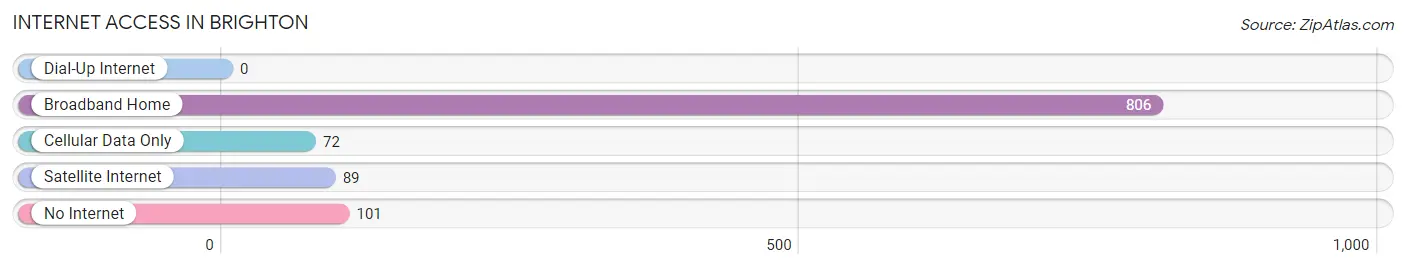
| Internet Type | # Households | % Households |
| Dial-Up Internet | 0 | 0.0% |
| Broadband Home | 806 | 80.2% |
| Cellular Data Only | 72 | 7.2% |
| Satellite Internet | 89 | 8.9% |
| No Internet | 101 | 10.1% |
| Total | 1,005 | 100.0% |
Brighton Summary
Brighton, Tennessee is a small town located in Tipton County, in the western part of the state. It is situated on the banks of the Mississippi River, about 25 miles northeast of Memphis. The town has a population of approximately 4,000 people and is part of the Memphis metropolitan area.
History
Brighton was founded in 1836 by a group of settlers from North Carolina. The town was named after the English city of Brighton, which was the hometown of one of the settlers. The town was incorporated in 1837 and quickly became a thriving agricultural center. The town was also known for its brick-making industry, which was established in the late 1800s.
The town was a major stop on the Memphis and Charleston Railroad, which connected Memphis to Charleston, South Carolina. This allowed the town to become a major shipping center for cotton and other agricultural products. The railroad also allowed the town to become a popular tourist destination, as it was close to the Mississippi River.
In the early 1900s, the town was home to a large African-American population. This population was largely employed in the brick-making industry, as well as in the cotton fields. The town was also home to a large Jewish population, which was largely employed in the retail and service industries.
Geography
Brighton is located in western Tennessee, in Tipton County. It is situated on the banks of the Mississippi River, about 25 miles northeast of Memphis. The town is located in a rural area, with the nearest major city being Memphis. The town is surrounded by rolling hills and farmland, with the nearest major highway being Interstate 40.
The climate in Brighton is humid subtropical, with hot summers and mild winters. The average annual temperature is around 65 degrees Fahrenheit, with the average high in the summer being around 90 degrees Fahrenheit. The average low in the winter is around 40 degrees Fahrenheit.
Economy
The economy of Brighton is largely based on agriculture and tourism. The town is home to several farms, which produce a variety of crops, including cotton, soybeans, corn, and wheat. The town is also home to several tourist attractions, including the historic downtown area, the Mississippi River, and the nearby Memphis Zoo.
The town is also home to several small businesses, including restaurants, retail stores, and service providers. The town is also home to several manufacturing companies, which produce a variety of products, including furniture, clothing, and electronics.
Demographics
As of the 2010 census, the population of Brighton was 4,000. The racial makeup of the town was 79.3% White, 17.2% African American, 0.7% Native American, 0.3% Asian, 0.1% Pacific Islander, and 2.4% from other races. The median household income was $37,000, and the median family income was $45,000.
The town is home to a large African-American population, which is largely employed in the brick-making industry, as well as in the cotton fields. The town is also home to a large Jewish population, which is largely employed in the retail and service industries.
Conclusion
Brighton, Tennessee is a small town located in Tipton County, in the western part of the state. It is situated on the banks of the Mississippi River, about 25 miles northeast of Memphis. The town has a population of approximately 4,000 people and is part of the Memphis metropolitan area. The town is largely based on agriculture and tourism, with the nearest major city being Memphis. The town is home to a large African-American population, as well as a large Jewish population. The median household income is $37,000, and the median family income is $45,000.
Common Questions
What is Per Capita Income in Brighton?
Per Capita income in Brighton is $29,948.
What is the Median Family Income in Brighton?
Median Family Income in Brighton is $82,619.
What is the Median Household income in Brighton?
Median Household Income in Brighton is $76,202.
What is Income or Wage Gap in Brighton?
Income or Wage Gap in Brighton is 27.8%.
Women in Brighton earn 72.2 cents for every dollar earned by a man.
What is Inequality or Gini Index in Brighton?
Inequality or Gini Index in Brighton is 0.40.
What is the Total Population of Brighton?
Total Population of Brighton is 2,878.
What is the Total Male Population of Brighton?
Total Male Population of Brighton is 1,432.
What is the Total Female Population of Brighton?
Total Female Population of Brighton is 1,446.
What is the Ratio of Males per 100 Females in Brighton?
There are 99.03 Males per 100 Females in Brighton.
What is the Ratio of Females per 100 Males in Brighton?
There are 100.98 Females per 100 Males in Brighton.
What is the Median Population Age in Brighton?
Median Population Age in Brighton is 30.8 Years.
What is the Average Family Size in Brighton
Average Family Size in Brighton is 3.1 People.
What is the Average Household Size in Brighton
Average Household Size in Brighton is 2.9 People.
How Large is the Labor Force in Brighton?
There are 1,467 People in the Labor Forcein in Brighton.
What is the Percentage of People in the Labor Force in Brighton?
71.0% of People are in the Labor Force in Brighton.
What is the Unemployment Rate in Brighton?
Unemployment Rate in Brighton is 4.8%.