Maryville, TN Map & Demographics
Maryville Map
Maryville Overview
$36,732
PER CAPITA INCOME
$96,080
AVG FAMILY INCOME
$74,610
AVG HOUSEHOLD INCOME
34.5%
WAGE / INCOME GAP [ % ]
65.5¢/ $1
WAGE / INCOME GAP [ $ ]
0.44
INEQUALITY / GINI INDEX
31,876
TOTAL POPULATION
15,141
MALE POPULATION
16,735
FEMALE POPULATION
90.48
MALES / 100 FEMALES
110.53
FEMALES / 100 MALES
41.2
MEDIAN AGE
3.1
AVG FAMILY SIZE
2.5
AVG HOUSEHOLD SIZE
15,576
LABOR FORCE [ PEOPLE ]
59.8%
PERCENT IN LABOR FORCE
2.8%
UNEMPLOYMENT RATE
Maryville Area Codes
Income in Maryville
Income Overview in Maryville
Per Capita Income in Maryville is $36,732, while median incomes of families and households are $96,080 and $74,610 respectively.
| Characteristic | Number | Measure |
| Per Capita Income | 31,876 | $36,732 |
| Median Family Income | 8,324 | $96,080 |
| Mean Family Income | 8,324 | $114,837 |
| Median Household Income | 11,941 | $74,610 |
| Mean Household Income | 11,941 | $94,924 |
| Income Deficit | 8,324 | $0 |
| Wage / Income Gap (%) | 31,876 | 34.49% |
| Wage / Income Gap ($) | 31,876 | 65.51¢ per $1 |
| Gini / Inequality Index | 31,876 | 0.44 |
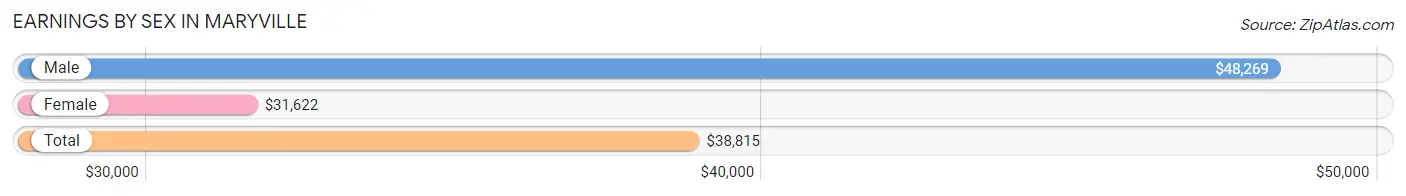
Earnings by Sex in Maryville
Average Earnings in Maryville are $38,815, $48,269 for men and $31,622 for women, a difference of 34.5%.
| Sex | Number | Average Earnings |
| Male | 8,528 (50.9%) | $48,269 |
| Female | 8,232 (49.1%) | $31,622 |
| Total | 16,760 (100.0%) | $38,815 |
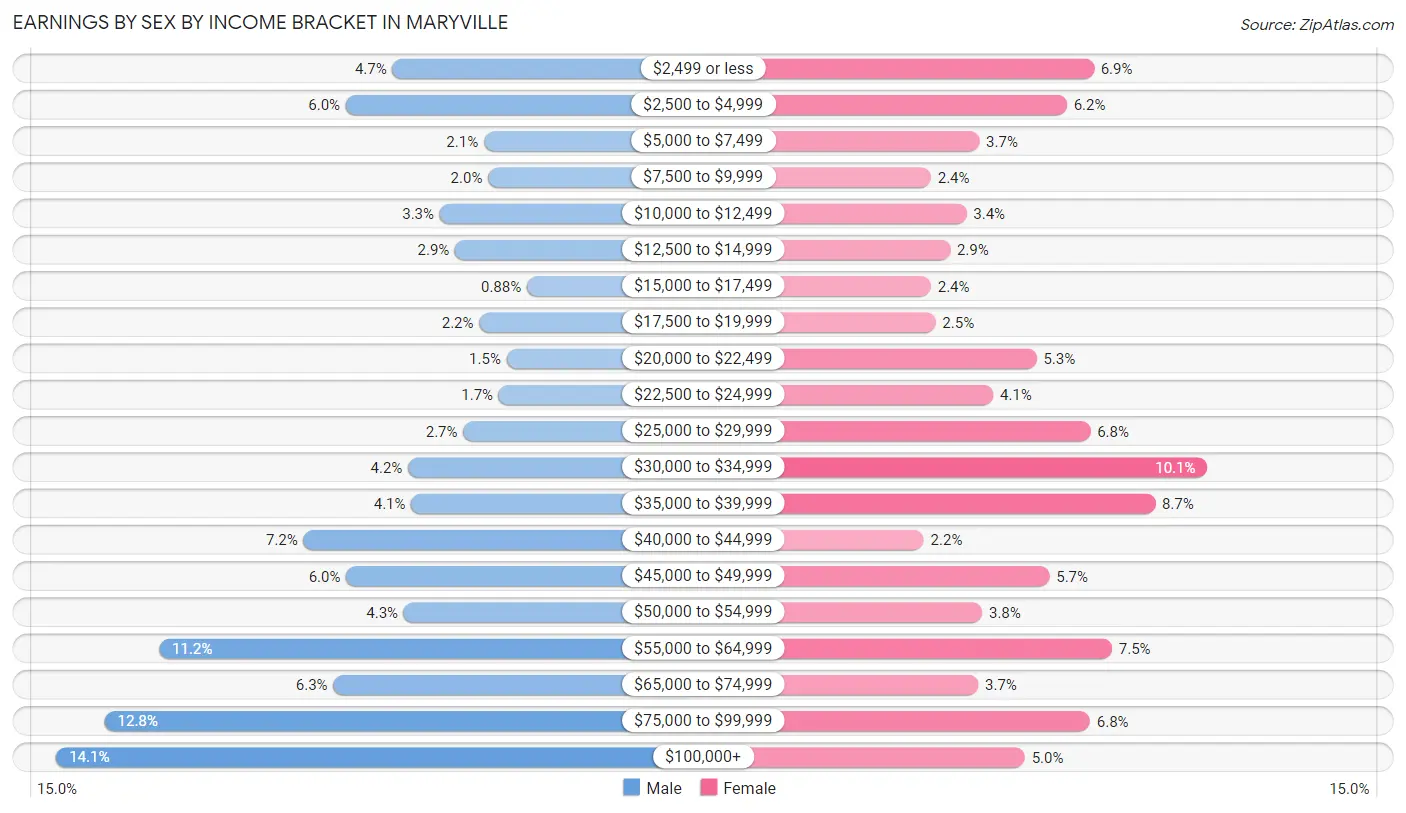
Earnings by Sex by Income Bracket in Maryville
The most common earnings brackets in Maryville are $100,000+ for men (1,203 | 14.1%) and $30,000 to $34,999 for women (834 | 10.1%).
| Income | Male | Female |
| $2,499 or less | 397 (4.7%) | 571 (6.9%) |
| $2,500 to $4,999 | 509 (6.0%) | 509 (6.2%) |
| $5,000 to $7,499 | 178 (2.1%) | 306 (3.7%) |
| $7,500 to $9,999 | 168 (2.0%) | 194 (2.4%) |
| $10,000 to $12,499 | 284 (3.3%) | 277 (3.4%) |
| $12,500 to $14,999 | 247 (2.9%) | 239 (2.9%) |
| $15,000 to $17,499 | 75 (0.9%) | 194 (2.4%) |
| $17,500 to $19,999 | 189 (2.2%) | 205 (2.5%) |
| $20,000 to $22,499 | 124 (1.5%) | 439 (5.3%) |
| $22,500 to $24,999 | 142 (1.7%) | 338 (4.1%) |
| $25,000 to $29,999 | 228 (2.7%) | 563 (6.8%) |
| $30,000 to $34,999 | 360 (4.2%) | 834 (10.1%) |
| $35,000 to $39,999 | 352 (4.1%) | 713 (8.7%) |
| $40,000 to $44,999 | 611 (7.2%) | 178 (2.2%) |
| $45,000 to $49,999 | 508 (6.0%) | 468 (5.7%) |
| $50,000 to $54,999 | 370 (4.3%) | 313 (3.8%) |
| $55,000 to $64,999 | 957 (11.2%) | 613 (7.4%) |
| $65,000 to $74,999 | 539 (6.3%) | 304 (3.7%) |
| $75,000 to $99,999 | 1,087 (12.8%) | 562 (6.8%) |
| $100,000+ | 1,203 (14.1%) | 412 (5.0%) |
| Total | 8,528 (100.0%) | 8,232 (100.0%) |
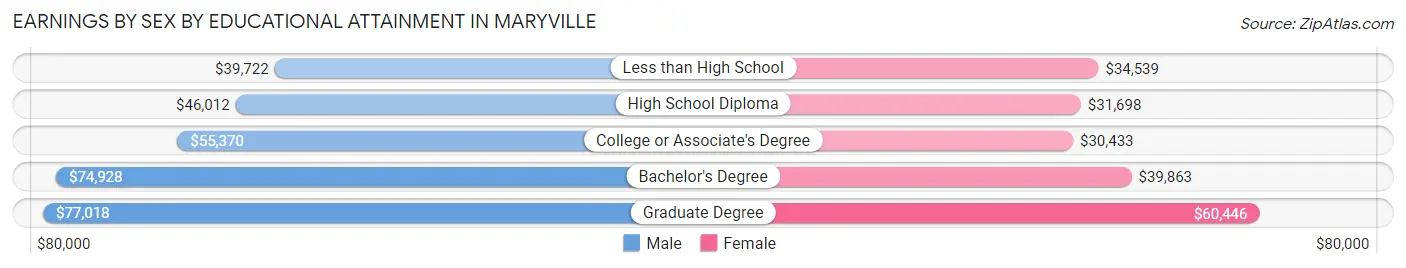
Earnings by Sex by Educational Attainment in Maryville
Average earnings in Maryville are $56,333 for men and $35,658 for women, a difference of 36.7%. Men with an educational attainment of graduate degree enjoy the highest average annual earnings of $77,018, while those with less than high school education earn the least with $39,722. Women with an educational attainment of graduate degree earn the most with the average annual earnings of $60,446, while those with college or associate's degree education have the smallest earnings of $30,433.
| Educational Attainment | Male Income | Female Income |
| Less than High School | $39,722 | $34,539 |
| High School Diploma | $46,012 | $31,698 |
| College or Associate's Degree | $55,370 | $30,433 |
| Bachelor's Degree | $74,928 | $39,863 |
| Graduate Degree | $77,018 | $60,446 |
| Total | $56,333 | $35,658 |
Family Income in Maryville
Family Income Brackets in Maryville
According to the Maryville family income data, there are 2,306 families falling into the $100,000 to $149,999 income range, which is the most common income bracket and makes up 27.7% of all families. Conversely, the $10,000 to $14,999 income bracket is the least frequent group with only 108 families (1.3%) belonging to this category.
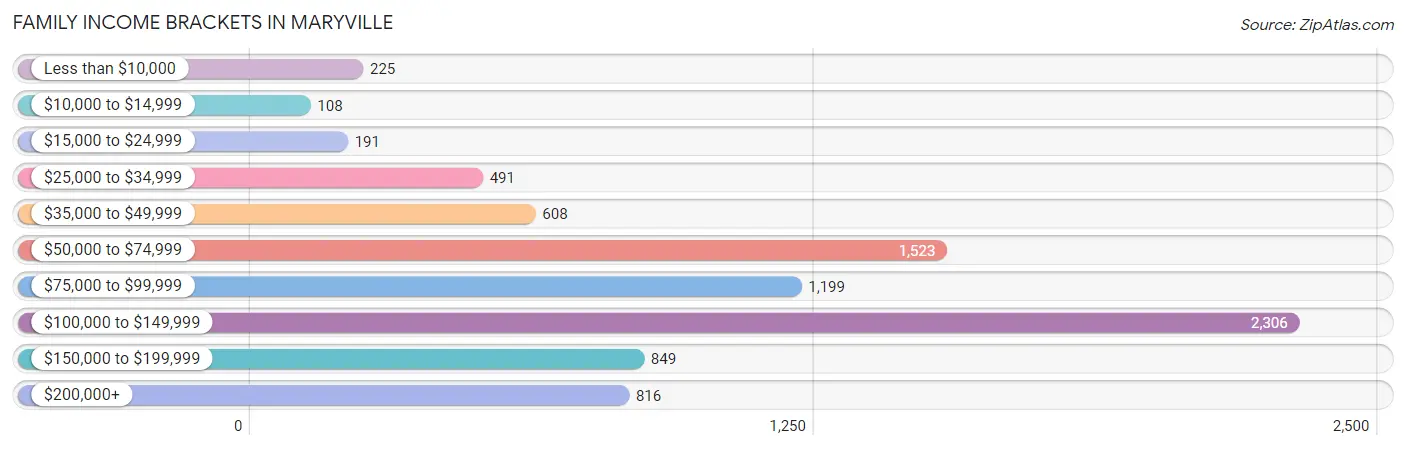
| Income Bracket | # Families | % Families |
| Less than $10,000 | 225 | 2.7% |
| $10,000 to $14,999 | 108 | 1.3% |
| $15,000 to $24,999 | 191 | 2.3% |
| $25,000 to $34,999 | 491 | 5.9% |
| $35,000 to $49,999 | 608 | 7.3% |
| $50,000 to $74,999 | 1,523 | 18.3% |
| $75,000 to $99,999 | 1,199 | 14.4% |
| $100,000 to $149,999 | 2,306 | 27.7% |
| $150,000 to $199,999 | 849 | 10.2% |
| $200,000+ | 816 | 9.8% |
Family Income by Famaliy Size in Maryville
4-person families (1,583 | 19.0%) account for the highest median family income in Maryville with $117,163 per family, while 2-person families (3,973 | 47.7%) have the highest median income of $39,390 per family member.
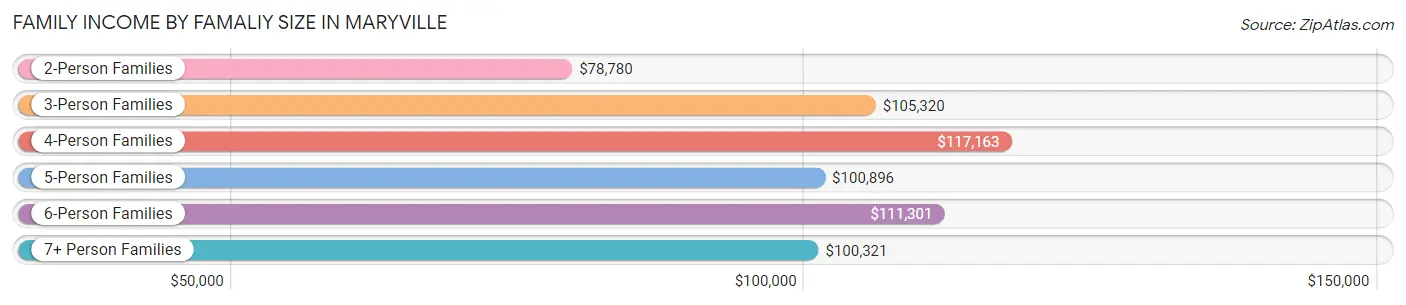
| Income Bracket | # Families | Median Income |
| 2-Person Families | 3,973 (47.7%) | $78,780 |
| 3-Person Families | 1,910 (23.0%) | $105,320 |
| 4-Person Families | 1,583 (19.0%) | $117,163 |
| 5-Person Families | 582 (7.0%) | $100,896 |
| 6-Person Families | 189 (2.3%) | $111,301 |
| 7+ Person Families | 87 (1.1%) | $100,321 |
| Total | 8,324 (100.0%) | $96,080 |
Family Income by Number of Earners in Maryville
The median family income in Maryville is $96,080, with families comprising 2 earners (3,327) having the highest median family income of $117,792, while families with 1 earner (2,420) have the lowest median family income of $59,327, accounting for 40.0% and 29.1% of families, respectively.
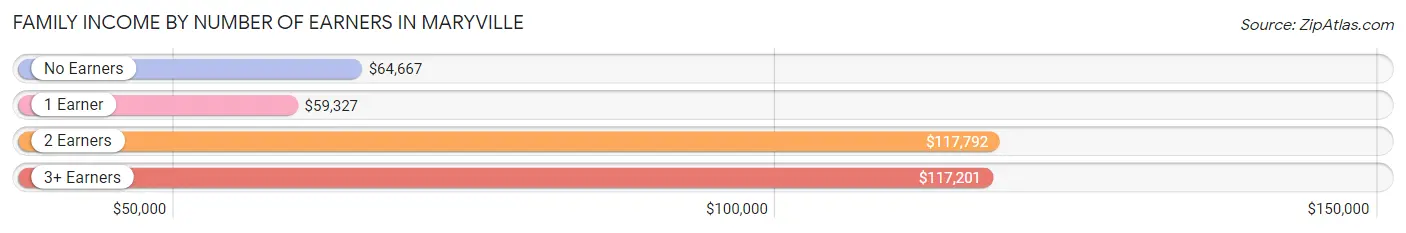
| Number of Earners | # Families | Median Income |
| No Earners | 1,340 (16.1%) | $64,667 |
| 1 Earner | 2,420 (29.1%) | $59,327 |
| 2 Earners | 3,327 (40.0%) | $117,792 |
| 3+ Earners | 1,237 (14.9%) | $117,201 |
| Total | 8,324 (100.0%) | $96,080 |
Household Income in Maryville
Household Income Brackets in Maryville
With 2,567 households falling in the category, the $100,000 to $149,999 income range is the most frequent in Maryville, accounting for 21.5% of all households. In contrast, only 430 households (3.6%) fall into the $10,000 to $14,999 income bracket, making it the least populous group.
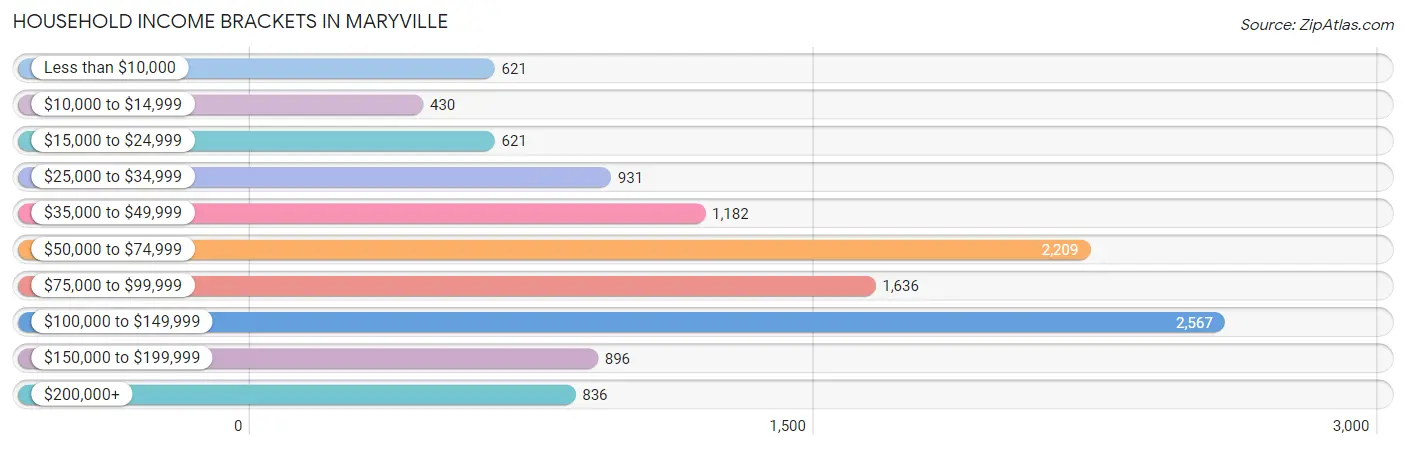
| Income Bracket | # Households | % Households |
| Less than $10,000 | 621 | 5.2% |
| $10,000 to $14,999 | 430 | 3.6% |
| $15,000 to $24,999 | 621 | 5.2% |
| $25,000 to $34,999 | 931 | 7.8% |
| $35,000 to $49,999 | 1,182 | 9.9% |
| $50,000 to $74,999 | 2,209 | 18.5% |
| $75,000 to $99,999 | 1,636 | 13.7% |
| $100,000 to $149,999 | 2,567 | 21.5% |
| $150,000 to $199,999 | 896 | 7.5% |
| $200,000+ | 836 | 7.0% |
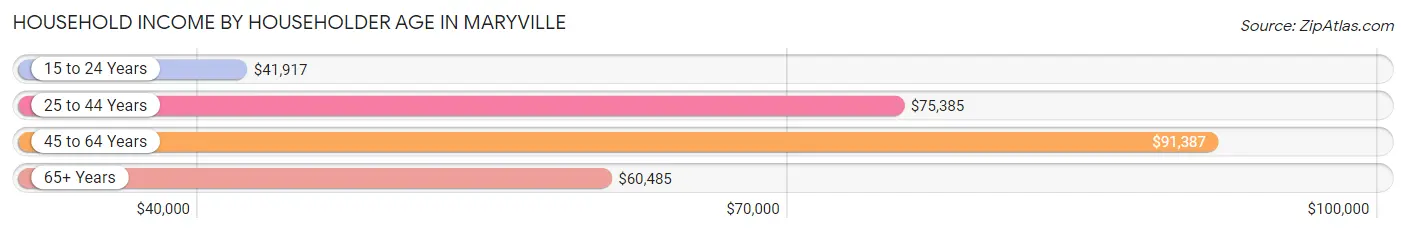
Household Income by Householder Age in Maryville
The median household income in Maryville is $74,610, with the highest median household income of $91,387 found in the 45 to 64 years age bracket for the primary householder. A total of 4,643 households (38.9%) fall into this category. Meanwhile, the 15 to 24 years age bracket for the primary householder has the lowest median household income of $41,917, with 371 households (3.1%) in this group.
| Income Bracket | # Households | Median Income |
| 15 to 24 Years | 371 (3.1%) | $41,917 |
| 25 to 44 Years | 3,304 (27.7%) | $75,385 |
| 45 to 64 Years | 4,643 (38.9%) | $91,387 |
| 65+ Years | 3,623 (30.3%) | $60,485 |
| Total | 11,941 (100.0%) | $74,610 |
Poverty in Maryville
Income Below Poverty by Sex and Age in Maryville
With 7.6% poverty level for males and 9.0% for females among the residents of Maryville, 5 year old males and under 5 year old females are the most vulnerable to poverty, with 94 males (48.4%) and 107 females (16.6%) in their respective age groups living below the poverty level.
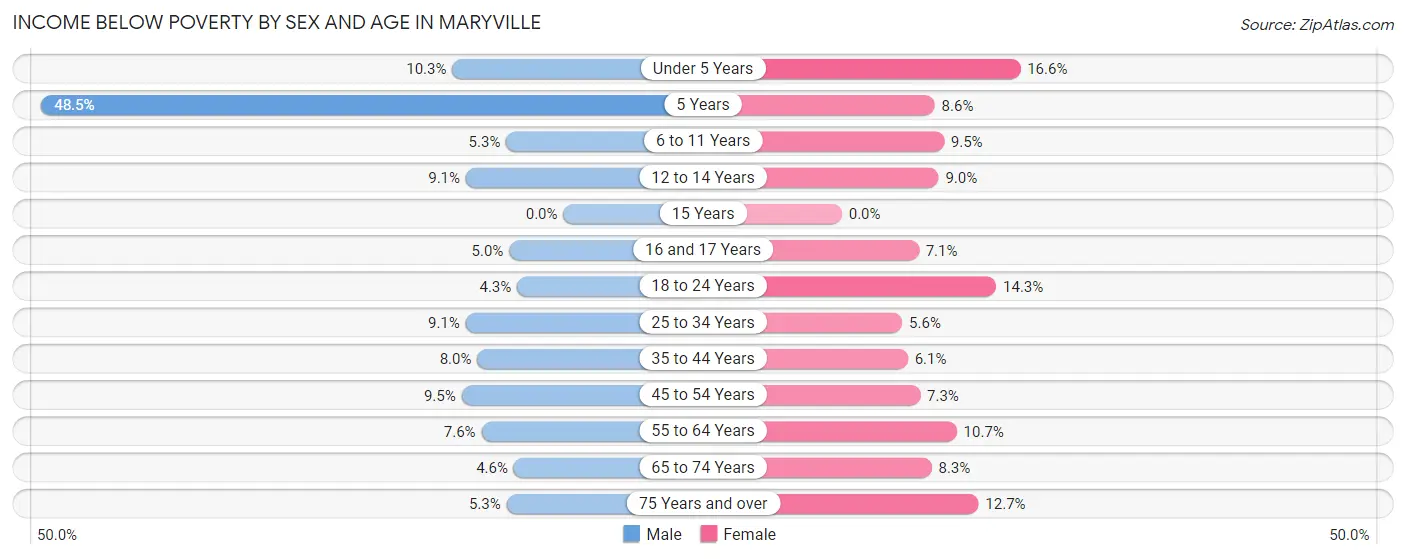
| Age Bracket | Male | Female |
| Under 5 Years | 79 (10.3%) | 107 (16.6%) |
| 5 Years | 94 (48.4%) | 35 (8.6%) |
| 6 to 11 Years | 57 (5.3%) | 99 (9.5%) |
| 12 to 14 Years | 54 (9.0%) | 47 (9.0%) |
| 15 Years | 0 (0.0%) | 0 (0.0%) |
| 16 and 17 Years | 29 (5.0%) | 38 (7.1%) |
| 18 to 24 Years | 60 (4.3%) | 162 (14.3%) |
| 25 to 34 Years | 148 (9.1%) | 107 (5.6%) |
| 35 to 44 Years | 140 (8.0%) | 117 (6.1%) |
| 45 to 54 Years | 192 (9.5%) | 167 (7.3%) |
| 55 to 64 Years | 139 (7.6%) | 208 (10.7%) |
| 65 to 74 Years | 66 (4.6%) | 141 (8.3%) |
| 75 Years and over | 48 (5.3%) | 181 (12.7%) |
| Total | 1,106 (7.6%) | 1,409 (9.0%) |
Income Above Poverty by Sex and Age in Maryville
According to the poverty statistics in Maryville, males aged 15 years and females aged 15 years are the age groups that are most secure financially, with 100.0% of males and 100.0% of females in these age groups living above the poverty line.
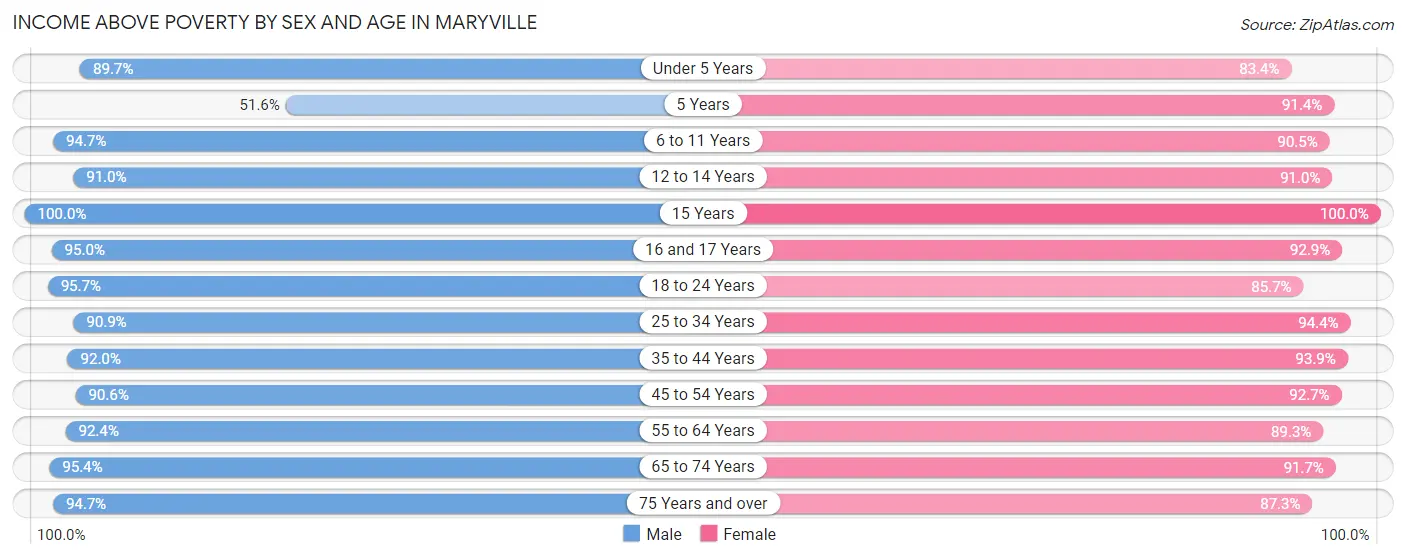
| Age Bracket | Male | Female |
| Under 5 Years | 687 (89.7%) | 539 (83.4%) |
| 5 Years | 100 (51.5%) | 371 (91.4%) |
| 6 to 11 Years | 1,018 (94.7%) | 946 (90.5%) |
| 12 to 14 Years | 543 (90.9%) | 477 (91.0%) |
| 15 Years | 266 (100.0%) | 225 (100.0%) |
| 16 and 17 Years | 548 (95.0%) | 494 (92.9%) |
| 18 to 24 Years | 1,337 (95.7%) | 969 (85.7%) |
| 25 to 34 Years | 1,483 (90.9%) | 1,805 (94.4%) |
| 35 to 44 Years | 1,613 (92.0%) | 1,795 (93.9%) |
| 45 to 54 Years | 1,839 (90.5%) | 2,130 (92.7%) |
| 55 to 64 Years | 1,689 (92.4%) | 1,743 (89.3%) |
| 65 to 74 Years | 1,369 (95.4%) | 1,552 (91.7%) |
| 75 Years and over | 862 (94.7%) | 1,247 (87.3%) |
| Total | 13,354 (92.3%) | 14,293 (91.0%) |
Income Below Poverty Among Married-Couple Families in Maryville
The poverty statistics for married-couple families in Maryville show that 3.1% or 201 of the total 6,485 families live below the poverty line. Families with 3 or 4 children have the highest poverty rate of 5.8%, comprising of 26 families. On the other hand, families with 5 or more children have the lowest poverty rate of 0.0%, which includes 0 families.
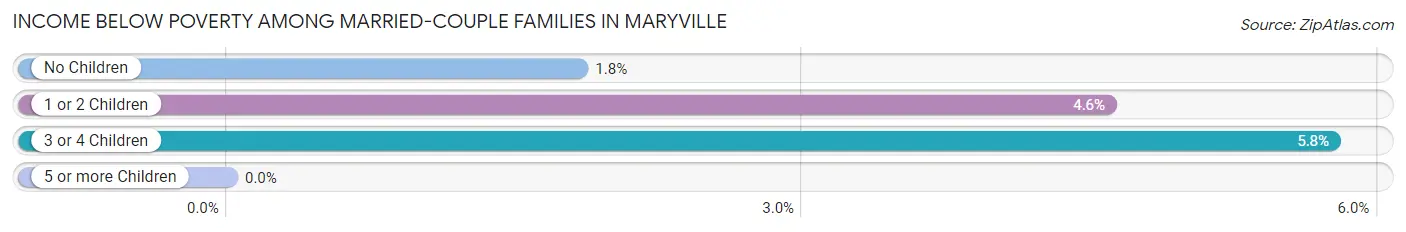
| Children | Above Poverty | Below Poverty |
| No Children | 3,541 (98.2%) | 66 (1.8%) |
| 1 or 2 Children | 2,264 (95.4%) | 109 (4.6%) |
| 3 or 4 Children | 425 (94.2%) | 26 (5.8%) |
| 5 or more Children | 54 (100.0%) | 0 (0.0%) |
| Total | 6,284 (96.9%) | 201 (3.1%) |
Income Below Poverty Among Single-Parent Households in Maryville
According to the poverty data in Maryville, 1.6% or 9 single-father households and 21.0% or 268 single-mother households are living below the poverty line. Among single-father households, those with 1 or 2 children have the highest poverty rate, with 9 households (4.6%) experiencing poverty. Likewise, among single-mother households, those with 5 or more children have the highest poverty rate, with 5 households (100.0%) falling below the poverty line.
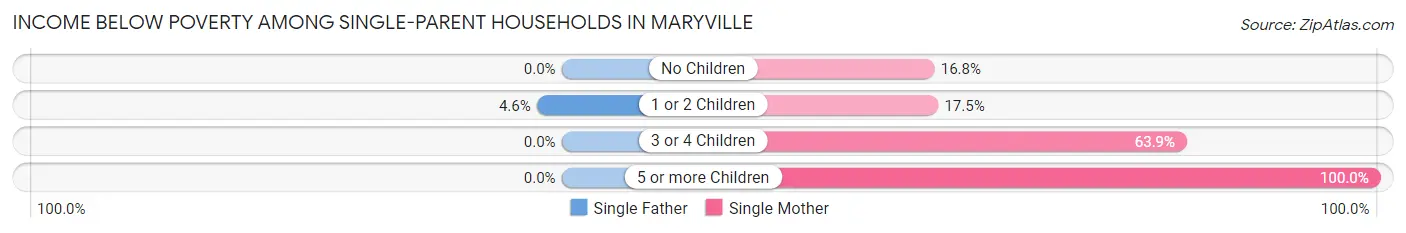
| Children | Single Father | Single Mother |
| No Children | 0 (0.0%) | 96 (16.8%) |
| 1 or 2 Children | 9 (4.6%) | 105 (17.5%) |
| 3 or 4 Children | 0 (0.0%) | 62 (63.9%) |
| 5 or more Children | 0 (0.0%) | 5 (100.0%) |
| Total | 9 (1.6%) | 268 (21.0%) |
Income Below Poverty Among Married-Couple vs Single-Parent Households in Maryville
The poverty data for Maryville shows that 201 of the married-couple family households (3.1%) and 277 of the single-parent households (15.1%) are living below the poverty level. Within the married-couple family households, those with 3 or 4 children have the highest poverty rate, with 26 households (5.8%) falling below the poverty line. Among the single-parent households, those with 5 or more children have the highest poverty rate, with 5 household (100.0%) living below poverty.
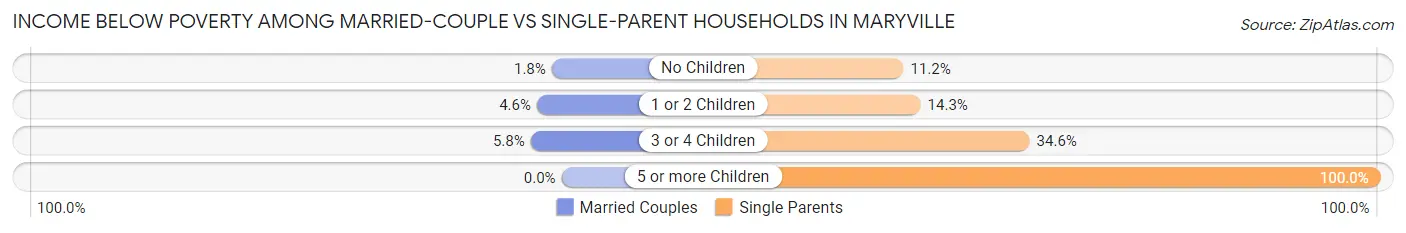
| Children | Married-Couple Families | Single-Parent Households |
| No Children | 66 (1.8%) | 96 (11.2%) |
| 1 or 2 Children | 109 (4.6%) | 114 (14.3%) |
| 3 or 4 Children | 26 (5.8%) | 62 (34.6%) |
| 5 or more Children | 0 (0.0%) | 5 (100.0%) |
| Total | 201 (3.1%) | 277 (15.1%) |
Race in Maryville
The most populous races in Maryville are White / Caucasian (28,799 | 90.3%), Two or more Races (1,478 | 4.6%), and Hispanic or Latino (1,025 | 3.2%).
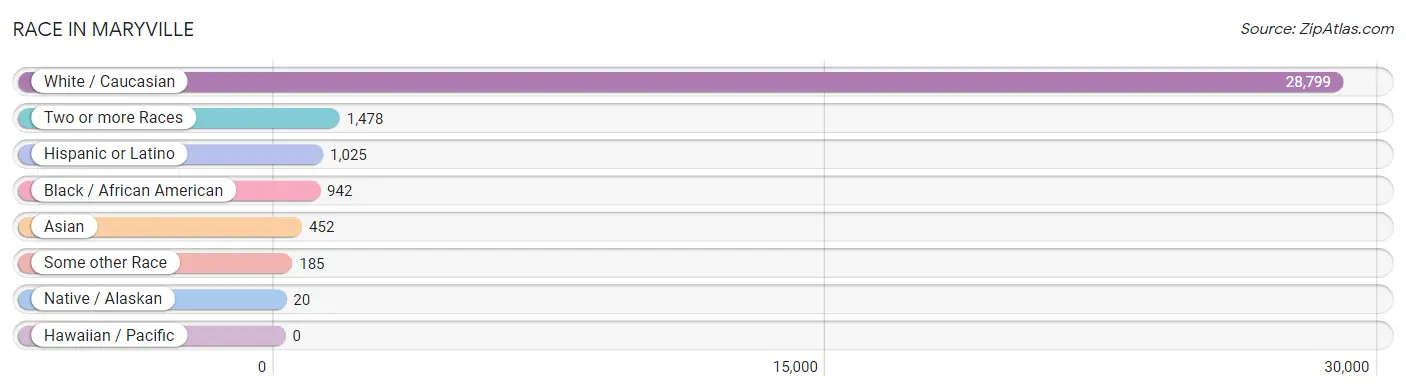
| Race | # Population | % Population |
| Asian | 452 | 1.4% |
| Black / African American | 942 | 3.0% |
| Hawaiian / Pacific | 0 | 0.0% |
| Hispanic or Latino | 1,025 | 3.2% |
| Native / Alaskan | 20 | 0.1% |
| White / Caucasian | 28,799 | 90.3% |
| Two or more Races | 1,478 | 4.6% |
| Some other Race | 185 | 0.6% |
| Total | 31,876 | 100.0% |
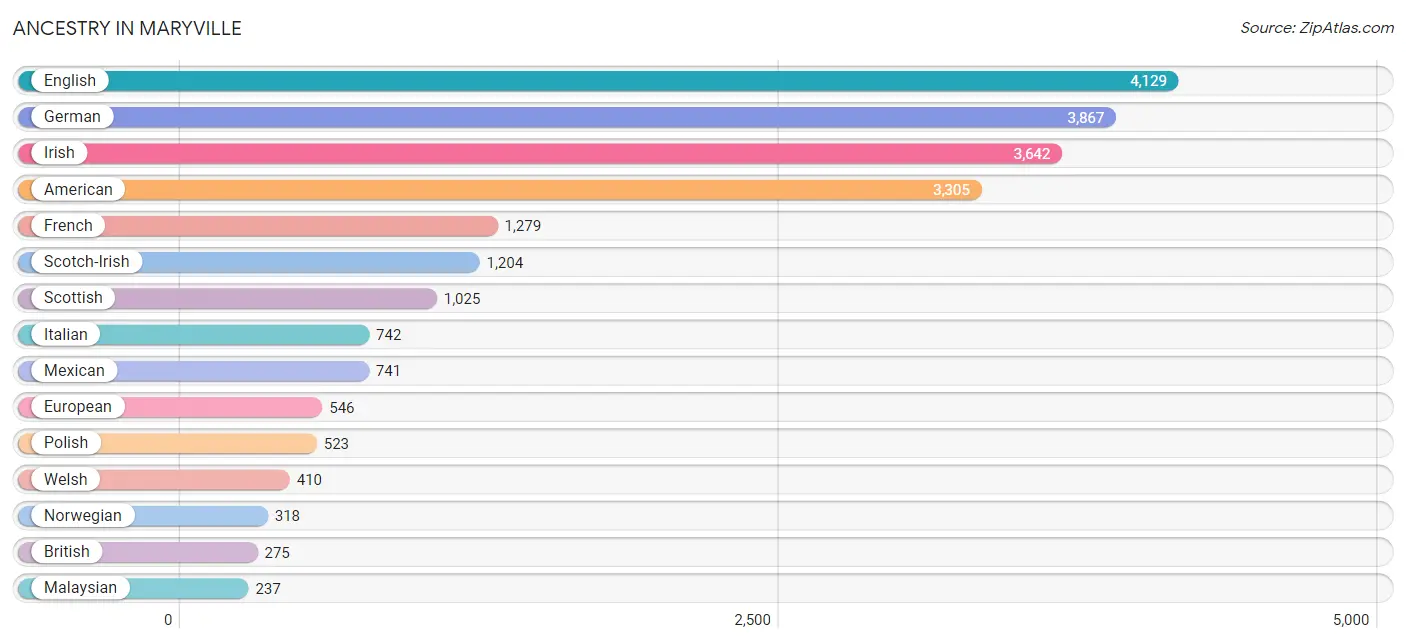
Ancestry in Maryville
The most populous ancestries reported in Maryville are English (4,129 | 13.0%), German (3,867 | 12.1%), Irish (3,642 | 11.4%), American (3,305 | 10.4%), and French (1,279 | 4.0%), together accounting for 50.9% of all Maryville residents.
| Ancestry | # Population | % Population |
| African | 10 | 0.0% |
| American | 3,305 | 10.4% |
| Apache | 11 | 0.0% |
| Arab | 35 | 0.1% |
| Argentinean | 8 | 0.0% |
| Austrian | 9 | 0.0% |
| Bhutanese | 76 | 0.2% |
| Brazilian | 49 | 0.2% |
| British | 275 | 0.9% |
| Burmese | 54 | 0.2% |
| Canadian | 6 | 0.0% |
| Central American | 111 | 0.4% |
| Cherokee | 106 | 0.3% |
| Choctaw | 3 | 0.0% |
| Czech | 91 | 0.3% |
| Danish | 30 | 0.1% |
| Dutch | 112 | 0.4% |
| Eastern European | 109 | 0.3% |
| English | 4,129 | 13.0% |
| European | 546 | 1.7% |
| Finnish | 25 | 0.1% |
| French | 1,279 | 4.0% |
| French Canadian | 192 | 0.6% |
| German | 3,867 | 12.1% |
| Greek | 186 | 0.6% |
| Guatemalan | 63 | 0.2% |
| Honduran | 17 | 0.1% |
| Hungarian | 70 | 0.2% |
| Indian (Asian) | 80 | 0.3% |
| Irish | 3,642 | 11.4% |
| Iroquois | 20 | 0.1% |
| Italian | 742 | 2.3% |
| Jordanian | 15 | 0.1% |
| Korean | 29 | 0.1% |
| Lumbee | 3 | 0.0% |
| Luxembourger | 15 | 0.1% |
| Malaysian | 237 | 0.7% |
| Mexican | 741 | 2.3% |
| Nicaraguan | 8 | 0.0% |
| Nigerian | 29 | 0.1% |
| Northern European | 57 | 0.2% |
| Norwegian | 318 | 1.0% |
| Pakistani | 47 | 0.2% |
| Palestinian | 4 | 0.0% |
| Polish | 523 | 1.6% |
| Portuguese | 37 | 0.1% |
| Puerto Rican | 119 | 0.4% |
| Russian | 58 | 0.2% |
| Salvadoran | 23 | 0.1% |
| Samoan | 18 | 0.1% |
| Scandinavian | 48 | 0.2% |
| Scotch-Irish | 1,204 | 3.8% |
| Scottish | 1,025 | 3.2% |
| Slovak | 7 | 0.0% |
| South African | 80 | 0.3% |
| South American | 8 | 0.0% |
| Spaniard | 14 | 0.0% |
| Subsaharan African | 119 | 0.4% |
| Swedish | 198 | 0.6% |
| Swiss | 19 | 0.1% |
| Syrian | 16 | 0.1% |
| Trinidadian and Tobagonian | 78 | 0.2% |
| Turkish | 15 | 0.1% |
| Welsh | 410 | 1.3% |
| Yugoslavian | 20 | 0.1% | View All 65 Rows |
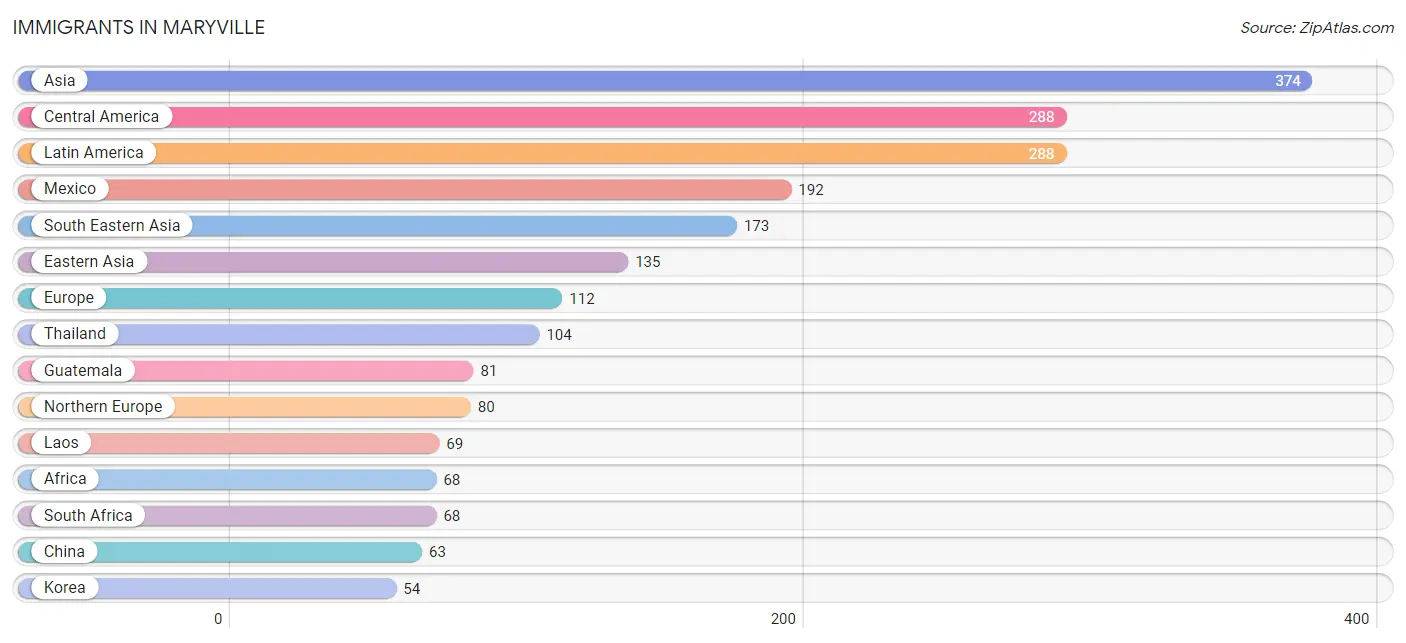
Immigrants in Maryville
The most numerous immigrant groups reported in Maryville came from Asia (374 | 1.2%), Central America (288 | 0.9%), Latin America (288 | 0.9%), Mexico (192 | 0.6%), and South Eastern Asia (173 | 0.5%), together accounting for 4.1% of all Maryville residents.
| Immigration Origin | # Population | % Population |
| Africa | 68 | 0.2% |
| Asia | 374 | 1.2% |
| Australia | 12 | 0.0% |
| Canada | 14 | 0.0% |
| Central America | 288 | 0.9% |
| China | 63 | 0.2% |
| Eastern Asia | 135 | 0.4% |
| Eastern Europe | 13 | 0.0% |
| El Salvador | 5 | 0.0% |
| England | 39 | 0.1% |
| Europe | 112 | 0.4% |
| Germany | 19 | 0.1% |
| Guatemala | 81 | 0.3% |
| Honduras | 10 | 0.0% |
| Japan | 18 | 0.1% |
| Korea | 54 | 0.2% |
| Laos | 69 | 0.2% |
| Latin America | 288 | 0.9% |
| Mexico | 192 | 0.6% |
| Northern Europe | 80 | 0.3% |
| Oceania | 12 | 0.0% |
| Pakistan | 33 | 0.1% |
| Russia | 13 | 0.0% |
| Scotland | 13 | 0.0% |
| South Africa | 68 | 0.2% |
| South Central Asia | 33 | 0.1% |
| South Eastern Asia | 173 | 0.5% |
| Thailand | 104 | 0.3% |
| Turkey | 8 | 0.0% |
| Western Asia | 33 | 0.1% |
| Western Europe | 19 | 0.1% | View All 31 Rows |
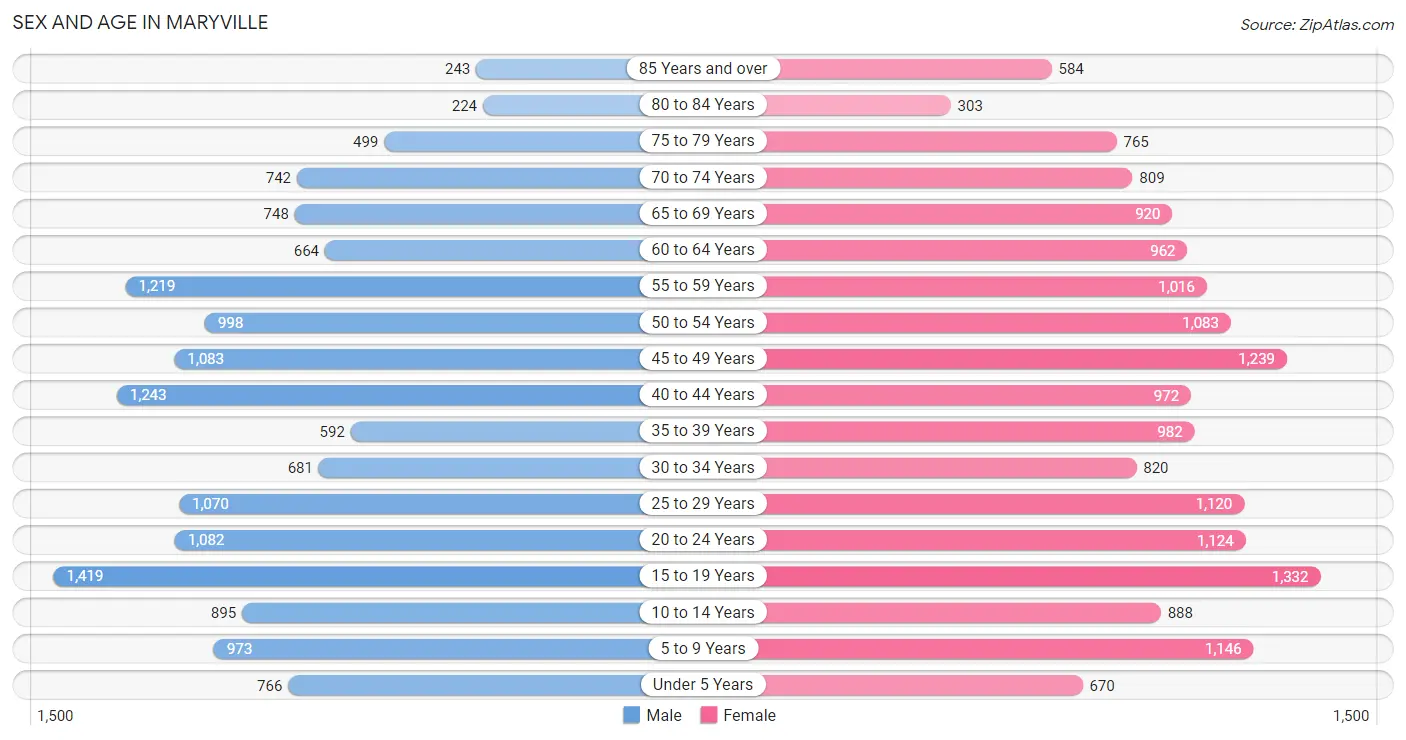
Sex and Age in Maryville
Sex and Age in Maryville
The most populous age groups in Maryville are 15 to 19 Years (1,419 | 9.4%) for men and 15 to 19 Years (1,332 | 8.0%) for women.
| Age Bracket | Male | Female |
| Under 5 Years | 766 (5.1%) | 670 (4.0%) |
| 5 to 9 Years | 973 (6.4%) | 1,146 (6.9%) |
| 10 to 14 Years | 895 (5.9%) | 888 (5.3%) |
| 15 to 19 Years | 1,419 (9.4%) | 1,332 (8.0%) |
| 20 to 24 Years | 1,082 (7.1%) | 1,124 (6.7%) |
| 25 to 29 Years | 1,070 (7.1%) | 1,120 (6.7%) |
| 30 to 34 Years | 681 (4.5%) | 820 (4.9%) |
| 35 to 39 Years | 592 (3.9%) | 982 (5.9%) |
| 40 to 44 Years | 1,243 (8.2%) | 972 (5.8%) |
| 45 to 49 Years | 1,083 (7.1%) | 1,239 (7.4%) |
| 50 to 54 Years | 998 (6.6%) | 1,083 (6.5%) |
| 55 to 59 Years | 1,219 (8.1%) | 1,016 (6.1%) |
| 60 to 64 Years | 664 (4.4%) | 962 (5.8%) |
| 65 to 69 Years | 748 (4.9%) | 920 (5.5%) |
| 70 to 74 Years | 742 (4.9%) | 809 (4.8%) |
| 75 to 79 Years | 499 (3.3%) | 765 (4.6%) |
| 80 to 84 Years | 224 (1.5%) | 303 (1.8%) |
| 85 Years and over | 243 (1.6%) | 584 (3.5%) |
| Total | 15,141 (100.0%) | 16,735 (100.0%) |
Families and Households in Maryville
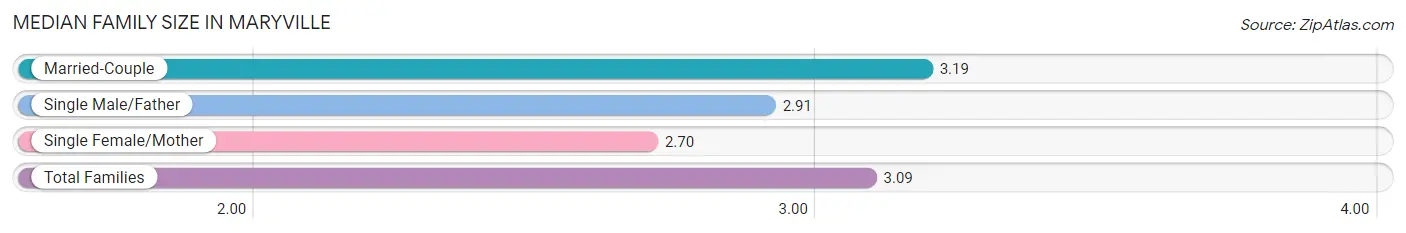
Median Family Size in Maryville
The median family size in Maryville is 3.09 persons per family, with married-couple families (6,485 | 77.9%) accounting for the largest median family size of 3.19 persons per family. On the other hand, single female/mother families (1,275 | 15.3%) represent the smallest median family size with 2.70 persons per family.
| Family Type | # Families | Family Size |
| Married-Couple | 6,485 (77.9%) | 3.19 |
| Single Male/Father | 564 (6.8%) | 2.91 |
| Single Female/Mother | 1,275 (15.3%) | 2.70 |
| Total Families | 8,324 (100.0%) | 3.09 |
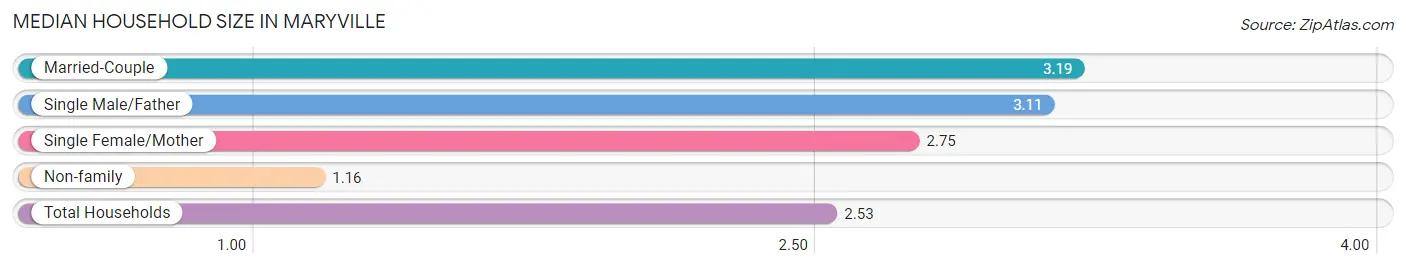
Median Household Size in Maryville
The median household size in Maryville is 2.53 persons per household, with married-couple households (6,485 | 54.3%) accounting for the largest median household size of 3.19 persons per household. non-family households (3,617 | 30.3%) represent the smallest median household size with 1.16 persons per household.
| Household Type | # Households | Household Size |
| Married-Couple | 6,485 (54.3%) | 3.19 |
| Single Male/Father | 564 (4.7%) | 3.11 |
| Single Female/Mother | 1,275 (10.7%) | 2.75 |
| Non-family | 3,617 (30.3%) | 1.16 |
| Total Households | 11,941 (100.0%) | 2.53 |
Household Size by Marriage Status in Maryville
Out of a total of 11,941 households in Maryville, 8,324 (69.7%) are family households, while 3,617 (30.3%) are nonfamily households. The most numerous type of family households are 2-person households, comprising 3,858, and the most common type of nonfamily households are 1-person households, comprising 3,239.
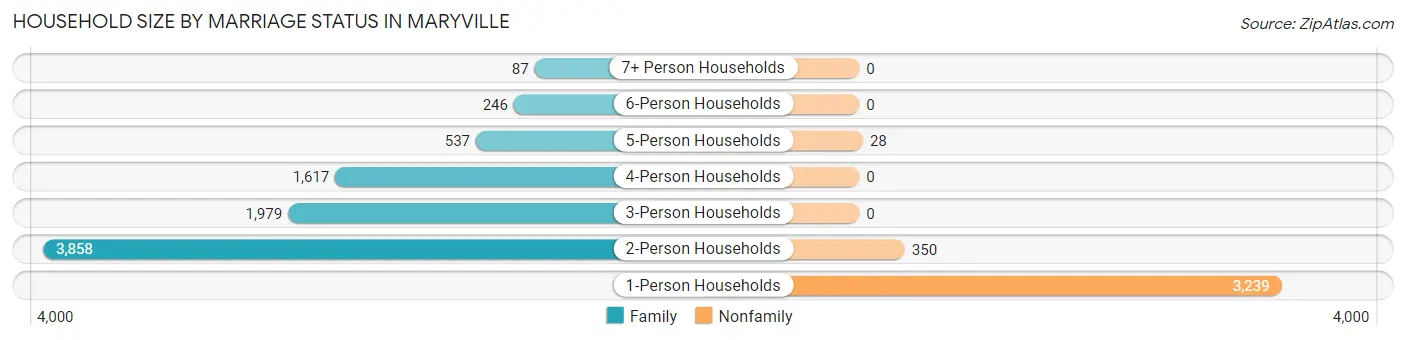
| Household Size | Family Households | Nonfamily Households |
| 1-Person Households | - | 3,239 (27.1%) |
| 2-Person Households | 3,858 (32.3%) | 350 (2.9%) |
| 3-Person Households | 1,979 (16.6%) | 0 (0.0%) |
| 4-Person Households | 1,617 (13.5%) | 0 (0.0%) |
| 5-Person Households | 537 (4.5%) | 28 (0.2%) |
| 6-Person Households | 246 (2.1%) | 0 (0.0%) |
| 7+ Person Households | 87 (0.7%) | 0 (0.0%) |
| Total | 8,324 (69.7%) | 3,617 (30.3%) |
Female Fertility in Maryville
Fertility by Age in Maryville
Average fertility rate in Maryville is 24.0 births per 1,000 women. Women in the age bracket of 20 to 34 years have the highest fertility rate with 61.0 births per 1,000 women. Women in the age bracket of 20 to 34 years acount for 100.0% of all women with births.
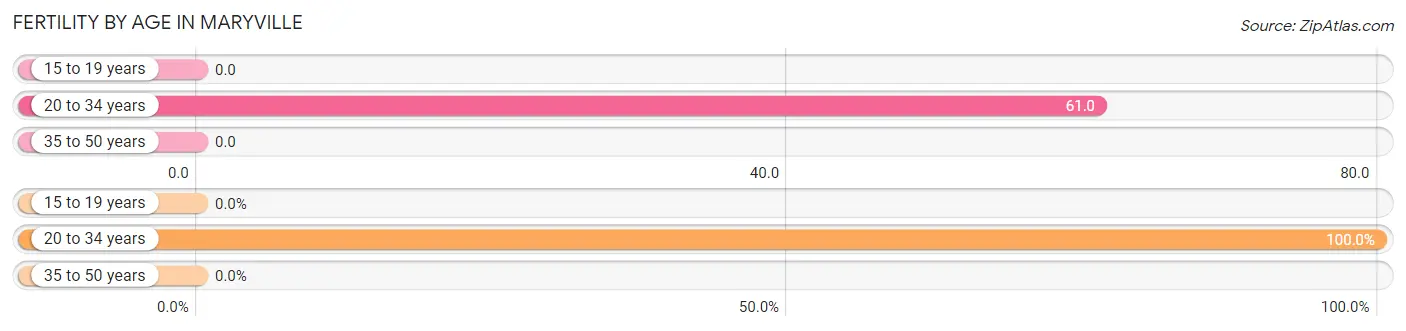
| Age Bracket | Women with Births | Births / 1,000 Women |
| 15 to 19 years | 0 (0.0%) | 0.0 |
| 20 to 34 years | 188 (100.0%) | 61.0 |
| 35 to 50 years | 0 (0.0%) | 0.0 |
| Total | 188 (100.0%) | 24.0 |
Fertility by Age by Marriage Status in Maryville
62.8% of women with births (188) in Maryville are married. The highest percentage of unmarried women with births falls into 20 to 34 years age bracket with 37.2% of them unmarried at the time of birth, while the lowest percentage of unmarried women with births belong to 20 to 34 years age bracket with 37.2% of them unmarried.
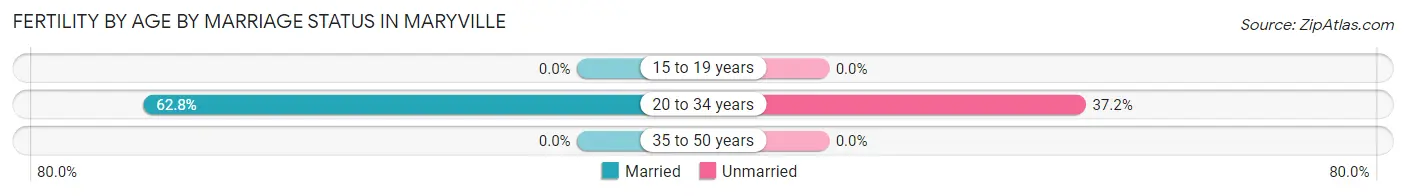
| Age Bracket | Married | Unmarried |
| 15 to 19 years | 0 (0.0%) | 0 (0.0%) |
| 20 to 34 years | 118 (62.8%) | 70 (37.2%) |
| 35 to 50 years | 0 (0.0%) | 0 (0.0%) |
| Total | 118 (62.8%) | 70 (37.2%) |
Fertility by Education in Maryville
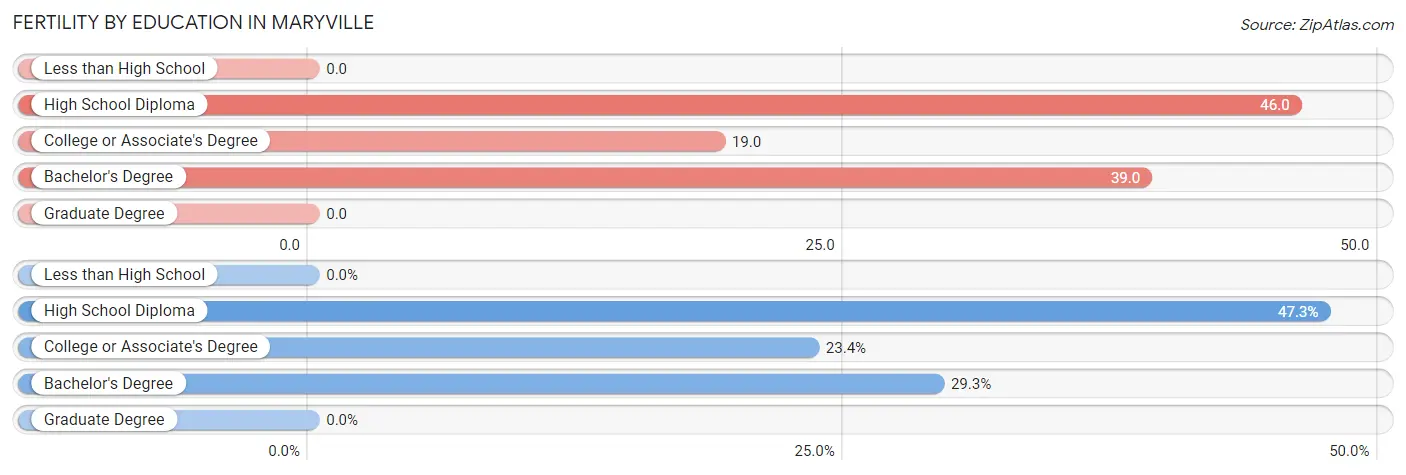
| Educational Attainment | Women with Births | Births / 1,000 Women |
| Less than High School | 0 (0.0%) | 0.0 |
| High School Diploma | 89 (47.3%) | 46.0 |
| College or Associate's Degree | 44 (23.4%) | 19.0 |
| Bachelor's Degree | 55 (29.3%) | 39.0 |
| Graduate Degree | 0 (0.0%) | 0.0 |
| Total | 188 (100.0%) | 24.0 |
Fertility by Education by Marriage Status in Maryville
37.2% of women with births in Maryville are unmarried. Women with the educational attainment of college or associate's degree are most likely to be married with 100.0% of them married at childbirth, while women with the educational attainment of high school diploma are least likely to be married with 78.6% of them unmarried at childbirth.
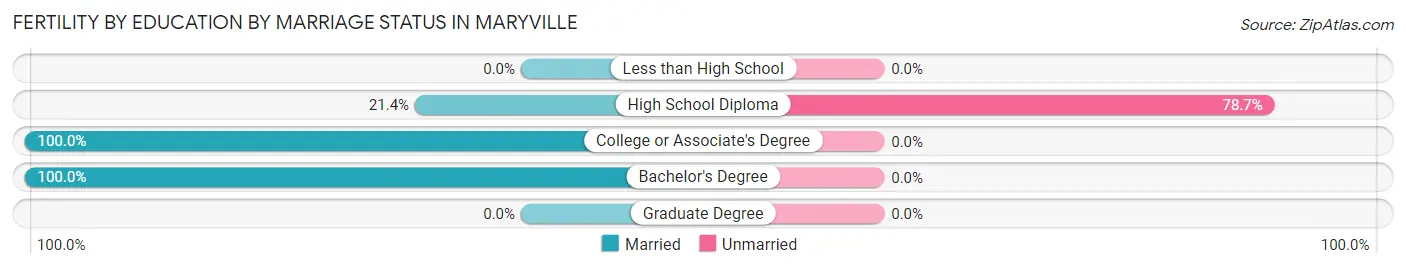
| Educational Attainment | Married | Unmarried |
| Less than High School | 0 (0.0%) | 0 (0.0%) |
| High School Diploma | 19 (21.3%) | 70 (78.6%) |
| College or Associate's Degree | 44 (100.0%) | 0 (0.0%) |
| Bachelor's Degree | 55 (100.0%) | 0 (0.0%) |
| Graduate Degree | 0 (0.0%) | 0 (0.0%) |
| Total | 118 (62.8%) | 70 (37.2%) |
Employment Characteristics in Maryville
Employment by Class of Employer in Maryville
Among the 15,001 employed individuals in Maryville, private company employees (9,955 | 66.4%), not-for-profit organizations (1,539 | 10.3%), and local government employees (1,462 | 9.8%) make up the most common classes of employment.
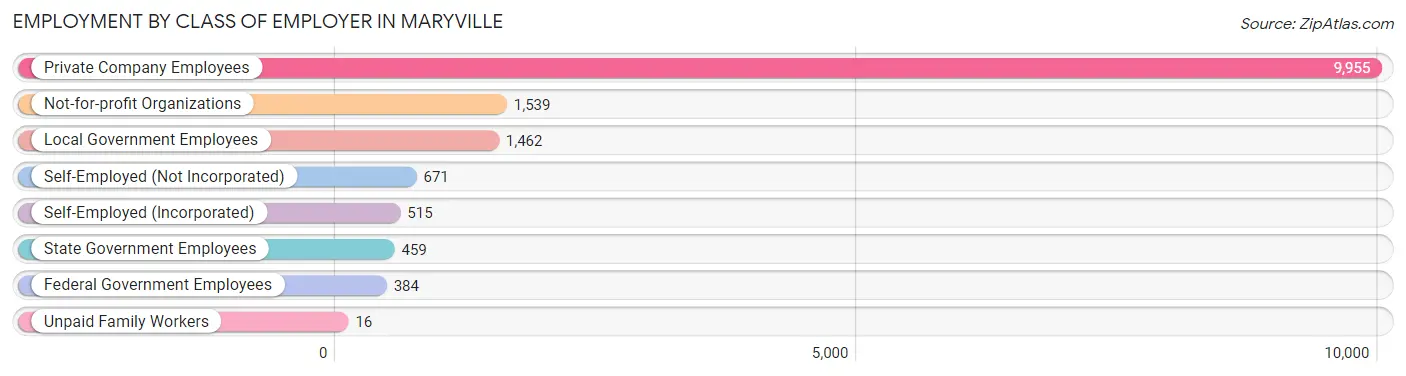
| Employer Class | # Employees | % Employees |
| Private Company Employees | 9,955 | 66.4% |
| Self-Employed (Incorporated) | 515 | 3.4% |
| Self-Employed (Not Incorporated) | 671 | 4.5% |
| Not-for-profit Organizations | 1,539 | 10.3% |
| Local Government Employees | 1,462 | 9.8% |
| State Government Employees | 459 | 3.1% |
| Federal Government Employees | 384 | 2.6% |
| Unpaid Family Workers | 16 | 0.1% |
| Total | 15,001 | 100.0% |
Employment Status by Age in Maryville
According to the labor force statistics for Maryville, out of the total population over 16 years of age (26,047), 59.8% or 15,576 individuals are in the labor force, with 2.8% or 436 of them unemployed. The age group with the highest labor force participation rate is 25 to 29 years, with 84.7% or 1,855 individuals in the labor force. Within the labor force, the 16 to 19 years age range has the highest percentage of unemployed individuals, with 11.7% or 82 of them being unemployed.
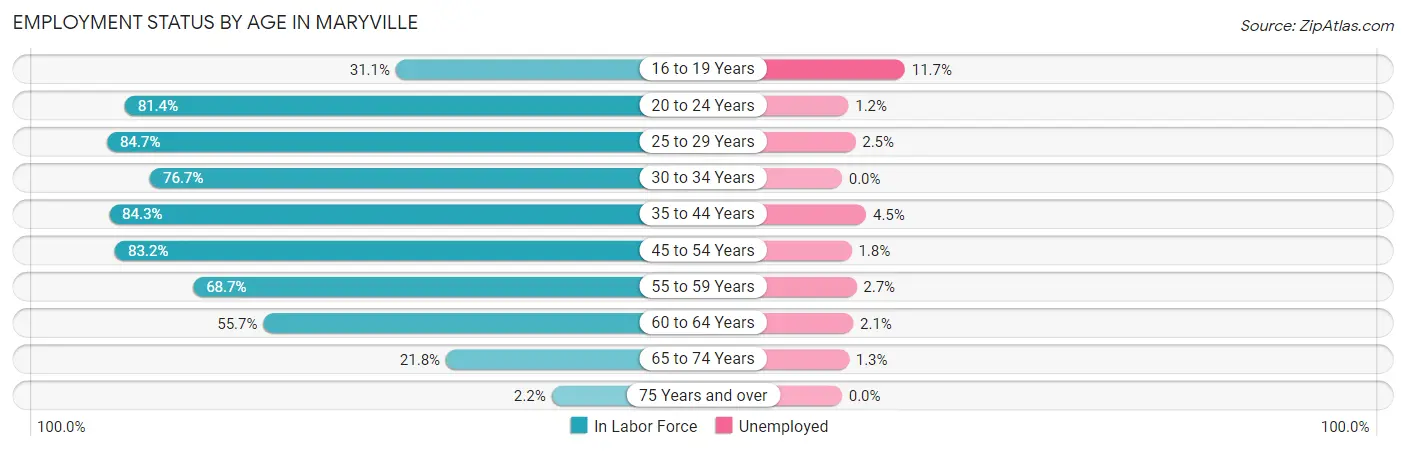
| Age Bracket | In Labor Force | Unemployed |
| 16 to 19 Years | 703 (31.1%) | 82 (11.7%) |
| 20 to 24 Years | 1,796 (81.4%) | 22 (1.2%) |
| 25 to 29 Years | 1,855 (84.7%) | 46 (2.5%) |
| 30 to 34 Years | 1,151 (76.7%) | 0 (0.0%) |
| 35 to 44 Years | 3,194 (84.3%) | 144 (4.5%) |
| 45 to 54 Years | 3,663 (83.2%) | 66 (1.8%) |
| 55 to 59 Years | 1,535 (68.7%) | 41 (2.7%) |
| 60 to 64 Years | 906 (55.7%) | 19 (2.1%) |
| 65 to 74 Years | 702 (21.8%) | 9 (1.3%) |
| 75 Years and over | 58 (2.2%) | 0 (0.0%) |
| Total | 15,576 (59.8%) | 436 (2.8%) |
Employment Status by Educational Attainment in Maryville
According to labor force statistics for Maryville, 78.2% of individuals (12,312) out of the total population between 25 and 64 years of age (15,744) are in the labor force, with 2.6% or 320 of them being unemployed. The group with the highest labor force participation rate are those with the educational attainment of bachelor's degree or higher, with 87.4% or 5,055 individuals in the labor force. Within the labor force, individuals with high school diploma education have the highest percentage of unemployment, with 4.9% or 154 of them being unemployed.
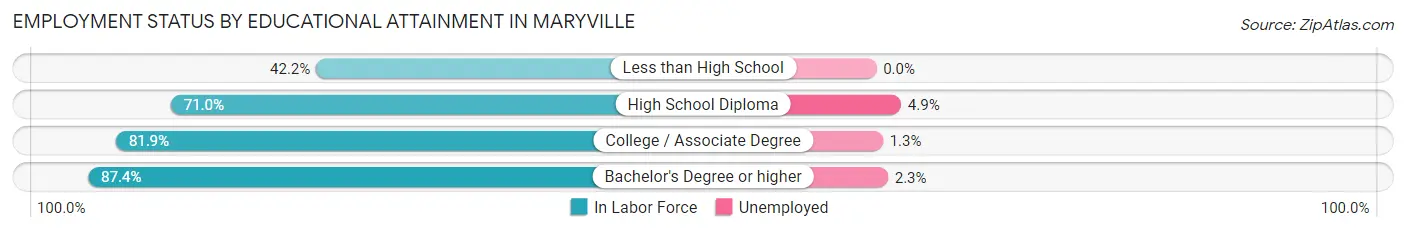
| Educational Attainment | In Labor Force | Unemployed |
| Less than High School | 445 (42.2%) | 0 (0.0%) |
| High School Diploma | 3,151 (71.0%) | 217 (4.9%) |
| College / Associate Degree | 3,659 (81.9%) | 58 (1.3%) |
| Bachelor's Degree or higher | 5,055 (87.4%) | 133 (2.3%) |
| Total | 12,312 (78.2%) | 409 (2.6%) |
Employment Occupations by Sex in Maryville
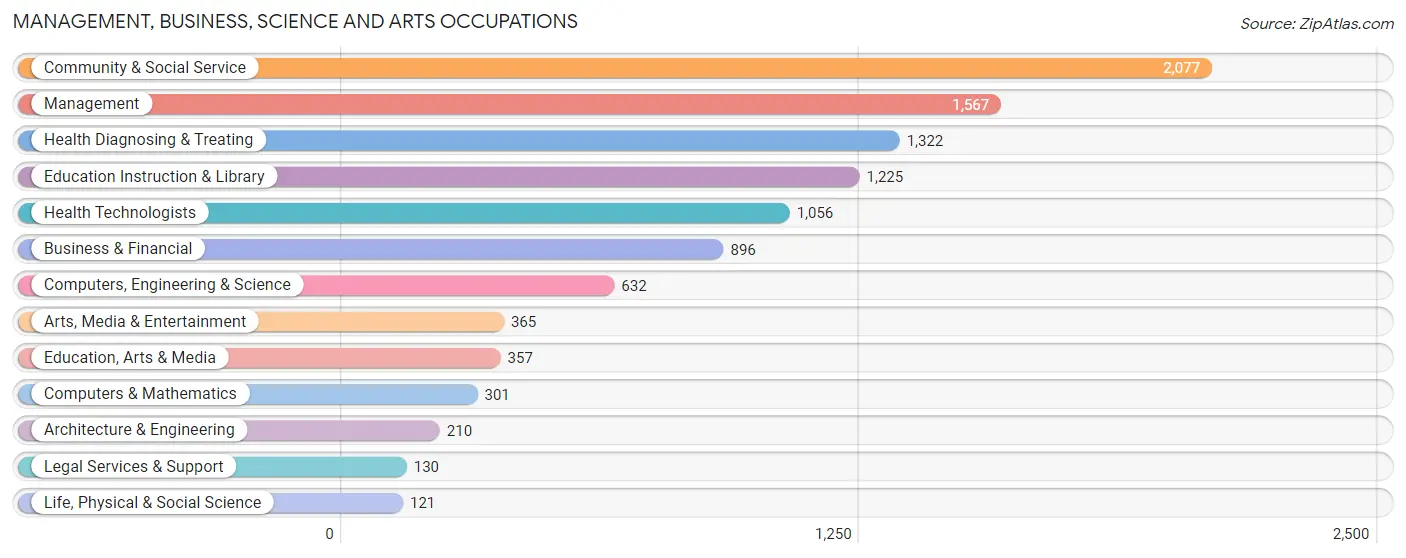
Management, Business, Science and Arts Occupations
The most common Management, Business, Science and Arts occupations in Maryville are Community & Social Service (2,077 | 13.8%), Management (1,567 | 10.4%), Health Diagnosing & Treating (1,322 | 8.8%), Education Instruction & Library (1,225 | 8.1%), and Health Technologists (1,056 | 7.0%).
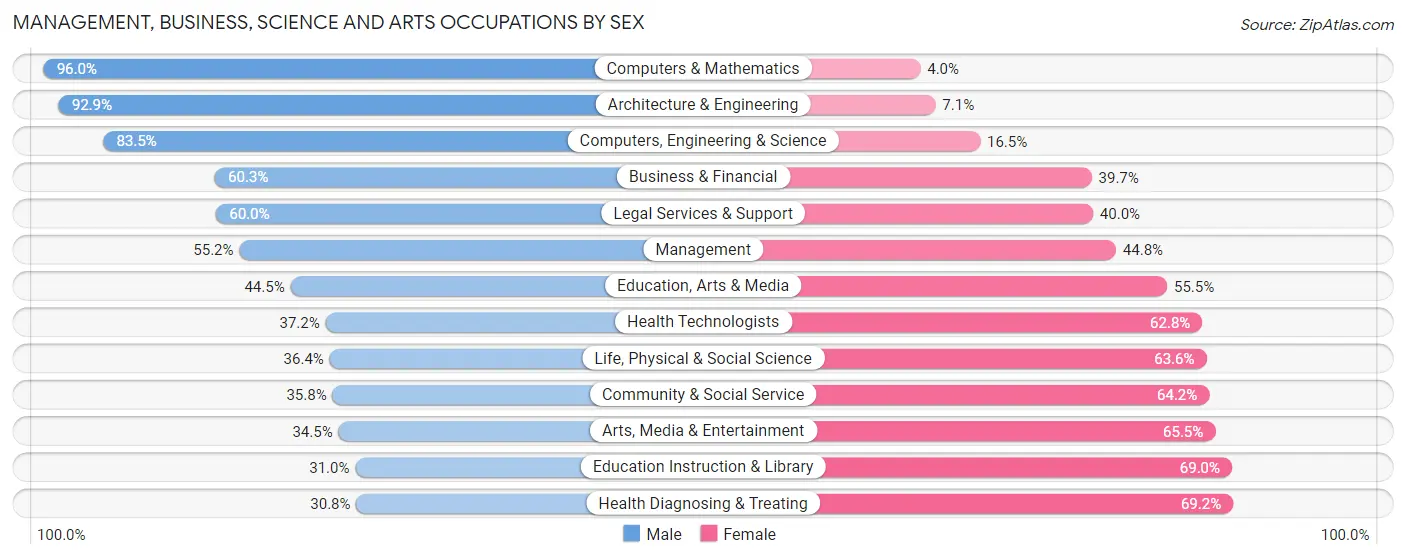
Management, Business, Science and Arts Occupations by Sex
Within the Management, Business, Science and Arts occupations in Maryville, the most male-oriented occupations are Computers & Mathematics (96.0%), Architecture & Engineering (92.9%), and Computers, Engineering & Science (83.5%), while the most female-oriented occupations are Health Diagnosing & Treating (69.2%), Education Instruction & Library (69.0%), and Arts, Media & Entertainment (65.5%).
| Occupation | Male | Female |
| Management | 865 (55.2%) | 702 (44.8%) |
| Business & Financial | 540 (60.3%) | 356 (39.7%) |
| Computers, Engineering & Science | 528 (83.5%) | 104 (16.5%) |
| Computers & Mathematics | 289 (96.0%) | 12 (4.0%) |
| Architecture & Engineering | 195 (92.9%) | 15 (7.1%) |
| Life, Physical & Social Science | 44 (36.4%) | 77 (63.6%) |
| Community & Social Service | 743 (35.8%) | 1,334 (64.2%) |
| Education, Arts & Media | 159 (44.5%) | 198 (55.5%) |
| Legal Services & Support | 78 (60.0%) | 52 (40.0%) |
| Education Instruction & Library | 380 (31.0%) | 845 (69.0%) |
| Arts, Media & Entertainment | 126 (34.5%) | 239 (65.5%) |
| Health Diagnosing & Treating | 407 (30.8%) | 915 (69.2%) |
| Health Technologists | 393 (37.2%) | 663 (62.8%) |
| Total (Category) | 3,083 (47.5%) | 3,411 (52.5%) |
| Total (Overall) | 7,559 (50.2%) | 7,486 (49.8%) |
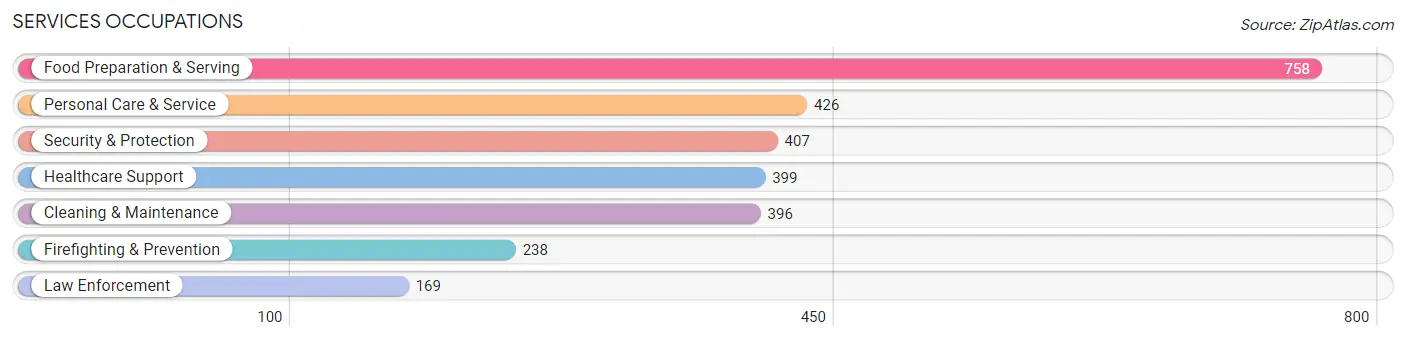
Services Occupations
The most common Services occupations in Maryville are Food Preparation & Serving (758 | 5.0%), Personal Care & Service (426 | 2.8%), Security & Protection (407 | 2.7%), Healthcare Support (399 | 2.6%), and Cleaning & Maintenance (396 | 2.6%).
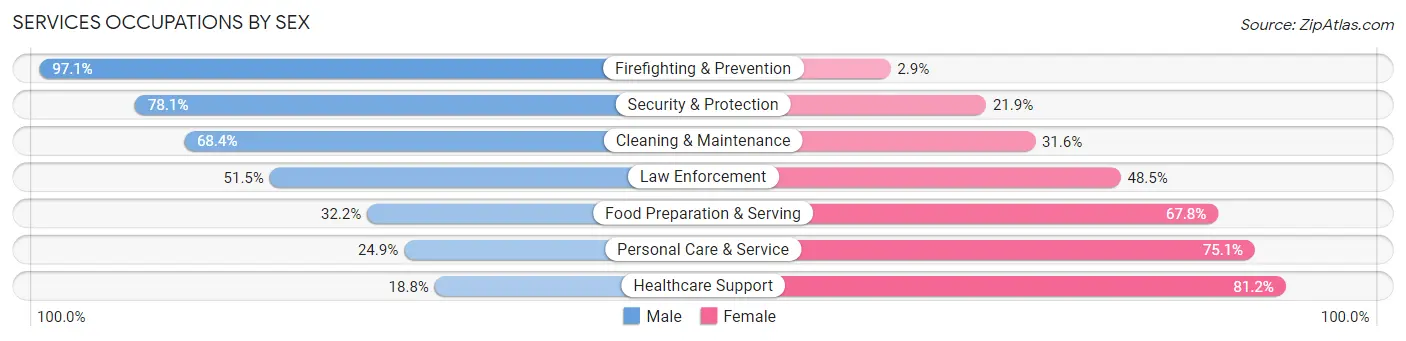
Services Occupations by Sex
Within the Services occupations in Maryville, the most male-oriented occupations are Firefighting & Prevention (97.1%), Security & Protection (78.1%), and Cleaning & Maintenance (68.4%), while the most female-oriented occupations are Healthcare Support (81.2%), Personal Care & Service (75.1%), and Food Preparation & Serving (67.8%).
| Occupation | Male | Female |
| Healthcare Support | 75 (18.8%) | 324 (81.2%) |
| Security & Protection | 318 (78.1%) | 89 (21.9%) |
| Firefighting & Prevention | 231 (97.1%) | 7 (2.9%) |
| Law Enforcement | 87 (51.5%) | 82 (48.5%) |
| Food Preparation & Serving | 244 (32.2%) | 514 (67.8%) |
| Cleaning & Maintenance | 271 (68.4%) | 125 (31.6%) |
| Personal Care & Service | 106 (24.9%) | 320 (75.1%) |
| Total (Category) | 1,014 (42.5%) | 1,372 (57.5%) |
| Total (Overall) | 7,559 (50.2%) | 7,486 (49.8%) |
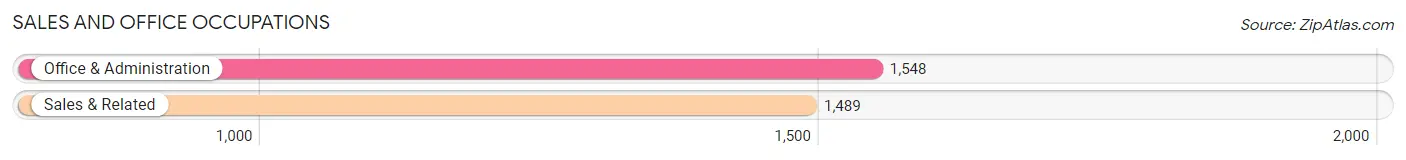
Sales and Office Occupations
The most common Sales and Office occupations in Maryville are Office & Administration (1,548 | 10.3%), and Sales & Related (1,489 | 9.9%).
Sales and Office Occupations by Sex
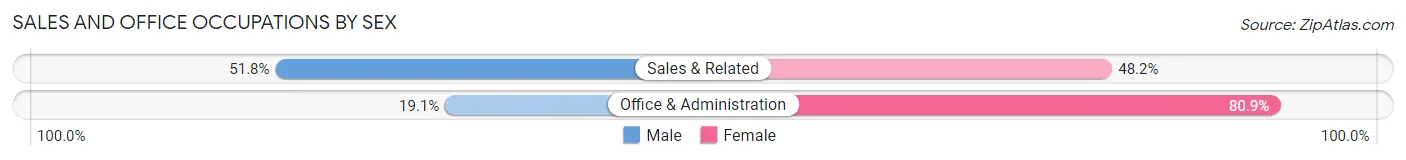
| Occupation | Male | Female |
| Sales & Related | 771 (51.8%) | 718 (48.2%) |
| Office & Administration | 296 (19.1%) | 1,252 (80.9%) |
| Total (Category) | 1,067 (35.1%) | 1,970 (64.9%) |
| Total (Overall) | 7,559 (50.2%) | 7,486 (49.8%) |
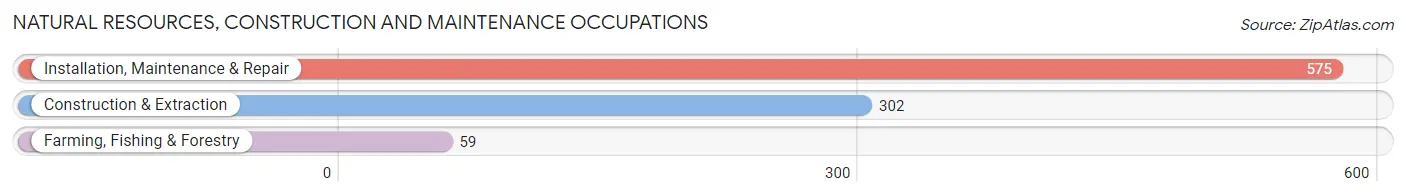
Natural Resources, Construction and Maintenance Occupations
The most common Natural Resources, Construction and Maintenance occupations in Maryville are Installation, Maintenance & Repair (575 | 3.8%), Construction & Extraction (302 | 2.0%), and Farming, Fishing & Forestry (59 | 0.4%).
Natural Resources, Construction and Maintenance Occupations by Sex
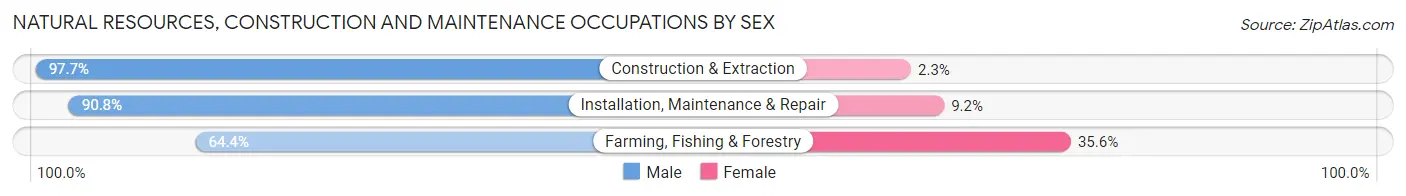
| Occupation | Male | Female |
| Farming, Fishing & Forestry | 38 (64.4%) | 21 (35.6%) |
| Construction & Extraction | 295 (97.7%) | 7 (2.3%) |
| Installation, Maintenance & Repair | 522 (90.8%) | 53 (9.2%) |
| Total (Category) | 855 (91.3%) | 81 (8.6%) |
| Total (Overall) | 7,559 (50.2%) | 7,486 (49.8%) |
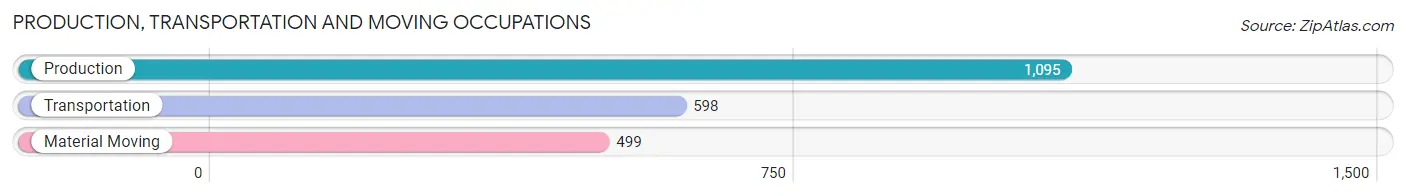
Production, Transportation and Moving Occupations
The most common Production, Transportation and Moving occupations in Maryville are Production (1,095 | 7.3%), Transportation (598 | 4.0%), and Material Moving (499 | 3.3%).
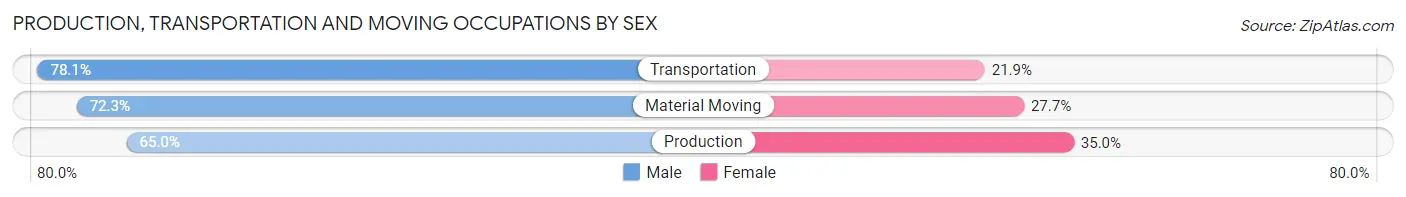
Production, Transportation and Moving Occupations by Sex
| Occupation | Male | Female |
| Production | 712 (65.0%) | 383 (35.0%) |
| Transportation | 467 (78.1%) | 131 (21.9%) |
| Material Moving | 361 (72.3%) | 138 (27.7%) |
| Total (Category) | 1,540 (70.3%) | 652 (29.7%) |
| Total (Overall) | 7,559 (50.2%) | 7,486 (49.8%) |
Employment Industries by Sex in Maryville
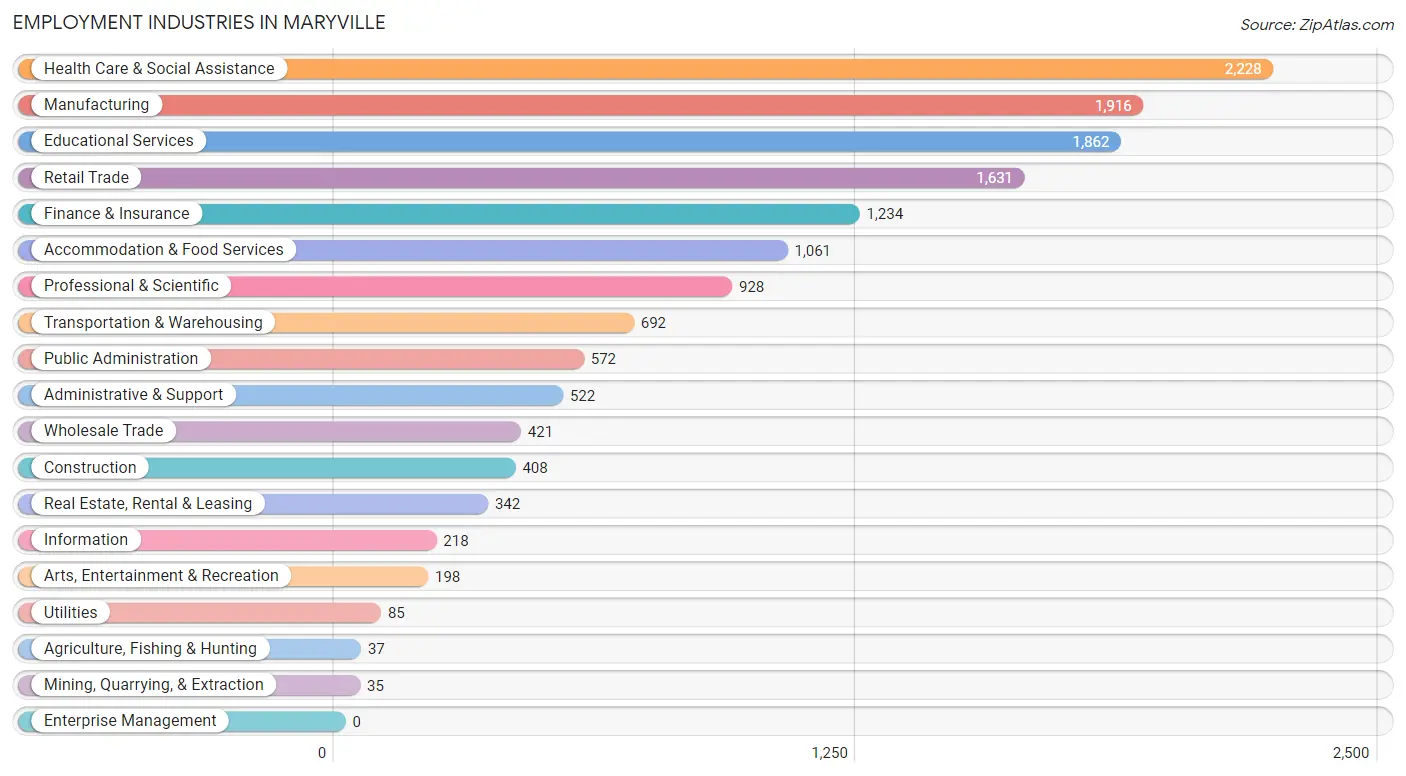
Employment Industries in Maryville
The major employment industries in Maryville include Health Care & Social Assistance (2,228 | 14.8%), Manufacturing (1,916 | 12.7%), Educational Services (1,862 | 12.4%), Retail Trade (1,631 | 10.8%), and Finance & Insurance (1,234 | 8.2%).
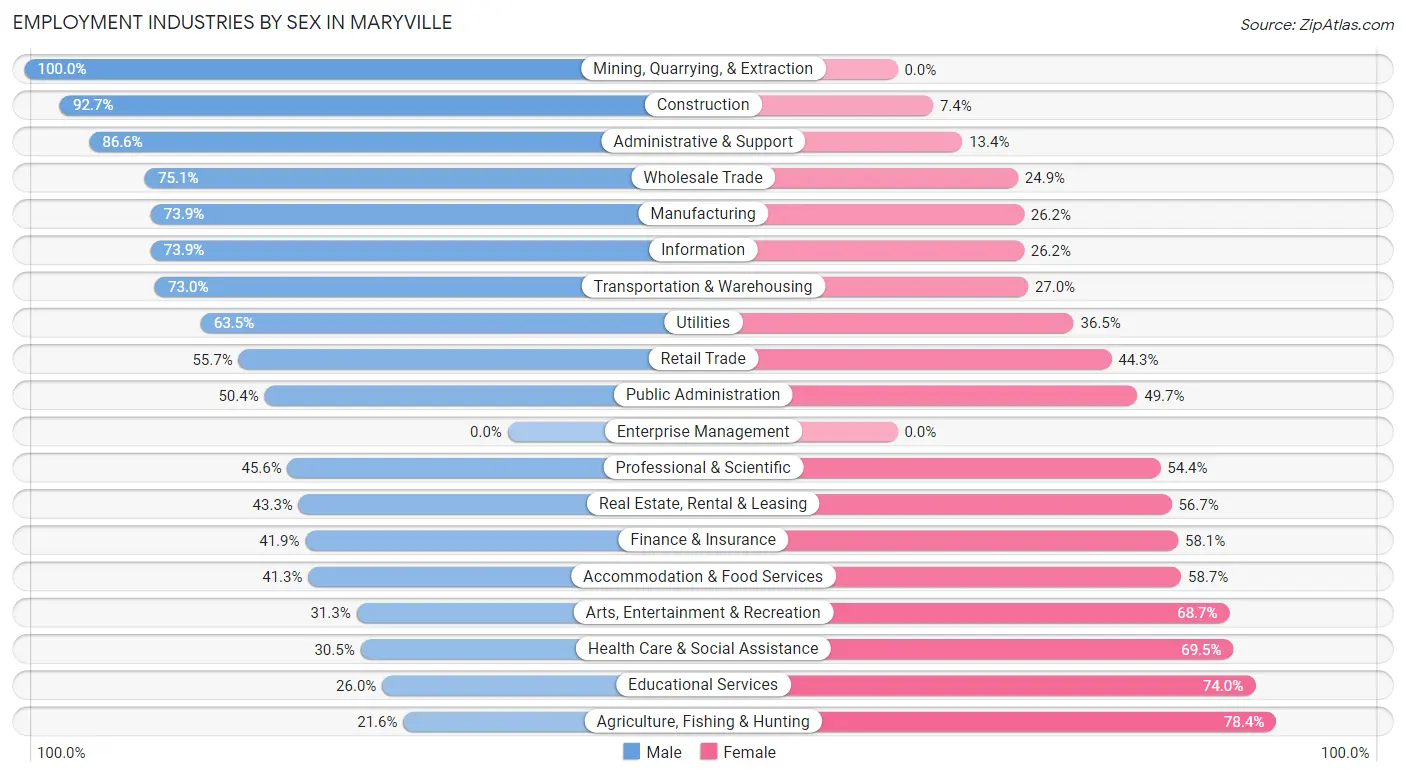
Employment Industries by Sex in Maryville
The Maryville industries that see more men than women are Mining, Quarrying, & Extraction (100.0%), Construction (92.6%), and Administrative & Support (86.6%), whereas the industries that tend to have a higher number of women are Agriculture, Fishing & Hunting (78.4%), Educational Services (74.0%), and Health Care & Social Assistance (69.5%).
| Industry | Male | Female |
| Agriculture, Fishing & Hunting | 8 (21.6%) | 29 (78.4%) |
| Mining, Quarrying, & Extraction | 35 (100.0%) | 0 (0.0%) |
| Construction | 378 (92.6%) | 30 (7.3%) |
| Manufacturing | 1,415 (73.9%) | 501 (26.2%) |
| Wholesale Trade | 316 (75.1%) | 105 (24.9%) |
| Retail Trade | 909 (55.7%) | 722 (44.3%) |
| Transportation & Warehousing | 505 (73.0%) | 187 (27.0%) |
| Utilities | 54 (63.5%) | 31 (36.5%) |
| Information | 161 (73.9%) | 57 (26.2%) |
| Finance & Insurance | 517 (41.9%) | 717 (58.1%) |
| Real Estate, Rental & Leasing | 148 (43.3%) | 194 (56.7%) |
| Professional & Scientific | 423 (45.6%) | 505 (54.4%) |
| Enterprise Management | 0 (0.0%) | 0 (0.0%) |
| Administrative & Support | 452 (86.6%) | 70 (13.4%) |
| Educational Services | 484 (26.0%) | 1,378 (74.0%) |
| Health Care & Social Assistance | 679 (30.5%) | 1,549 (69.5%) |
| Arts, Entertainment & Recreation | 62 (31.3%) | 136 (68.7%) |
| Accommodation & Food Services | 438 (41.3%) | 623 (58.7%) |
| Public Administration | 288 (50.3%) | 284 (49.6%) |
| Total | 7,559 (50.2%) | 7,486 (49.8%) |
Education in Maryville
School Enrollment in Maryville
The most common levels of schooling among the 7,903 students in Maryville are high school (1,982 | 25.1%), college / undergraduate (1,860 | 23.5%), and middle school (1,402 | 17.7%).
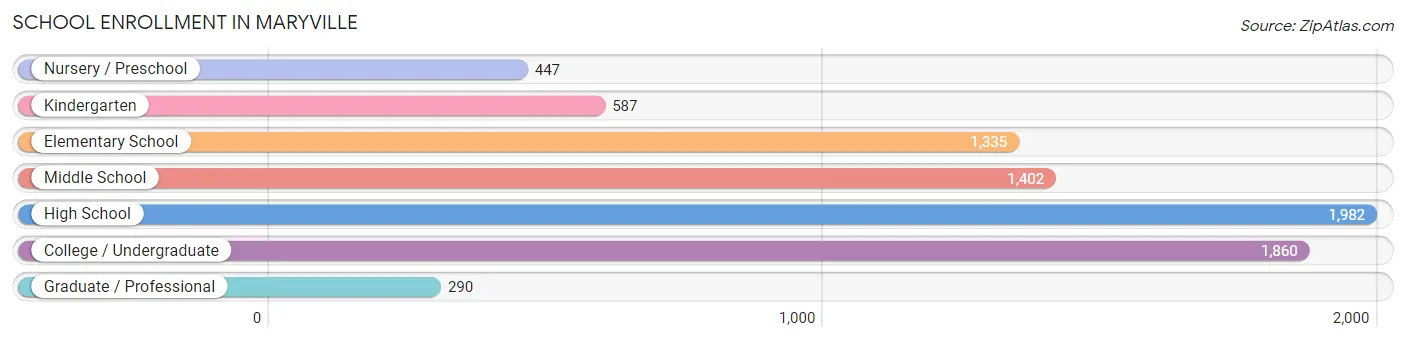
| School Level | # Students | % Students |
| Nursery / Preschool | 447 | 5.7% |
| Kindergarten | 587 | 7.4% |
| Elementary School | 1,335 | 16.9% |
| Middle School | 1,402 | 17.7% |
| High School | 1,982 | 25.1% |
| College / Undergraduate | 1,860 | 23.5% |
| Graduate / Professional | 290 | 3.7% |
| Total | 7,903 | 100.0% |
School Enrollment by Age by Funding Source in Maryville
Out of a total of 7,903 students who are enrolled in schools in Maryville, 1,201 (15.2%) attend a private institution, while the remaining 6,702 (84.8%) are enrolled in public schools. The age group of 20 to 24 year olds has the highest likelihood of being enrolled in private schools, with 434 (55.6% in the age bracket) enrolled. Conversely, the age group of 5 to 9 year old has the lowest likelihood of being enrolled in a private school, with 1,924 (95.3% in the age bracket) attending a public institution.
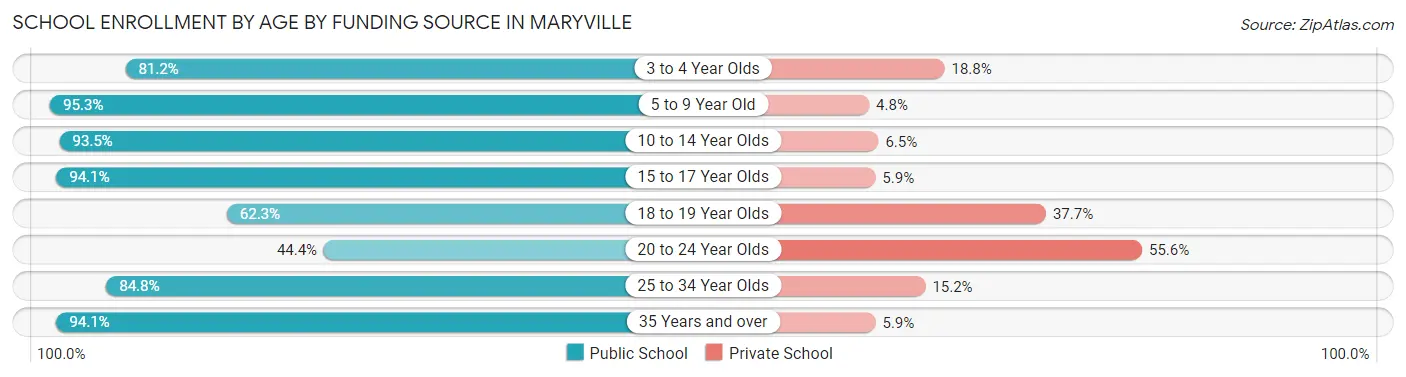
| Age Bracket | Public School | Private School |
| 3 to 4 Year Olds | 242 (81.2%) | 56 (18.8%) |
| 5 to 9 Year Old | 1,924 (95.3%) | 96 (4.8%) |
| 10 to 14 Year Olds | 1,483 (93.5%) | 103 (6.5%) |
| 15 to 17 Year Olds | 1,448 (94.1%) | 91 (5.9%) |
| 18 to 19 Year Olds | 559 (62.3%) | 338 (37.7%) |
| 20 to 24 Year Olds | 347 (44.4%) | 434 (55.6%) |
| 25 to 34 Year Olds | 334 (84.8%) | 60 (15.2%) |
| 35 Years and over | 365 (94.1%) | 23 (5.9%) |
| Total | 6,702 (84.8%) | 1,201 (15.2%) |
Educational Attainment by Field of Study in Maryville
Business (1,707 | 20.4%), education (1,306 | 15.6%), science & technology (1,068 | 12.7%), arts & humanities (665 | 7.9%), and psychology (559 | 6.7%) are the most common fields of study among 8,384 individuals in Maryville who have obtained a bachelor's degree or higher.
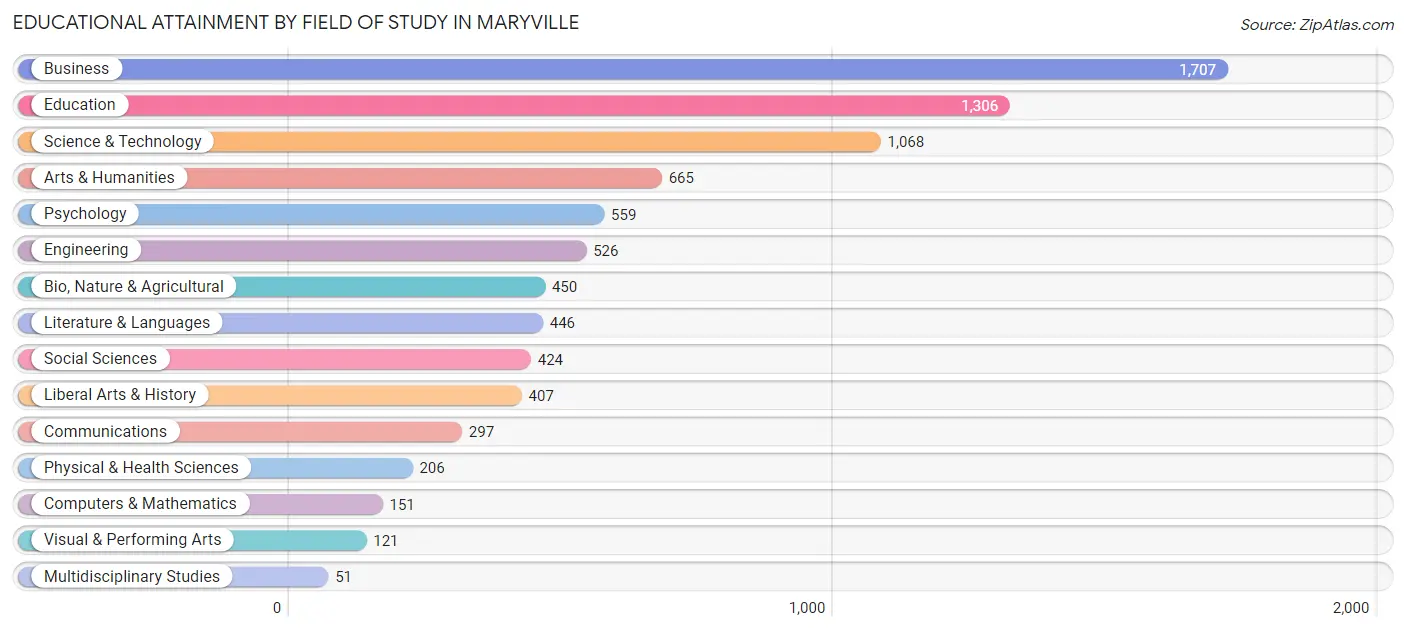
| Field of Study | # Graduates | % Graduates |
| Computers & Mathematics | 151 | 1.8% |
| Bio, Nature & Agricultural | 450 | 5.4% |
| Physical & Health Sciences | 206 | 2.5% |
| Psychology | 559 | 6.7% |
| Social Sciences | 424 | 5.1% |
| Engineering | 526 | 6.3% |
| Multidisciplinary Studies | 51 | 0.6% |
| Science & Technology | 1,068 | 12.7% |
| Business | 1,707 | 20.4% |
| Education | 1,306 | 15.6% |
| Literature & Languages | 446 | 5.3% |
| Liberal Arts & History | 407 | 4.9% |
| Visual & Performing Arts | 121 | 1.4% |
| Communications | 297 | 3.5% |
| Arts & Humanities | 665 | 7.9% |
| Total | 8,384 | 100.0% |
Transportation & Commute in Maryville
Vehicle Availability by Sex in Maryville
The most prevalent vehicle ownership categories in Maryville are males with 2 vehicles (3,233, accounting for 43.0%) and females with 2 vehicles (2,874, making up 45.5%).
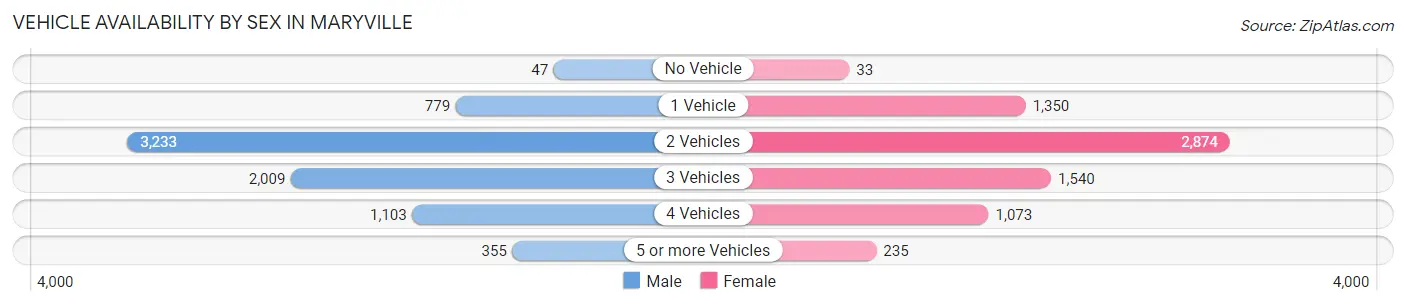
| Vehicles Available | Male | Female |
| No Vehicle | 47 (0.6%) | 33 (0.5%) |
| 1 Vehicle | 779 (10.3%) | 1,350 (19.0%) |
| 2 Vehicles | 3,233 (43.0%) | 2,874 (40.5%) |
| 3 Vehicles | 2,009 (26.7%) | 1,540 (21.7%) |
| 4 Vehicles | 1,103 (14.7%) | 1,073 (15.1%) |
| 5 or more Vehicles | 355 (4.7%) | 235 (3.3%) |
| Total | 7,526 (100.0%) | 7,105 (100.0%) |
Commute Time in Maryville
The most frequently occuring commute durations in Maryville are 15 to 19 minutes (2,619 commuters, 19.2%), 10 to 14 minutes (2,257 commuters, 16.5%), and 5 to 9 minutes (1,903 commuters, 13.9%).
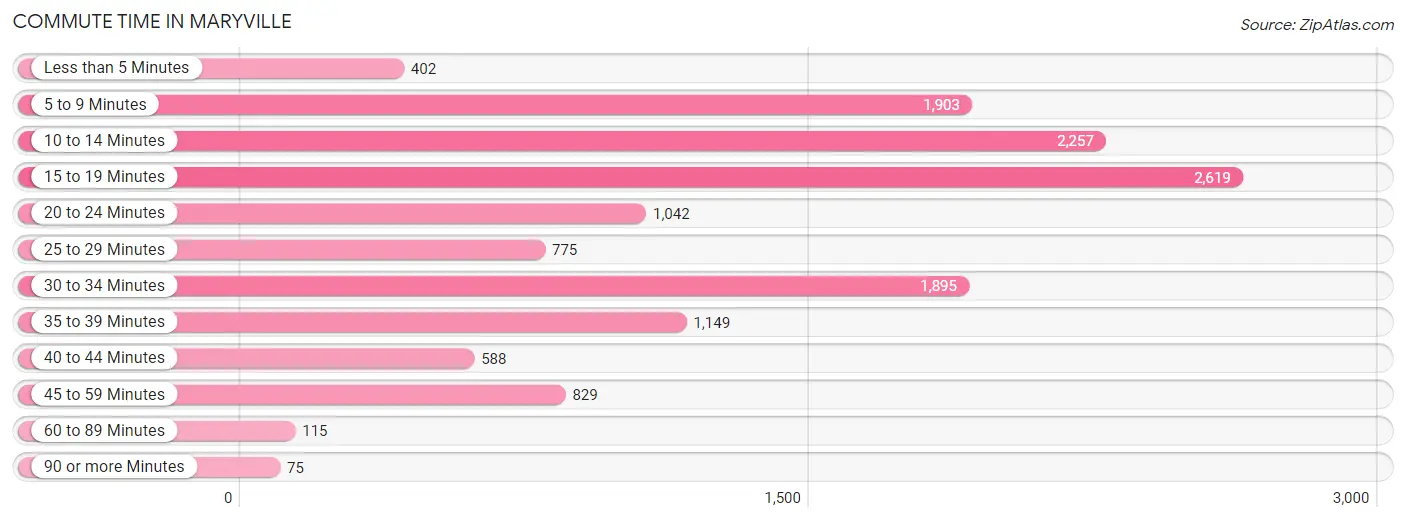
| Commute Time | # Commuters | % Commuters |
| Less than 5 Minutes | 402 | 2.9% |
| 5 to 9 Minutes | 1,903 | 13.9% |
| 10 to 14 Minutes | 2,257 | 16.5% |
| 15 to 19 Minutes | 2,619 | 19.2% |
| 20 to 24 Minutes | 1,042 | 7.6% |
| 25 to 29 Minutes | 775 | 5.7% |
| 30 to 34 Minutes | 1,895 | 13.9% |
| 35 to 39 Minutes | 1,149 | 8.4% |
| 40 to 44 Minutes | 588 | 4.3% |
| 45 to 59 Minutes | 829 | 6.1% |
| 60 to 89 Minutes | 115 | 0.8% |
| 90 or more Minutes | 75 | 0.5% |
Commute Time by Sex in Maryville
The most common commute times in Maryville are 15 to 19 minutes (1,665 commuters, 24.4%) for males and 5 to 9 minutes (1,205 commuters, 17.7%) for females.
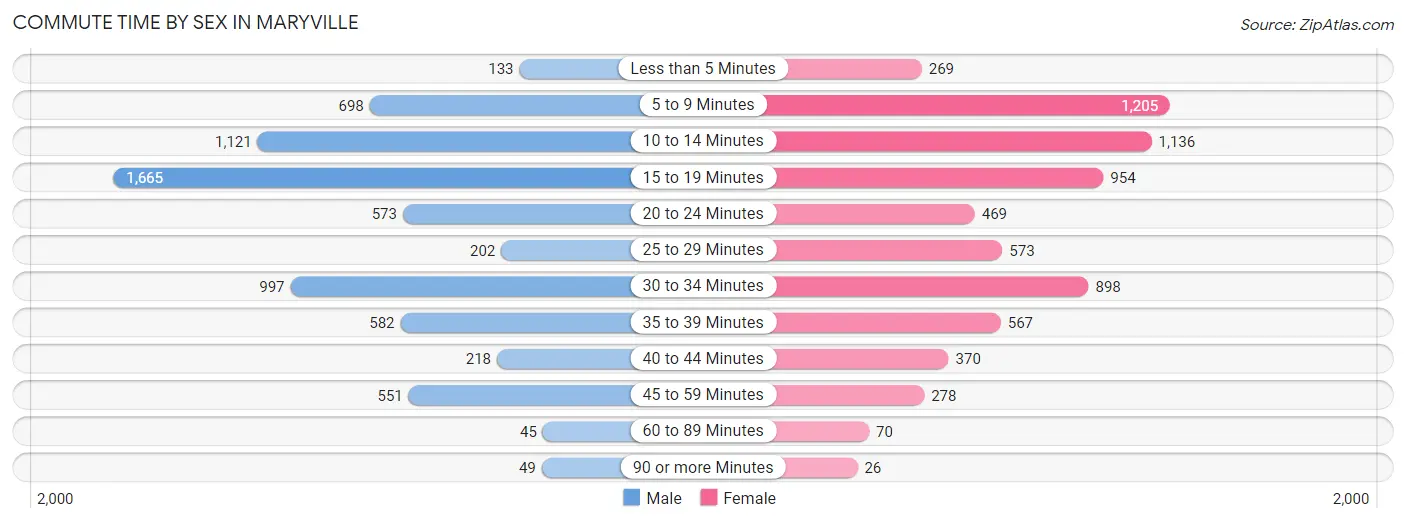
| Commute Time | Male | Female |
| Less than 5 Minutes | 133 (1.9%) | 269 (4.0%) |
| 5 to 9 Minutes | 698 (10.2%) | 1,205 (17.7%) |
| 10 to 14 Minutes | 1,121 (16.4%) | 1,136 (16.7%) |
| 15 to 19 Minutes | 1,665 (24.4%) | 954 (14.0%) |
| 20 to 24 Minutes | 573 (8.4%) | 469 (6.9%) |
| 25 to 29 Minutes | 202 (3.0%) | 573 (8.4%) |
| 30 to 34 Minutes | 997 (14.6%) | 898 (13.2%) |
| 35 to 39 Minutes | 582 (8.5%) | 567 (8.3%) |
| 40 to 44 Minutes | 218 (3.2%) | 370 (5.4%) |
| 45 to 59 Minutes | 551 (8.1%) | 278 (4.1%) |
| 60 to 89 Minutes | 45 (0.7%) | 70 (1.0%) |
| 90 or more Minutes | 49 (0.7%) | 26 (0.4%) |
Time of Departure to Work by Sex in Maryville
The most frequent times of departure to work in Maryville are 7:00 AM to 7:29 AM (1,196, 17.5%) for males and 7:00 AM to 7:29 AM (1,238, 18.2%) for females.
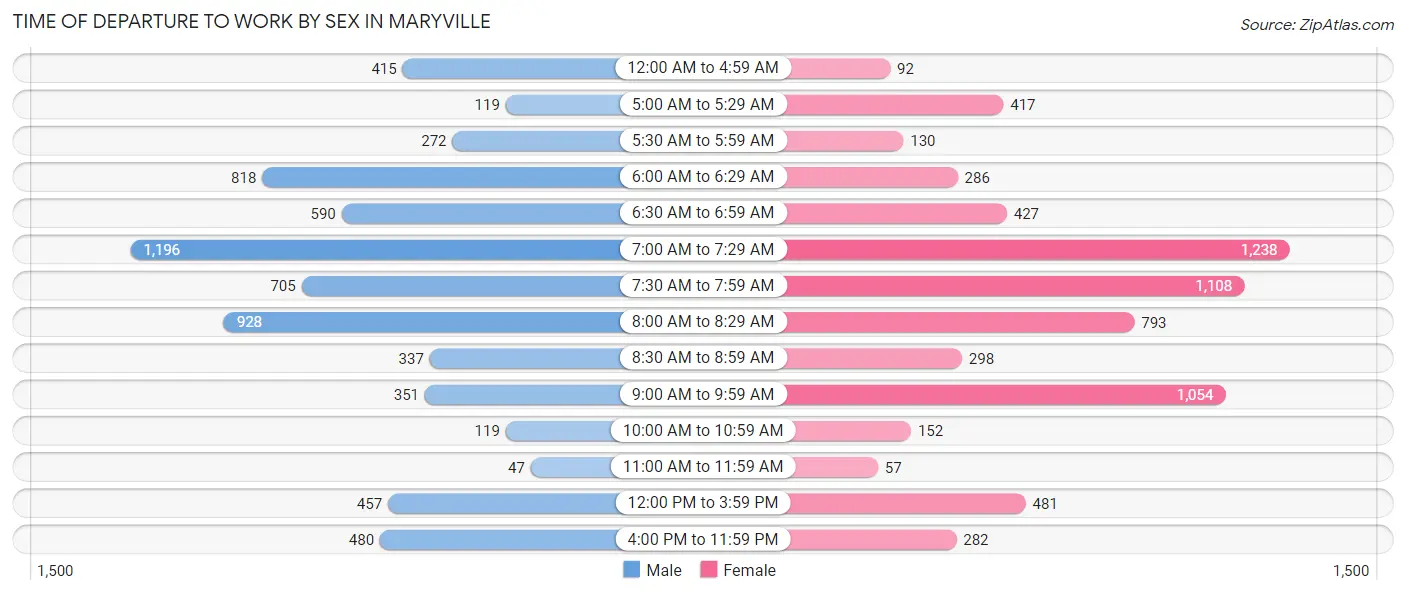
| Time of Departure | Male | Female |
| 12:00 AM to 4:59 AM | 415 (6.1%) | 92 (1.3%) |
| 5:00 AM to 5:29 AM | 119 (1.7%) | 417 (6.1%) |
| 5:30 AM to 5:59 AM | 272 (4.0%) | 130 (1.9%) |
| 6:00 AM to 6:29 AM | 818 (12.0%) | 286 (4.2%) |
| 6:30 AM to 6:59 AM | 590 (8.6%) | 427 (6.3%) |
| 7:00 AM to 7:29 AM | 1,196 (17.5%) | 1,238 (18.2%) |
| 7:30 AM to 7:59 AM | 705 (10.3%) | 1,108 (16.3%) |
| 8:00 AM to 8:29 AM | 928 (13.6%) | 793 (11.6%) |
| 8:30 AM to 8:59 AM | 337 (4.9%) | 298 (4.4%) |
| 9:00 AM to 9:59 AM | 351 (5.1%) | 1,054 (15.5%) |
| 10:00 AM to 10:59 AM | 119 (1.7%) | 152 (2.2%) |
| 11:00 AM to 11:59 AM | 47 (0.7%) | 57 (0.8%) |
| 12:00 PM to 3:59 PM | 457 (6.7%) | 481 (7.1%) |
| 4:00 PM to 11:59 PM | 480 (7.0%) | 282 (4.1%) |
| Total | 6,834 (100.0%) | 6,815 (100.0%) |
Housing Occupancy in Maryville
Occupancy by Ownership in Maryville
Of the total 11,941 dwellings in Maryville, owner-occupied units account for 8,249 (69.1%), while renter-occupied units make up 3,692 (30.9%).
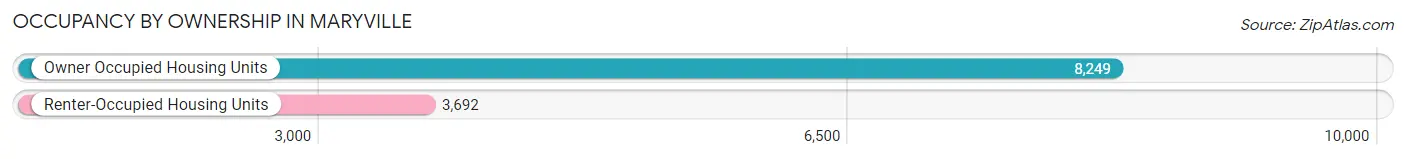
| Occupancy | # Housing Units | % Housing Units |
| Owner Occupied Housing Units | 8,249 | 69.1% |
| Renter-Occupied Housing Units | 3,692 | 30.9% |
| Total Occupied Housing Units | 11,941 | 100.0% |
Occupancy by Household Size in Maryville
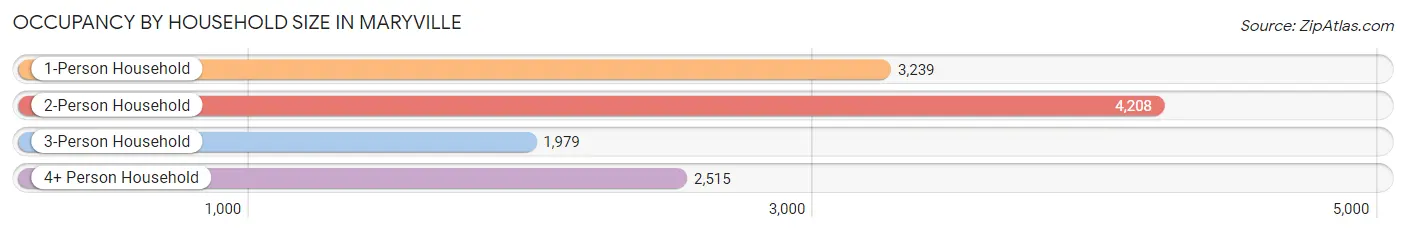
| Household Size | # Housing Units | % Housing Units |
| 1-Person Household | 3,239 | 27.1% |
| 2-Person Household | 4,208 | 35.2% |
| 3-Person Household | 1,979 | 16.6% |
| 4+ Person Household | 2,515 | 21.1% |
| Total Housing Units | 11,941 | 100.0% |
Occupancy by Ownership by Household Size in Maryville
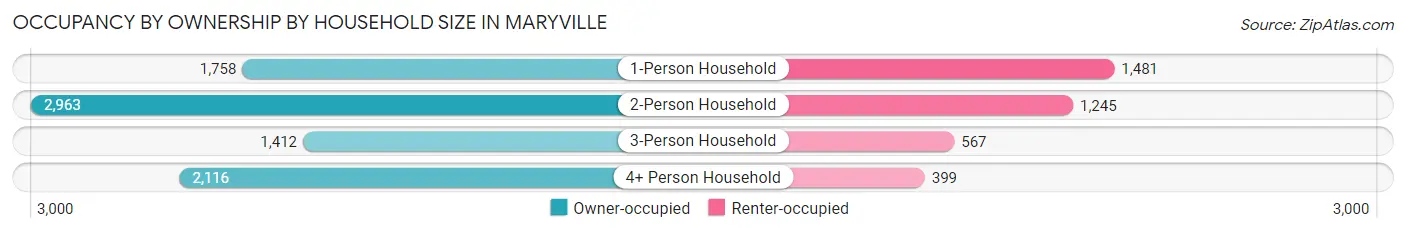
| Household Size | Owner-occupied | Renter-occupied |
| 1-Person Household | 1,758 (54.3%) | 1,481 (45.7%) |
| 2-Person Household | 2,963 (70.4%) | 1,245 (29.6%) |
| 3-Person Household | 1,412 (71.4%) | 567 (28.6%) |
| 4+ Person Household | 2,116 (84.1%) | 399 (15.9%) |
| Total Housing Units | 8,249 (69.1%) | 3,692 (30.9%) |
Occupancy by Educational Attainment in Maryville
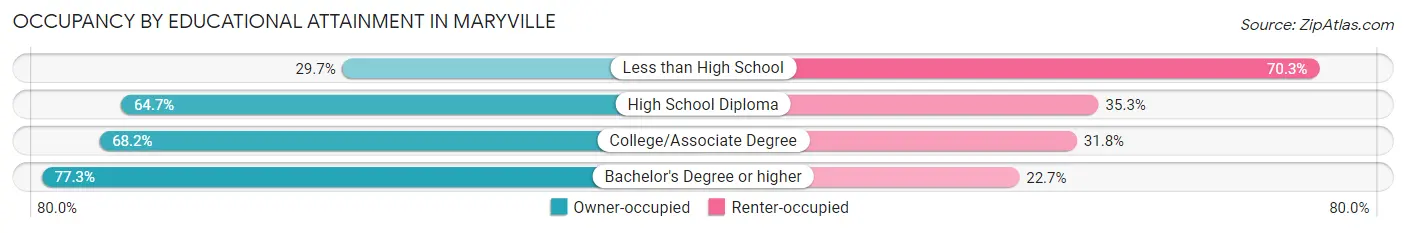
| Household Size | Owner-occupied | Renter-occupied |
| Less than High School | 185 (29.7%) | 437 (70.3%) |
| High School Diploma | 1,892 (64.7%) | 1,032 (35.3%) |
| College/Associate Degree | 2,365 (68.2%) | 1,105 (31.8%) |
| Bachelor's Degree or higher | 3,807 (77.3%) | 1,118 (22.7%) |
Occupancy by Age of Householder in Maryville
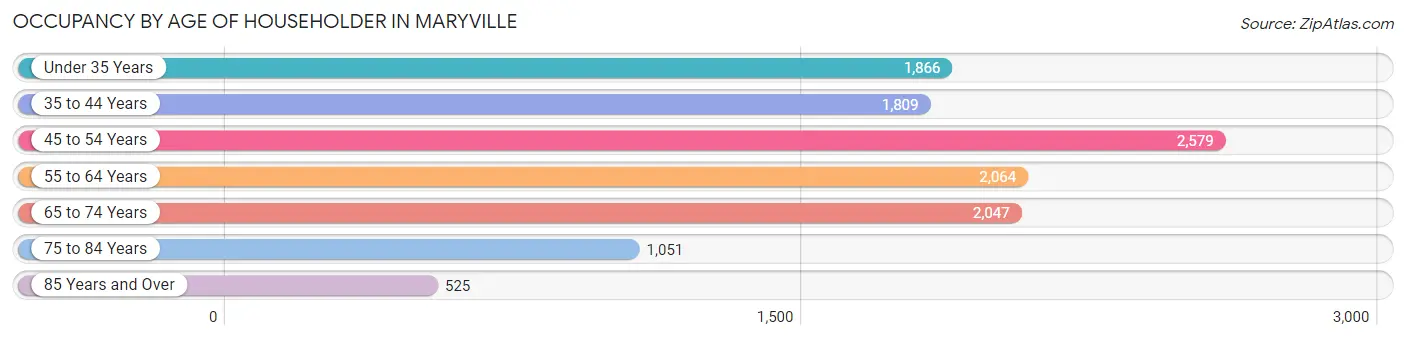
| Age Bracket | # Households | % Households |
| Under 35 Years | 1,866 | 15.6% |
| 35 to 44 Years | 1,809 | 15.1% |
| 45 to 54 Years | 2,579 | 21.6% |
| 55 to 64 Years | 2,064 | 17.3% |
| 65 to 74 Years | 2,047 | 17.1% |
| 75 to 84 Years | 1,051 | 8.8% |
| 85 Years and Over | 525 | 4.4% |
| Total | 11,941 | 100.0% |
Housing Finances in Maryville
Median Income by Occupancy in Maryville
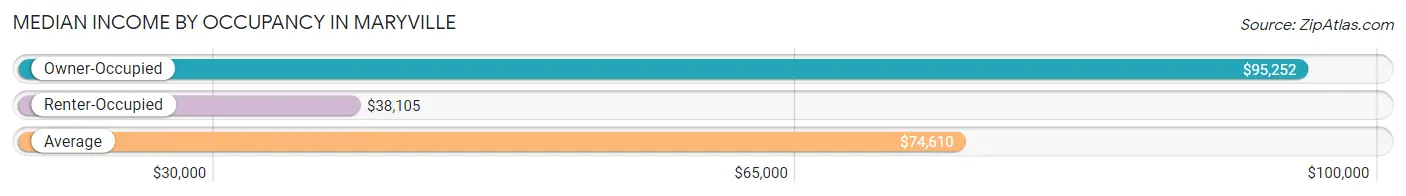
| Occupancy Type | # Households | Median Income |
| Owner-Occupied | 8,249 (69.1%) | $95,252 |
| Renter-Occupied | 3,692 (30.9%) | $38,105 |
| Average | 11,941 (100.0%) | $74,610 |
Occupancy by Householder Income Bracket in Maryville
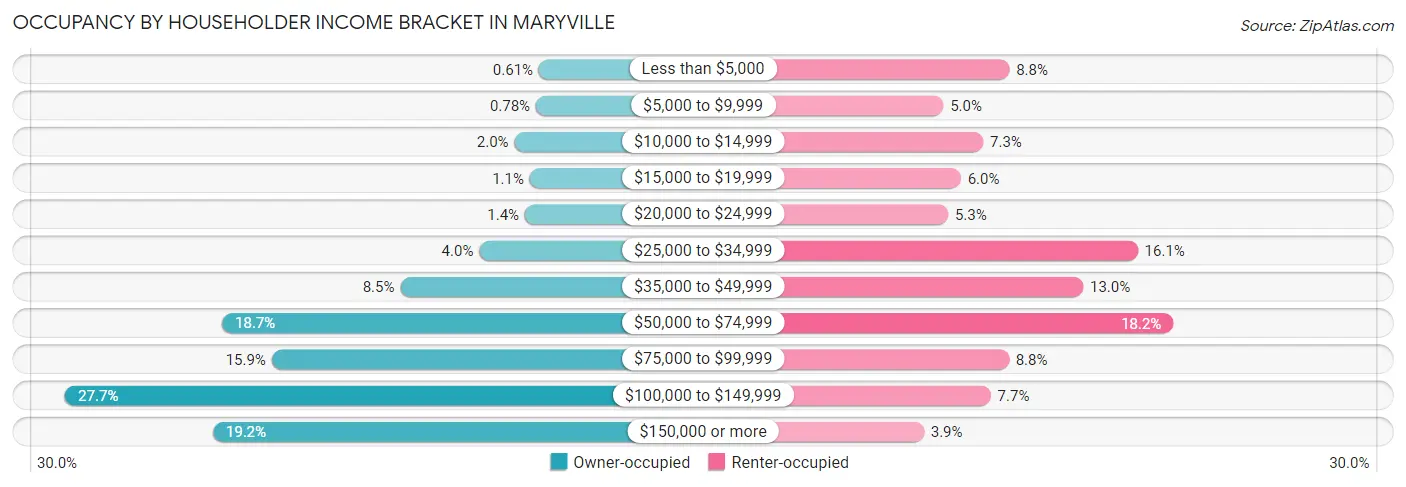
| Income Bracket | Owner-occupied | Renter-occupied |
| Less than $5,000 | 50 (0.6%) | 324 (8.8%) |
| $5,000 to $9,999 | 64 (0.8%) | 185 (5.0%) |
| $10,000 to $14,999 | 166 (2.0%) | 269 (7.3%) |
| $15,000 to $19,999 | 93 (1.1%) | 222 (6.0%) |
| $20,000 to $24,999 | 116 (1.4%) | 195 (5.3%) |
| $25,000 to $34,999 | 332 (4.0%) | 595 (16.1%) |
| $35,000 to $49,999 | 704 (8.5%) | 480 (13.0%) |
| $50,000 to $74,999 | 1,544 (18.7%) | 670 (18.1%) |
| $75,000 to $99,999 | 1,310 (15.9%) | 323 (8.7%) |
| $100,000 to $149,999 | 2,283 (27.7%) | 285 (7.7%) |
| $150,000 or more | 1,587 (19.2%) | 144 (3.9%) |
| Total | 8,249 (100.0%) | 3,692 (100.0%) |
Monthly Housing Cost Tiers in Maryville
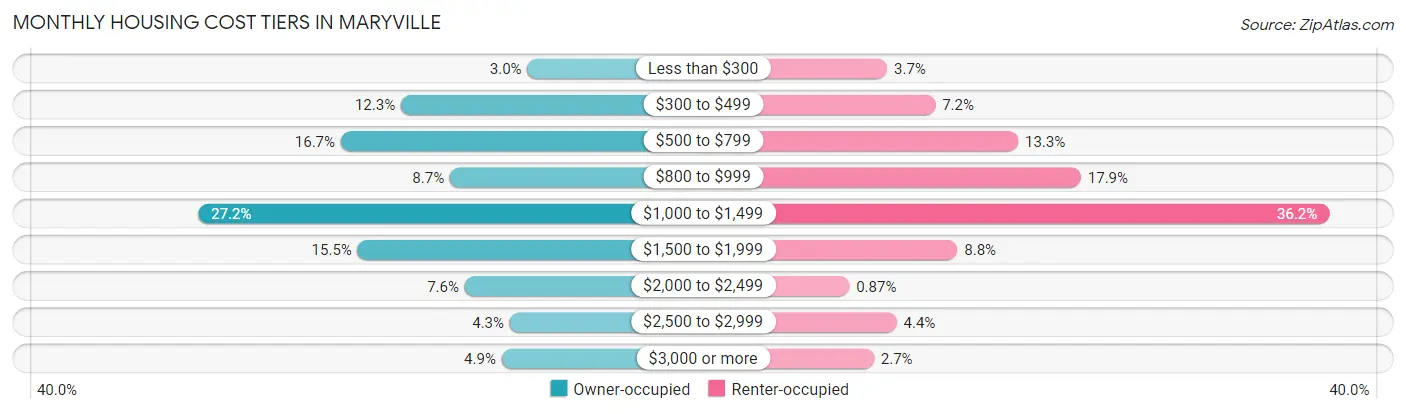
| Monthly Cost | Owner-occupied | Renter-occupied |
| Less than $300 | 245 (3.0%) | 135 (3.7%) |
| $300 to $499 | 1,013 (12.3%) | 266 (7.2%) |
| $500 to $799 | 1,378 (16.7%) | 491 (13.3%) |
| $800 to $999 | 715 (8.7%) | 662 (17.9%) |
| $1,000 to $1,499 | 2,245 (27.2%) | 1,337 (36.2%) |
| $1,500 to $1,999 | 1,276 (15.5%) | 326 (8.8%) |
| $2,000 to $2,499 | 625 (7.6%) | 32 (0.9%) |
| $2,500 to $2,999 | 351 (4.3%) | 161 (4.4%) |
| $3,000 or more | 401 (4.9%) | 99 (2.7%) |
| Total | 8,249 (100.0%) | 3,692 (100.0%) |
Physical Housing Characteristics in Maryville
Housing Structures in Maryville
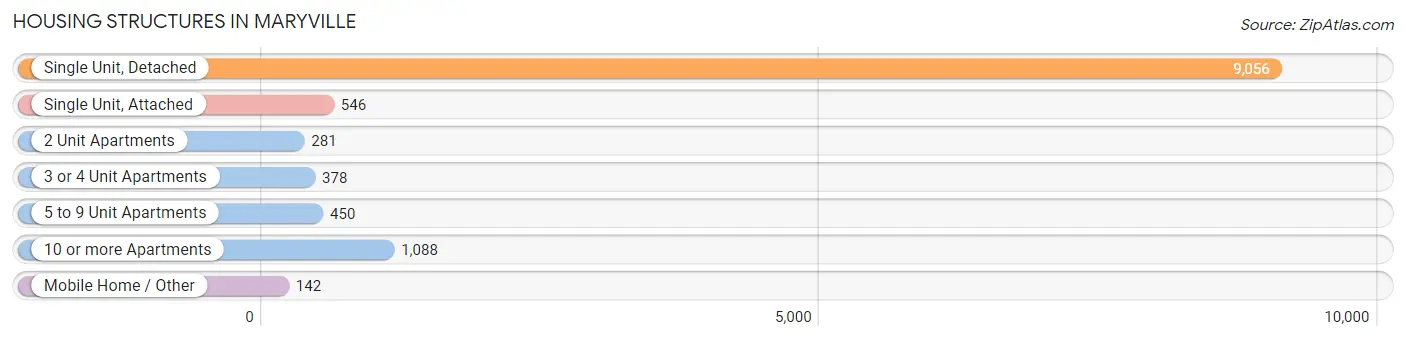
| Structure Type | # Housing Units | % Housing Units |
| Single Unit, Detached | 9,056 | 75.8% |
| Single Unit, Attached | 546 | 4.6% |
| 2 Unit Apartments | 281 | 2.4% |
| 3 or 4 Unit Apartments | 378 | 3.2% |
| 5 to 9 Unit Apartments | 450 | 3.8% |
| 10 or more Apartments | 1,088 | 9.1% |
| Mobile Home / Other | 142 | 1.2% |
| Total | 11,941 | 100.0% |
Housing Structures by Occupancy in Maryville
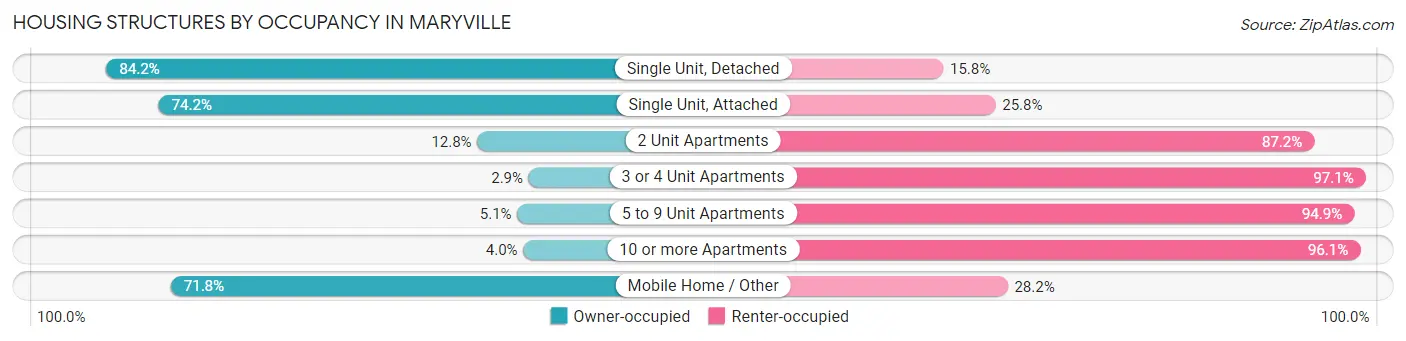
| Structure Type | Owner-occupied | Renter-occupied |
| Single Unit, Detached | 7,629 (84.2%) | 1,427 (15.8%) |
| Single Unit, Attached | 405 (74.2%) | 141 (25.8%) |
| 2 Unit Apartments | 36 (12.8%) | 245 (87.2%) |
| 3 or 4 Unit Apartments | 11 (2.9%) | 367 (97.1%) |
| 5 to 9 Unit Apartments | 23 (5.1%) | 427 (94.9%) |
| 10 or more Apartments | 43 (4.0%) | 1,045 (96.1%) |
| Mobile Home / Other | 102 (71.8%) | 40 (28.2%) |
| Total | 8,249 (69.1%) | 3,692 (30.9%) |
Housing Structures by Number of Rooms in Maryville
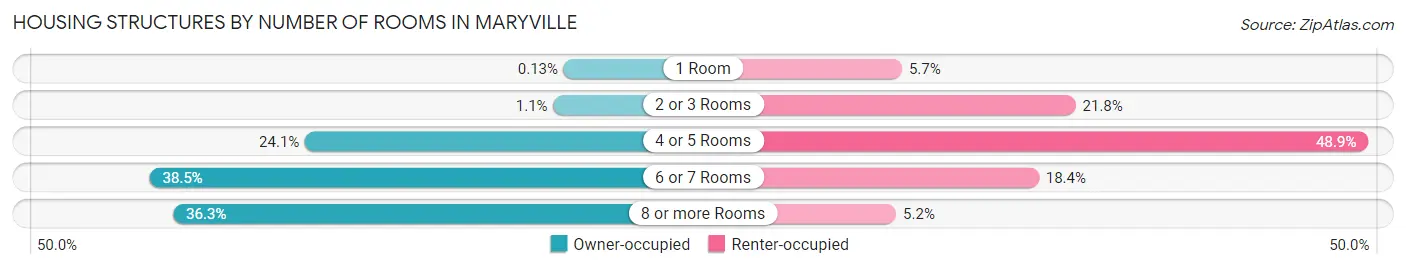
| Number of Rooms | Owner-occupied | Renter-occupied |
| 1 Room | 11 (0.1%) | 212 (5.7%) |
| 2 or 3 Rooms | 90 (1.1%) | 805 (21.8%) |
| 4 or 5 Rooms | 1,984 (24.0%) | 1,804 (48.9%) |
| 6 or 7 Rooms | 3,172 (38.5%) | 679 (18.4%) |
| 8 or more Rooms | 2,992 (36.3%) | 192 (5.2%) |
| Total | 8,249 (100.0%) | 3,692 (100.0%) |
Housing Structure by Heating Type in Maryville
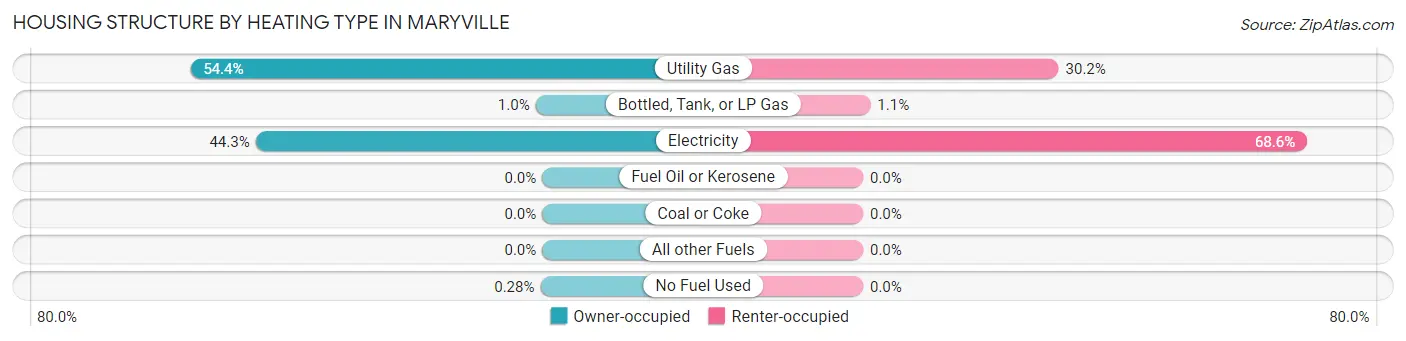
| Heating Type | Owner-occupied | Renter-occupied |
| Utility Gas | 4,487 (54.4%) | 1,116 (30.2%) |
| Bottled, Tank, or LP Gas | 84 (1.0%) | 42 (1.1%) |
| Electricity | 3,655 (44.3%) | 2,534 (68.6%) |
| Fuel Oil or Kerosene | 0 (0.0%) | 0 (0.0%) |
| Coal or Coke | 0 (0.0%) | 0 (0.0%) |
| All other Fuels | 0 (0.0%) | 0 (0.0%) |
| No Fuel Used | 23 (0.3%) | 0 (0.0%) |
| Total | 8,249 (100.0%) | 3,692 (100.0%) |
Household Vehicle Usage in Maryville
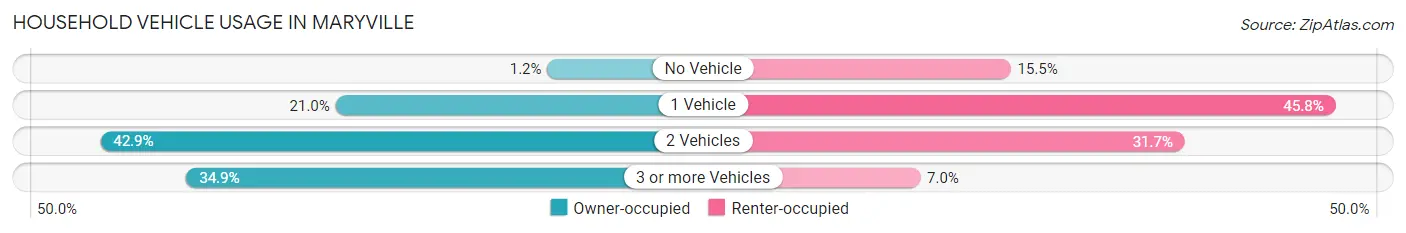
| Vehicles per Household | Owner-occupied | Renter-occupied |
| No Vehicle | 99 (1.2%) | 571 (15.5%) |
| 1 Vehicle | 1,730 (21.0%) | 1,691 (45.8%) |
| 2 Vehicles | 3,541 (42.9%) | 1,171 (31.7%) |
| 3 or more Vehicles | 2,879 (34.9%) | 259 (7.0%) |
| Total | 8,249 (100.0%) | 3,692 (100.0%) |
Real Estate & Mortgages in Maryville
Real Estate and Mortgage Overview in Maryville
| Characteristic | Without Mortgage | With Mortgage |
| Housing Units | 2,978 | 5,271 |
| Median Property Value | $297,200 | $254,100 |
| Median Household Income | $79,500 | $1,063 |
| Monthly Housing Costs | $560 | $401 |
| Real Estate Taxes | $2,445 | $91 |
Property Value by Mortgage Status in Maryville
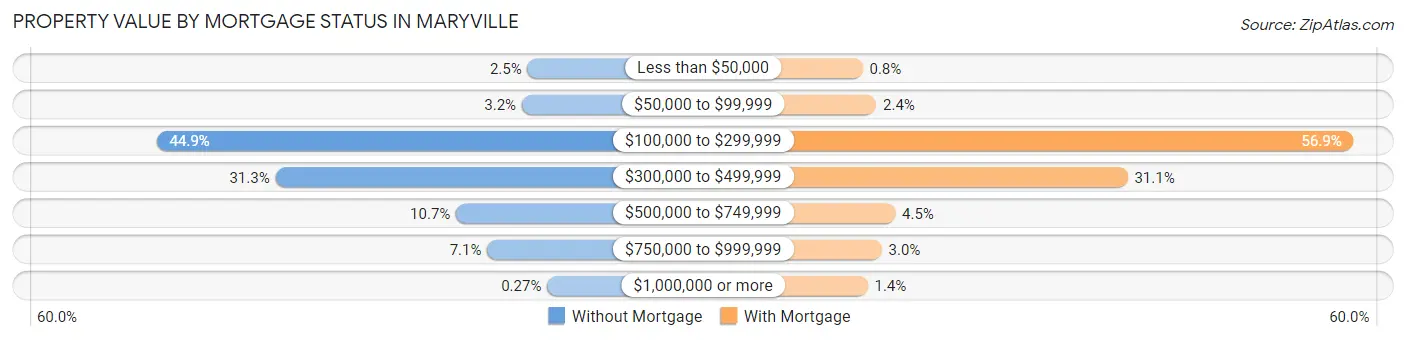
| Property Value | Without Mortgage | With Mortgage |
| Less than $50,000 | 75 (2.5%) | 42 (0.8%) |
| $50,000 to $99,999 | 94 (3.2%) | 124 (2.4%) |
| $100,000 to $299,999 | 1,338 (44.9%) | 3,000 (56.9%) |
| $300,000 to $499,999 | 933 (31.3%) | 1,638 (31.1%) |
| $500,000 to $749,999 | 318 (10.7%) | 238 (4.5%) |
| $750,000 to $999,999 | 212 (7.1%) | 157 (3.0%) |
| $1,000,000 or more | 8 (0.3%) | 72 (1.4%) |
| Total | 2,978 (100.0%) | 5,271 (100.0%) |
Household Income by Mortgage Status in Maryville
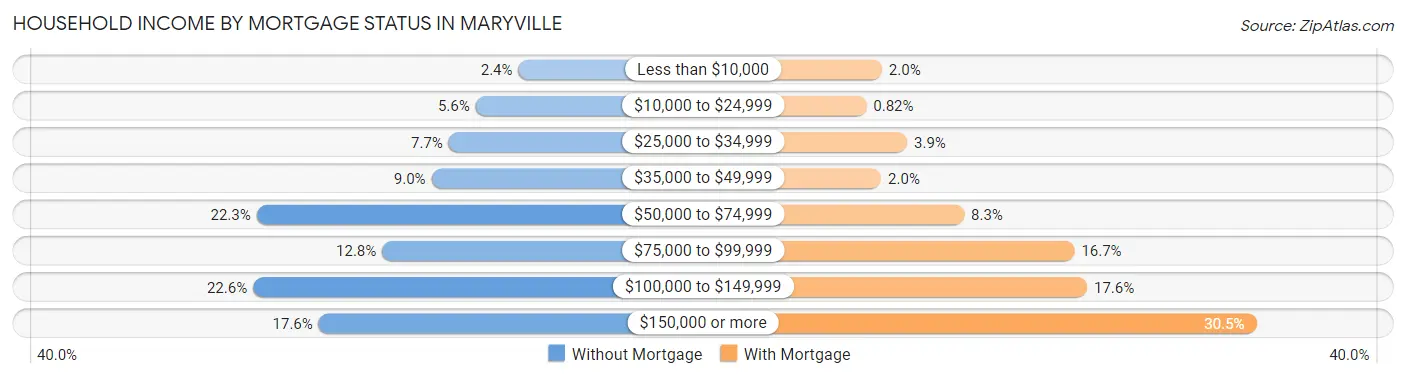
| Household Income | Without Mortgage | With Mortgage |
| Less than $10,000 | 71 (2.4%) | 106 (2.0%) |
| $10,000 to $24,999 | 168 (5.6%) | 43 (0.8%) |
| $25,000 to $34,999 | 229 (7.7%) | 207 (3.9%) |
| $35,000 to $49,999 | 268 (9.0%) | 103 (1.9%) |
| $50,000 to $74,999 | 665 (22.3%) | 436 (8.3%) |
| $75,000 to $99,999 | 380 (12.8%) | 879 (16.7%) |
| $100,000 to $149,999 | 673 (22.6%) | 930 (17.6%) |
| $150,000 or more | 524 (17.6%) | 1,610 (30.5%) |
| Total | 2,978 (100.0%) | 5,271 (100.0%) |
Property Value to Household Income Ratio in Maryville
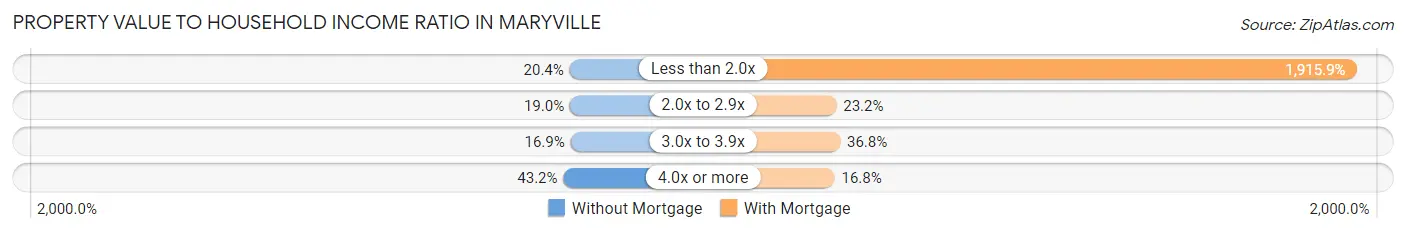
| Value-to-Income Ratio | Without Mortgage | With Mortgage |
| Less than 2.0x | 606 (20.3%) | 100,987 (1,915.9%) |
| 2.0x to 2.9x | 565 (19.0%) | 1,225 (23.2%) |
| 3.0x to 3.9x | 503 (16.9%) | 1,939 (36.8%) |
| 4.0x or more | 1,285 (43.1%) | 886 (16.8%) |
| Total | 2,978 (100.0%) | 5,271 (100.0%) |
Real Estate Taxes by Mortgage Status in Maryville
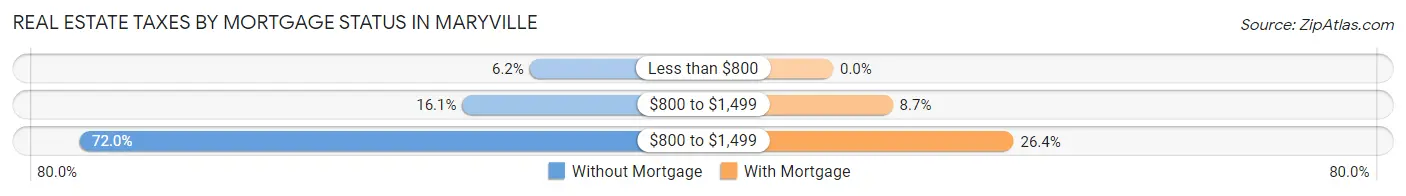
| Property Taxes | Without Mortgage | With Mortgage |
| Less than $800 | 185 (6.2%) | 0 (0.0%) |
| $800 to $1,499 | 478 (16.1%) | 459 (8.7%) |
| $800 to $1,499 | 2,145 (72.0%) | 1,390 (26.4%) |
| Total | 2,978 (100.0%) | 5,271 (100.0%) |
Health & Disability in Maryville
Health Insurance Coverage by Age in Maryville
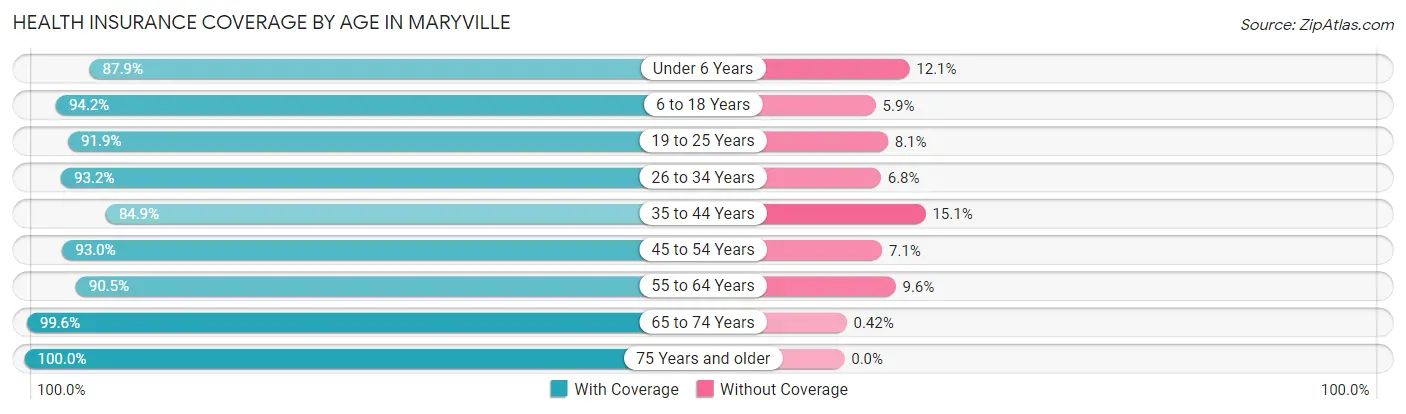
| Age Bracket | With Coverage | Without Coverage |
| Under 6 Years | 1,789 (87.9%) | 247 (12.1%) |
| 6 to 18 Years | 5,194 (94.2%) | 323 (5.9%) |
| 19 to 25 Years | 2,663 (91.9%) | 235 (8.1%) |
| 26 to 34 Years | 3,001 (93.2%) | 219 (6.8%) |
| 35 to 44 Years | 3,110 (84.9%) | 555 (15.1%) |
| 45 to 54 Years | 4,023 (92.9%) | 305 (7.0%) |
| 55 to 64 Years | 3,418 (90.4%) | 361 (9.6%) |
| 65 to 74 Years | 3,115 (99.6%) | 13 (0.4%) |
| 75 Years and older | 2,338 (100.0%) | 0 (0.0%) |
| Total | 28,651 (92.7%) | 2,258 (7.3%) |
Health Insurance Coverage by Citizenship Status in Maryville
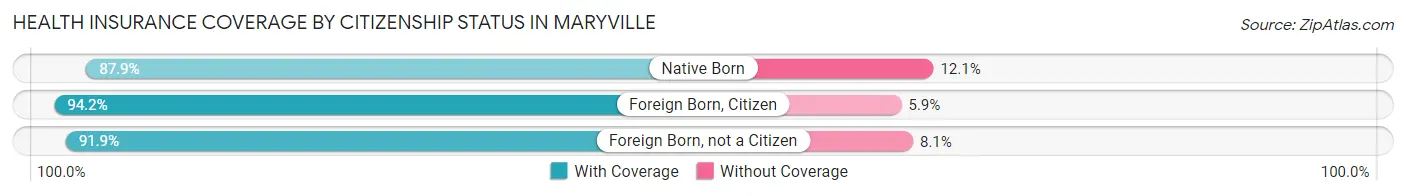
| Citizenship Status | With Coverage | Without Coverage |
| Native Born | 1,789 (87.9%) | 247 (12.1%) |
| Foreign Born, Citizen | 5,194 (94.2%) | 323 (5.9%) |
| Foreign Born, not a Citizen | 2,663 (91.9%) | 235 (8.1%) |
Health Insurance Coverage by Household Income in Maryville
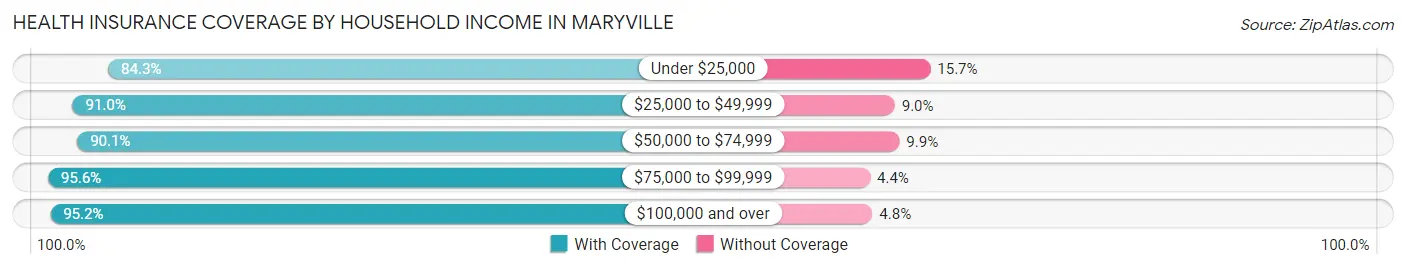
| Household Income | With Coverage | Without Coverage |
| Under $25,000 | 2,176 (84.3%) | 404 (15.7%) |
| $25,000 to $49,999 | 3,725 (91.0%) | 368 (9.0%) |
| $50,000 to $74,999 | 4,825 (90.1%) | 528 (9.9%) |
| $75,000 to $99,999 | 4,027 (95.6%) | 184 (4.4%) |
| $100,000 and over | 13,176 (95.2%) | 664 (4.8%) |
Public vs Private Health Insurance Coverage by Age in Maryville
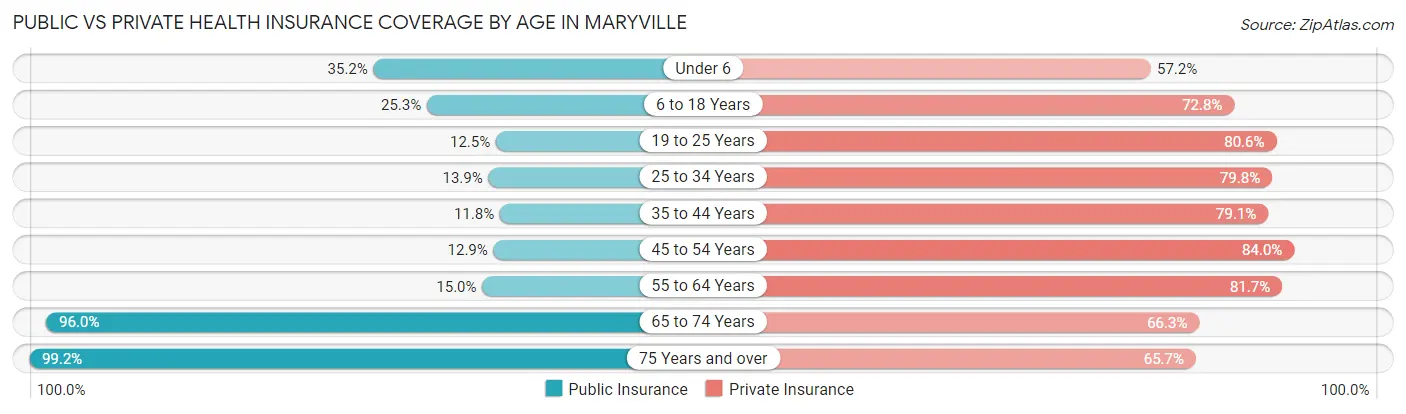
| Age Bracket | Public Insurance | Private Insurance |
| Under 6 | 717 (35.2%) | 1,165 (57.2%) |
| 6 to 18 Years | 1,396 (25.3%) | 4,018 (72.8%) |
| 19 to 25 Years | 362 (12.5%) | 2,337 (80.6%) |
| 25 to 34 Years | 447 (13.9%) | 2,571 (79.8%) |
| 35 to 44 Years | 431 (11.8%) | 2,900 (79.1%) |
| 45 to 54 Years | 560 (12.9%) | 3,634 (84.0%) |
| 55 to 64 Years | 568 (15.0%) | 3,088 (81.7%) |
| 65 to 74 Years | 3,003 (96.0%) | 2,075 (66.3%) |
| 75 Years and over | 2,319 (99.2%) | 1,536 (65.7%) |
| Total | 9,803 (31.7%) | 23,324 (75.5%) |
Disability Status by Sex by Age in Maryville
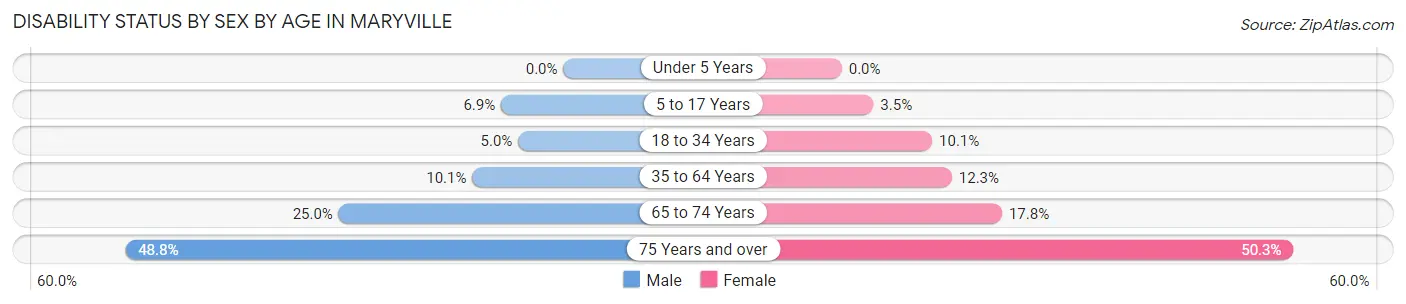
| Age Bracket | Male | Female |
| Under 5 Years | 0 (0.0%) | 0 (0.0%) |
| 5 to 17 Years | 188 (6.9%) | 98 (3.5%) |
| 18 to 34 Years | 159 (5.0%) | 360 (10.1%) |
| 35 to 64 Years | 569 (10.1%) | 755 (12.3%) |
| 65 to 74 Years | 359 (25.0%) | 302 (17.8%) |
| 75 Years and over | 444 (48.8%) | 718 (50.3%) |
Disability Class by Sex by Age in Maryville
Disability Class: Hearing Difficulty
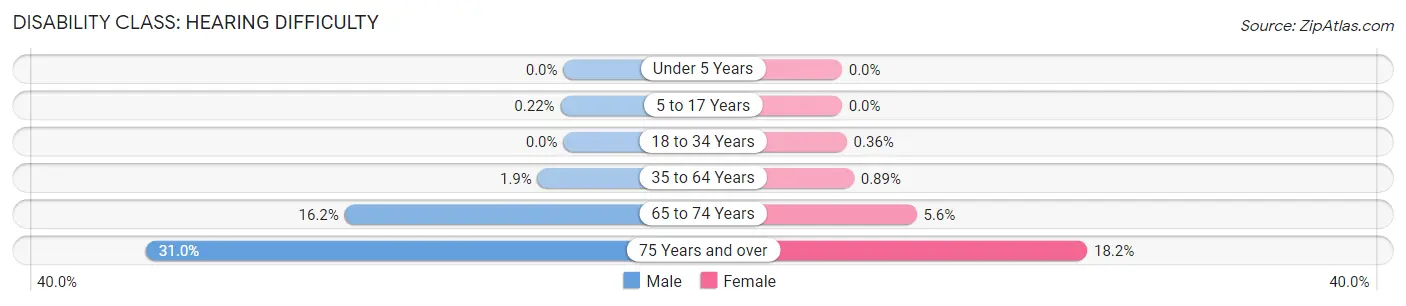
| Age Bracket | Male | Female |
| Under 5 Years | 0 (0.0%) | 0 (0.0%) |
| 5 to 17 Years | 6 (0.2%) | 0 (0.0%) |
| 18 to 34 Years | 0 (0.0%) | 13 (0.4%) |
| 35 to 64 Years | 107 (1.9%) | 55 (0.9%) |
| 65 to 74 Years | 233 (16.2%) | 94 (5.6%) |
| 75 Years and over | 282 (31.0%) | 260 (18.2%) |
Disability Class: Vision Difficulty
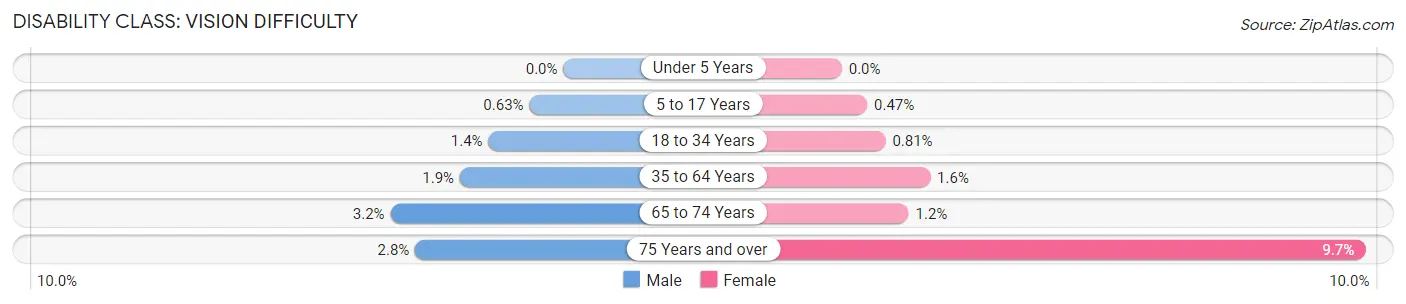
| Age Bracket | Male | Female |
| Under 5 Years | 0 (0.0%) | 0 (0.0%) |
| 5 to 17 Years | 17 (0.6%) | 13 (0.5%) |
| 18 to 34 Years | 44 (1.4%) | 29 (0.8%) |
| 35 to 64 Years | 108 (1.9%) | 101 (1.6%) |
| 65 to 74 Years | 46 (3.2%) | 21 (1.2%) |
| 75 Years and over | 25 (2.8%) | 139 (9.7%) |
Disability Class: Cognitive Difficulty
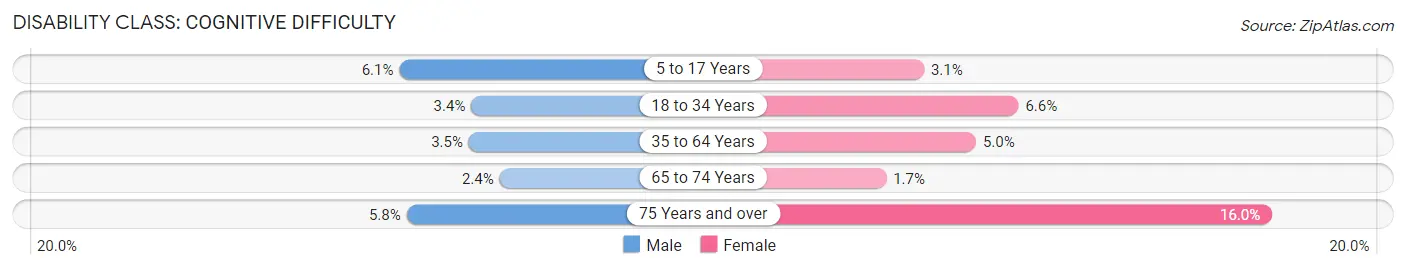
| Age Bracket | Male | Female |
| 5 to 17 Years | 165 (6.1%) | 85 (3.0%) |
| 18 to 34 Years | 108 (3.4%) | 235 (6.6%) |
| 35 to 64 Years | 197 (3.5%) | 307 (5.0%) |
| 65 to 74 Years | 34 (2.4%) | 28 (1.7%) |
| 75 Years and over | 53 (5.8%) | 228 (16.0%) |
Disability Class: Ambulatory Difficulty
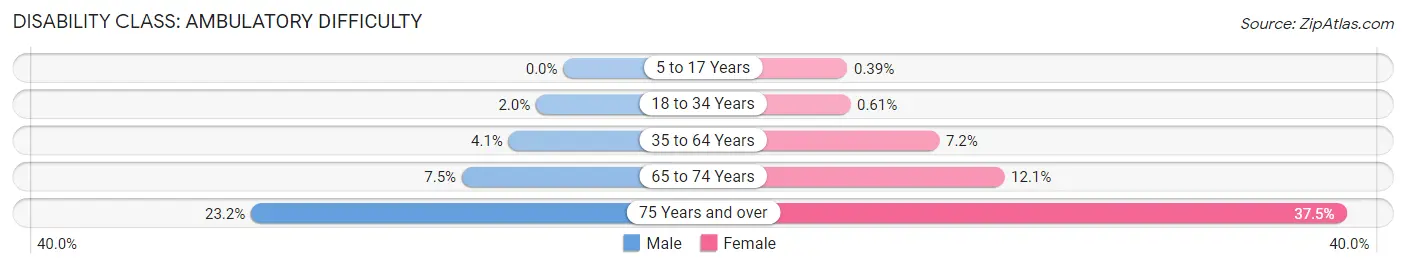
| Age Bracket | Male | Female |
| 5 to 17 Years | 0 (0.0%) | 11 (0.4%) |
| 18 to 34 Years | 64 (2.0%) | 22 (0.6%) |
| 35 to 64 Years | 228 (4.1%) | 445 (7.2%) |
| 65 to 74 Years | 108 (7.5%) | 204 (12.0%) |
| 75 Years and over | 211 (23.2%) | 535 (37.5%) |
Disability Class: Self-Care Difficulty
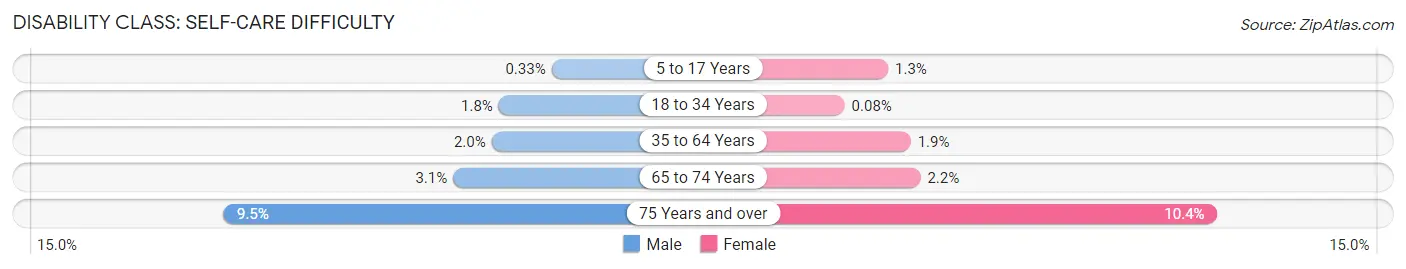
| Age Bracket | Male | Female |
| 5 to 17 Years | 9 (0.3%) | 36 (1.3%) |
| 18 to 34 Years | 57 (1.8%) | 3 (0.1%) |
| 35 to 64 Years | 112 (2.0%) | 118 (1.9%) |
| 65 to 74 Years | 44 (3.1%) | 37 (2.2%) |
| 75 Years and over | 86 (9.5%) | 149 (10.4%) |
Technology Access in Maryville
Computing Device Access in Maryville
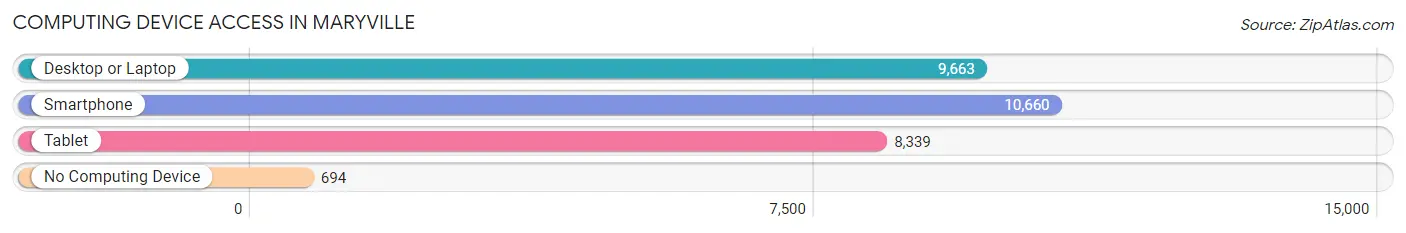
| Device Type | # Households | % Households |
| Desktop or Laptop | 9,663 | 80.9% |
| Smartphone | 10,660 | 89.3% |
| Tablet | 8,339 | 69.8% |
| No Computing Device | 694 | 5.8% |
| Total | 11,941 | 100.0% |
Internet Access in Maryville
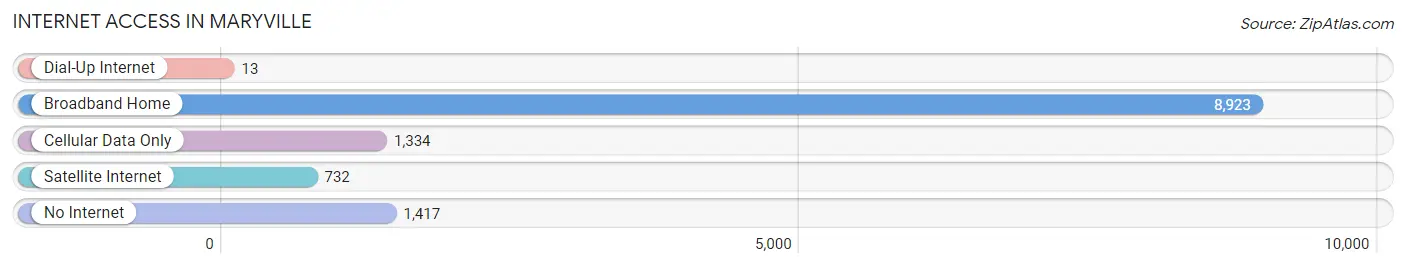
| Internet Type | # Households | % Households |
| Dial-Up Internet | 13 | 0.1% |
| Broadband Home | 8,923 | 74.7% |
| Cellular Data Only | 1,334 | 11.2% |
| Satellite Internet | 732 | 6.1% |
| No Internet | 1,417 | 11.9% |
| Total | 11,941 | 100.0% |
Maryville Summary
Maryville, Tennessee is a city located in Blount County, Tennessee, United States. It is the county seat of Blount County and is situated in the foothills of the Great Smoky Mountains. The city has a population of 27,465 as of the 2010 census, making it the largest city in Blount County.
History
Maryville was founded in 1795 by Revolutionary War veteran William Craig. The city was named after his wife, Mary Grainger Craig. The city was incorporated in 1819 and became the county seat of Blount County in 1827.
Maryville was a major center of industry in the 19th century, with several factories producing textiles, furniture, and other goods. The city was also a major railroad hub, with several lines running through the city.
In the early 20th century, Maryville became a popular tourist destination, with many visitors coming to the city to enjoy the scenic beauty of the Great Smoky Mountains. The city also became a popular retirement destination, with many retirees settling in the city.
Geography
Maryville is located in the foothills of the Great Smoky Mountains, about 25 miles south of Knoxville. The city is situated at the confluence of the Little River and the Tennessee River. The city has a total area of 16.2 square miles, of which 16.1 square miles is land and 0.1 square miles is water.
The city is located in a humid subtropical climate zone, with hot, humid summers and mild winters. The average annual temperature is 57.2 degrees Fahrenheit, with an average high of 73.2 degrees Fahrenheit in July and an average low of 41.2 degrees Fahrenheit in January.
Economy
Maryville's economy is largely based on manufacturing, retail, and healthcare. The city is home to several large manufacturing companies, including Denso Manufacturing Tennessee, Inc., Alcoa, and Clayton Homes. The city is also home to several large retail stores, including Walmart, Target, and Lowe's.
The city is also home to several healthcare facilities, including Blount Memorial Hospital, Blount Memorial Physician Group, and Blount County Medical Center.
Demographics
As of the 2010 census, Maryville had a population of 27,465. The racial makeup of the city was 87.3% White, 8.2% African American, 0.4% Native American, 1.2% Asian, 0.1% Pacific Islander, 1.2% from other races, and 1.7% from two or more races. Hispanic or Latino of any race were 3.2% of the population.
The median income for a household in the city was $41,945, and the median income for a family was $50,945. The per capita income for the city was $22,845. About 11.2% of families and 14.2% of the population were below the poverty line, including 19.2% of those under age 18 and 8.2% of those age 65 or over.
Common Questions
What is Per Capita Income in Maryville?
Per Capita income in Maryville is $36,732.
What is the Median Family Income in Maryville?
Median Family Income in Maryville is $96,080.
What is the Median Household income in Maryville?
Median Household Income in Maryville is $74,610.
What is Income or Wage Gap in Maryville?
Income or Wage Gap in Maryville is 34.5%.
Women in Maryville earn 65.5 cents for every dollar earned by a man.
What is Inequality or Gini Index in Maryville?
Inequality or Gini Index in Maryville is 0.44.
What is the Total Population of Maryville?
Total Population of Maryville is 31,876.
What is the Total Male Population of Maryville?
Total Male Population of Maryville is 15,141.
What is the Total Female Population of Maryville?
Total Female Population of Maryville is 16,735.
What is the Ratio of Males per 100 Females in Maryville?
There are 90.48 Males per 100 Females in Maryville.
What is the Ratio of Females per 100 Males in Maryville?
There are 110.53 Females per 100 Males in Maryville.
What is the Median Population Age in Maryville?
Median Population Age in Maryville is 41.2 Years.
What is the Average Family Size in Maryville
Average Family Size in Maryville is 3.1 People.
What is the Average Household Size in Maryville
Average Household Size in Maryville is 2.5 People.
How Large is the Labor Force in Maryville?
There are 15,576 People in the Labor Forcein in Maryville.
What is the Percentage of People in the Labor Force in Maryville?
59.8% of People are in the Labor Force in Maryville.
What is the Unemployment Rate in Maryville?
Unemployment Rate in Maryville is 2.8%.