Blaine, TN Map & Demographics
Blaine Map
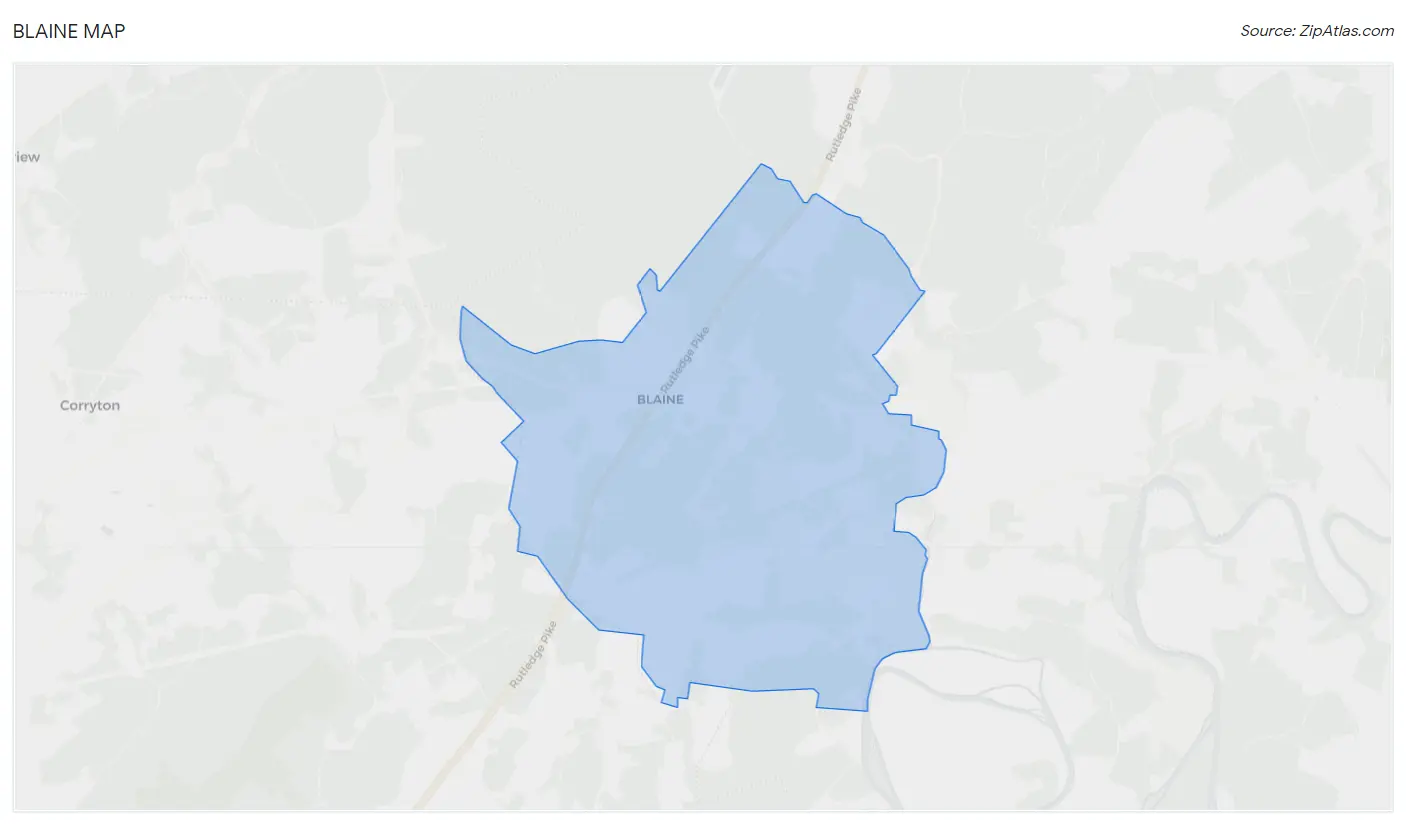
Blaine Overview
$27,621
PER CAPITA INCOME
$79,524
AVG FAMILY INCOME
$56,942
AVG HOUSEHOLD INCOME
35.7%
WAGE / INCOME GAP [ % ]
64.3¢/ $1
WAGE / INCOME GAP [ $ ]
0.40
INEQUALITY / GINI INDEX
2,496
TOTAL POPULATION
1,375
MALE POPULATION
1,121
FEMALE POPULATION
122.66
MALES / 100 FEMALES
81.53
FEMALES / 100 MALES
40.4
MEDIAN AGE
3.0
AVG FAMILY SIZE
2.6
AVG HOUSEHOLD SIZE
1,190
LABOR FORCE [ PEOPLE ]
59.7%
PERCENT IN LABOR FORCE
8.3%
UNEMPLOYMENT RATE
Blaine Zip Codes
Blaine Area Codes
Income in Blaine
Income Overview in Blaine
Per Capita Income in Blaine is $27,621, while median incomes of families and households are $79,524 and $56,942 respectively.
| Characteristic | Number | Measure |
| Per Capita Income | 2,496 | $27,621 |
| Median Family Income | 716 | $79,524 |
| Mean Family Income | 716 | $83,361 |
| Median Household Income | 959 | $56,942 |
| Mean Household Income | 959 | $72,207 |
| Income Deficit | 716 | $0 |
| Wage / Income Gap (%) | 2,496 | 35.68% |
| Wage / Income Gap ($) | 2,496 | 64.32¢ per $1 |
| Gini / Inequality Index | 2,496 | 0.40 |
Earnings by Sex in Blaine
Average Earnings in Blaine are $45,143, $53,688 for men and $34,531 for women, a difference of 35.7%.
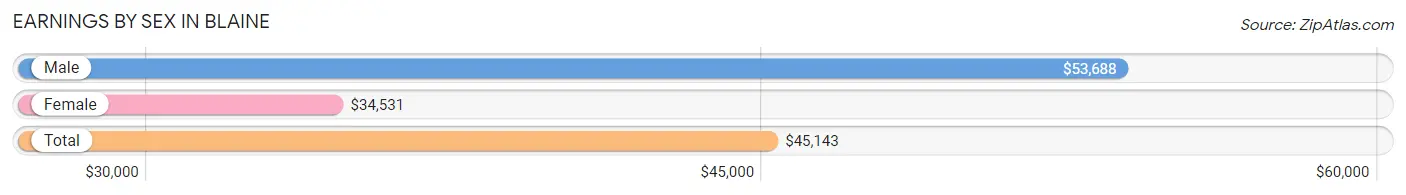
| Sex | Number | Average Earnings |
| Male | 616 (52.9%) | $53,688 |
| Female | 549 (47.1%) | $34,531 |
| Total | 1,165 (100.0%) | $45,143 |
Earnings by Sex by Income Bracket in Blaine
The most common earnings brackets in Blaine are $65,000 to $74,999 for men (108 | 17.5%) and $45,000 to $49,999 for women (107 | 19.5%).
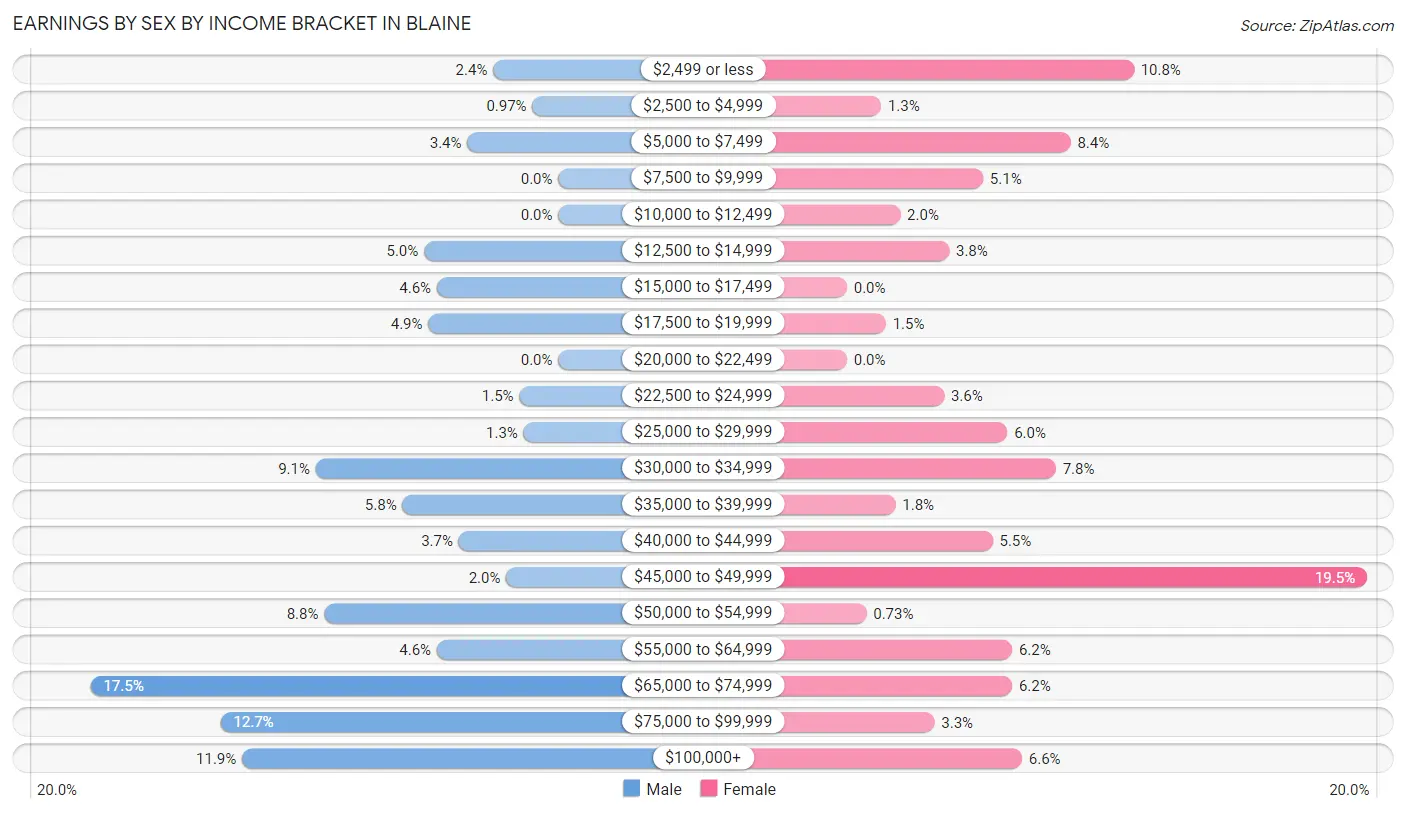
| Income | Male | Female |
| $2,499 or less | 15 (2.4%) | 59 (10.7%) |
| $2,500 to $4,999 | 6 (1.0%) | 7 (1.3%) |
| $5,000 to $7,499 | 21 (3.4%) | 46 (8.4%) |
| $7,500 to $9,999 | 0 (0.0%) | 28 (5.1%) |
| $10,000 to $12,499 | 0 (0.0%) | 11 (2.0%) |
| $12,500 to $14,999 | 31 (5.0%) | 21 (3.8%) |
| $15,000 to $17,499 | 28 (4.5%) | 0 (0.0%) |
| $17,500 to $19,999 | 30 (4.9%) | 8 (1.5%) |
| $20,000 to $22,499 | 0 (0.0%) | 0 (0.0%) |
| $22,500 to $24,999 | 9 (1.5%) | 20 (3.6%) |
| $25,000 to $29,999 | 8 (1.3%) | 33 (6.0%) |
| $30,000 to $34,999 | 56 (9.1%) | 43 (7.8%) |
| $35,000 to $39,999 | 36 (5.8%) | 10 (1.8%) |
| $40,000 to $44,999 | 23 (3.7%) | 30 (5.5%) |
| $45,000 to $49,999 | 12 (1.9%) | 107 (19.5%) |
| $50,000 to $54,999 | 54 (8.8%) | 4 (0.7%) |
| $55,000 to $64,999 | 28 (4.5%) | 34 (6.2%) |
| $65,000 to $74,999 | 108 (17.5%) | 34 (6.2%) |
| $75,000 to $99,999 | 78 (12.7%) | 18 (3.3%) |
| $100,000+ | 73 (11.8%) | 36 (6.6%) |
| Total | 616 (100.0%) | 549 (100.0%) |
Earnings by Sex by Educational Attainment in Blaine
Average earnings in Blaine are $56,510 for men and $43,309 for women, a difference of 23.4%. Men with an educational attainment of college or associate's degree enjoy the highest average annual earnings of $78,269, while those with high school diploma education earn the least with $43,125. Women with an educational attainment of graduate degree earn the most with the average annual earnings of $66,563, while those with high school diploma education have the smallest earnings of $29,479.
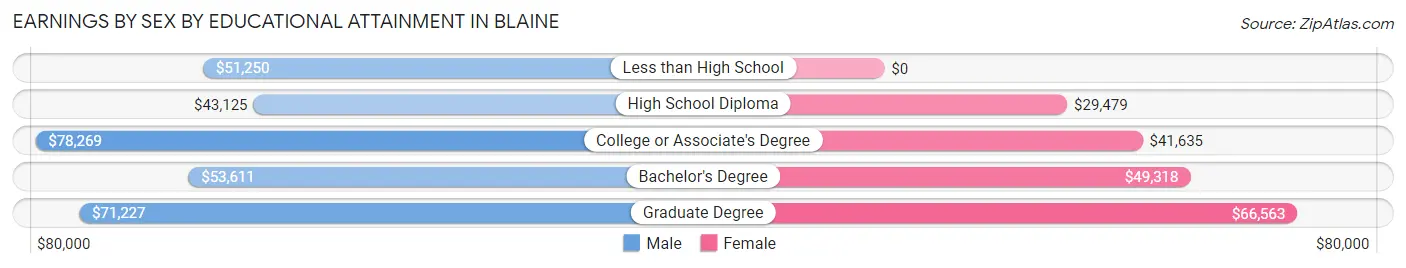
| Educational Attainment | Male Income | Female Income |
| Less than High School | $51,250 | $0 |
| High School Diploma | $43,125 | $29,479 |
| College or Associate's Degree | $78,269 | $41,635 |
| Bachelor's Degree | $53,611 | $49,318 |
| Graduate Degree | $71,227 | $66,563 |
| Total | $56,510 | $43,309 |
Family Income in Blaine
Family Income Brackets in Blaine
According to the Blaine family income data, there are 227 families falling into the $100,000 to $149,999 income range, which is the most common income bracket and makes up 31.7% of all families. Conversely, the $200,000+ income bracket is the least frequent group with only 14 families (2.0%) belonging to this category.
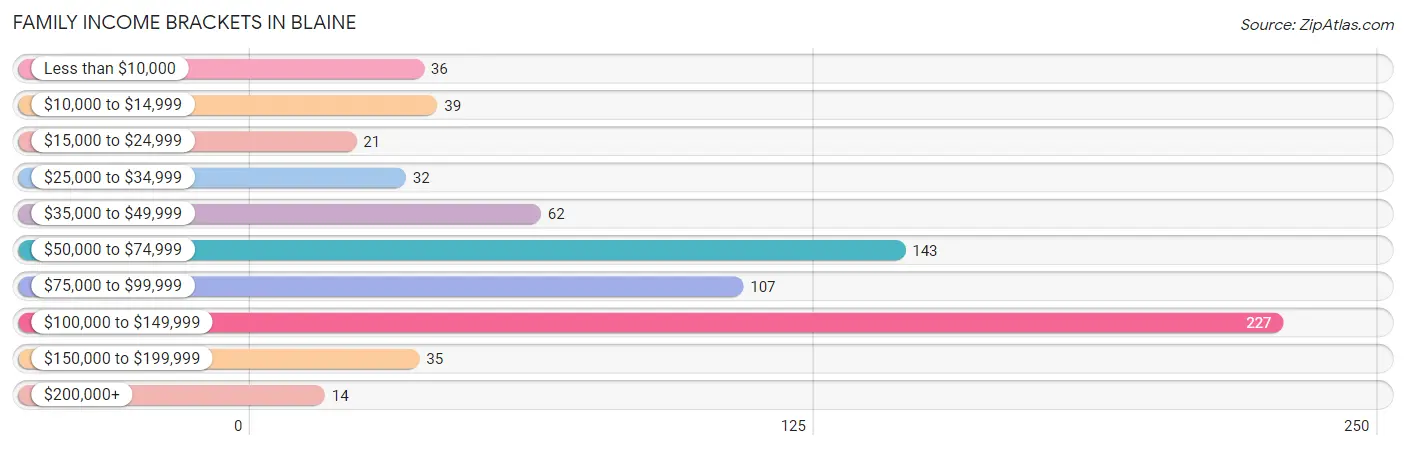
| Income Bracket | # Families | % Families |
| Less than $10,000 | 36 | 5.0% |
| $10,000 to $14,999 | 39 | 5.4% |
| $15,000 to $24,999 | 21 | 2.9% |
| $25,000 to $34,999 | 32 | 4.5% |
| $35,000 to $49,999 | 62 | 8.7% |
| $50,000 to $74,999 | 143 | 20.0% |
| $75,000 to $99,999 | 107 | 14.9% |
| $100,000 to $149,999 | 227 | 31.7% |
| $150,000 to $199,999 | 35 | 4.9% |
| $200,000+ | 14 | 2.0% |
Family Income by Famaliy Size in Blaine
5-person families (30 | 4.2%) account for the highest median family income in Blaine with $133,438 per family, while 2-person families (365 | 51.0%) have the highest median income of $47,410 per family member.
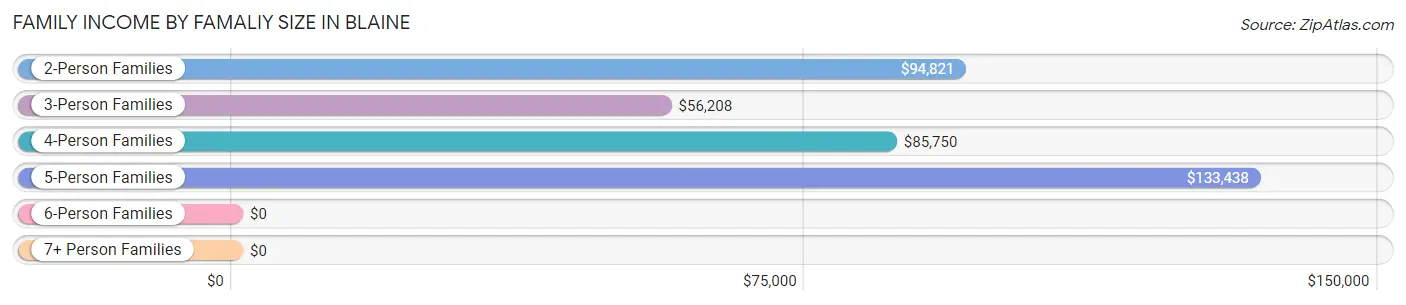
| Income Bracket | # Families | Median Income |
| 2-Person Families | 365 (51.0%) | $94,821 |
| 3-Person Families | 209 (29.2%) | $56,208 |
| 4-Person Families | 108 (15.1%) | $85,750 |
| 5-Person Families | 30 (4.2%) | $133,438 |
| 6-Person Families | 4 (0.6%) | $0 |
| 7+ Person Families | 0 (0.0%) | $0 |
| Total | 716 (100.0%) | $79,524 |
Family Income by Number of Earners in Blaine
The median family income in Blaine is $79,524, with families comprising 3+ earners (70) having the highest median family income of $121,250, while families with no earners (150) have the lowest median family income of $26,618, accounting for 9.8% and 20.9% of families, respectively.
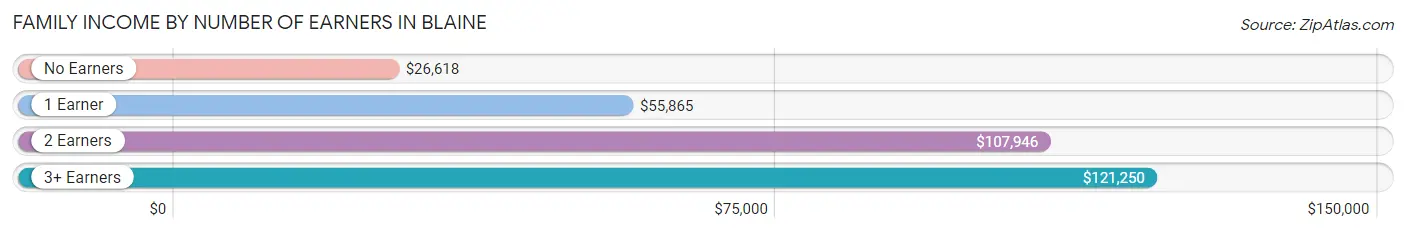
| Number of Earners | # Families | Median Income |
| No Earners | 150 (20.9%) | $26,618 |
| 1 Earner | 211 (29.5%) | $55,865 |
| 2 Earners | 285 (39.8%) | $107,946 |
| 3+ Earners | 70 (9.8%) | $121,250 |
| Total | 716 (100.0%) | $79,524 |
Household Income in Blaine
Household Income Brackets in Blaine
With 251 households falling in the category, the $100,000 to $149,999 income range is the most frequent in Blaine, accounting for 26.2% of all households. In contrast, only 14 households (1.5%) fall into the $200,000+ income bracket, making it the least populous group.
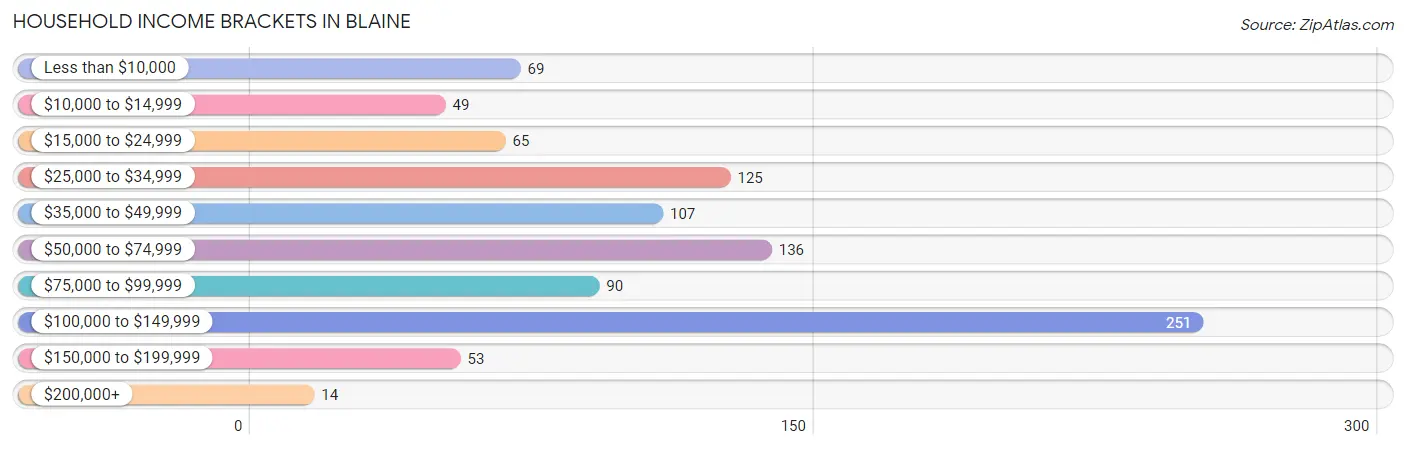
| Income Bracket | # Households | % Households |
| Less than $10,000 | 69 | 7.2% |
| $10,000 to $14,999 | 49 | 5.1% |
| $15,000 to $24,999 | 65 | 6.8% |
| $25,000 to $34,999 | 125 | 13.0% |
| $35,000 to $49,999 | 107 | 11.2% |
| $50,000 to $74,999 | 136 | 14.2% |
| $75,000 to $99,999 | 90 | 9.4% |
| $100,000 to $149,999 | 251 | 26.2% |
| $150,000 to $199,999 | 53 | 5.5% |
| $200,000+ | 14 | 1.5% |
Household Income by Householder Age in Blaine
The median household income in Blaine is $56,942, with the highest median household income of $102,886 found in the 45 to 64 years age bracket for the primary householder. A total of 345 households (36.0%) fall into this category. Meanwhile, the 15 to 24 years age bracket for the primary householder has the lowest median household income of $0, with 9 households (0.9%) in this group.
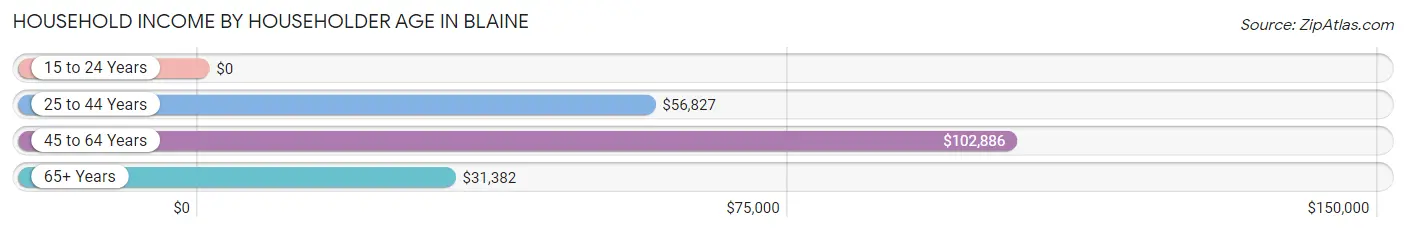
| Income Bracket | # Households | Median Income |
| 15 to 24 Years | 9 (0.9%) | $0 |
| 25 to 44 Years | 341 (35.6%) | $56,827 |
| 45 to 64 Years | 345 (36.0%) | $102,886 |
| 65+ Years | 264 (27.5%) | $31,382 |
| Total | 959 (100.0%) | $56,942 |
Poverty in Blaine
Income Below Poverty by Sex and Age in Blaine
With 11.6% poverty level for males and 16.7% for females among the residents of Blaine, 16 and 17 year old males and 25 to 34 year old females are the most vulnerable to poverty, with 37 males (30.8%) and 49 females (55.7%) in their respective age groups living below the poverty level.
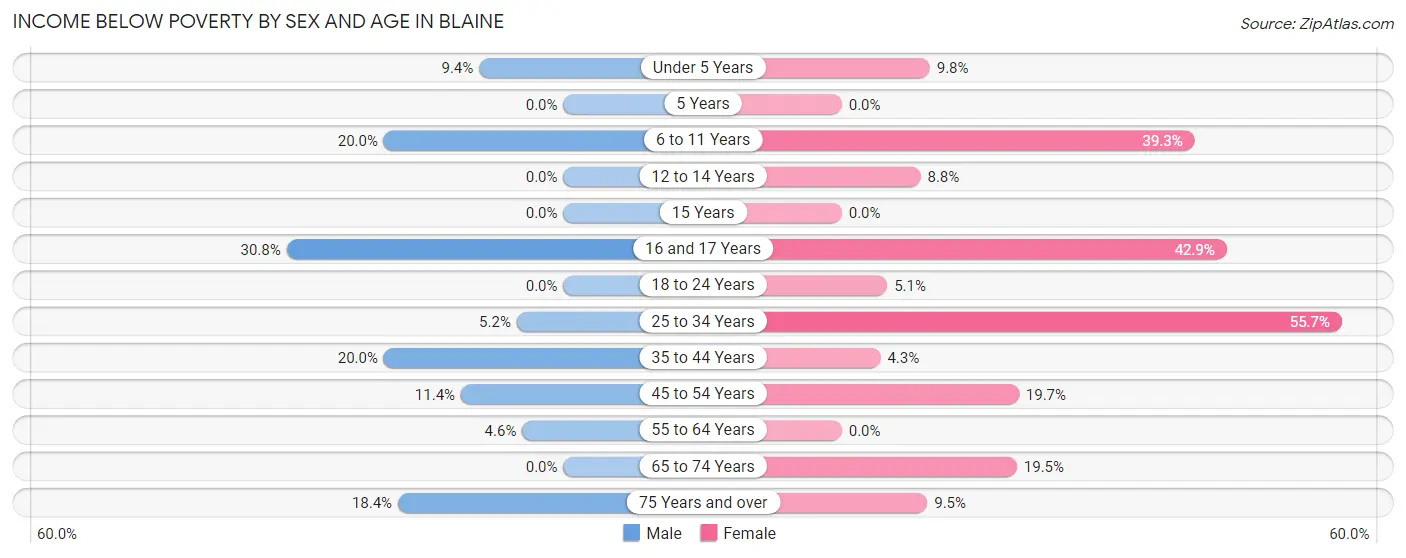
| Age Bracket | Male | Female |
| Under 5 Years | 6 (9.4%) | 5 (9.8%) |
| 5 Years | 0 (0.0%) | 0 (0.0%) |
| 6 to 11 Years | 28 (20.0%) | 22 (39.3%) |
| 12 to 14 Years | 0 (0.0%) | 5 (8.8%) |
| 15 Years | 0 (0.0%) | 0 (0.0%) |
| 16 and 17 Years | 37 (30.8%) | 9 (42.9%) |
| 18 to 24 Years | 0 (0.0%) | 4 (5.1%) |
| 25 to 34 Years | 4 (5.2%) | 49 (55.7%) |
| 35 to 44 Years | 42 (20.0%) | 9 (4.3%) |
| 45 to 54 Years | 21 (11.4%) | 43 (19.7%) |
| 55 to 64 Years | 7 (4.6%) | 0 (0.0%) |
| 65 to 74 Years | 0 (0.0%) | 31 (19.5%) |
| 75 Years and over | 14 (18.4%) | 4 (9.5%) |
| Total | 159 (11.6%) | 181 (16.7%) |
Income Above Poverty by Sex and Age in Blaine
According to the poverty statistics in Blaine, males aged 12 to 14 years and females aged 5 years are the age groups that are most secure financially, with 100.0% of males and 100.0% of females in these age groups living above the poverty line.
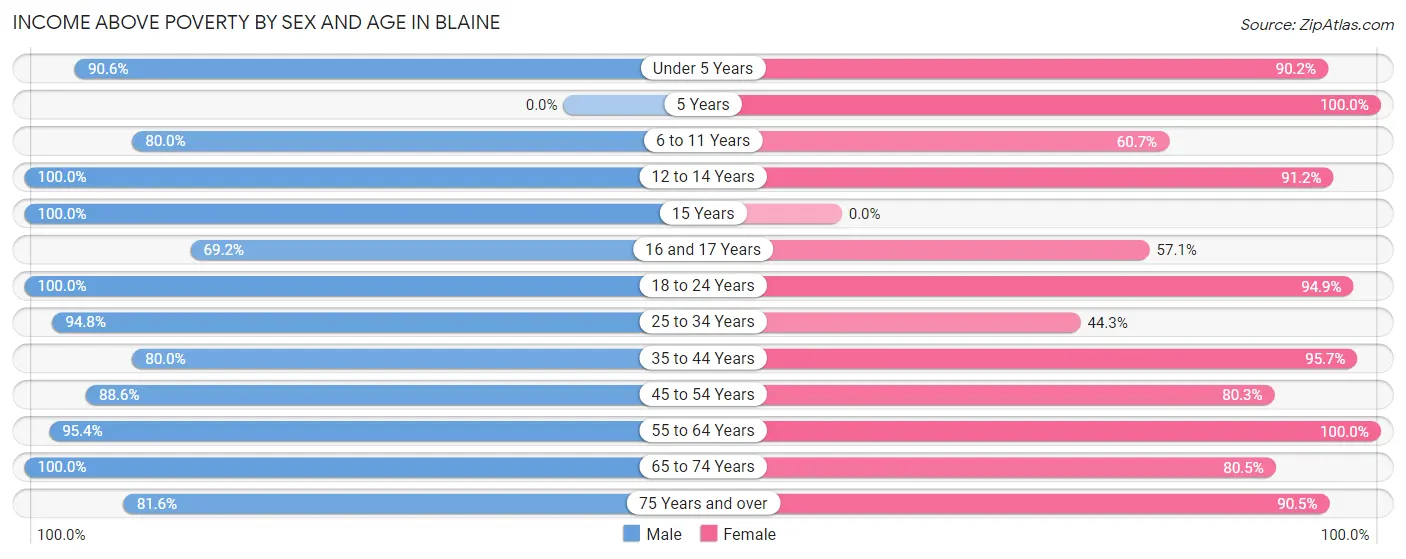
| Age Bracket | Male | Female |
| Under 5 Years | 58 (90.6%) | 46 (90.2%) |
| 5 Years | 0 (0.0%) | 7 (100.0%) |
| 6 to 11 Years | 112 (80.0%) | 34 (60.7%) |
| 12 to 14 Years | 67 (100.0%) | 52 (91.2%) |
| 15 Years | 18 (100.0%) | 0 (0.0%) |
| 16 and 17 Years | 83 (69.2%) | 12 (57.1%) |
| 18 to 24 Years | 163 (100.0%) | 75 (94.9%) |
| 25 to 34 Years | 73 (94.8%) | 39 (44.3%) |
| 35 to 44 Years | 168 (80.0%) | 200 (95.7%) |
| 45 to 54 Years | 163 (88.6%) | 175 (80.3%) |
| 55 to 64 Years | 146 (95.4%) | 100 (100.0%) |
| 65 to 74 Years | 95 (100.0%) | 128 (80.5%) |
| 75 Years and over | 62 (81.6%) | 38 (90.5%) |
| Total | 1,208 (88.4%) | 906 (83.4%) |
Income Below Poverty Among Married-Couple Families in Blaine
The poverty statistics for married-couple families in Blaine show that 5.5% or 25 of the total 457 families live below the poverty line. Families with 1 or 2 children have the highest poverty rate of 11.8%, comprising of 21 families. On the other hand, families with 3 or 4 children have the lowest poverty rate of 0.0%, which includes 0 families.
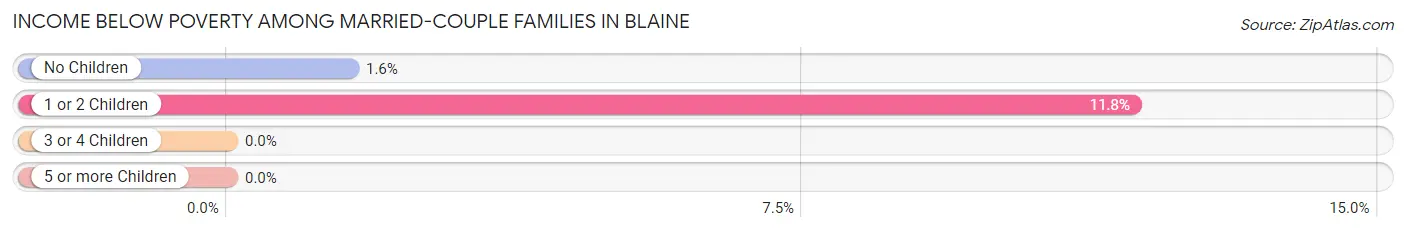
| Children | Above Poverty | Below Poverty |
| No Children | 249 (98.4%) | 4 (1.6%) |
| 1 or 2 Children | 157 (88.2%) | 21 (11.8%) |
| 3 or 4 Children | 26 (100.0%) | 0 (0.0%) |
| 5 or more Children | 0 (0.0%) | 0 (0.0%) |
| Total | 432 (94.5%) | 25 (5.5%) |
Income Below Poverty Among Single-Parent Households in Blaine
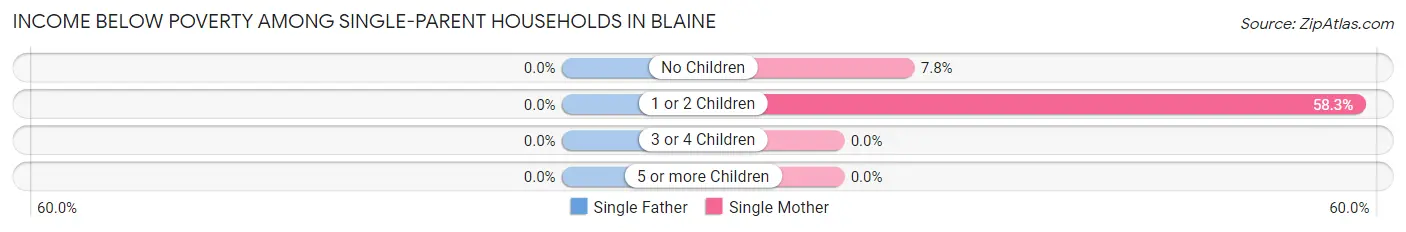
| Children | Single Father | Single Mother |
| No Children | 0 (0.0%) | 4 (7.8%) |
| 1 or 2 Children | 0 (0.0%) | 67 (58.3%) |
| 3 or 4 Children | 0 (0.0%) | 0 (0.0%) |
| 5 or more Children | 0 (0.0%) | 0 (0.0%) |
| Total | 0 (0.0%) | 71 (42.8%) |
Income Below Poverty Among Married-Couple vs Single-Parent Households in Blaine
The poverty data for Blaine shows that 25 of the married-couple family households (5.5%) and 71 of the single-parent households (27.4%) are living below the poverty level. Within the married-couple family households, those with 1 or 2 children have the highest poverty rate, with 21 households (11.8%) falling below the poverty line. Among the single-parent households, those with 1 or 2 children have the highest poverty rate, with 67 household (52.3%) living below poverty.
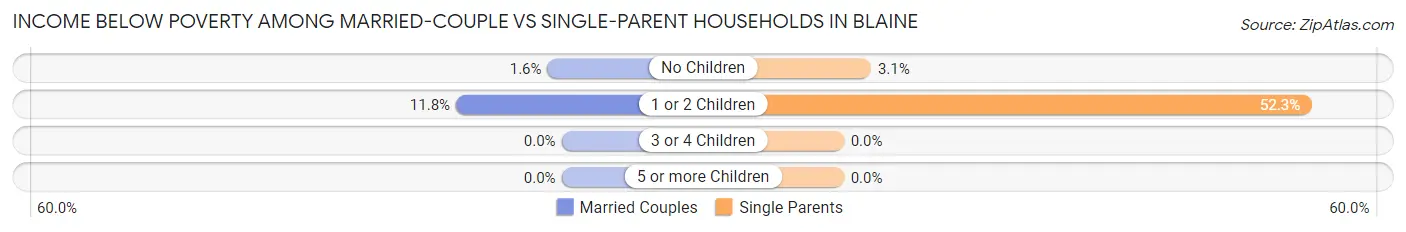
| Children | Married-Couple Families | Single-Parent Households |
| No Children | 4 (1.6%) | 4 (3.0%) |
| 1 or 2 Children | 21 (11.8%) | 67 (52.3%) |
| 3 or 4 Children | 0 (0.0%) | 0 (0.0%) |
| 5 or more Children | 0 (0.0%) | 0 (0.0%) |
| Total | 25 (5.5%) | 71 (27.4%) |
Race in Blaine
The most populous races in Blaine are White / Caucasian (2,314 | 92.7%), Hispanic or Latino (123 | 4.9%), and Black / African American (114 | 4.6%).
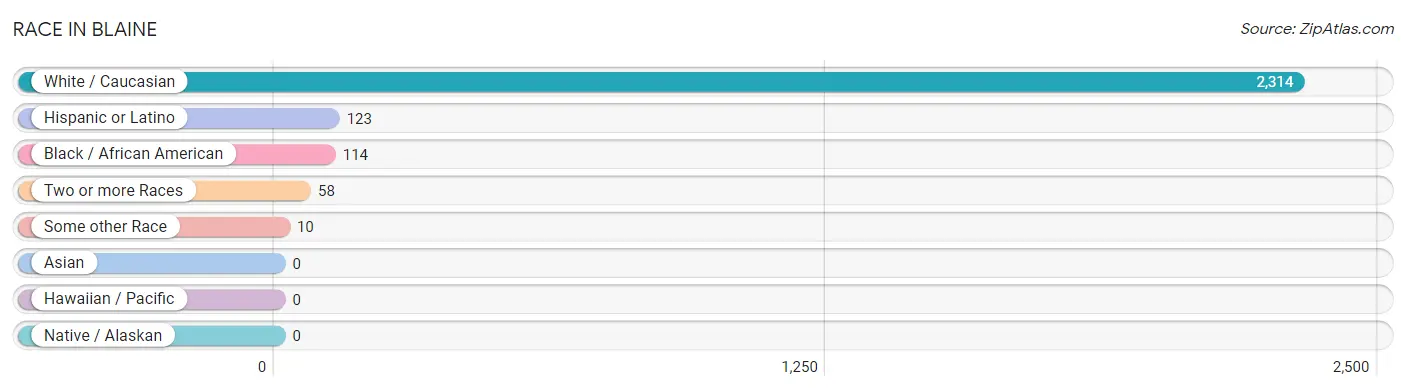
| Race | # Population | % Population |
| Asian | 0 | 0.0% |
| Black / African American | 114 | 4.6% |
| Hawaiian / Pacific | 0 | 0.0% |
| Hispanic or Latino | 123 | 4.9% |
| Native / Alaskan | 0 | 0.0% |
| White / Caucasian | 2,314 | 92.7% |
| Two or more Races | 58 | 2.3% |
| Some other Race | 10 | 0.4% |
| Total | 2,496 | 100.0% |
Ancestry in Blaine
The most populous ancestries reported in Blaine are American (794 | 31.8%), English (346 | 13.9%), German (176 | 7.0%), Irish (173 | 6.9%), and Samoan (58 | 2.3%), together accounting for 62.0% of all Blaine residents.
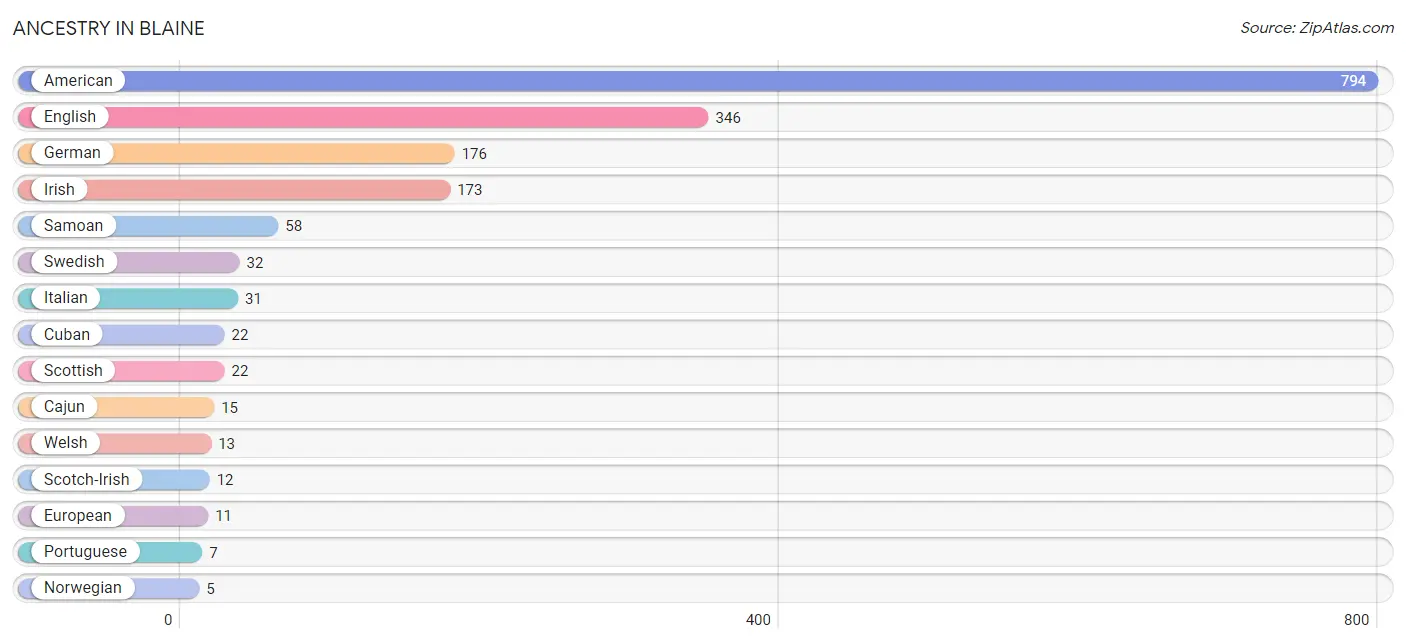
| Ancestry | # Population | % Population |
| American | 794 | 31.8% |
| Cajun | 15 | 0.6% |
| Cuban | 22 | 0.9% |
| English | 346 | 13.9% |
| European | 11 | 0.4% |
| German | 176 | 7.0% |
| Irish | 173 | 6.9% |
| Italian | 31 | 1.2% |
| Norwegian | 5 | 0.2% |
| Portuguese | 7 | 0.3% |
| Samoan | 58 | 2.3% |
| Scotch-Irish | 12 | 0.5% |
| Scottish | 22 | 0.9% |
| Swedish | 32 | 1.3% |
| Swiss | 3 | 0.1% |
| Welsh | 13 | 0.5% | View All 16 Rows |
Immigrants in Blaine
The most numerous immigrant groups reported in Blaine came from Europe (32 | 1.3%), Northern Europe (32 | 1.3%), and Scotland (7 | 0.3%), together accounting for 2.8% of all Blaine residents.
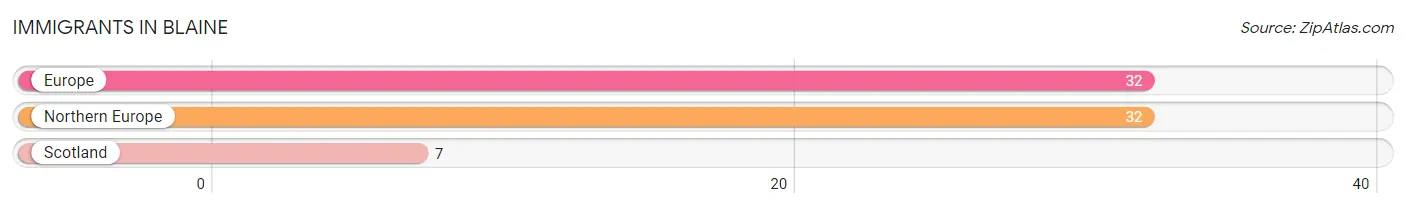
| Immigration Origin | # Population | % Population |
| Europe | 32 | 1.3% |
| Northern Europe | 32 | 1.3% |
| Scotland | 7 | 0.3% | View All 3 Rows |
Sex and Age in Blaine
Sex and Age in Blaine
The most populous age groups in Blaine are 15 to 19 Years (154 | 11.2%) for men and 50 to 54 Years (120 | 10.7%) for women.
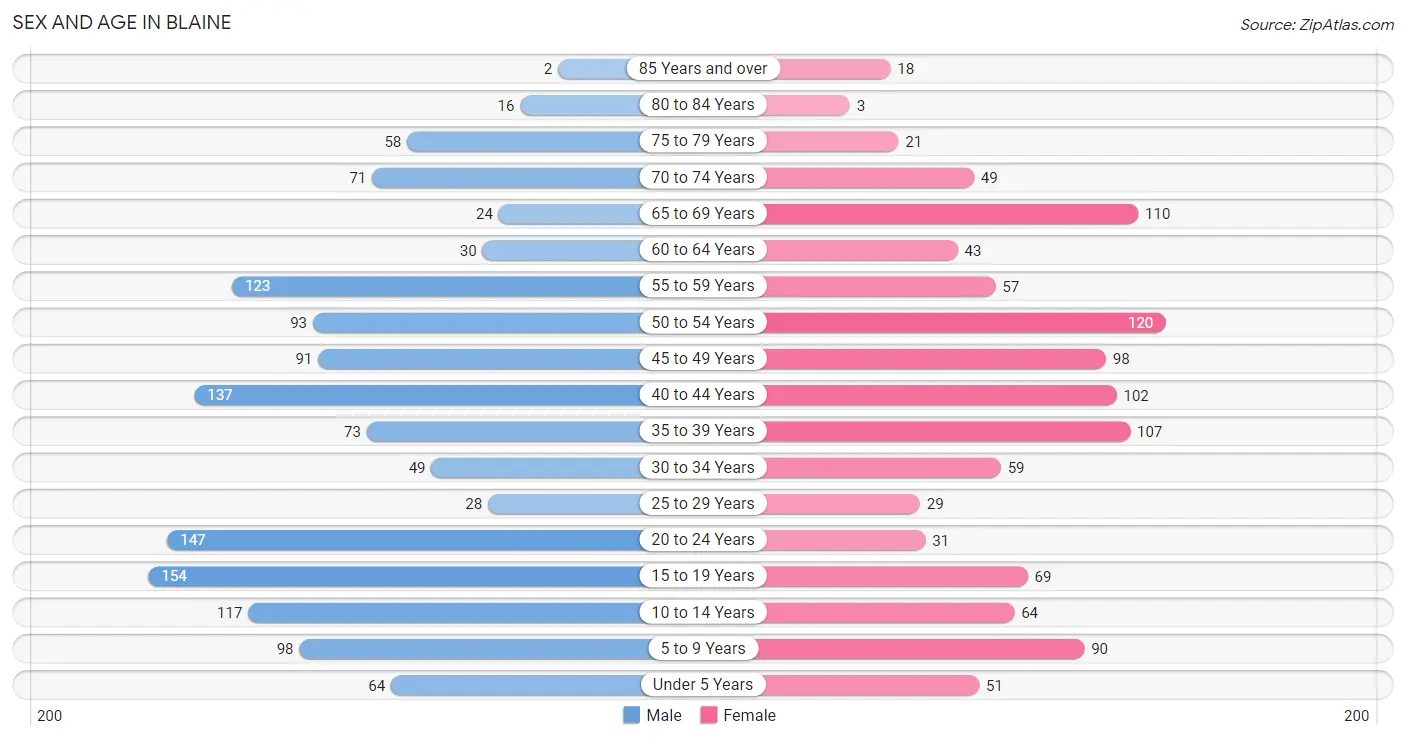
| Age Bracket | Male | Female |
| Under 5 Years | 64 (4.6%) | 51 (4.5%) |
| 5 to 9 Years | 98 (7.1%) | 90 (8.0%) |
| 10 to 14 Years | 117 (8.5%) | 64 (5.7%) |
| 15 to 19 Years | 154 (11.2%) | 69 (6.2%) |
| 20 to 24 Years | 147 (10.7%) | 31 (2.8%) |
| 25 to 29 Years | 28 (2.0%) | 29 (2.6%) |
| 30 to 34 Years | 49 (3.6%) | 59 (5.3%) |
| 35 to 39 Years | 73 (5.3%) | 107 (9.6%) |
| 40 to 44 Years | 137 (10.0%) | 102 (9.1%) |
| 45 to 49 Years | 91 (6.6%) | 98 (8.7%) |
| 50 to 54 Years | 93 (6.8%) | 120 (10.7%) |
| 55 to 59 Years | 123 (8.9%) | 57 (5.1%) |
| 60 to 64 Years | 30 (2.2%) | 43 (3.8%) |
| 65 to 69 Years | 24 (1.8%) | 110 (9.8%) |
| 70 to 74 Years | 71 (5.2%) | 49 (4.4%) |
| 75 to 79 Years | 58 (4.2%) | 21 (1.9%) |
| 80 to 84 Years | 16 (1.2%) | 3 (0.3%) |
| 85 Years and over | 2 (0.2%) | 18 (1.6%) |
| Total | 1,375 (100.0%) | 1,121 (100.0%) |
Families and Households in Blaine
Median Family Size in Blaine
The median family size in Blaine is 2.98 persons per family, with married-couple families (457 | 63.8%) accounting for the largest median family size of 3.11 persons per family. On the other hand, single male/father families (93 | 13.0%) represent the smallest median family size with 2.24 persons per family.
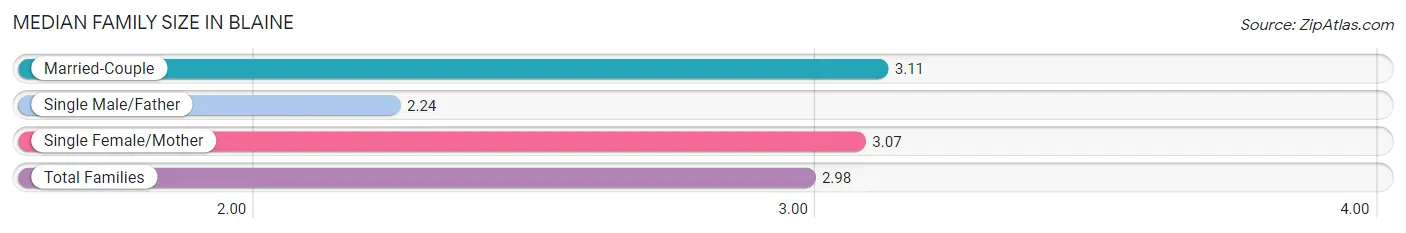
| Family Type | # Families | Family Size |
| Married-Couple | 457 (63.8%) | 3.11 |
| Single Male/Father | 93 (13.0%) | 2.24 |
| Single Female/Mother | 166 (23.2%) | 3.07 |
| Total Families | 716 (100.0%) | 2.98 |
Median Household Size in Blaine
The median household size in Blaine is 2.60 persons per household, with single female/mother households (166 | 17.3%) accounting for the largest median household size of 3.22 persons per household. non-family households (243 | 25.3%) represent the smallest median household size with 1.14 persons per household.
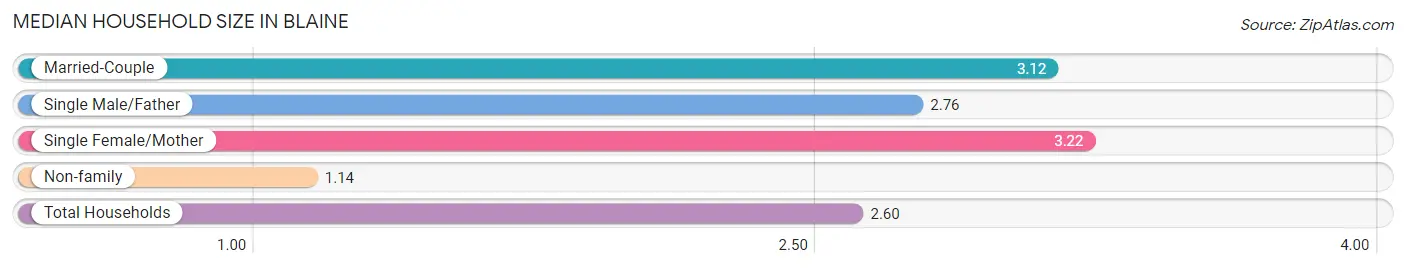
| Household Type | # Households | Household Size |
| Married-Couple | 457 (47.6%) | 3.12 |
| Single Male/Father | 93 (9.7%) | 2.76 |
| Single Female/Mother | 166 (17.3%) | 3.22 |
| Non-family | 243 (25.3%) | 1.14 |
| Total Households | 959 (100.0%) | 2.60 |
Household Size by Marriage Status in Blaine
Out of a total of 959 households in Blaine, 716 (74.7%) are family households, while 243 (25.3%) are nonfamily households. The most numerous type of family households are 2-person households, comprising 334, and the most common type of nonfamily households are 1-person households, comprising 238.
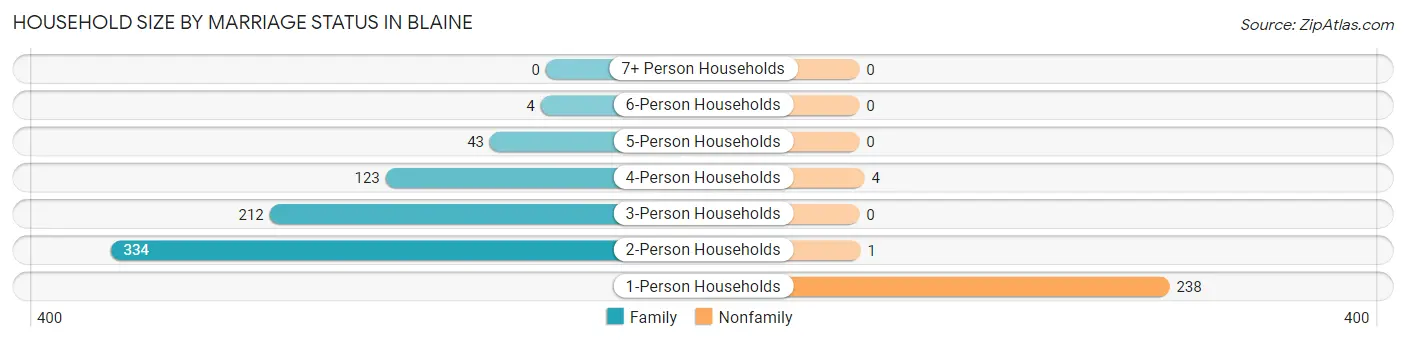
| Household Size | Family Households | Nonfamily Households |
| 1-Person Households | - | 238 (24.8%) |
| 2-Person Households | 334 (34.8%) | 1 (0.1%) |
| 3-Person Households | 212 (22.1%) | 0 (0.0%) |
| 4-Person Households | 123 (12.8%) | 4 (0.4%) |
| 5-Person Households | 43 (4.5%) | 0 (0.0%) |
| 6-Person Households | 4 (0.4%) | 0 (0.0%) |
| 7+ Person Households | 0 (0.0%) | 0 (0.0%) |
| Total | 716 (74.7%) | 243 (25.3%) |
Female Fertility in Blaine
Fertility by Age in Blaine
Average fertility rate in Blaine is 39.0 births per 1,000 women. Women in the age bracket of 20 to 34 years have the highest fertility rate with 185.0 births per 1,000 women. Women in the age bracket of 20 to 34 years acount for 100.0% of all women with births.
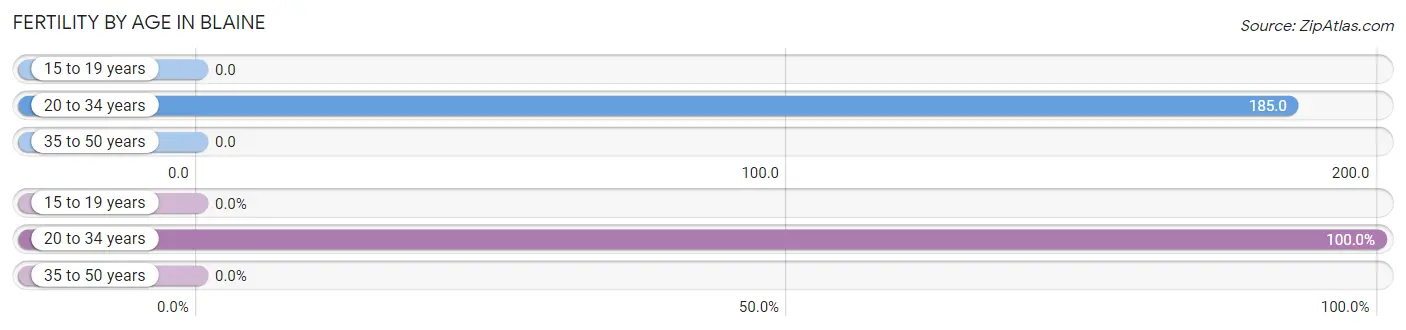
| Age Bracket | Women with Births | Births / 1,000 Women |
| 15 to 19 years | 0 (0.0%) | 0.0 |
| 20 to 34 years | 22 (100.0%) | 185.0 |
| 35 to 50 years | 0 (0.0%) | 0.0 |
| Total | 22 (100.0%) | 39.0 |
Fertility by Age by Marriage Status in Blaine
31.8% of women with births (22) in Blaine are married. The highest percentage of unmarried women with births falls into 20 to 34 years age bracket with 68.2% of them unmarried at the time of birth, while the lowest percentage of unmarried women with births belong to 20 to 34 years age bracket with 68.2% of them unmarried.
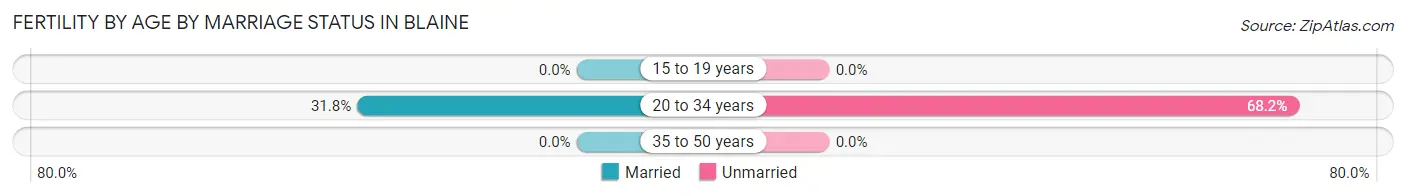
| Age Bracket | Married | Unmarried |
| 15 to 19 years | 0 (0.0%) | 0 (0.0%) |
| 20 to 34 years | 7 (31.8%) | 15 (68.2%) |
| 35 to 50 years | 0 (0.0%) | 0 (0.0%) |
| Total | 7 (31.8%) | 15 (68.2%) |
Fertility by Education in Blaine
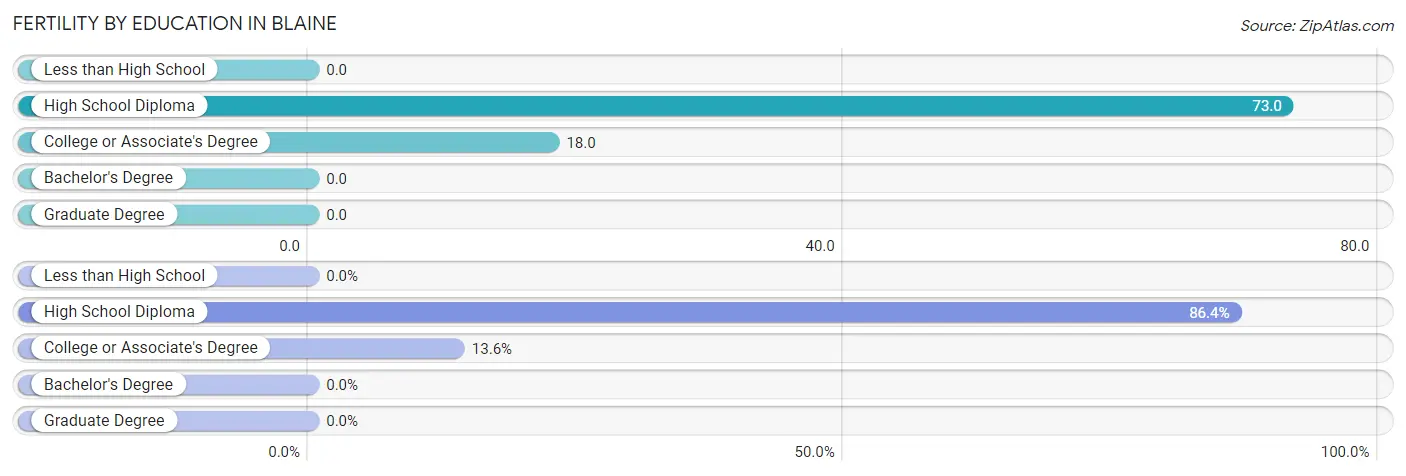
| Educational Attainment | Women with Births | Births / 1,000 Women |
| Less than High School | 0 (0.0%) | 0.0 |
| High School Diploma | 19 (86.4%) | 73.0 |
| College or Associate's Degree | 3 (13.6%) | 18.0 |
| Bachelor's Degree | 0 (0.0%) | 0.0 |
| Graduate Degree | 0 (0.0%) | 0.0 |
| Total | 22 (100.0%) | 39.0 |
Fertility by Education by Marriage Status in Blaine
68.2% of women with births in Blaine are unmarried. Women with the educational attainment of college or associate's degree are most likely to be married with 100.0% of them married at childbirth, while women with the educational attainment of high school diploma are least likely to be married with 78.9% of them unmarried at childbirth.
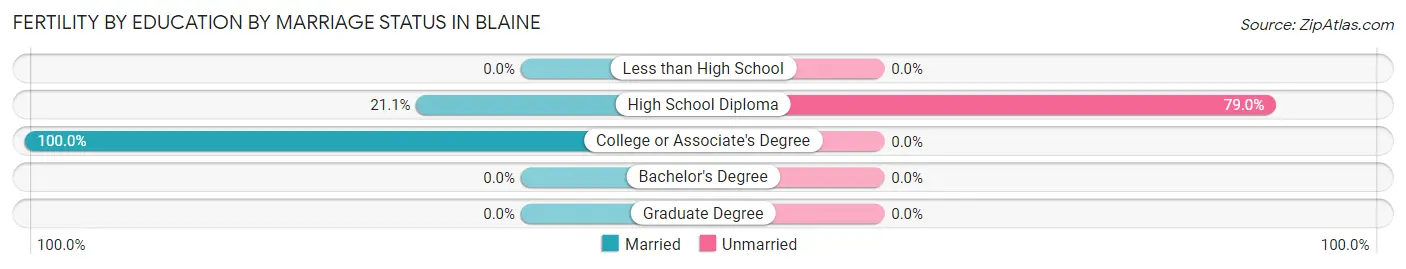
| Educational Attainment | Married | Unmarried |
| Less than High School | 0 (0.0%) | 0 (0.0%) |
| High School Diploma | 4 (21.0%) | 15 (78.9%) |
| College or Associate's Degree | 3 (100.0%) | 0 (0.0%) |
| Bachelor's Degree | 0 (0.0%) | 0 (0.0%) |
| Graduate Degree | 0 (0.0%) | 0 (0.0%) |
| Total | 7 (31.8%) | 15 (68.2%) |
Employment Characteristics in Blaine
Employment by Class of Employer in Blaine
Among the 1,083 employed individuals in Blaine, private company employees (684 | 63.2%), local government employees (111 | 10.2%), and not-for-profit organizations (81 | 7.5%) make up the most common classes of employment.
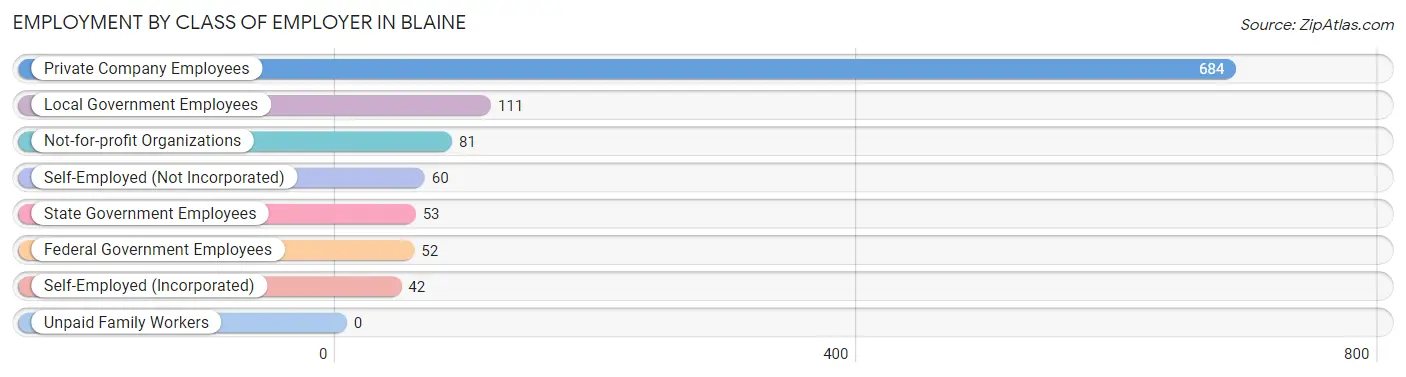
| Employer Class | # Employees | % Employees |
| Private Company Employees | 684 | 63.2% |
| Self-Employed (Incorporated) | 42 | 3.9% |
| Self-Employed (Not Incorporated) | 60 | 5.5% |
| Not-for-profit Organizations | 81 | 7.5% |
| Local Government Employees | 111 | 10.2% |
| State Government Employees | 53 | 4.9% |
| Federal Government Employees | 52 | 4.8% |
| Unpaid Family Workers | 0 | 0.0% |
| Total | 1,083 | 100.0% |
Employment Status by Age in Blaine
According to the labor force statistics for Blaine, out of the total population over 16 years of age (1,994), 59.7% or 1,190 individuals are in the labor force, with 8.3% or 99 of them unemployed. The age group with the highest labor force participation rate is 55 to 59 years, with 91.7% or 165 individuals in the labor force. Within the labor force, the 16 to 19 years age range has the highest percentage of unemployed individuals, with 35.5% or 27 of them being unemployed.
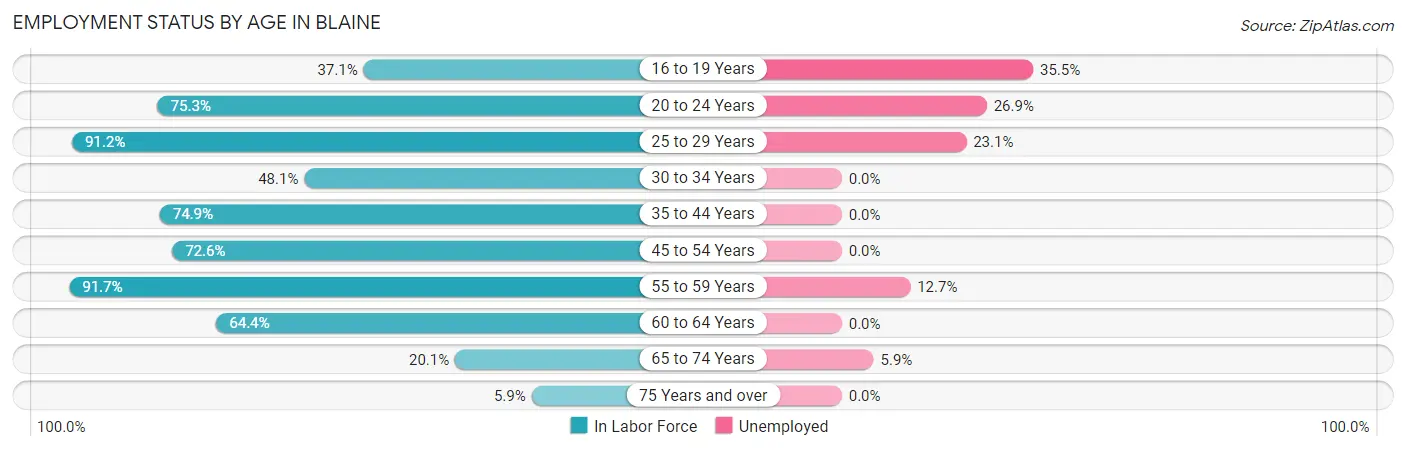
| Age Bracket | In Labor Force | Unemployed |
| 16 to 19 Years | 76 (37.1%) | 27 (35.5%) |
| 20 to 24 Years | 134 (75.3%) | 36 (26.9%) |
| 25 to 29 Years | 52 (91.2%) | 12 (23.1%) |
| 30 to 34 Years | 52 (48.1%) | 0 (0.0%) |
| 35 to 44 Years | 314 (74.9%) | 0 (0.0%) |
| 45 to 54 Years | 292 (72.6%) | 0 (0.0%) |
| 55 to 59 Years | 165 (91.7%) | 21 (12.7%) |
| 60 to 64 Years | 47 (64.4%) | 0 (0.0%) |
| 65 to 74 Years | 51 (20.1%) | 3 (5.9%) |
| 75 Years and over | 7 (5.9%) | 0 (0.0%) |
| Total | 1,190 (59.7%) | 99 (8.3%) |
Employment Status by Educational Attainment in Blaine
According to labor force statistics for Blaine, 74.4% of individuals (922) out of the total population between 25 and 64 years of age (1,239) are in the labor force, with 3.6% or 33 of them being unemployed. The group with the highest labor force participation rate are those with the educational attainment of bachelor's degree or higher, with 89.7% or 235 individuals in the labor force. Within the labor force, individuals with high school diploma education have the highest percentage of unemployment, with 6.9% or 33 of them being unemployed.
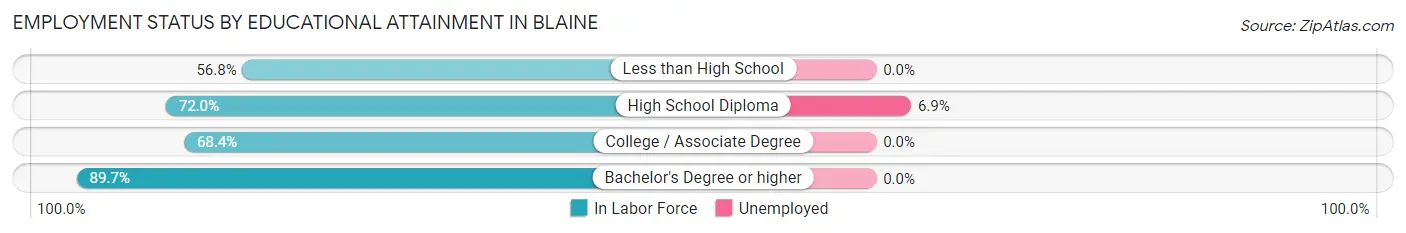
| Educational Attainment | In Labor Force | Unemployed |
| Less than High School | 25 (56.8%) | 0 (0.0%) |
| High School Diploma | 480 (72.0%) | 46 (6.9%) |
| College / Associate Degree | 182 (68.4%) | 0 (0.0%) |
| Bachelor's Degree or higher | 235 (89.7%) | 0 (0.0%) |
| Total | 922 (74.4%) | 45 (3.6%) |
Employment Occupations by Sex in Blaine
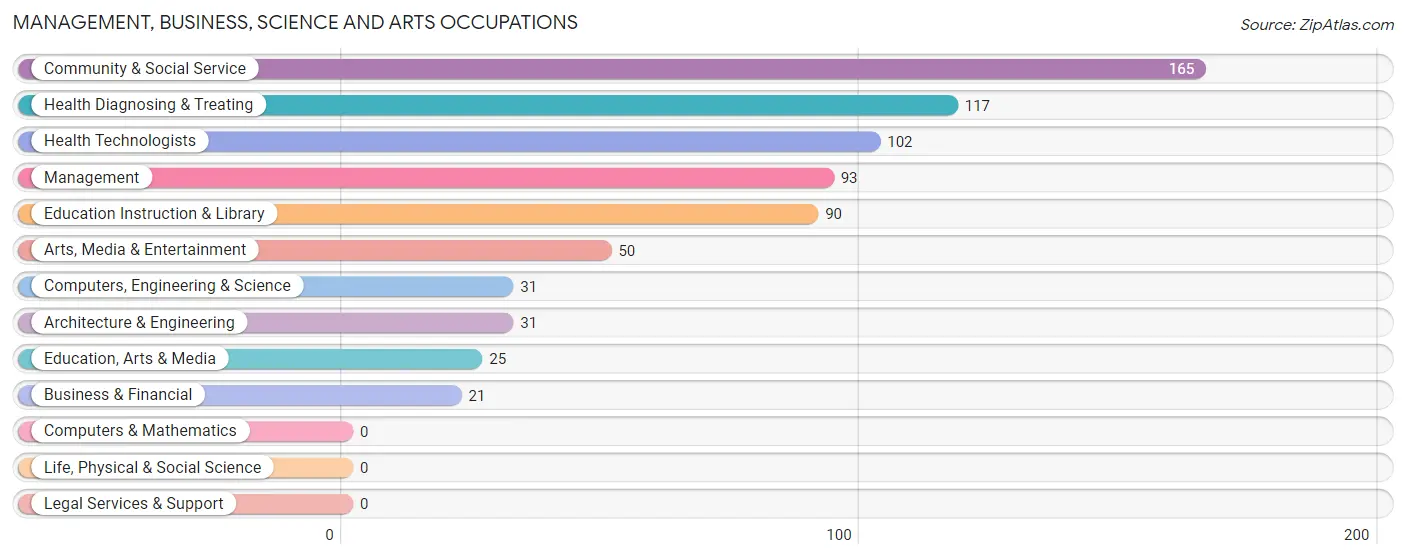
Management, Business, Science and Arts Occupations
The most common Management, Business, Science and Arts occupations in Blaine are Community & Social Service (165 | 15.1%), Health Diagnosing & Treating (117 | 10.7%), Health Technologists (102 | 9.3%), Management (93 | 8.5%), and Education Instruction & Library (90 | 8.3%).
Management, Business, Science and Arts Occupations by Sex
Within the Management, Business, Science and Arts occupations in Blaine, the most male-oriented occupations are Arts, Media & Entertainment (100.0%), Computers, Engineering & Science (67.7%), and Architecture & Engineering (67.7%), while the most female-oriented occupations are Education, Arts & Media (100.0%), Education Instruction & Library (91.1%), and Community & Social Service (64.8%).
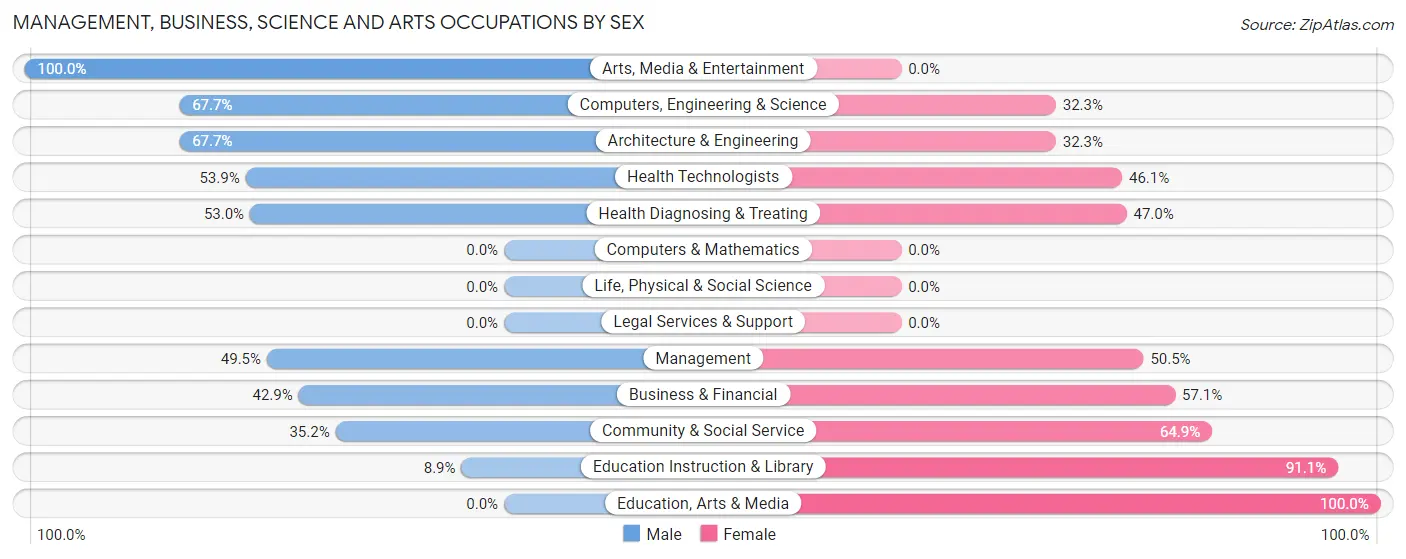
| Occupation | Male | Female |
| Management | 46 (49.5%) | 47 (50.5%) |
| Business & Financial | 9 (42.9%) | 12 (57.1%) |
| Computers, Engineering & Science | 21 (67.7%) | 10 (32.3%) |
| Computers & Mathematics | 0 (0.0%) | 0 (0.0%) |
| Architecture & Engineering | 21 (67.7%) | 10 (32.3%) |
| Life, Physical & Social Science | 0 (0.0%) | 0 (0.0%) |
| Community & Social Service | 58 (35.1%) | 107 (64.8%) |
| Education, Arts & Media | 0 (0.0%) | 25 (100.0%) |
| Legal Services & Support | 0 (0.0%) | 0 (0.0%) |
| Education Instruction & Library | 8 (8.9%) | 82 (91.1%) |
| Arts, Media & Entertainment | 50 (100.0%) | 0 (0.0%) |
| Health Diagnosing & Treating | 62 (53.0%) | 55 (47.0%) |
| Health Technologists | 55 (53.9%) | 47 (46.1%) |
| Total (Category) | 196 (45.9%) | 231 (54.1%) |
| Total (Overall) | 577 (52.9%) | 514 (47.1%) |
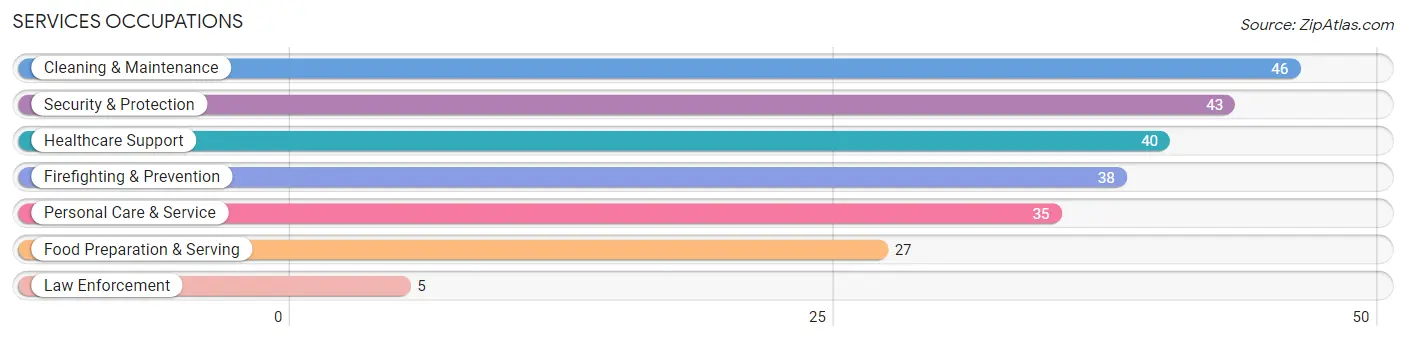
Services Occupations
The most common Services occupations in Blaine are Cleaning & Maintenance (46 | 4.2%), Security & Protection (43 | 3.9%), Healthcare Support (40 | 3.7%), Firefighting & Prevention (38 | 3.5%), and Personal Care & Service (35 | 3.2%).
Services Occupations by Sex
Within the Services occupations in Blaine, the most male-oriented occupations are Security & Protection (100.0%), Firefighting & Prevention (100.0%), and Law Enforcement (100.0%), while the most female-oriented occupations are Healthcare Support (100.0%), Food Preparation & Serving (100.0%), and Personal Care & Service (100.0%).
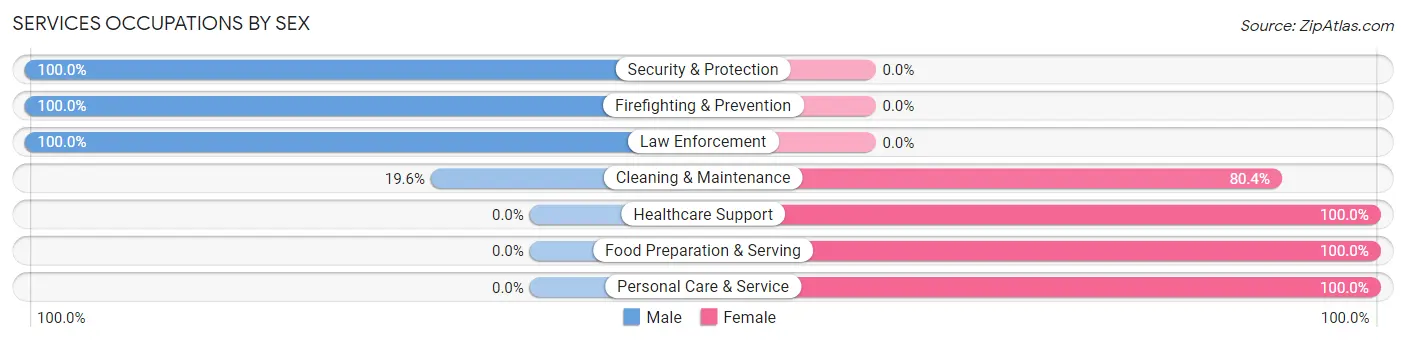
| Occupation | Male | Female |
| Healthcare Support | 0 (0.0%) | 40 (100.0%) |
| Security & Protection | 43 (100.0%) | 0 (0.0%) |
| Firefighting & Prevention | 38 (100.0%) | 0 (0.0%) |
| Law Enforcement | 5 (100.0%) | 0 (0.0%) |
| Food Preparation & Serving | 0 (0.0%) | 27 (100.0%) |
| Cleaning & Maintenance | 9 (19.6%) | 37 (80.4%) |
| Personal Care & Service | 0 (0.0%) | 35 (100.0%) |
| Total (Category) | 52 (27.2%) | 139 (72.8%) |
| Total (Overall) | 577 (52.9%) | 514 (47.1%) |
Sales and Office Occupations
The most common Sales and Office occupations in Blaine are Office & Administration (114 | 10.4%), and Sales & Related (102 | 9.3%).
Sales and Office Occupations by Sex
| Occupation | Male | Female |
| Sales & Related | 69 (67.6%) | 33 (32.4%) |
| Office & Administration | 38 (33.3%) | 76 (66.7%) |
| Total (Category) | 107 (49.5%) | 109 (50.5%) |
| Total (Overall) | 577 (52.9%) | 514 (47.1%) |
Natural Resources, Construction and Maintenance Occupations
The most common Natural Resources, Construction and Maintenance occupations in Blaine are Construction & Extraction (49 | 4.5%), and Installation, Maintenance & Repair (24 | 2.2%).
Natural Resources, Construction and Maintenance Occupations by Sex
| Occupation | Male | Female |
| Farming, Fishing & Forestry | 0 (0.0%) | 0 (0.0%) |
| Construction & Extraction | 49 (100.0%) | 0 (0.0%) |
| Installation, Maintenance & Repair | 24 (100.0%) | 0 (0.0%) |
| Total (Category) | 73 (100.0%) | 0 (0.0%) |
| Total (Overall) | 577 (52.9%) | 514 (47.1%) |
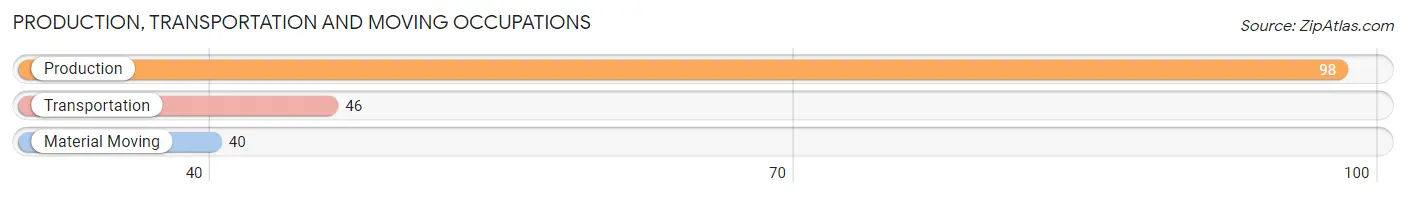
Production, Transportation and Moving Occupations
The most common Production, Transportation and Moving occupations in Blaine are Production (98 | 9.0%), Transportation (46 | 4.2%), and Material Moving (40 | 3.7%).
Production, Transportation and Moving Occupations by Sex
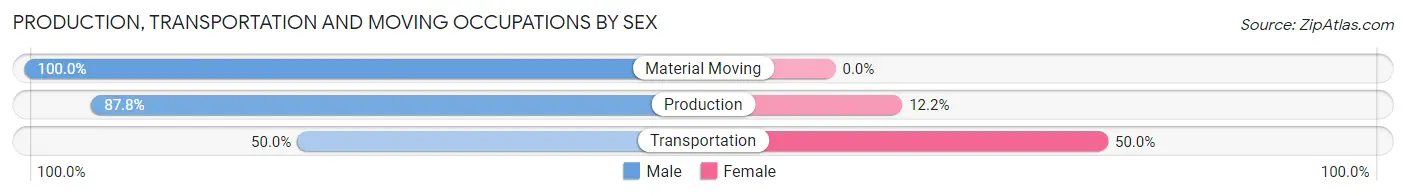
| Occupation | Male | Female |
| Production | 86 (87.8%) | 12 (12.2%) |
| Transportation | 23 (50.0%) | 23 (50.0%) |
| Material Moving | 40 (100.0%) | 0 (0.0%) |
| Total (Category) | 149 (81.0%) | 35 (19.0%) |
| Total (Overall) | 577 (52.9%) | 514 (47.1%) |
Employment Industries by Sex in Blaine
Employment Industries in Blaine
The major employment industries in Blaine include Health Care & Social Assistance (245 | 22.5%), Educational Services (178 | 16.3%), Manufacturing (137 | 12.6%), Retail Trade (125 | 11.5%), and Construction (80 | 7.3%).
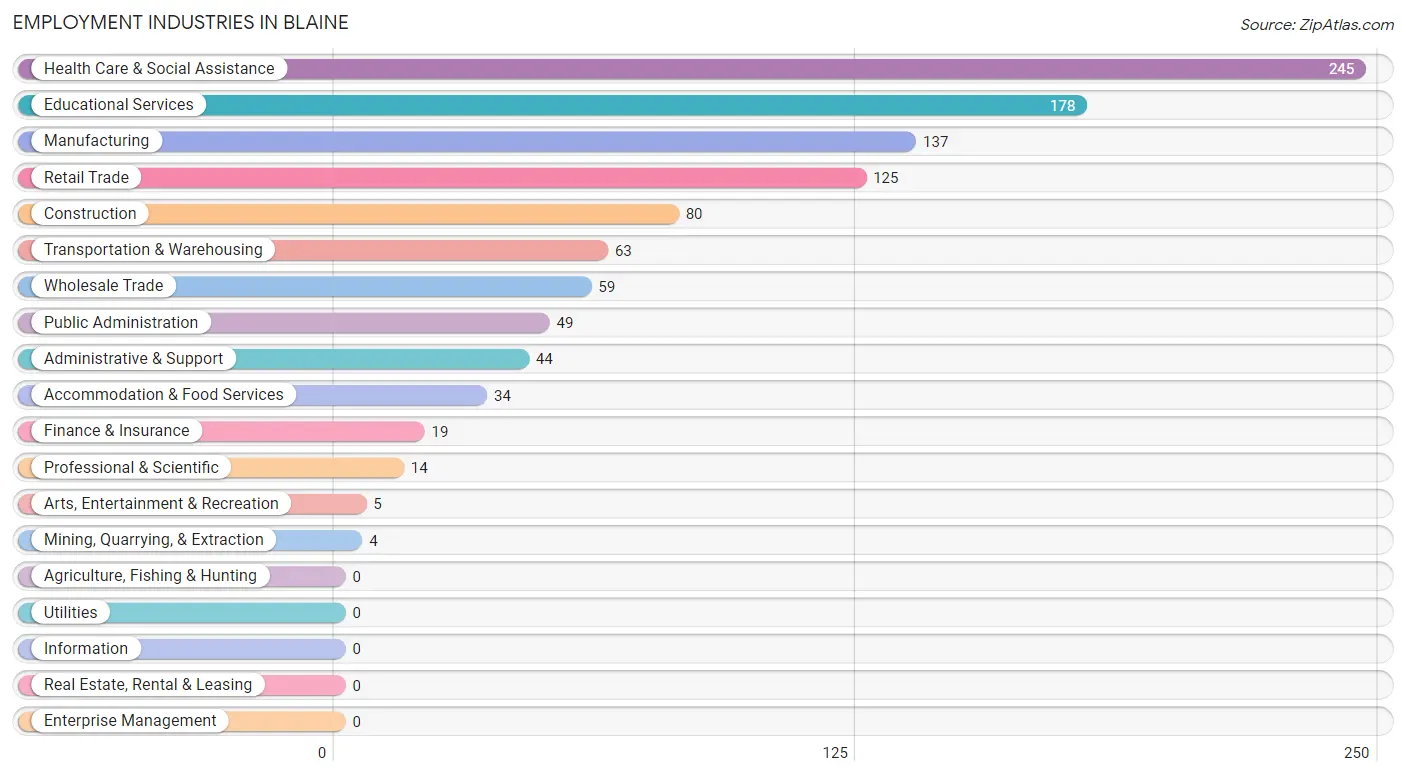
Employment Industries by Sex in Blaine
The Blaine industries that see more men than women are Mining, Quarrying, & Extraction (100.0%), Wholesale Trade (100.0%), and Arts, Entertainment & Recreation (100.0%), whereas the industries that tend to have a higher number of women are Professional & Scientific (100.0%), Accommodation & Food Services (79.4%), and Health Care & Social Assistance (69.8%).
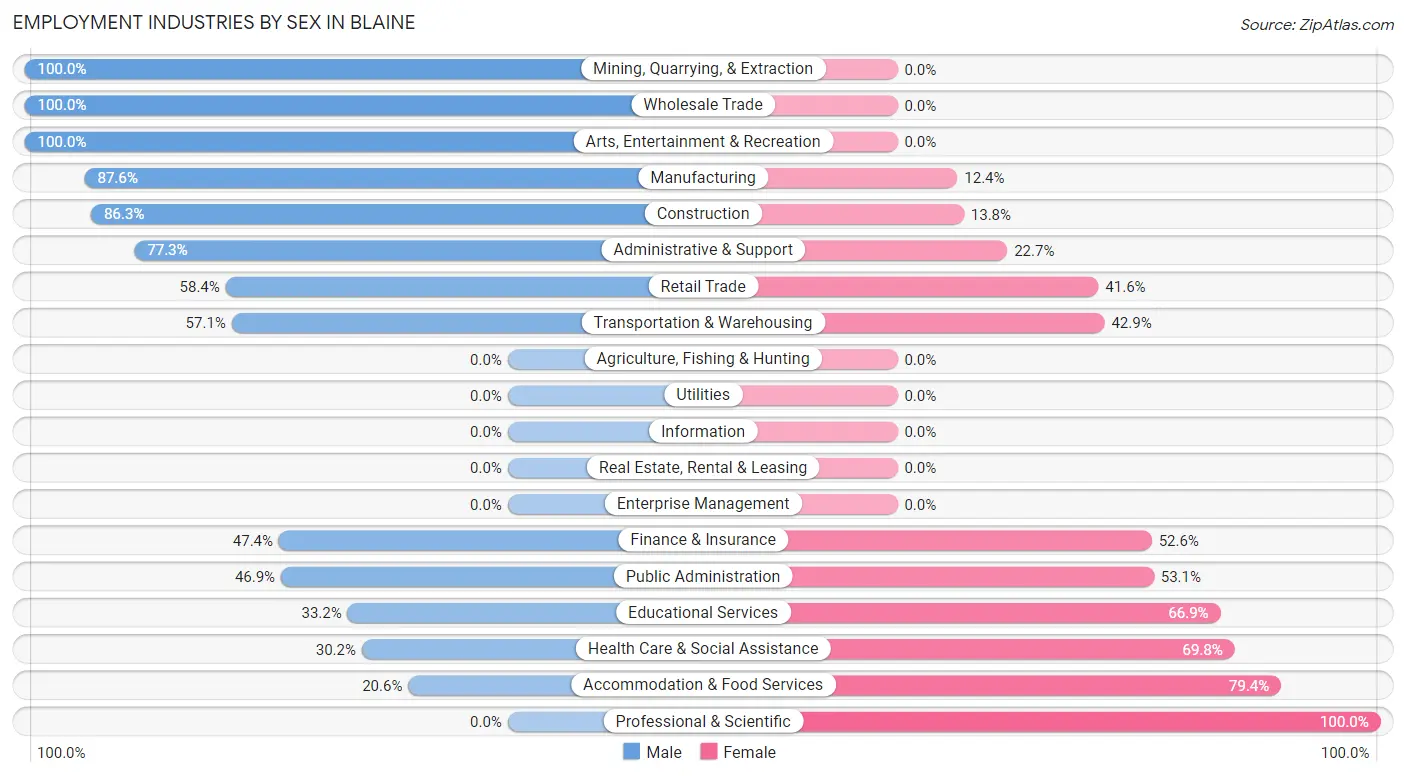
| Industry | Male | Female |
| Agriculture, Fishing & Hunting | 0 (0.0%) | 0 (0.0%) |
| Mining, Quarrying, & Extraction | 4 (100.0%) | 0 (0.0%) |
| Construction | 69 (86.3%) | 11 (13.8%) |
| Manufacturing | 120 (87.6%) | 17 (12.4%) |
| Wholesale Trade | 59 (100.0%) | 0 (0.0%) |
| Retail Trade | 73 (58.4%) | 52 (41.6%) |
| Transportation & Warehousing | 36 (57.1%) | 27 (42.9%) |
| Utilities | 0 (0.0%) | 0 (0.0%) |
| Information | 0 (0.0%) | 0 (0.0%) |
| Finance & Insurance | 9 (47.4%) | 10 (52.6%) |
| Real Estate, Rental & Leasing | 0 (0.0%) | 0 (0.0%) |
| Professional & Scientific | 0 (0.0%) | 14 (100.0%) |
| Enterprise Management | 0 (0.0%) | 0 (0.0%) |
| Administrative & Support | 34 (77.3%) | 10 (22.7%) |
| Educational Services | 59 (33.2%) | 119 (66.8%) |
| Health Care & Social Assistance | 74 (30.2%) | 171 (69.8%) |
| Arts, Entertainment & Recreation | 5 (100.0%) | 0 (0.0%) |
| Accommodation & Food Services | 7 (20.6%) | 27 (79.4%) |
| Public Administration | 23 (46.9%) | 26 (53.1%) |
| Total | 577 (52.9%) | 514 (47.1%) |
Education in Blaine
School Enrollment in Blaine
The most common levels of schooling among the 696 students in Blaine are high school (235 | 33.8%), middle school (159 | 22.8%), and elementary school (137 | 19.7%).
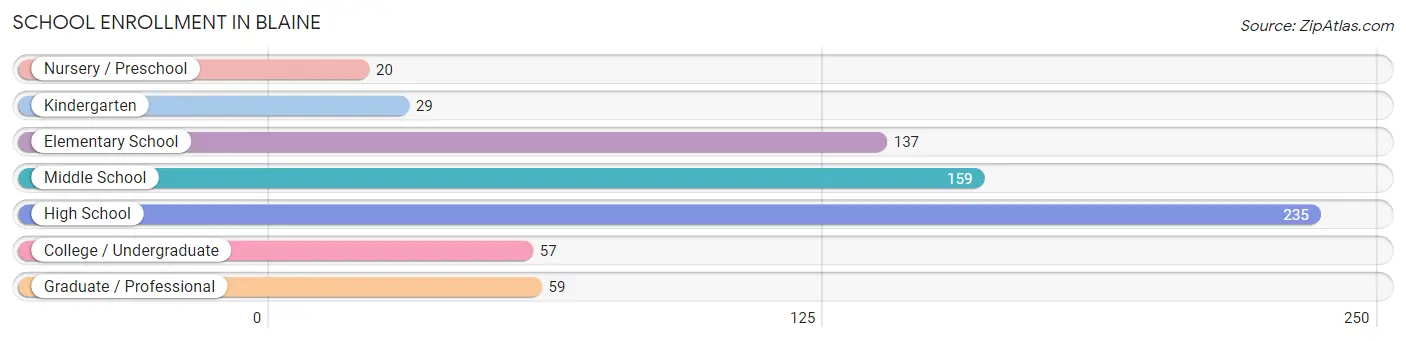
| School Level | # Students | % Students |
| Nursery / Preschool | 20 | 2.9% |
| Kindergarten | 29 | 4.2% |
| Elementary School | 137 | 19.7% |
| Middle School | 159 | 22.8% |
| High School | 235 | 33.8% |
| College / Undergraduate | 57 | 8.2% |
| Graduate / Professional | 59 | 8.5% |
| Total | 696 | 100.0% |
School Enrollment by Age by Funding Source in Blaine
Out of a total of 696 students who are enrolled in schools in Blaine, 6 (0.9%) attend a private institution, while the remaining 690 (99.1%) are enrolled in public schools. The age group of 10 to 14 year olds has the highest likelihood of being enrolled in private schools, with 6 (3.3% in the age bracket) enrolled. Conversely, the age group of 3 to 4 year olds has the lowest likelihood of being enrolled in a private school, with 20 (100.0% in the age bracket) attending a public institution.
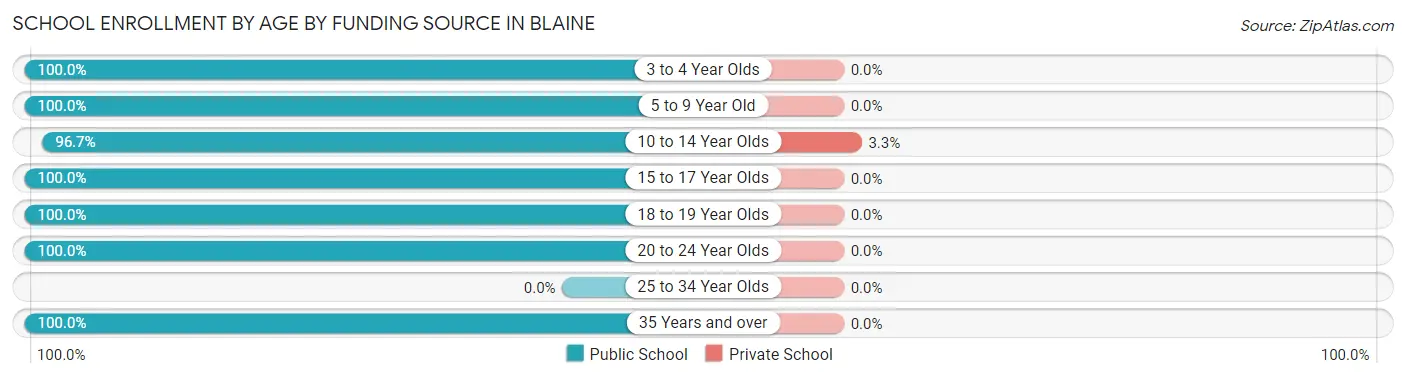
| Age Bracket | Public School | Private School |
| 3 to 4 Year Olds | 20 (100.0%) | 0 (0.0%) |
| 5 to 9 Year Old | 159 (100.0%) | 0 (0.0%) |
| 10 to 14 Year Olds | 175 (96.7%) | 6 (3.3%) |
| 15 to 17 Year Olds | 159 (100.0%) | 0 (0.0%) |
| 18 to 19 Year Olds | 35 (100.0%) | 0 (0.0%) |
| 20 to 24 Year Olds | 76 (100.0%) | 0 (0.0%) |
| 25 to 34 Year Olds | 0 (0.0%) | 0 (0.0%) |
| 35 Years and over | 66 (100.0%) | 0 (0.0%) |
| Total | 690 (99.1%) | 6 (0.9%) |
Educational Attainment by Field of Study in Blaine
Bio, nature & agricultural (87 | 23.1%), education (65 | 17.3%), business (49 | 13.0%), engineering (44 | 11.7%), and science & technology (25 | 6.7%) are the most common fields of study among 376 individuals in Blaine who have obtained a bachelor's degree or higher.
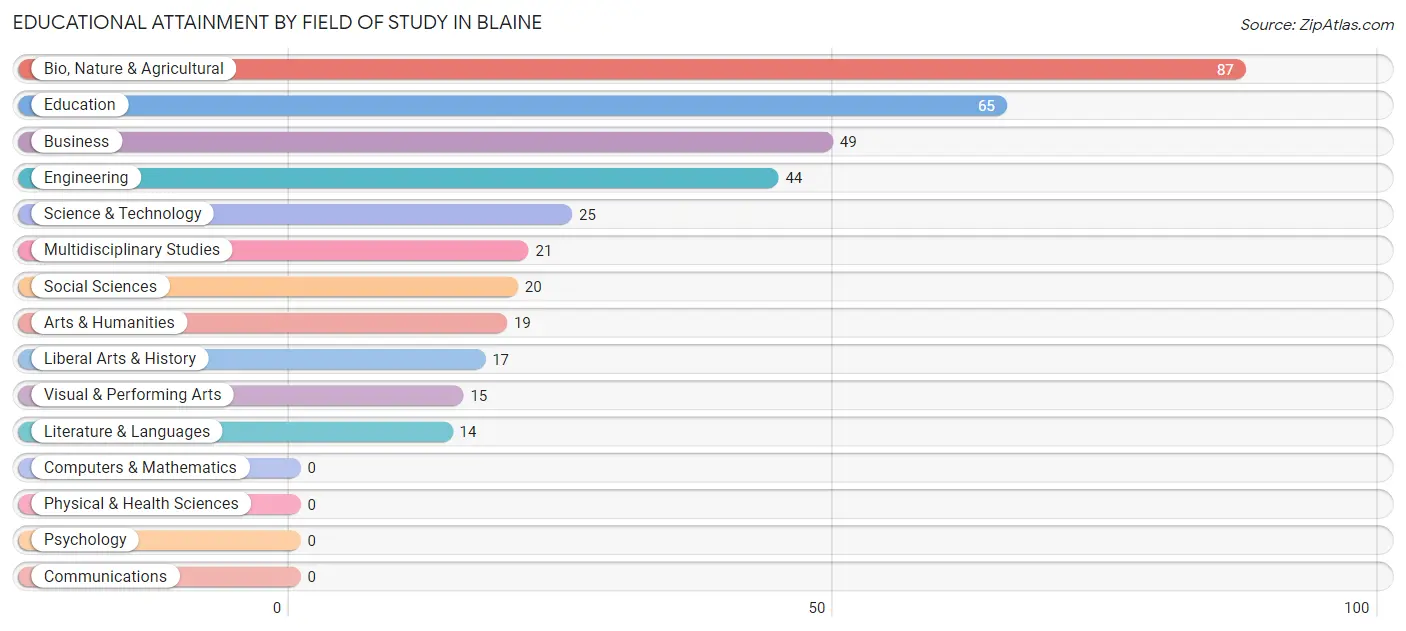
| Field of Study | # Graduates | % Graduates |
| Computers & Mathematics | 0 | 0.0% |
| Bio, Nature & Agricultural | 87 | 23.1% |
| Physical & Health Sciences | 0 | 0.0% |
| Psychology | 0 | 0.0% |
| Social Sciences | 20 | 5.3% |
| Engineering | 44 | 11.7% |
| Multidisciplinary Studies | 21 | 5.6% |
| Science & Technology | 25 | 6.7% |
| Business | 49 | 13.0% |
| Education | 65 | 17.3% |
| Literature & Languages | 14 | 3.7% |
| Liberal Arts & History | 17 | 4.5% |
| Visual & Performing Arts | 15 | 4.0% |
| Communications | 0 | 0.0% |
| Arts & Humanities | 19 | 5.1% |
| Total | 376 | 100.0% |
Transportation & Commute in Blaine
Vehicle Availability by Sex in Blaine
The most prevalent vehicle ownership categories in Blaine are males with 2 vehicles (300, accounting for 52.7%) and females with 2 vehicles (213, making up 58.4%).
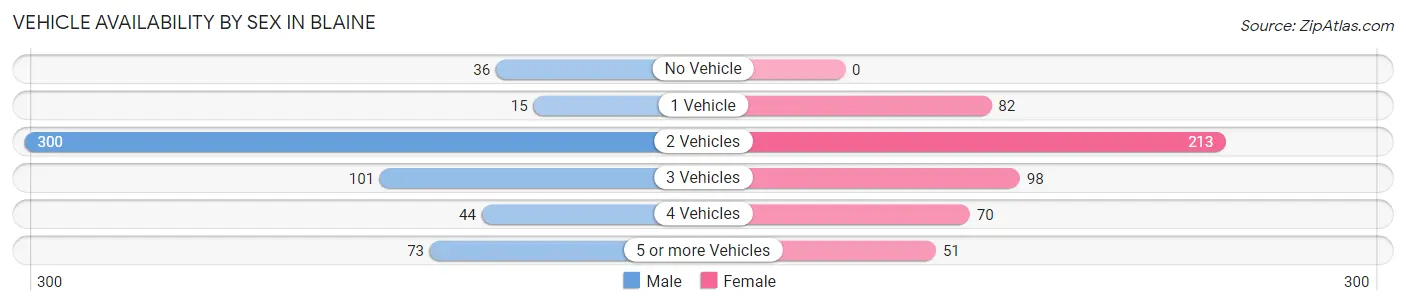
| Vehicles Available | Male | Female |
| No Vehicle | 36 (6.3%) | 0 (0.0%) |
| 1 Vehicle | 15 (2.6%) | 82 (16.0%) |
| 2 Vehicles | 300 (52.7%) | 213 (41.4%) |
| 3 Vehicles | 101 (17.7%) | 98 (19.1%) |
| 4 Vehicles | 44 (7.7%) | 70 (13.6%) |
| 5 or more Vehicles | 73 (12.8%) | 51 (9.9%) |
| Total | 569 (100.0%) | 514 (100.0%) |
Commute Time in Blaine
The most frequently occuring commute durations in Blaine are 30 to 34 minutes (175 commuters, 17.1%), 25 to 29 minutes (149 commuters, 14.5%), and 45 to 59 minutes (124 commuters, 12.1%).
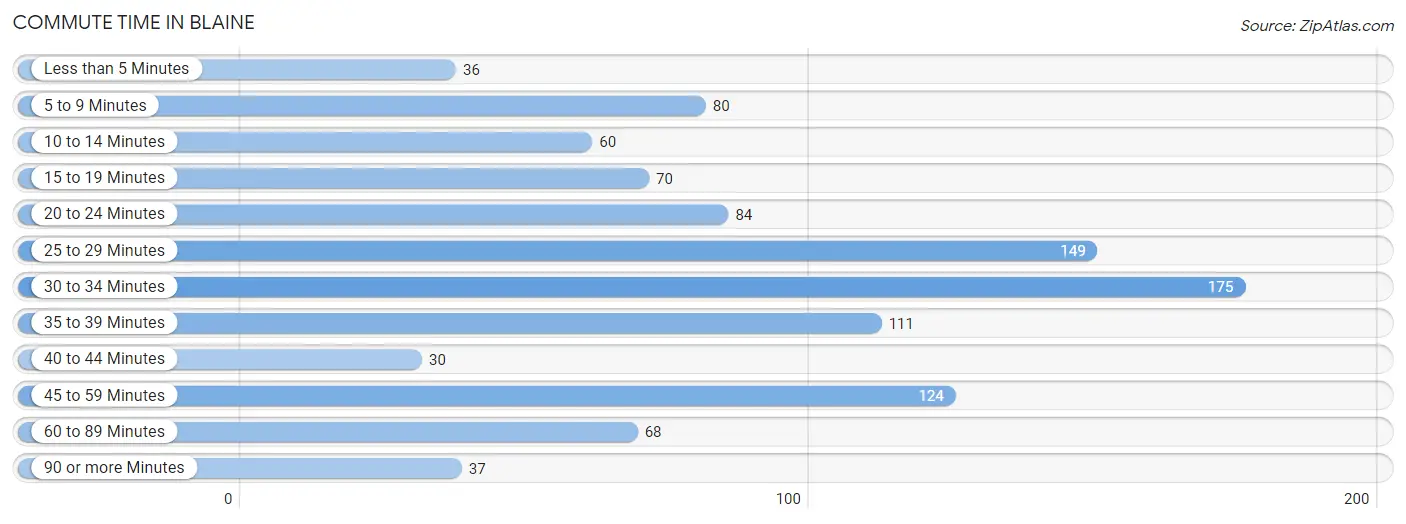
| Commute Time | # Commuters | % Commuters |
| Less than 5 Minutes | 36 | 3.5% |
| 5 to 9 Minutes | 80 | 7.8% |
| 10 to 14 Minutes | 60 | 5.9% |
| 15 to 19 Minutes | 70 | 6.8% |
| 20 to 24 Minutes | 84 | 8.2% |
| 25 to 29 Minutes | 149 | 14.5% |
| 30 to 34 Minutes | 175 | 17.1% |
| 35 to 39 Minutes | 111 | 10.8% |
| 40 to 44 Minutes | 30 | 2.9% |
| 45 to 59 Minutes | 124 | 12.1% |
| 60 to 89 Minutes | 68 | 6.6% |
| 90 or more Minutes | 37 | 3.6% |
Commute Time by Sex in Blaine
The most common commute times in Blaine are 25 to 29 minutes (81 commuters, 14.6%) for males and 30 to 34 minutes (132 commuters, 28.1%) for females.
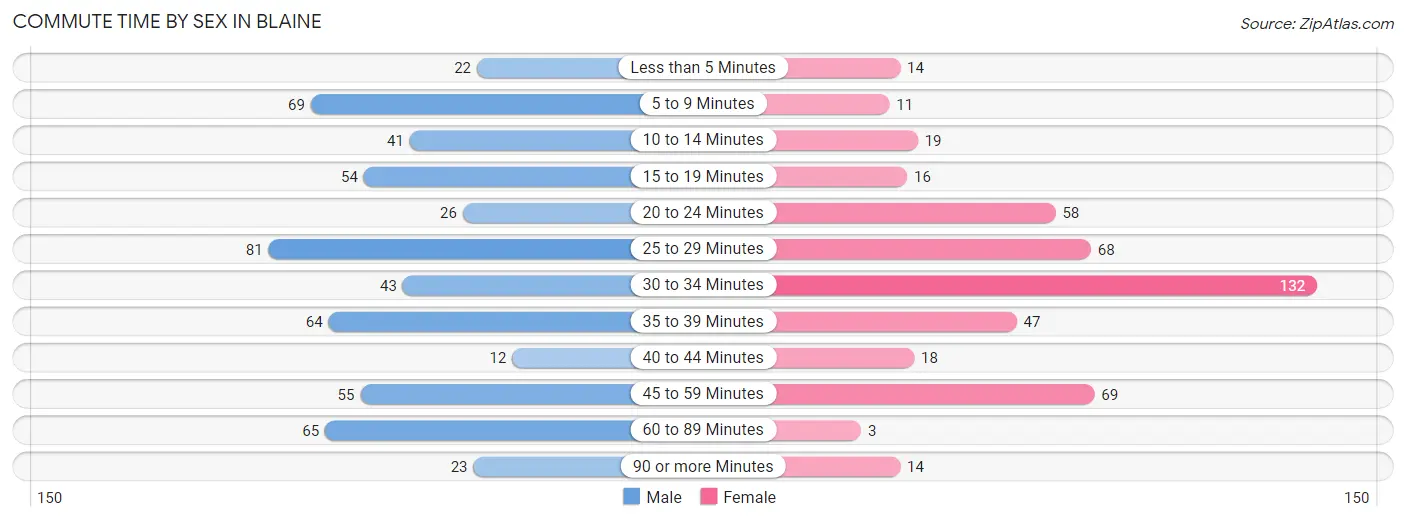
| Commute Time | Male | Female |
| Less than 5 Minutes | 22 (4.0%) | 14 (3.0%) |
| 5 to 9 Minutes | 69 (12.4%) | 11 (2.4%) |
| 10 to 14 Minutes | 41 (7.4%) | 19 (4.1%) |
| 15 to 19 Minutes | 54 (9.7%) | 16 (3.4%) |
| 20 to 24 Minutes | 26 (4.7%) | 58 (12.4%) |
| 25 to 29 Minutes | 81 (14.6%) | 68 (14.5%) |
| 30 to 34 Minutes | 43 (7.7%) | 132 (28.1%) |
| 35 to 39 Minutes | 64 (11.5%) | 47 (10.0%) |
| 40 to 44 Minutes | 12 (2.2%) | 18 (3.8%) |
| 45 to 59 Minutes | 55 (9.9%) | 69 (14.7%) |
| 60 to 89 Minutes | 65 (11.7%) | 3 (0.6%) |
| 90 or more Minutes | 23 (4.1%) | 14 (3.0%) |
Time of Departure to Work by Sex in Blaine
The most frequent times of departure to work in Blaine are 6:00 AM to 6:29 AM (165, 29.7%) for males and 7:00 AM to 7:29 AM (166, 35.4%) for females.
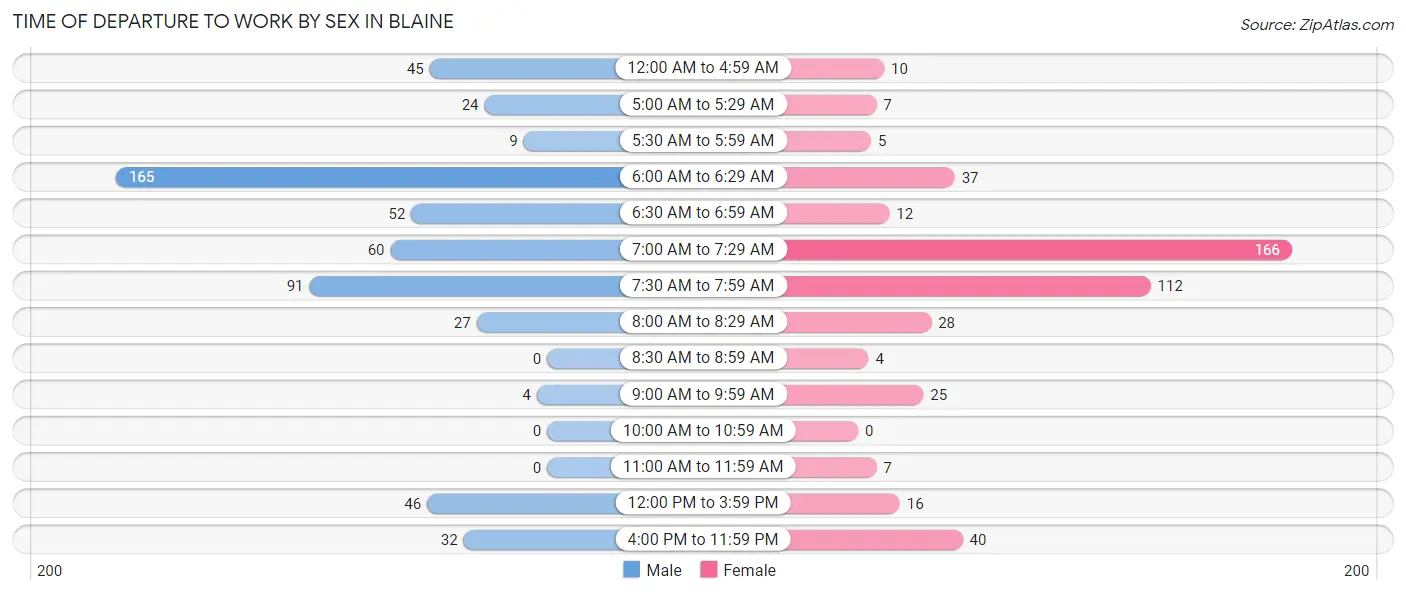
| Time of Departure | Male | Female |
| 12:00 AM to 4:59 AM | 45 (8.1%) | 10 (2.1%) |
| 5:00 AM to 5:29 AM | 24 (4.3%) | 7 (1.5%) |
| 5:30 AM to 5:59 AM | 9 (1.6%) | 5 (1.1%) |
| 6:00 AM to 6:29 AM | 165 (29.7%) | 37 (7.9%) |
| 6:30 AM to 6:59 AM | 52 (9.4%) | 12 (2.6%) |
| 7:00 AM to 7:29 AM | 60 (10.8%) | 166 (35.4%) |
| 7:30 AM to 7:59 AM | 91 (16.4%) | 112 (23.9%) |
| 8:00 AM to 8:29 AM | 27 (4.9%) | 28 (6.0%) |
| 8:30 AM to 8:59 AM | 0 (0.0%) | 4 (0.9%) |
| 9:00 AM to 9:59 AM | 4 (0.7%) | 25 (5.3%) |
| 10:00 AM to 10:59 AM | 0 (0.0%) | 0 (0.0%) |
| 11:00 AM to 11:59 AM | 0 (0.0%) | 7 (1.5%) |
| 12:00 PM to 3:59 PM | 46 (8.3%) | 16 (3.4%) |
| 4:00 PM to 11:59 PM | 32 (5.8%) | 40 (8.5%) |
| Total | 555 (100.0%) | 469 (100.0%) |
Housing Occupancy in Blaine
Occupancy by Ownership in Blaine
Of the total 959 dwellings in Blaine, owner-occupied units account for 621 (64.7%), while renter-occupied units make up 338 (35.2%).
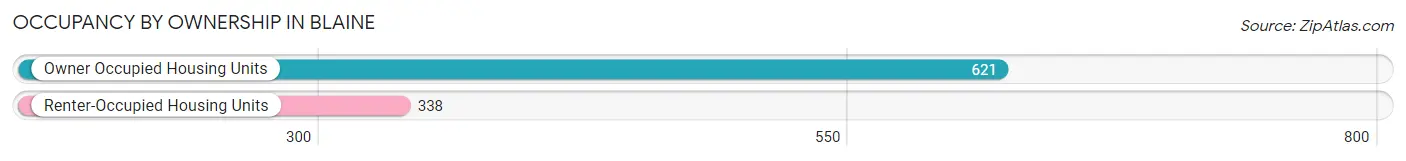
| Occupancy | # Housing Units | % Housing Units |
| Owner Occupied Housing Units | 621 | 64.7% |
| Renter-Occupied Housing Units | 338 | 35.2% |
| Total Occupied Housing Units | 959 | 100.0% |
Occupancy by Household Size in Blaine
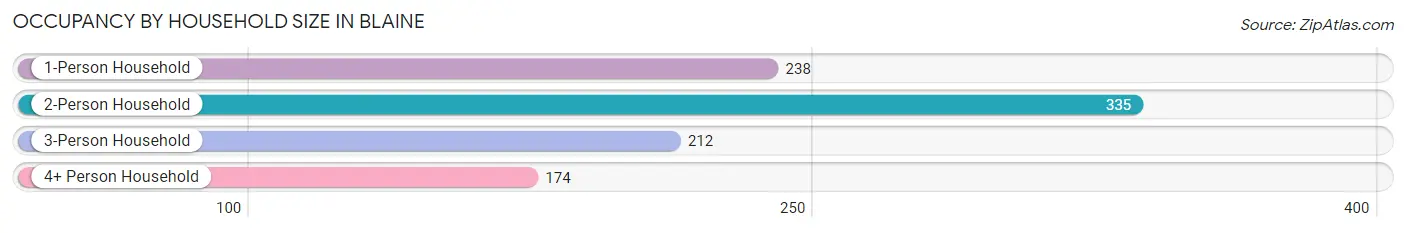
| Household Size | # Housing Units | % Housing Units |
| 1-Person Household | 238 | 24.8% |
| 2-Person Household | 335 | 34.9% |
| 3-Person Household | 212 | 22.1% |
| 4+ Person Household | 174 | 18.1% |
| Total Housing Units | 959 | 100.0% |
Occupancy by Ownership by Household Size in Blaine
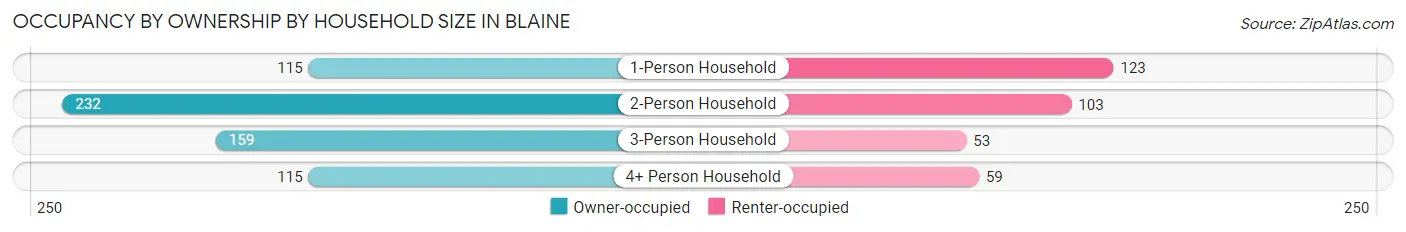
| Household Size | Owner-occupied | Renter-occupied |
| 1-Person Household | 115 (48.3%) | 123 (51.7%) |
| 2-Person Household | 232 (69.3%) | 103 (30.7%) |
| 3-Person Household | 159 (75.0%) | 53 (25.0%) |
| 4+ Person Household | 115 (66.1%) | 59 (33.9%) |
| Total Housing Units | 621 (64.7%) | 338 (35.2%) |
Occupancy by Educational Attainment in Blaine
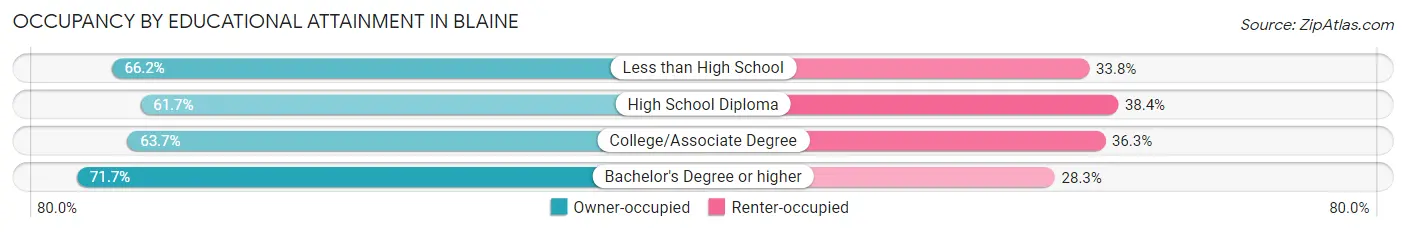
| Household Size | Owner-occupied | Renter-occupied |
| Less than High School | 49 (66.2%) | 25 (33.8%) |
| High School Diploma | 262 (61.7%) | 163 (38.4%) |
| College/Associate Degree | 158 (63.7%) | 90 (36.3%) |
| Bachelor's Degree or higher | 152 (71.7%) | 60 (28.3%) |
Occupancy by Age of Householder in Blaine
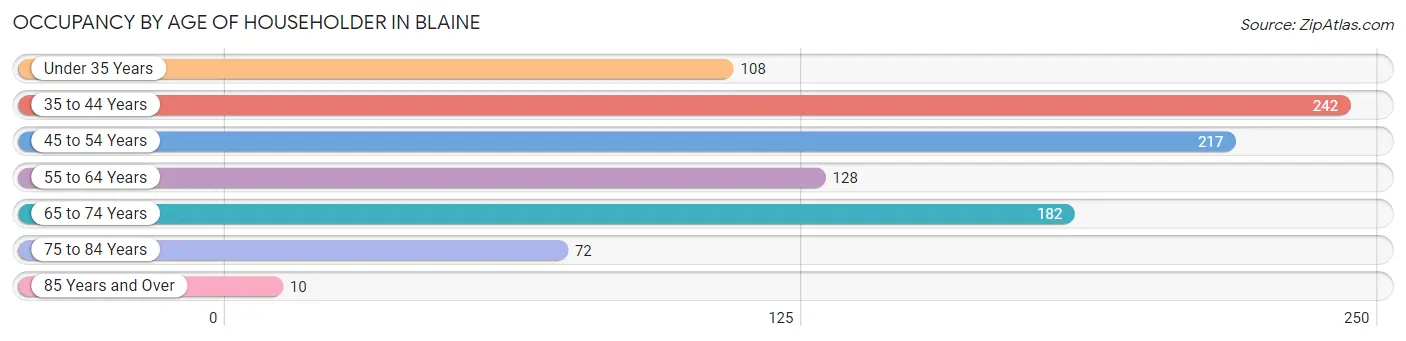
| Age Bracket | # Households | % Households |
| Under 35 Years | 108 | 11.3% |
| 35 to 44 Years | 242 | 25.2% |
| 45 to 54 Years | 217 | 22.6% |
| 55 to 64 Years | 128 | 13.4% |
| 65 to 74 Years | 182 | 19.0% |
| 75 to 84 Years | 72 | 7.5% |
| 85 Years and Over | 10 | 1.0% |
| Total | 959 | 100.0% |
Housing Finances in Blaine
Median Income by Occupancy in Blaine
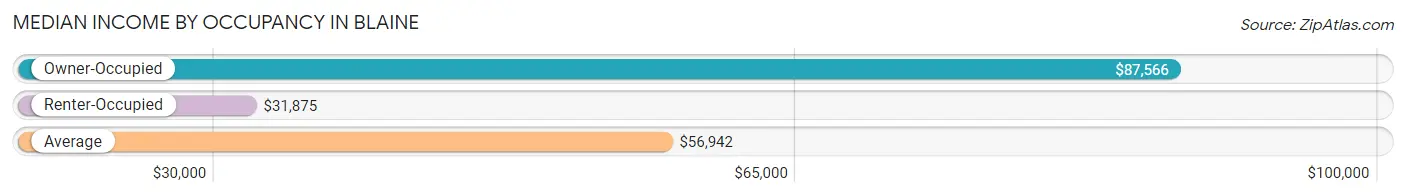
| Occupancy Type | # Households | Median Income |
| Owner-Occupied | 621 (64.7%) | $87,566 |
| Renter-Occupied | 338 (35.2%) | $31,875 |
| Average | 959 (100.0%) | $56,942 |
Occupancy by Householder Income Bracket in Blaine
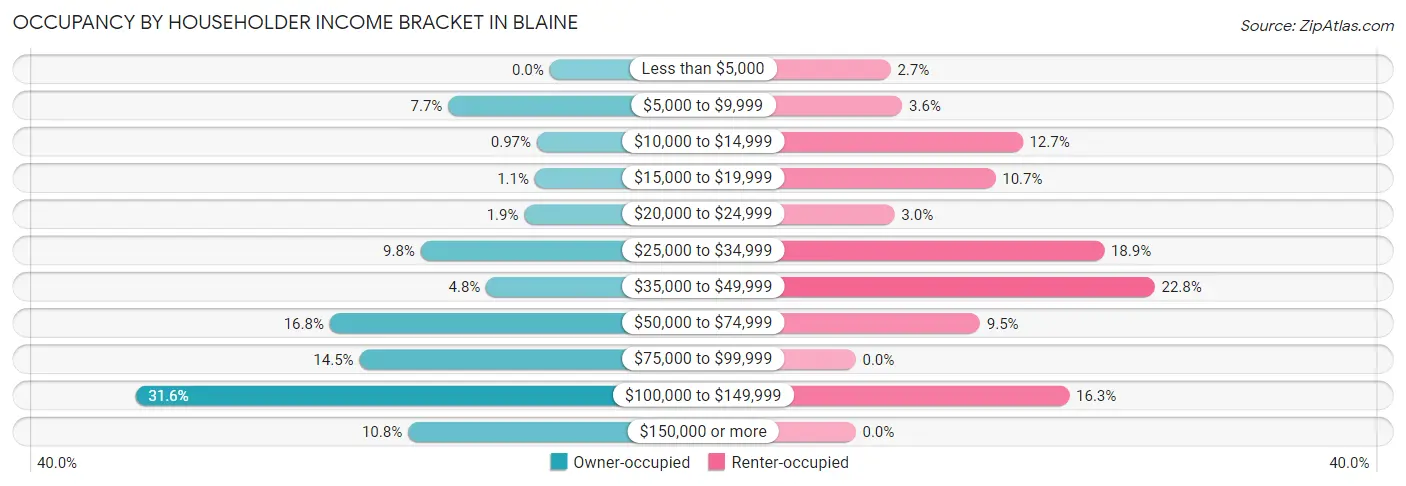
| Income Bracket | Owner-occupied | Renter-occupied |
| Less than $5,000 | 0 (0.0%) | 9 (2.7%) |
| $5,000 to $9,999 | 48 (7.7%) | 12 (3.5%) |
| $10,000 to $14,999 | 6 (1.0%) | 43 (12.7%) |
| $15,000 to $19,999 | 7 (1.1%) | 36 (10.6%) |
| $20,000 to $24,999 | 12 (1.9%) | 10 (3.0%) |
| $25,000 to $34,999 | 61 (9.8%) | 64 (18.9%) |
| $35,000 to $49,999 | 30 (4.8%) | 77 (22.8%) |
| $50,000 to $74,999 | 104 (16.8%) | 32 (9.5%) |
| $75,000 to $99,999 | 90 (14.5%) | 0 (0.0%) |
| $100,000 to $149,999 | 196 (31.6%) | 55 (16.3%) |
| $150,000 or more | 67 (10.8%) | 0 (0.0%) |
| Total | 621 (100.0%) | 338 (100.0%) |
Monthly Housing Cost Tiers in Blaine
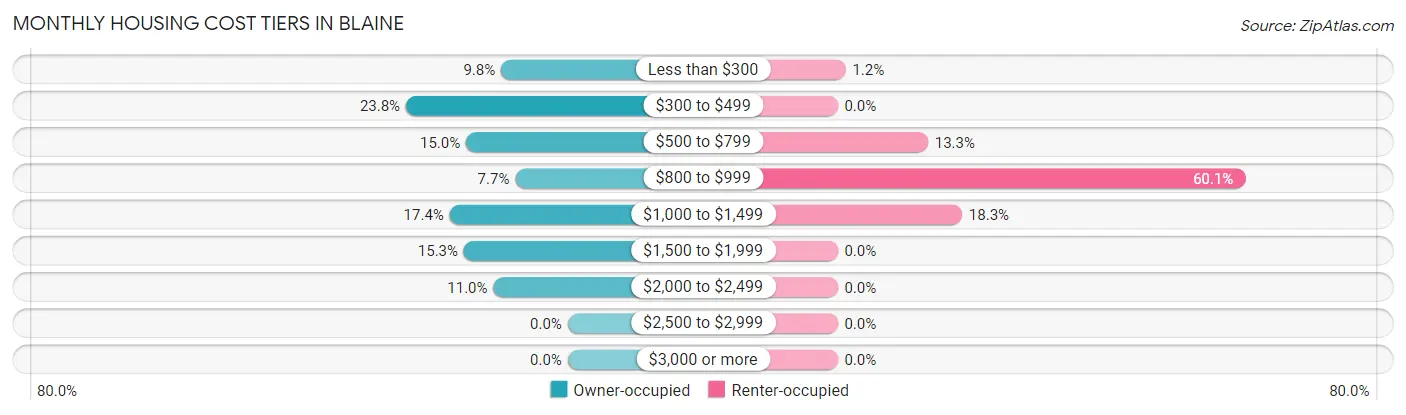
| Monthly Cost | Owner-occupied | Renter-occupied |
| Less than $300 | 61 (9.8%) | 4 (1.2%) |
| $300 to $499 | 148 (23.8%) | 0 (0.0%) |
| $500 to $799 | 93 (15.0%) | 45 (13.3%) |
| $800 to $999 | 48 (7.7%) | 203 (60.1%) |
| $1,000 to $1,499 | 108 (17.4%) | 62 (18.3%) |
| $1,500 to $1,999 | 95 (15.3%) | 0 (0.0%) |
| $2,000 to $2,499 | 68 (11.0%) | 0 (0.0%) |
| $2,500 to $2,999 | 0 (0.0%) | 0 (0.0%) |
| $3,000 or more | 0 (0.0%) | 0 (0.0%) |
| Total | 621 (100.0%) | 338 (100.0%) |
Physical Housing Characteristics in Blaine
Housing Structures in Blaine
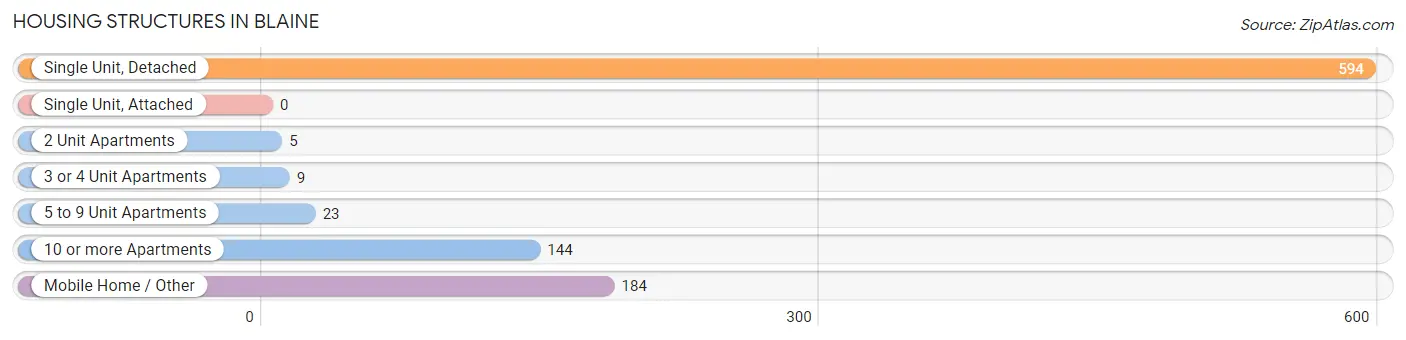
| Structure Type | # Housing Units | % Housing Units |
| Single Unit, Detached | 594 | 61.9% |
| Single Unit, Attached | 0 | 0.0% |
| 2 Unit Apartments | 5 | 0.5% |
| 3 or 4 Unit Apartments | 9 | 0.9% |
| 5 to 9 Unit Apartments | 23 | 2.4% |
| 10 or more Apartments | 144 | 15.0% |
| Mobile Home / Other | 184 | 19.2% |
| Total | 959 | 100.0% |
Housing Structures by Occupancy in Blaine
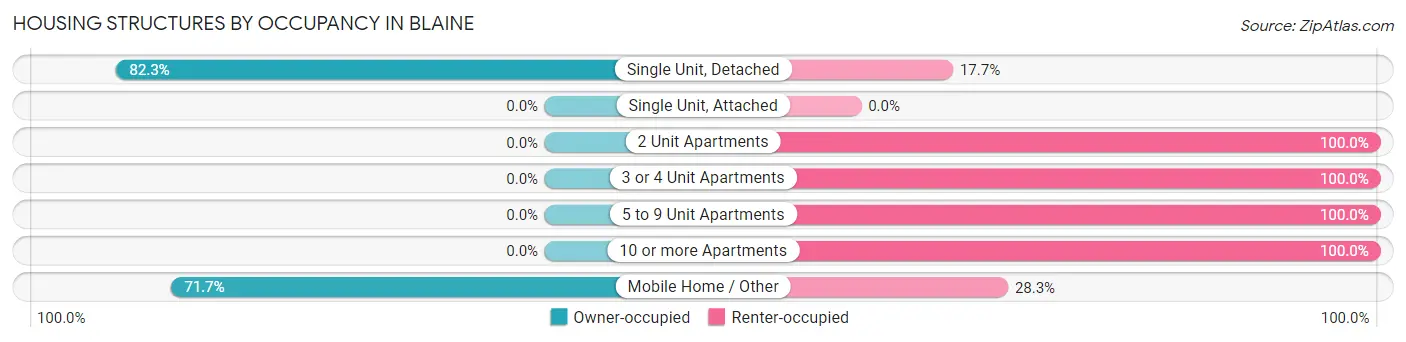
| Structure Type | Owner-occupied | Renter-occupied |
| Single Unit, Detached | 489 (82.3%) | 105 (17.7%) |
| Single Unit, Attached | 0 (0.0%) | 0 (0.0%) |
| 2 Unit Apartments | 0 (0.0%) | 5 (100.0%) |
| 3 or 4 Unit Apartments | 0 (0.0%) | 9 (100.0%) |
| 5 to 9 Unit Apartments | 0 (0.0%) | 23 (100.0%) |
| 10 or more Apartments | 0 (0.0%) | 144 (100.0%) |
| Mobile Home / Other | 132 (71.7%) | 52 (28.3%) |
| Total | 621 (64.7%) | 338 (35.2%) |
Housing Structures by Number of Rooms in Blaine
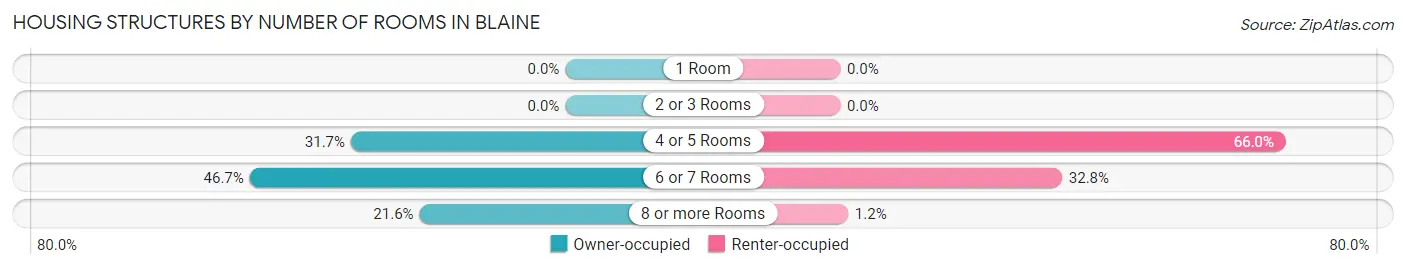
| Number of Rooms | Owner-occupied | Renter-occupied |
| 1 Room | 0 (0.0%) | 0 (0.0%) |
| 2 or 3 Rooms | 0 (0.0%) | 0 (0.0%) |
| 4 or 5 Rooms | 197 (31.7%) | 223 (66.0%) |
| 6 or 7 Rooms | 290 (46.7%) | 111 (32.8%) |
| 8 or more Rooms | 134 (21.6%) | 4 (1.2%) |
| Total | 621 (100.0%) | 338 (100.0%) |
Housing Structure by Heating Type in Blaine
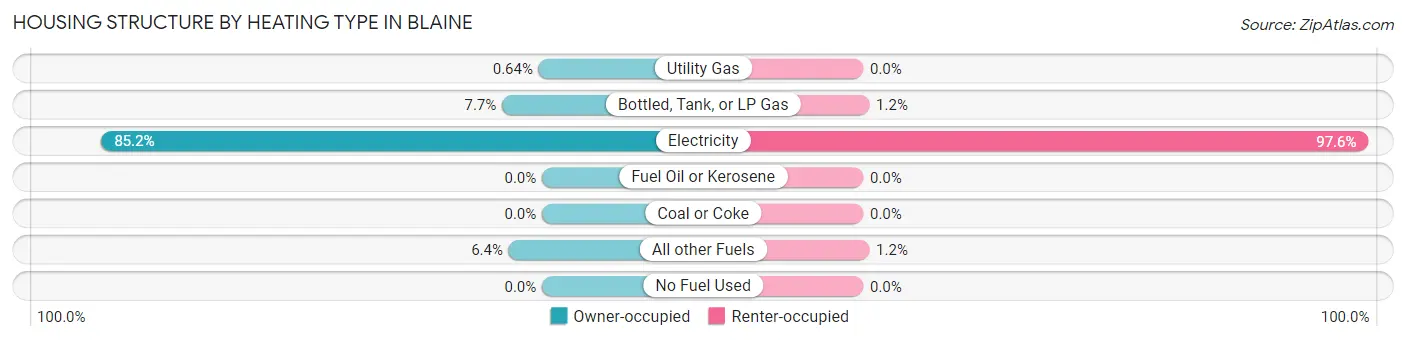
| Heating Type | Owner-occupied | Renter-occupied |
| Utility Gas | 4 (0.6%) | 0 (0.0%) |
| Bottled, Tank, or LP Gas | 48 (7.7%) | 4 (1.2%) |
| Electricity | 529 (85.2%) | 330 (97.6%) |
| Fuel Oil or Kerosene | 0 (0.0%) | 0 (0.0%) |
| Coal or Coke | 0 (0.0%) | 0 (0.0%) |
| All other Fuels | 40 (6.4%) | 4 (1.2%) |
| No Fuel Used | 0 (0.0%) | 0 (0.0%) |
| Total | 621 (100.0%) | 338 (100.0%) |
Household Vehicle Usage in Blaine
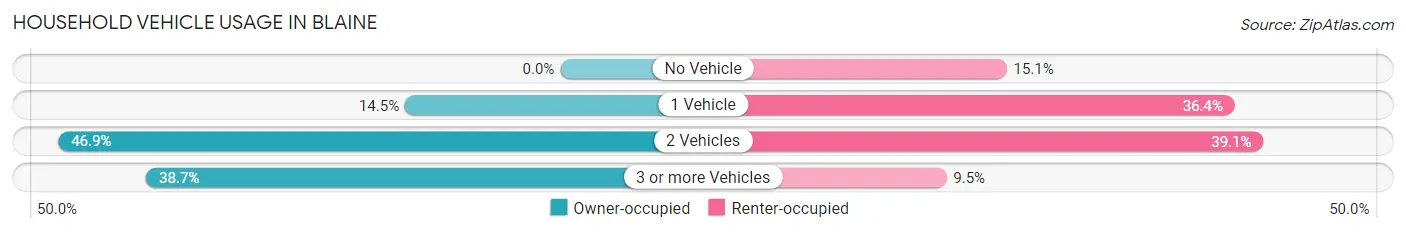
| Vehicles per Household | Owner-occupied | Renter-occupied |
| No Vehicle | 0 (0.0%) | 51 (15.1%) |
| 1 Vehicle | 90 (14.5%) | 123 (36.4%) |
| 2 Vehicles | 291 (46.9%) | 132 (39.1%) |
| 3 or more Vehicles | 240 (38.7%) | 32 (9.5%) |
| Total | 621 (100.0%) | 338 (100.0%) |
Real Estate & Mortgages in Blaine
Real Estate and Mortgage Overview in Blaine
| Characteristic | Without Mortgage | With Mortgage |
| Housing Units | 281 | 340 |
| Median Property Value | $188,800 | $228,600 |
| Median Household Income | $70,795 | $46 |
| Monthly Housing Costs | $432 | $0 |
| Real Estate Taxes | $1,220 | $14 |
Property Value by Mortgage Status in Blaine
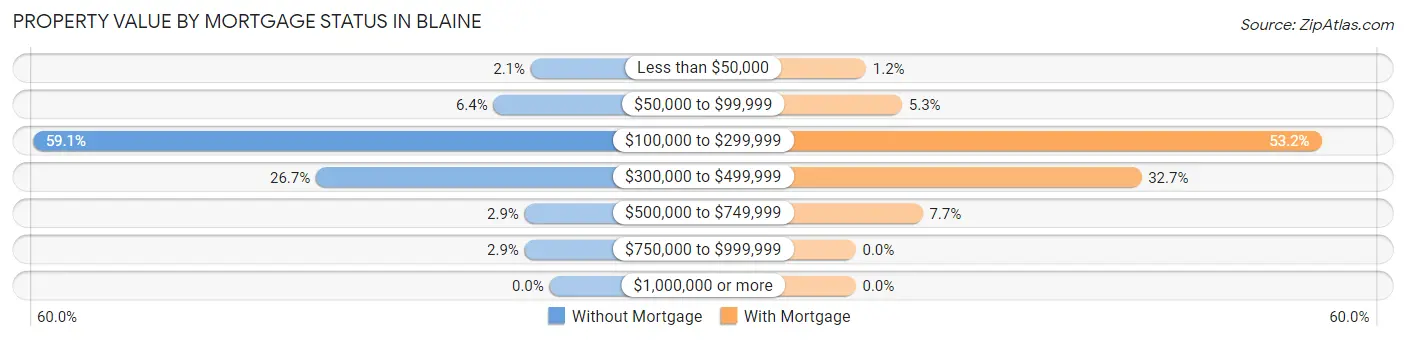
| Property Value | Without Mortgage | With Mortgage |
| Less than $50,000 | 6 (2.1%) | 4 (1.2%) |
| $50,000 to $99,999 | 18 (6.4%) | 18 (5.3%) |
| $100,000 to $299,999 | 166 (59.1%) | 181 (53.2%) |
| $300,000 to $499,999 | 75 (26.7%) | 111 (32.7%) |
| $500,000 to $749,999 | 8 (2.9%) | 26 (7.6%) |
| $750,000 to $999,999 | 8 (2.9%) | 0 (0.0%) |
| $1,000,000 or more | 0 (0.0%) | 0 (0.0%) |
| Total | 281 (100.0%) | 340 (100.0%) |
Household Income by Mortgage Status in Blaine
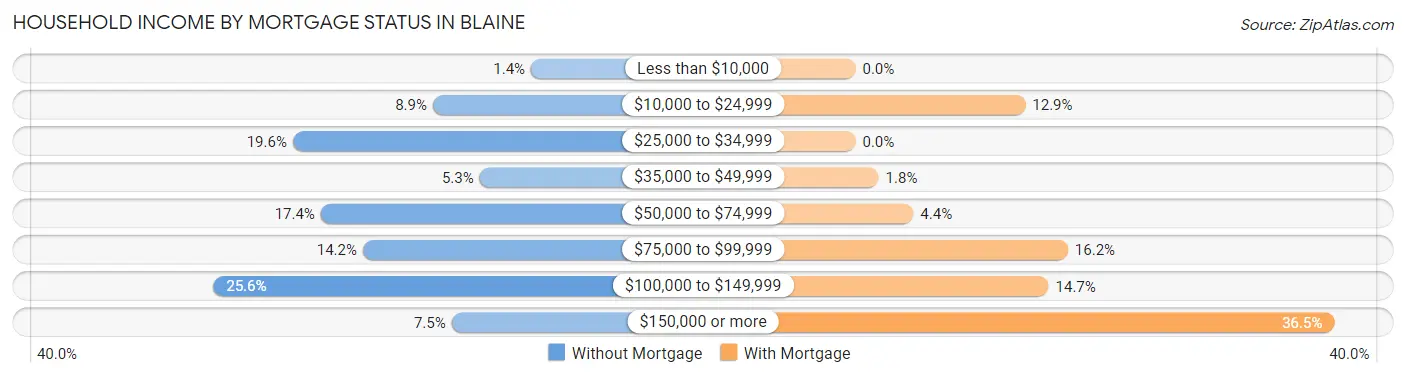
| Household Income | Without Mortgage | With Mortgage |
| Less than $10,000 | 4 (1.4%) | 0 (0.0%) |
| $10,000 to $24,999 | 25 (8.9%) | 44 (12.9%) |
| $25,000 to $34,999 | 55 (19.6%) | 0 (0.0%) |
| $35,000 to $49,999 | 15 (5.3%) | 6 (1.8%) |
| $50,000 to $74,999 | 49 (17.4%) | 15 (4.4%) |
| $75,000 to $99,999 | 40 (14.2%) | 55 (16.2%) |
| $100,000 to $149,999 | 72 (25.6%) | 50 (14.7%) |
| $150,000 or more | 21 (7.5%) | 124 (36.5%) |
| Total | 281 (100.0%) | 340 (100.0%) |
Property Value to Household Income Ratio in Blaine
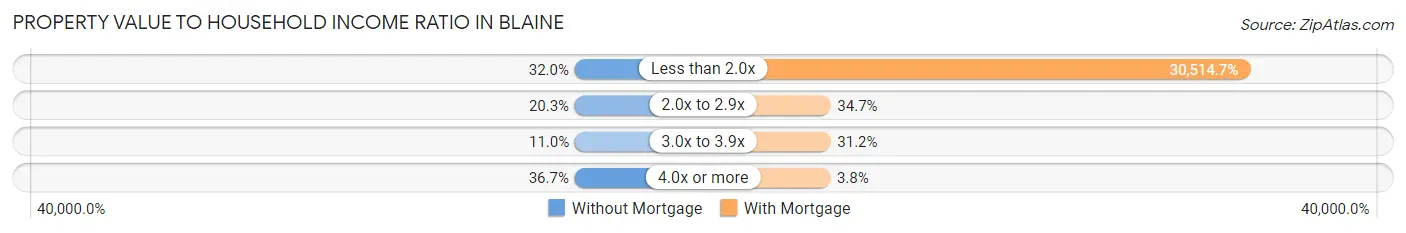
| Value-to-Income Ratio | Without Mortgage | With Mortgage |
| Less than 2.0x | 90 (32.0%) | 103,750 (30,514.7%) |
| 2.0x to 2.9x | 57 (20.3%) | 118 (34.7%) |
| 3.0x to 3.9x | 31 (11.0%) | 106 (31.2%) |
| 4.0x or more | 103 (36.6%) | 13 (3.8%) |
| Total | 281 (100.0%) | 340 (100.0%) |
Real Estate Taxes by Mortgage Status in Blaine
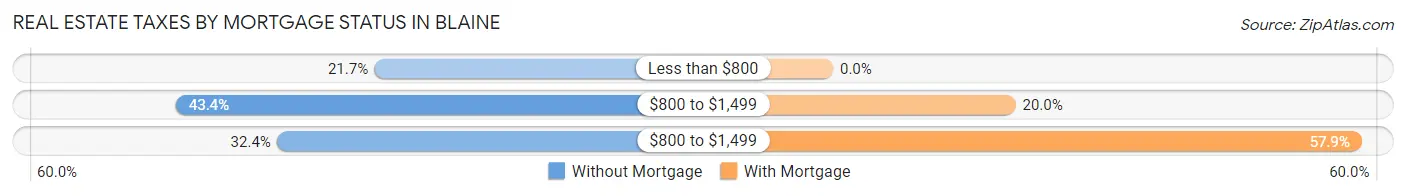
| Property Taxes | Without Mortgage | With Mortgage |
| Less than $800 | 61 (21.7%) | 0 (0.0%) |
| $800 to $1,499 | 122 (43.4%) | 68 (20.0%) |
| $800 to $1,499 | 91 (32.4%) | 197 (57.9%) |
| Total | 281 (100.0%) | 340 (100.0%) |
Health & Disability in Blaine
Health Insurance Coverage by Age in Blaine
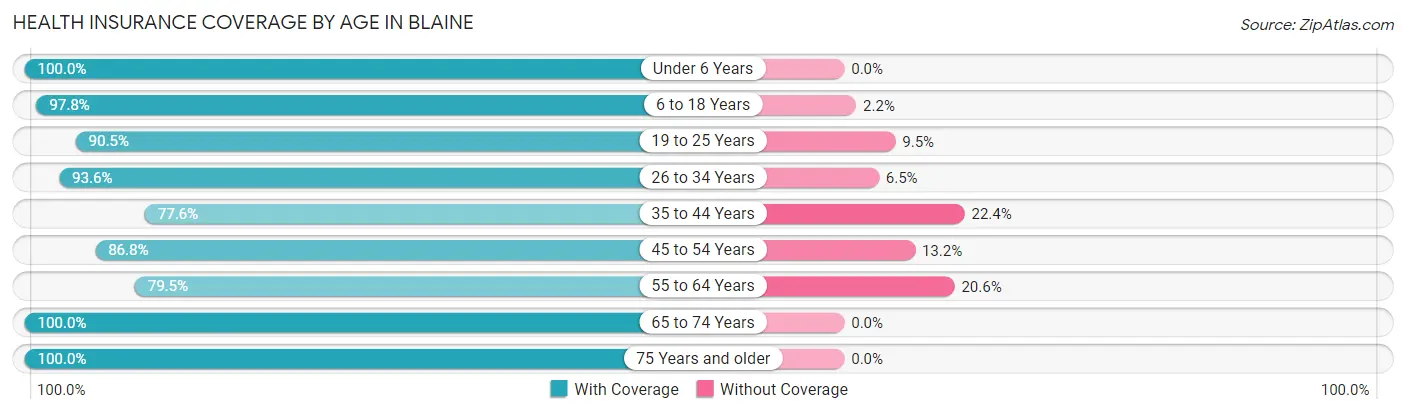
| Age Bracket | With Coverage | Without Coverage |
| Under 6 Years | 143 (100.0%) | 0 (0.0%) |
| 6 to 18 Years | 530 (97.8%) | 12 (2.2%) |
| 19 to 25 Years | 190 (90.5%) | 20 (9.5%) |
| 26 to 34 Years | 145 (93.5%) | 10 (6.5%) |
| 35 to 44 Years | 325 (77.6%) | 94 (22.4%) |
| 45 to 54 Years | 349 (86.8%) | 53 (13.2%) |
| 55 to 64 Years | 201 (79.4%) | 52 (20.5%) |
| 65 to 74 Years | 254 (100.0%) | 0 (0.0%) |
| 75 Years and older | 118 (100.0%) | 0 (0.0%) |
| Total | 2,255 (90.3%) | 241 (9.7%) |
Health Insurance Coverage by Citizenship Status in Blaine
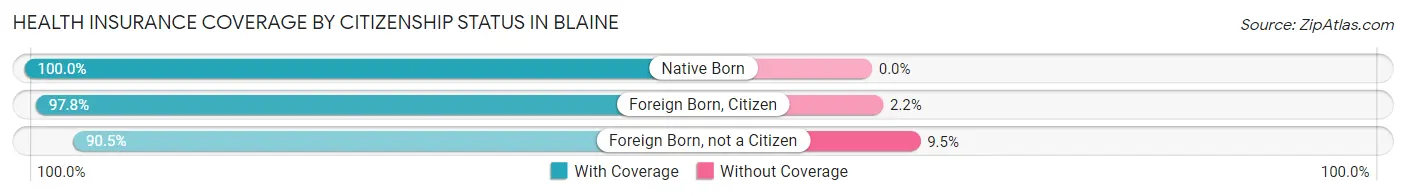
| Citizenship Status | With Coverage | Without Coverage |
| Native Born | 143 (100.0%) | 0 (0.0%) |
| Foreign Born, Citizen | 530 (97.8%) | 12 (2.2%) |
| Foreign Born, not a Citizen | 190 (90.5%) | 20 (9.5%) |
Health Insurance Coverage by Household Income in Blaine
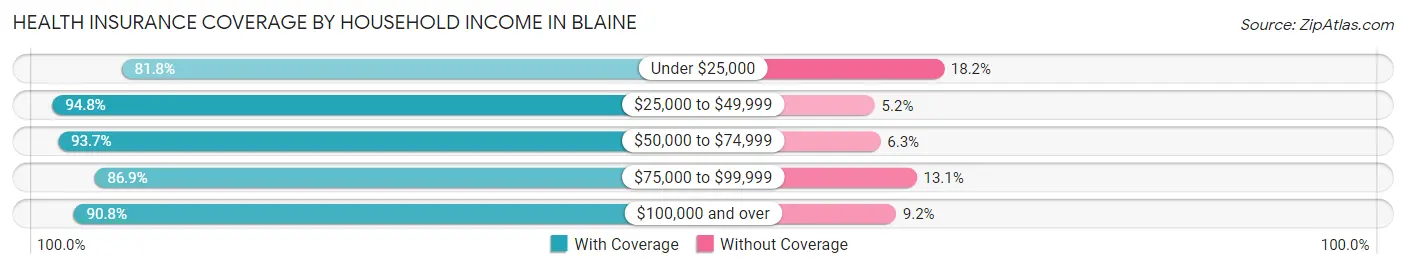
| Household Income | With Coverage | Without Coverage |
| Under $25,000 | 315 (81.8%) | 70 (18.2%) |
| $25,000 to $49,999 | 454 (94.8%) | 25 (5.2%) |
| $50,000 to $74,999 | 433 (93.7%) | 29 (6.3%) |
| $75,000 to $99,999 | 213 (86.9%) | 32 (13.1%) |
| $100,000 and over | 840 (90.8%) | 85 (9.2%) |
Public vs Private Health Insurance Coverage by Age in Blaine
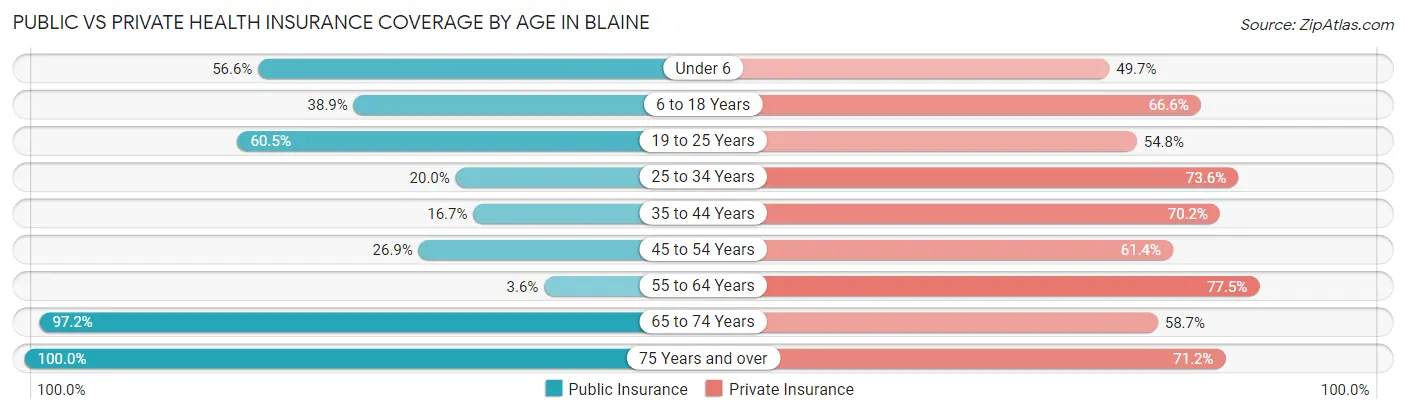
| Age Bracket | Public Insurance | Private Insurance |
| Under 6 | 81 (56.6%) | 71 (49.6%) |
| 6 to 18 Years | 211 (38.9%) | 361 (66.6%) |
| 19 to 25 Years | 127 (60.5%) | 115 (54.8%) |
| 25 to 34 Years | 31 (20.0%) | 114 (73.6%) |
| 35 to 44 Years | 70 (16.7%) | 294 (70.2%) |
| 45 to 54 Years | 108 (26.9%) | 247 (61.4%) |
| 55 to 64 Years | 9 (3.6%) | 196 (77.5%) |
| 65 to 74 Years | 247 (97.2%) | 149 (58.7%) |
| 75 Years and over | 118 (100.0%) | 84 (71.2%) |
| Total | 1,002 (40.1%) | 1,631 (65.3%) |
Disability Status by Sex by Age in Blaine
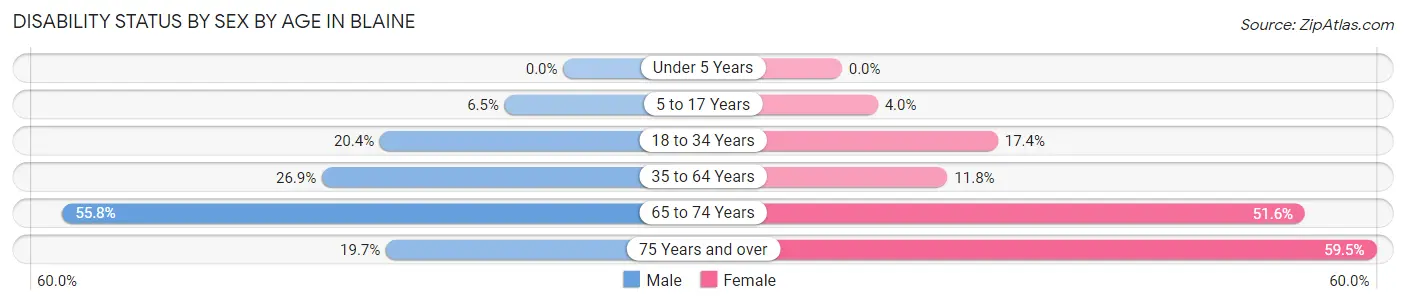
| Age Bracket | Male | Female |
| Under 5 Years | 0 (0.0%) | 0 (0.0%) |
| 5 to 17 Years | 23 (6.5%) | 7 (4.0%) |
| 18 to 34 Years | 49 (20.4%) | 29 (17.4%) |
| 35 to 64 Years | 147 (26.9%) | 62 (11.8%) |
| 65 to 74 Years | 53 (55.8%) | 82 (51.6%) |
| 75 Years and over | 15 (19.7%) | 25 (59.5%) |
Disability Class by Sex by Age in Blaine
Disability Class: Hearing Difficulty
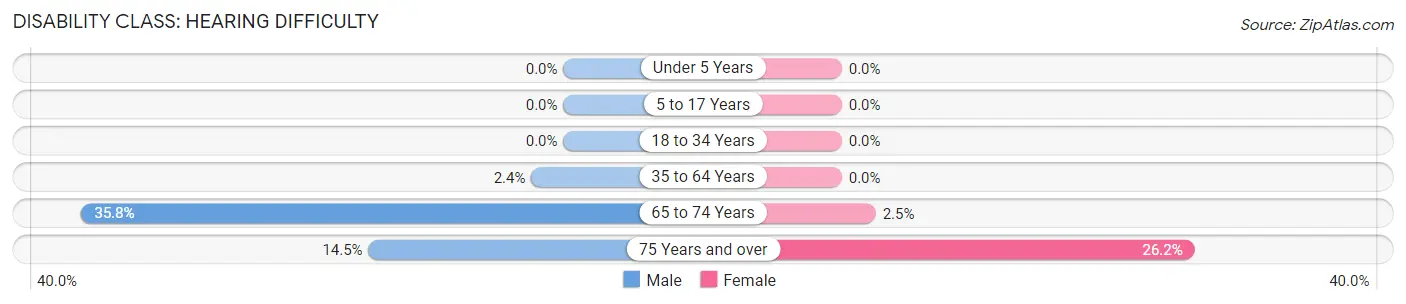
| Age Bracket | Male | Female |
| Under 5 Years | 0 (0.0%) | 0 (0.0%) |
| 5 to 17 Years | 0 (0.0%) | 0 (0.0%) |
| 18 to 34 Years | 0 (0.0%) | 0 (0.0%) |
| 35 to 64 Years | 13 (2.4%) | 0 (0.0%) |
| 65 to 74 Years | 34 (35.8%) | 4 (2.5%) |
| 75 Years and over | 11 (14.5%) | 11 (26.2%) |
Disability Class: Vision Difficulty
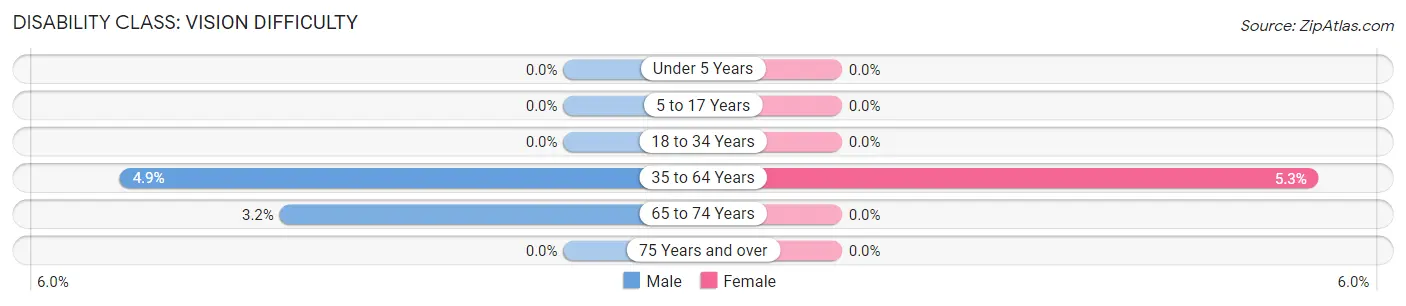
| Age Bracket | Male | Female |
| Under 5 Years | 0 (0.0%) | 0 (0.0%) |
| 5 to 17 Years | 0 (0.0%) | 0 (0.0%) |
| 18 to 34 Years | 0 (0.0%) | 0 (0.0%) |
| 35 to 64 Years | 27 (4.9%) | 28 (5.3%) |
| 65 to 74 Years | 3 (3.2%) | 0 (0.0%) |
| 75 Years and over | 0 (0.0%) | 0 (0.0%) |
Disability Class: Cognitive Difficulty
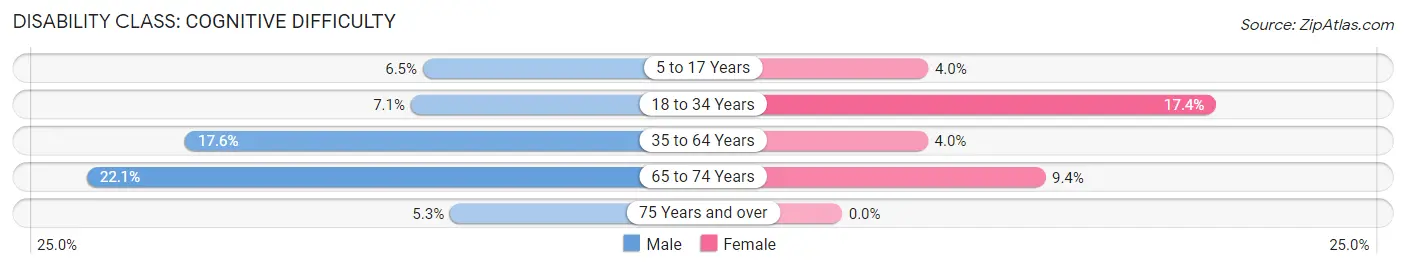
| Age Bracket | Male | Female |
| 5 to 17 Years | 23 (6.5%) | 7 (4.0%) |
| 18 to 34 Years | 17 (7.1%) | 29 (17.4%) |
| 35 to 64 Years | 96 (17.5%) | 21 (4.0%) |
| 65 to 74 Years | 21 (22.1%) | 15 (9.4%) |
| 75 Years and over | 4 (5.3%) | 0 (0.0%) |
Disability Class: Ambulatory Difficulty
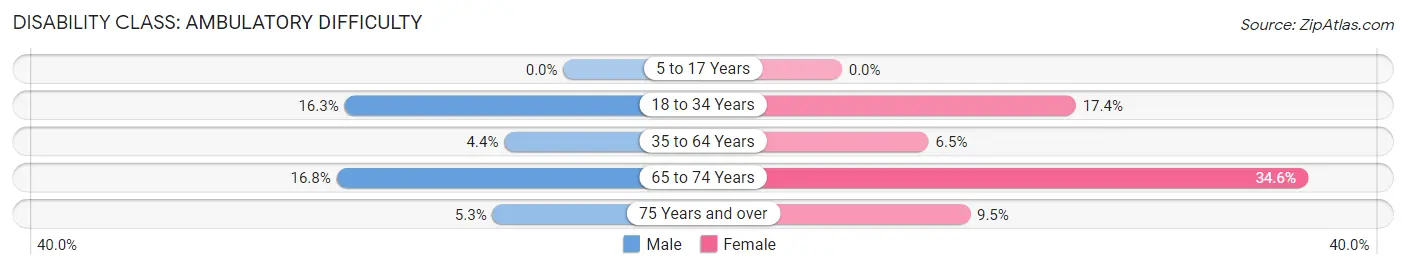
| Age Bracket | Male | Female |
| 5 to 17 Years | 0 (0.0%) | 0 (0.0%) |
| 18 to 34 Years | 39 (16.3%) | 29 (17.4%) |
| 35 to 64 Years | 24 (4.4%) | 34 (6.5%) |
| 65 to 74 Years | 16 (16.8%) | 55 (34.6%) |
| 75 Years and over | 4 (5.3%) | 4 (9.5%) |
Disability Class: Self-Care Difficulty
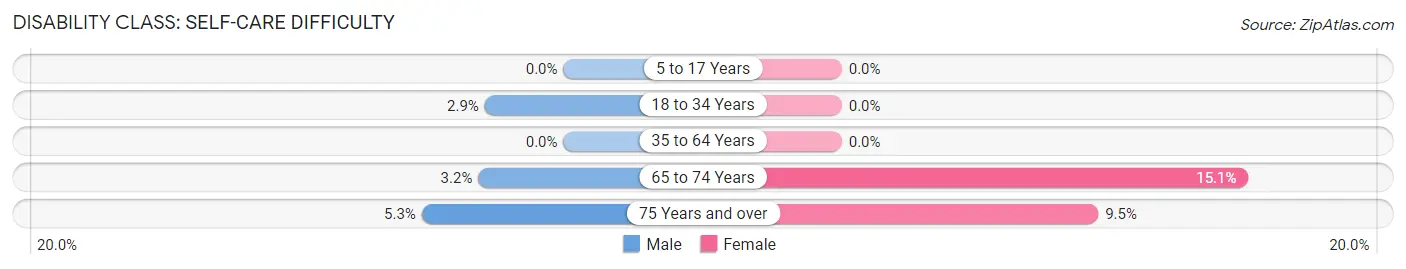
| Age Bracket | Male | Female |
| 5 to 17 Years | 0 (0.0%) | 0 (0.0%) |
| 18 to 34 Years | 7 (2.9%) | 0 (0.0%) |
| 35 to 64 Years | 0 (0.0%) | 0 (0.0%) |
| 65 to 74 Years | 3 (3.2%) | 24 (15.1%) |
| 75 Years and over | 4 (5.3%) | 4 (9.5%) |
Technology Access in Blaine
Computing Device Access in Blaine
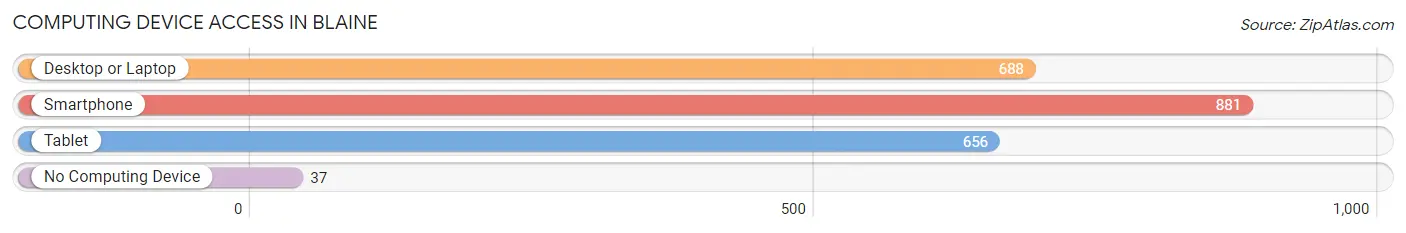
| Device Type | # Households | % Households |
| Desktop or Laptop | 688 | 71.7% |
| Smartphone | 881 | 91.9% |
| Tablet | 656 | 68.4% |
| No Computing Device | 37 | 3.9% |
| Total | 959 | 100.0% |
Internet Access in Blaine
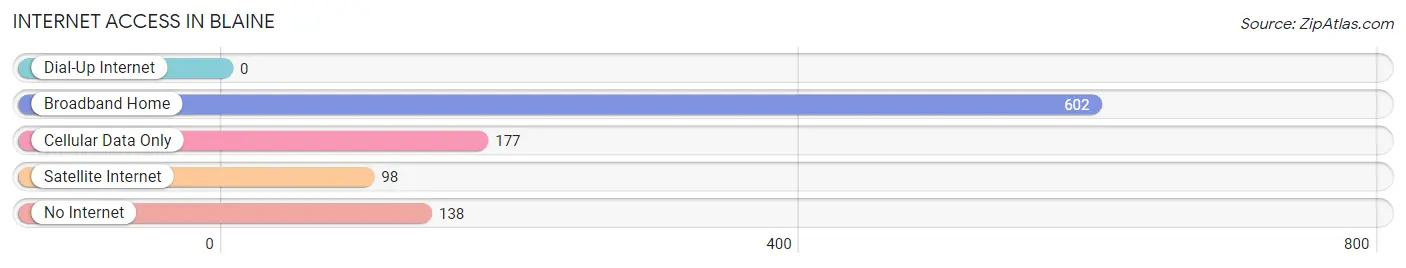
| Internet Type | # Households | % Households |
| Dial-Up Internet | 0 | 0.0% |
| Broadband Home | 602 | 62.8% |
| Cellular Data Only | 177 | 18.5% |
| Satellite Internet | 98 | 10.2% |
| No Internet | 138 | 14.4% |
| Total | 959 | 100.0% |
Blaine Summary
Blaine, Tennessee is a small town located in Grainger County, in the eastern part of the state. It is situated in the foothills of the Great Smoky Mountains, and is part of the Appalachian region. The town has a population of approximately 1,000 people, and is known for its rural charm and friendly atmosphere.
History
Blaine was founded in 1820 by a group of settlers from North Carolina. The town was named after a local creek, which was named after a Revolutionary War soldier named Blaine. The town was originally a farming community, and the main crops grown were corn, wheat, and tobacco. In the late 1800s, the town began to grow and develop, and a post office was established in 1891.
In the early 1900s, the town began to experience a period of growth and prosperity. The railroad was extended to Blaine in 1906, and the town became a hub for the surrounding area. The town also became a popular tourist destination, as it was close to the Great Smoky Mountains National Park.
Geography
Blaine is located in the foothills of the Great Smoky Mountains, in the eastern part of Tennessee. The town is situated in a valley, and is surrounded by rolling hills and mountains. The town is located near the French Broad River, and is about 25 miles from Knoxville.
The climate in Blaine is mild and humid, with hot summers and cool winters. The average temperature in the summer is around 80 degrees Fahrenheit, and the average temperature in the winter is around 40 degrees Fahrenheit.
Economy
The economy of Blaine is largely based on agriculture and tourism. The town is home to several farms, which produce a variety of crops, including corn, wheat, and tobacco. The town is also home to several small businesses, including restaurants, shops, and other services.
Tourism is an important part of the economy of Blaine. The town is close to the Great Smoky Mountains National Park, and is a popular destination for outdoor enthusiasts. The town also hosts several festivals and events throughout the year, which attract visitors from all over the region.
Demographics
As of the 2010 census, the population of Blaine was 1,000 people. The racial makeup of the town was 97.2% White, 0.7% African American, 0.3% Native American, 0.2% Asian, and 1.6% from other races. The median household income in Blaine was $30,000, and the median age was 40 years.
Conclusion
Blaine, Tennessee is a small town located in Grainger County, in the eastern part of the state. It is situated in the foothills of the Great Smoky Mountains, and is part of the Appalachian region. The town has a population of approximately 1,000 people, and is known for its rural charm and friendly atmosphere. The economy of Blaine is largely based on agriculture and tourism, and the town is home to several farms and small businesses. The town is also close to the Great Smoky Mountains National Park, and is a popular destination for outdoor enthusiasts. The racial makeup of the town is predominantly White, with a small percentage of African American, Native American, and Asian residents.
Common Questions
What is Per Capita Income in Blaine?
Per Capita income in Blaine is $27,621.
What is the Median Family Income in Blaine?
Median Family Income in Blaine is $79,524.
What is the Median Household income in Blaine?
Median Household Income in Blaine is $56,942.
What is Income or Wage Gap in Blaine?
Income or Wage Gap in Blaine is 35.7%.
Women in Blaine earn 64.3 cents for every dollar earned by a man.
What is Inequality or Gini Index in Blaine?
Inequality or Gini Index in Blaine is 0.40.
What is the Total Population of Blaine?
Total Population of Blaine is 2,496.
What is the Total Male Population of Blaine?
Total Male Population of Blaine is 1,375.
What is the Total Female Population of Blaine?
Total Female Population of Blaine is 1,121.
What is the Ratio of Males per 100 Females in Blaine?
There are 122.66 Males per 100 Females in Blaine.
What is the Ratio of Females per 100 Males in Blaine?
There are 81.53 Females per 100 Males in Blaine.
What is the Median Population Age in Blaine?
Median Population Age in Blaine is 40.4 Years.
What is the Average Family Size in Blaine
Average Family Size in Blaine is 3.0 People.
What is the Average Household Size in Blaine
Average Household Size in Blaine is 2.6 People.
How Large is the Labor Force in Blaine?
There are 1,190 People in the Labor Forcein in Blaine.
What is the Percentage of People in the Labor Force in Blaine?
59.7% of People are in the Labor Force in Blaine.
What is the Unemployment Rate in Blaine?
Unemployment Rate in Blaine is 8.3%.