Lookout Mountain, TN Map & Demographics
Lookout Mountain Map
Lookout Mountain Overview
$110,591
PER CAPITA INCOME
$228,478
AVG FAMILY INCOME
$181,458
AVG HOUSEHOLD INCOME
69.9%
WAGE / INCOME GAP [ % ]
30.1¢/ $1
WAGE / INCOME GAP [ $ ]
0.51
INEQUALITY / GINI INDEX
2,128
TOTAL POPULATION
951
MALE POPULATION
1,177
FEMALE POPULATION
80.80
MALES / 100 FEMALES
123.76
FEMALES / 100 MALES
49.3
MEDIAN AGE
3.1
AVG FAMILY SIZE
2.7
AVG HOUSEHOLD SIZE
882
LABOR FORCE [ PEOPLE ]
52.6%
PERCENT IN LABOR FORCE
0.8%
UNEMPLOYMENT RATE
Lookout Mountain Zip Codes
Lookout Mountain Area Codes
Income in Lookout Mountain
Income Overview in Lookout Mountain
Per Capita Income in Lookout Mountain is $110,591, while median incomes of families and households are $228,478 and $181,458 respectively.
| Characteristic | Number | Measure |
| Per Capita Income | 2,128 | $110,591 |
| Median Family Income | 610 | $228,478 |
| Mean Family Income | 610 | $328,226 |
| Median Household Income | 801 | $181,458 |
| Mean Household Income | 801 | $289,852 |
| Income Deficit | 610 | $0 |
| Wage / Income Gap (%) | 2,128 | 69.86% |
| Wage / Income Gap ($) | 2,128 | 30.14¢ per $1 |
| Gini / Inequality Index | 2,128 | 0.51 |
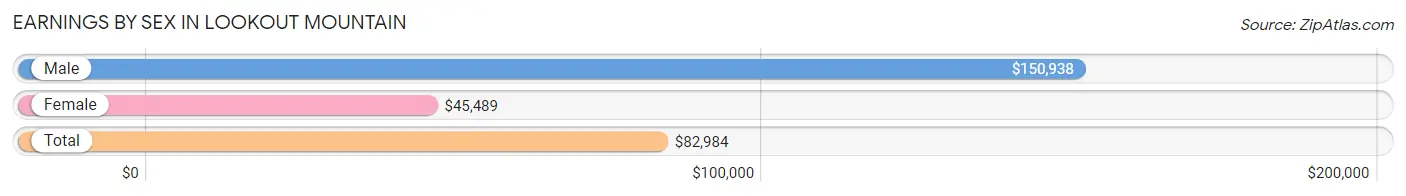
Earnings by Sex in Lookout Mountain
Average Earnings in Lookout Mountain are $82,984, $150,938 for men and $45,489 for women, a difference of 69.9%.
| Sex | Number | Average Earnings |
| Male | 501 (51.8%) | $150,938 |
| Female | 467 (48.2%) | $45,489 |
| Total | 968 (100.0%) | $82,984 |
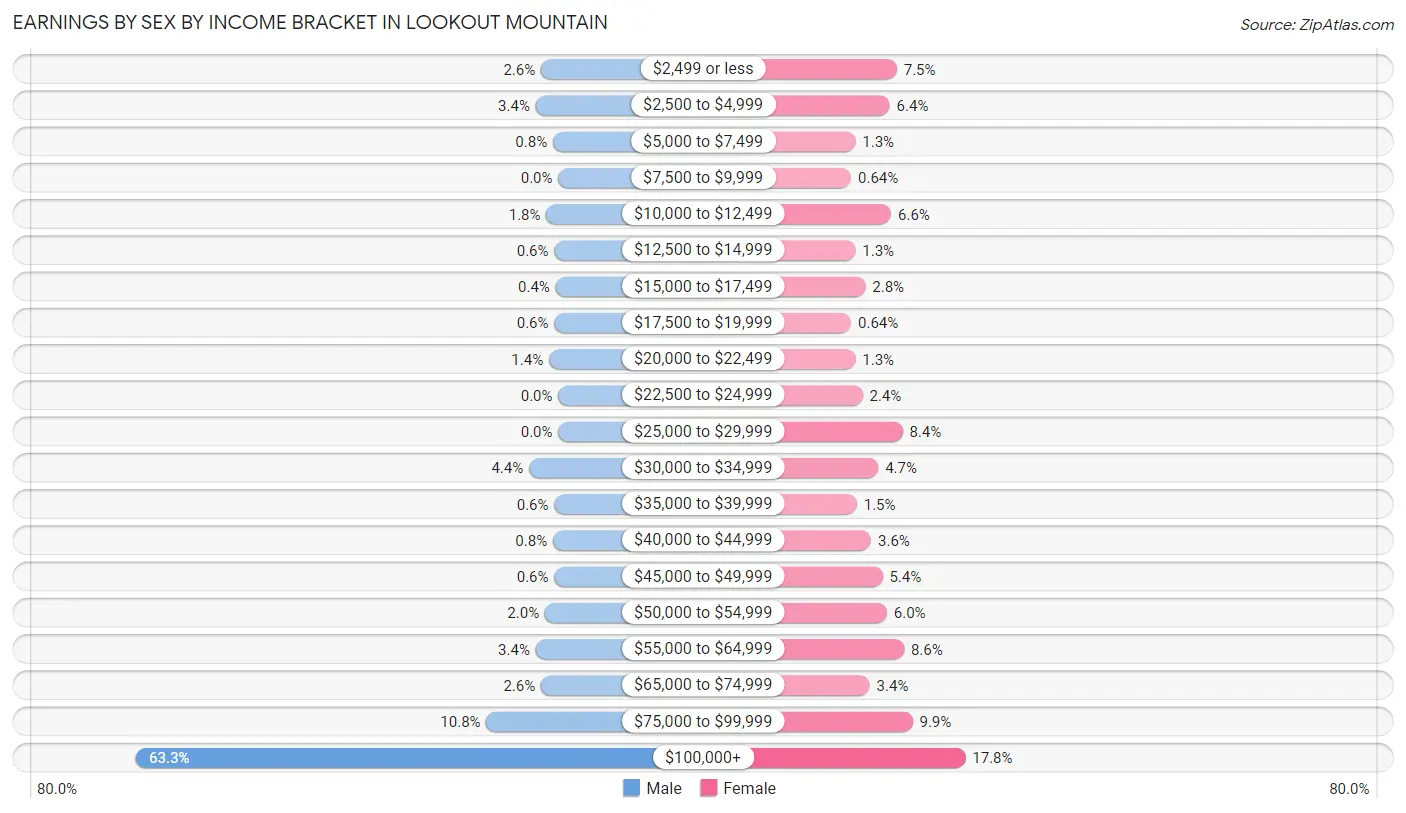
Earnings by Sex by Income Bracket in Lookout Mountain
The most common earnings brackets in Lookout Mountain are $100,000+ for men (317 | 63.3%) and $100,000+ for women (83 | 17.8%).
| Income | Male | Female |
| $2,499 or less | 13 (2.6%) | 35 (7.5%) |
| $2,500 to $4,999 | 17 (3.4%) | 30 (6.4%) |
| $5,000 to $7,499 | 4 (0.8%) | 6 (1.3%) |
| $7,500 to $9,999 | 0 (0.0%) | 3 (0.6%) |
| $10,000 to $12,499 | 9 (1.8%) | 31 (6.6%) |
| $12,500 to $14,999 | 3 (0.6%) | 6 (1.3%) |
| $15,000 to $17,499 | 2 (0.4%) | 13 (2.8%) |
| $17,500 to $19,999 | 3 (0.6%) | 3 (0.6%) |
| $20,000 to $22,499 | 7 (1.4%) | 6 (1.3%) |
| $22,500 to $24,999 | 0 (0.0%) | 11 (2.4%) |
| $25,000 to $29,999 | 0 (0.0%) | 39 (8.4%) |
| $30,000 to $34,999 | 22 (4.4%) | 22 (4.7%) |
| $35,000 to $39,999 | 3 (0.6%) | 7 (1.5%) |
| $40,000 to $44,999 | 4 (0.8%) | 17 (3.6%) |
| $45,000 to $49,999 | 3 (0.6%) | 25 (5.3%) |
| $50,000 to $54,999 | 10 (2.0%) | 28 (6.0%) |
| $55,000 to $64,999 | 17 (3.4%) | 40 (8.6%) |
| $65,000 to $74,999 | 13 (2.6%) | 16 (3.4%) |
| $75,000 to $99,999 | 54 (10.8%) | 46 (9.9%) |
| $100,000+ | 317 (63.3%) | 83 (17.8%) |
| Total | 501 (100.0%) | 467 (100.0%) |
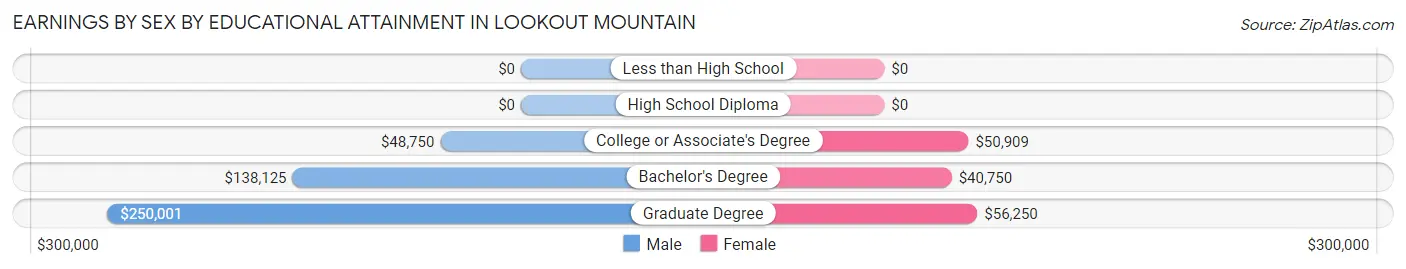
Earnings by Sex by Educational Attainment in Lookout Mountain
Average earnings in Lookout Mountain are $180,833 for men and $50,192 for women, a difference of 72.2%. Men with an educational attainment of graduate degree enjoy the highest average annual earnings of $250,001, while those with college or associate's degree education earn the least with $48,750. Women with an educational attainment of graduate degree earn the most with the average annual earnings of $56,250, while those with bachelor's degree education have the smallest earnings of $40,750.
| Educational Attainment | Male Income | Female Income |
| Less than High School | - | - |
| High School Diploma | - | - |
| College or Associate's Degree | $48,750 | $50,909 |
| Bachelor's Degree | $138,125 | $40,750 |
| Graduate Degree | $250,001 | $56,250 |
| Total | $180,833 | $50,192 |
Family Income in Lookout Mountain
Family Income Brackets in Lookout Mountain
According to the Lookout Mountain family income data, there are 339 families falling into the $200,000+ income range, which is the most common income bracket and makes up 55.6% of all families.
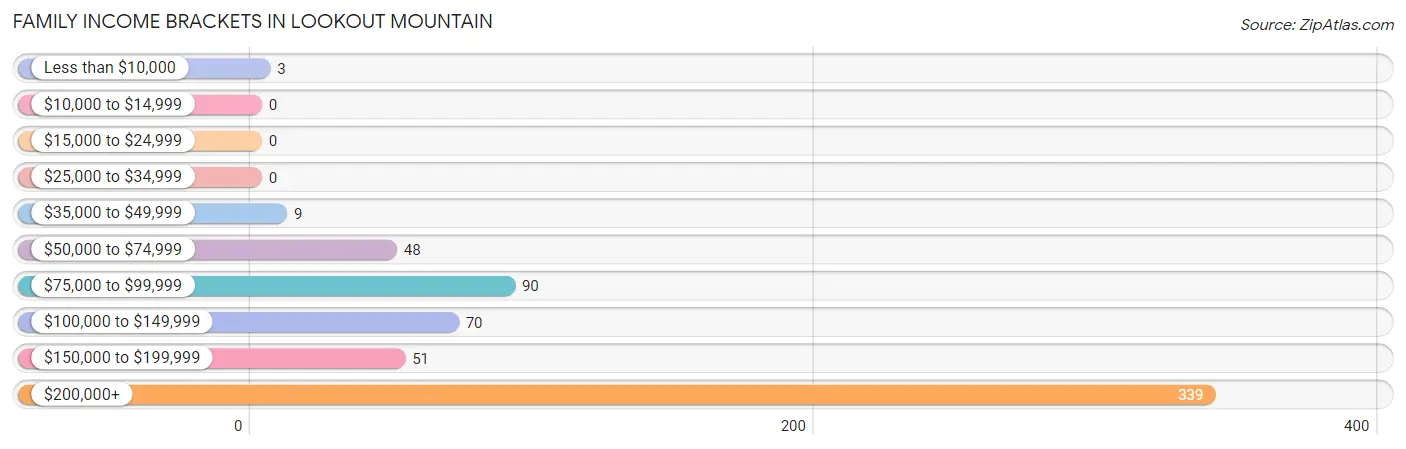
| Income Bracket | # Families | % Families |
| Less than $10,000 | 3 | 0.5% |
| $10,000 to $14,999 | 0 | 0.0% |
| $15,000 to $24,999 | 0 | 0.0% |
| $25,000 to $34,999 | 0 | 0.0% |
| $35,000 to $49,999 | 9 | 1.5% |
| $50,000 to $74,999 | 48 | 7.9% |
| $75,000 to $99,999 | 90 | 14.8% |
| $100,000 to $149,999 | 70 | 11.5% |
| $150,000 to $199,999 | 51 | 8.4% |
| $200,000+ | 339 | 55.6% |
Family Income by Famaliy Size in Lookout Mountain
3-person families (90 | 14.7%) account for the highest median family income in Lookout Mountain with $250,001 per family, while 2-person families (320 | 52.5%) have the highest median income of $83,438 per family member.
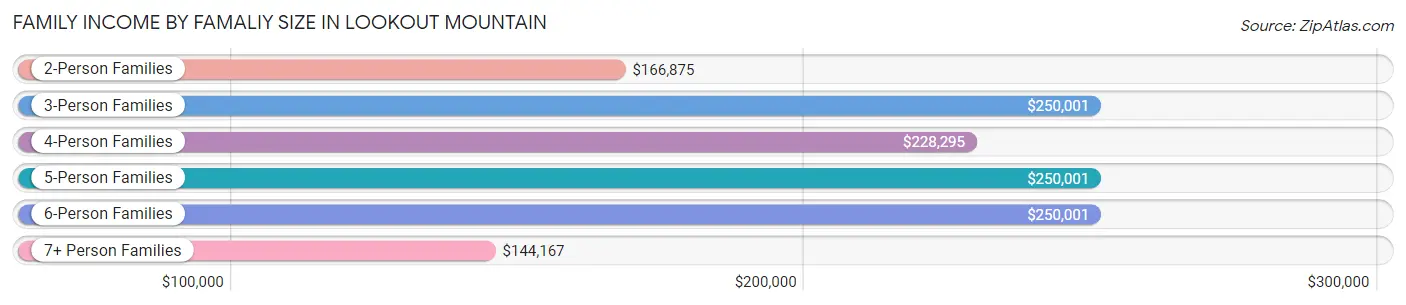
| Income Bracket | # Families | Median Income |
| 2-Person Families | 320 (52.5%) | $166,875 |
| 3-Person Families | 90 (14.7%) | $250,001 |
| 4-Person Families | 123 (20.2%) | $228,295 |
| 5-Person Families | 51 (8.4%) | $250,001 |
| 6-Person Families | 12 (2.0%) | $250,001 |
| 7+ Person Families | 14 (2.3%) | $144,167 |
| Total | 610 (100.0%) | $228,478 |
Family Income by Number of Earners in Lookout Mountain
The median family income in Lookout Mountain is $228,478, with families comprising 1 earner (173) having the highest median family income of $250,001, while families with no earners (134) have the lowest median family income of $92,045, accounting for 28.4% and 22.0% of families, respectively.
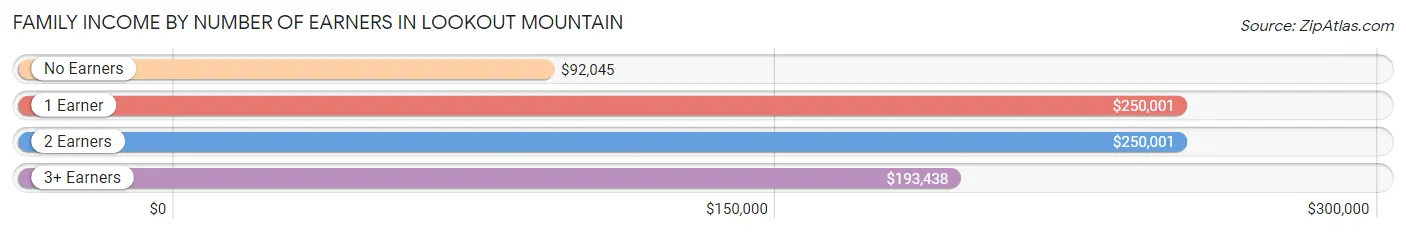
| Number of Earners | # Families | Median Income |
| No Earners | 134 (22.0%) | $92,045 |
| 1 Earner | 173 (28.4%) | $250,001 |
| 2 Earners | 264 (43.3%) | $250,001 |
| 3+ Earners | 39 (6.4%) | $193,438 |
| Total | 610 (100.0%) | $228,478 |
Household Income in Lookout Mountain
Household Income Brackets in Lookout Mountain
With 376 households falling in the category, the $200,000+ income range is the most frequent in Lookout Mountain, accounting for 46.9% of all households. In contrast, only 5 households (0.6%) fall into the $15,000 to $24,999 income bracket, making it the least populous group.
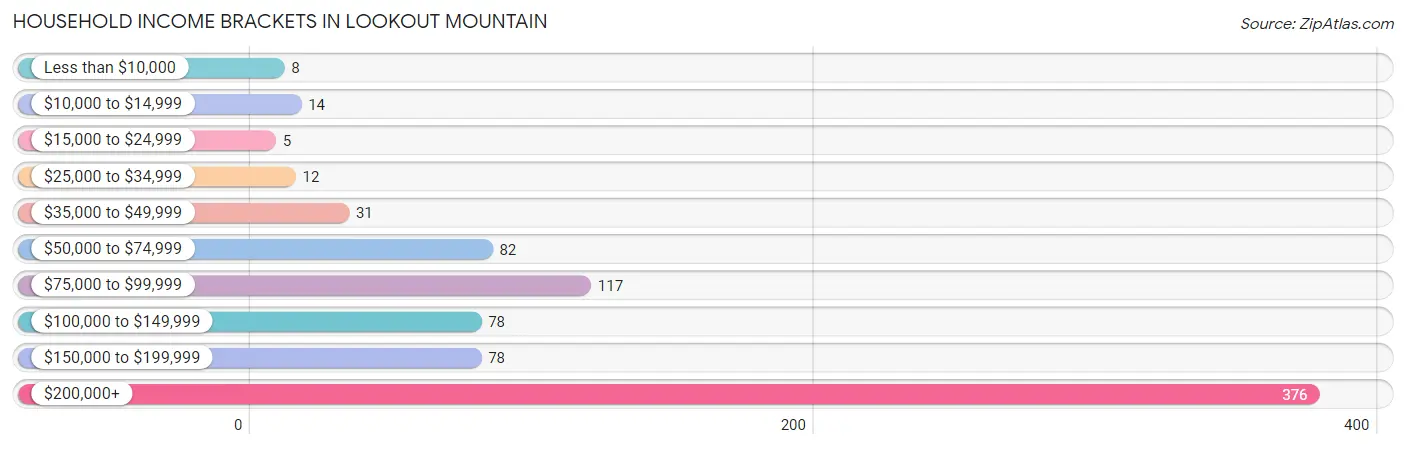
| Income Bracket | # Households | % Households |
| Less than $10,000 | 8 | 1.0% |
| $10,000 to $14,999 | 14 | 1.7% |
| $15,000 to $24,999 | 5 | 0.6% |
| $25,000 to $34,999 | 12 | 1.5% |
| $35,000 to $49,999 | 31 | 3.9% |
| $50,000 to $74,999 | 82 | 10.2% |
| $75,000 to $99,999 | 117 | 14.6% |
| $100,000 to $149,999 | 78 | 9.7% |
| $150,000 to $199,999 | 78 | 9.7% |
| $200,000+ | 376 | 46.9% |
Household Income by Householder Age in Lookout Mountain
The median household income in Lookout Mountain is $181,458, with the highest median household income of $242,083 found in the 45 to 64 years age bracket for the primary householder. A total of 323 households (40.3%) fall into this category.
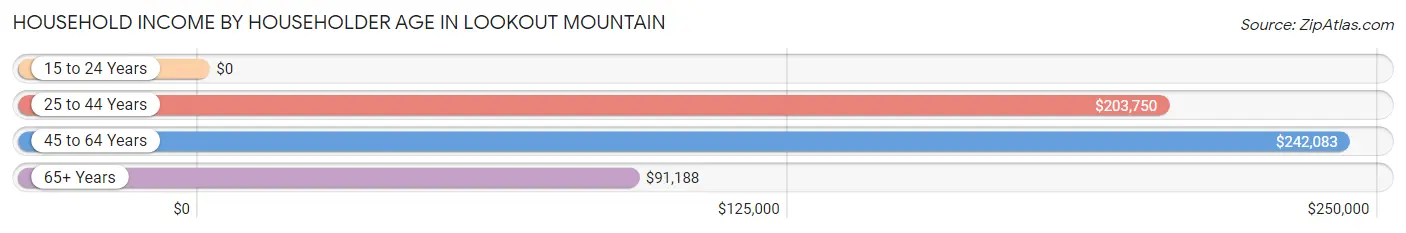
| Income Bracket | # Households | Median Income |
| 15 to 24 Years | 0 (0.0%) | $0 |
| 25 to 44 Years | 140 (17.5%) | $203,750 |
| 45 to 64 Years | 323 (40.3%) | $242,083 |
| 65+ Years | 338 (42.2%) | $91,188 |
| Total | 801 (100.0%) | $181,458 |
Poverty in Lookout Mountain
Income Below Poverty by Sex and Age in Lookout Mountain
With 2.9% poverty level for males and 1.9% for females among the residents of Lookout Mountain, 75 year old and over males and 75 year old and over females are the most vulnerable to poverty, with 12 males (13.6%) and 10 females (6.2%) in their respective age groups living below the poverty level.
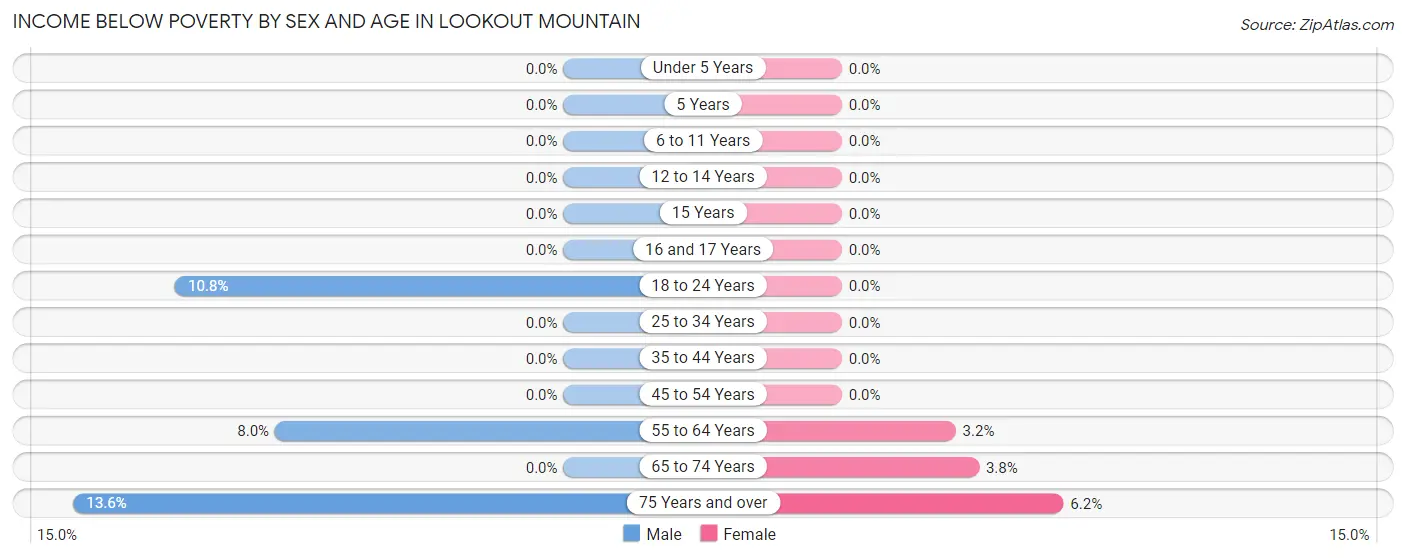
| Age Bracket | Male | Female |
| Under 5 Years | 0 (0.0%) | 0 (0.0%) |
| 5 Years | 0 (0.0%) | 0 (0.0%) |
| 6 to 11 Years | 0 (0.0%) | 0 (0.0%) |
| 12 to 14 Years | 0 (0.0%) | 0 (0.0%) |
| 15 Years | 0 (0.0%) | 0 (0.0%) |
| 16 and 17 Years | 0 (0.0%) | 0 (0.0%) |
| 18 to 24 Years | 4 (10.8%) | 0 (0.0%) |
| 25 to 34 Years | 0 (0.0%) | 0 (0.0%) |
| 35 to 44 Years | 0 (0.0%) | 0 (0.0%) |
| 45 to 54 Years | 0 (0.0%) | 0 (0.0%) |
| 55 to 64 Years | 11 (8.0%) | 6 (3.2%) |
| 65 to 74 Years | 0 (0.0%) | 6 (3.8%) |
| 75 Years and over | 12 (13.6%) | 10 (6.2%) |
| Total | 27 (2.9%) | 22 (1.9%) |
Income Above Poverty by Sex and Age in Lookout Mountain
According to the poverty statistics in Lookout Mountain, males aged under 5 years and females aged under 5 years are the age groups that are most secure financially, with 100.0% of males and 100.0% of females in these age groups living above the poverty line.
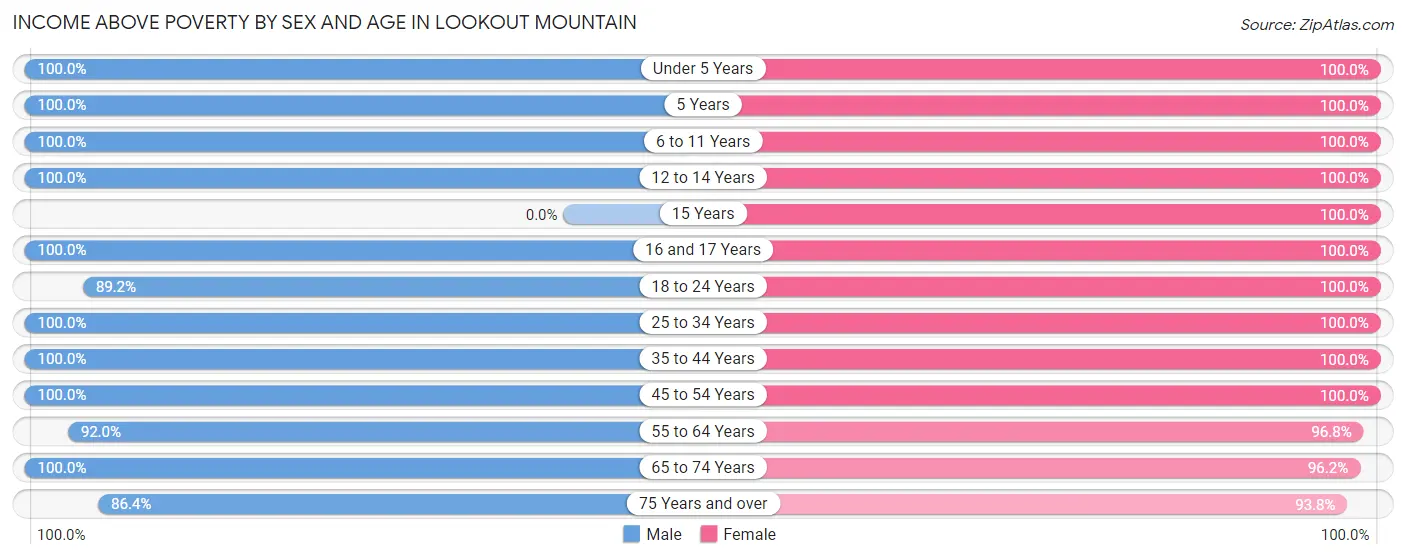
| Age Bracket | Male | Female |
| Under 5 Years | 37 (100.0%) | 55 (100.0%) |
| 5 Years | 13 (100.0%) | 16 (100.0%) |
| 6 to 11 Years | 94 (100.0%) | 76 (100.0%) |
| 12 to 14 Years | 63 (100.0%) | 70 (100.0%) |
| 15 Years | 0 (0.0%) | 19 (100.0%) |
| 16 and 17 Years | 52 (100.0%) | 27 (100.0%) |
| 18 to 24 Years | 33 (89.2%) | 50 (100.0%) |
| 25 to 34 Years | 58 (100.0%) | 71 (100.0%) |
| 35 to 44 Years | 78 (100.0%) | 123 (100.0%) |
| 45 to 54 Years | 161 (100.0%) | 162 (100.0%) |
| 55 to 64 Years | 126 (92.0%) | 183 (96.8%) |
| 65 to 74 Years | 125 (100.0%) | 151 (96.2%) |
| 75 Years and over | 76 (86.4%) | 152 (93.8%) |
| Total | 916 (97.1%) | 1,155 (98.1%) |
Income Below Poverty Among Married-Couple Families in Lookout Mountain
The poverty statistics for married-couple families in Lookout Mountain show that 0.5% or 3 of the total 558 families live below the poverty line. Families with no children have the highest poverty rate of 0.9%, comprising of 3 families. On the other hand, families with 1 or 2 children have the lowest poverty rate of 0.0%, which includes 0 families.
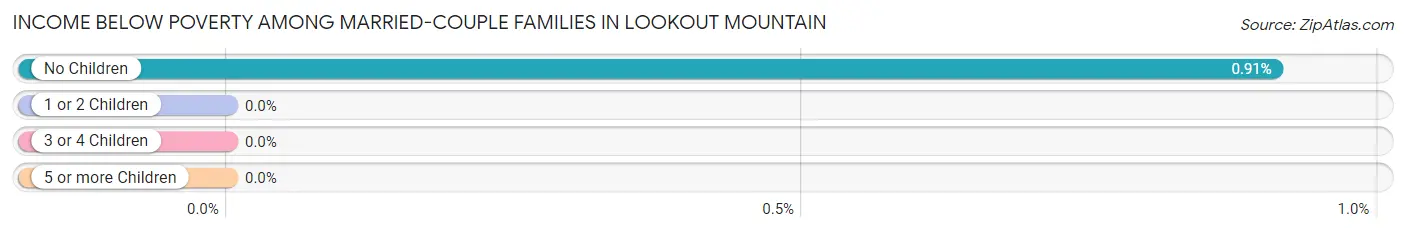
| Children | Above Poverty | Below Poverty |
| No Children | 327 (99.1%) | 3 (0.9%) |
| 1 or 2 Children | 160 (100.0%) | 0 (0.0%) |
| 3 or 4 Children | 54 (100.0%) | 0 (0.0%) |
| 5 or more Children | 14 (100.0%) | 0 (0.0%) |
| Total | 555 (99.5%) | 3 (0.5%) |
Income Below Poverty Among Single-Parent Households in Lookout Mountain
| Children | Single Father | Single Mother |
| No Children | 0 (0.0%) | 0 (0.0%) |
| 1 or 2 Children | 0 (0.0%) | 0 (0.0%) |
| 3 or 4 Children | 0 (0.0%) | 0 (0.0%) |
| 5 or more Children | 0 (0.0%) | 0 (0.0%) |
| Total | 0 (0.0%) | 0 (0.0%) |
Income Below Poverty Among Married-Couple vs Single-Parent Households in Lookout Mountain
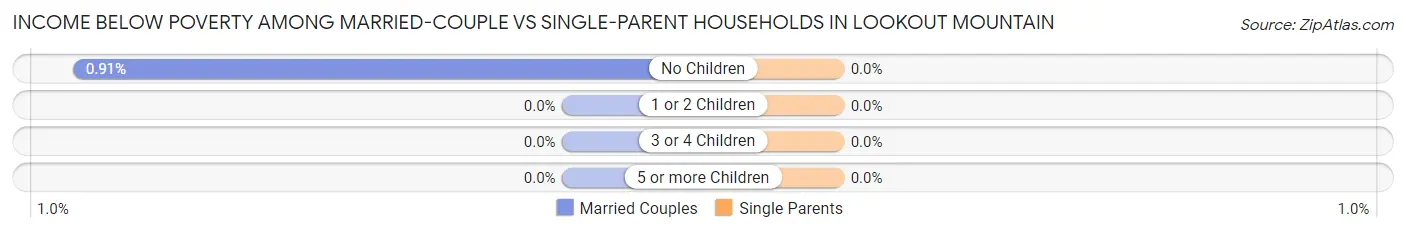
| Children | Married-Couple Families | Single-Parent Households |
| No Children | 3 (0.9%) | 0 (0.0%) |
| 1 or 2 Children | 0 (0.0%) | 0 (0.0%) |
| 3 or 4 Children | 0 (0.0%) | 0 (0.0%) |
| 5 or more Children | 0 (0.0%) | 0 (0.0%) |
| Total | 3 (0.5%) | 0 (0.0%) |
Race in Lookout Mountain
The most populous races in Lookout Mountain are White / Caucasian (2,063 | 97.0%), Two or more Races (31 | 1.5%), and Black / African American (20 | 0.9%).
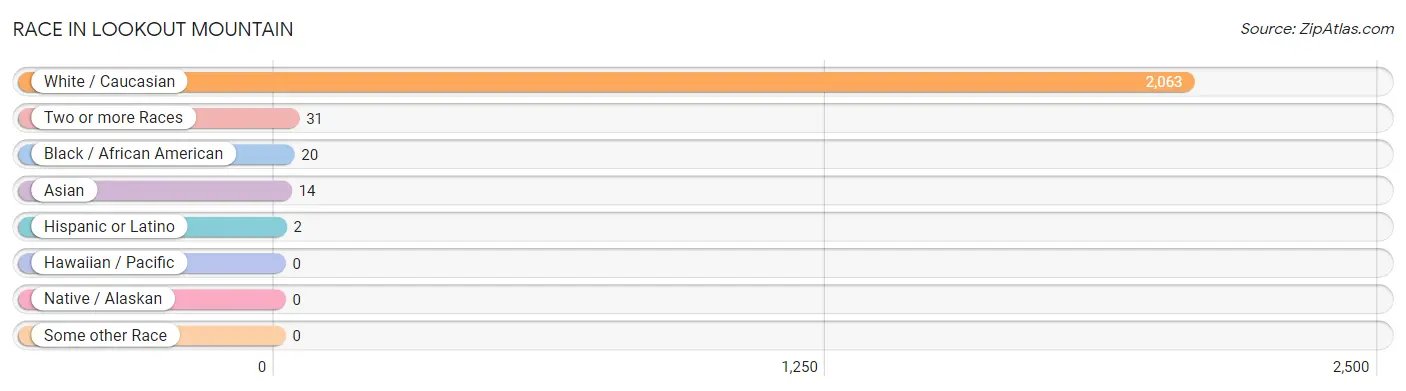
| Race | # Population | % Population |
| Asian | 14 | 0.7% |
| Black / African American | 20 | 0.9% |
| Hawaiian / Pacific | 0 | 0.0% |
| Hispanic or Latino | 2 | 0.1% |
| Native / Alaskan | 0 | 0.0% |
| White / Caucasian | 2,063 | 97.0% |
| Two or more Races | 31 | 1.5% |
| Some other Race | 0 | 0.0% |
| Total | 2,128 | 100.0% |
Ancestry in Lookout Mountain
The most populous ancestries reported in Lookout Mountain are English (625 | 29.4%), German (288 | 13.5%), Irish (202 | 9.5%), American (175 | 8.2%), and Scotch-Irish (165 | 7.7%), together accounting for 68.4% of all Lookout Mountain residents.
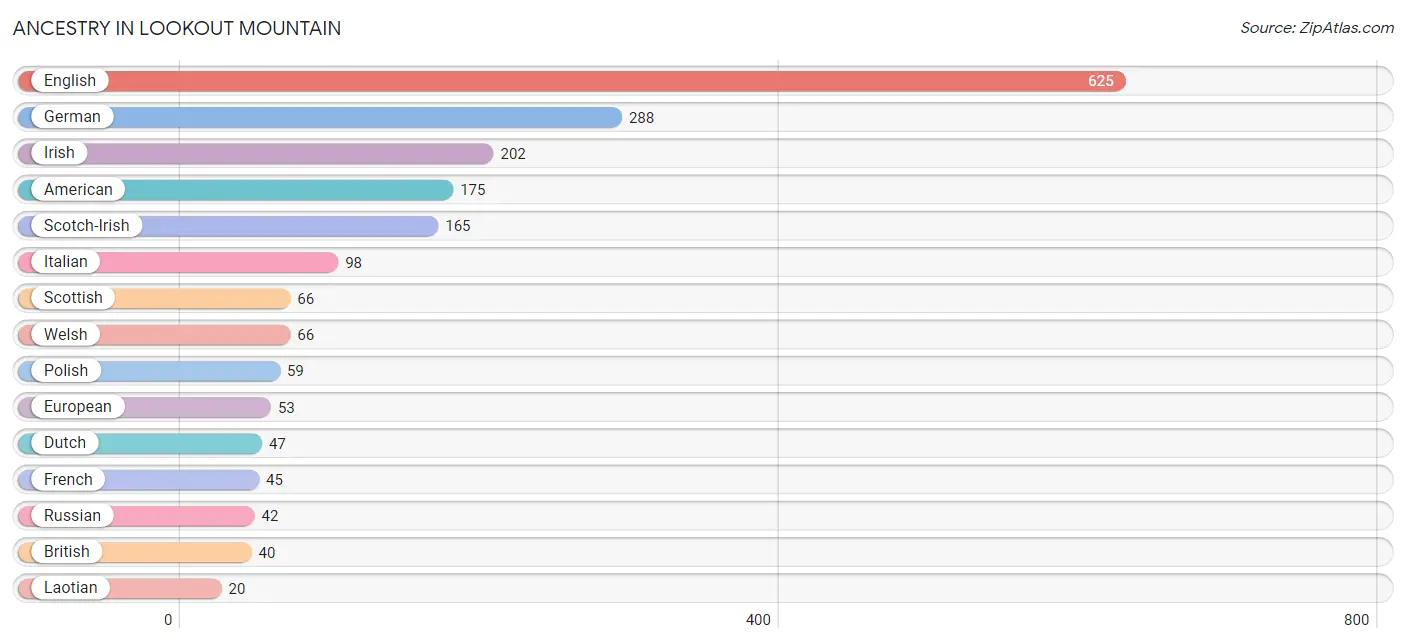
| Ancestry | # Population | % Population |
| American | 175 | 8.2% |
| Arab | 10 | 0.5% |
| Austrian | 9 | 0.4% |
| Basque | 14 | 0.7% |
| British | 40 | 1.9% |
| Burmese | 2 | 0.1% |
| Cherokee | 7 | 0.3% |
| Czechoslovakian | 2 | 0.1% |
| Danish | 2 | 0.1% |
| Dutch | 47 | 2.2% |
| Egyptian | 3 | 0.1% |
| English | 625 | 29.4% |
| European | 53 | 2.5% |
| French | 45 | 2.1% |
| French Canadian | 3 | 0.1% |
| German | 288 | 13.5% |
| Greek | 17 | 0.8% |
| Haitian | 3 | 0.1% |
| Hungarian | 3 | 0.1% |
| Indian (Asian) | 3 | 0.1% |
| Irish | 202 | 9.5% |
| Italian | 98 | 4.6% |
| Laotian | 20 | 0.9% |
| Lebanese | 5 | 0.2% |
| Northern European | 6 | 0.3% |
| Norwegian | 17 | 0.8% |
| Polish | 59 | 2.8% |
| Russian | 42 | 2.0% |
| Scandinavian | 16 | 0.7% |
| Scotch-Irish | 165 | 7.7% |
| Scottish | 66 | 3.1% |
| Spanish | 2 | 0.1% |
| Swedish | 18 | 0.9% |
| Swiss | 11 | 0.5% |
| Thai | 9 | 0.4% |
| Welsh | 66 | 3.1% | View All 36 Rows |
Immigrants in Lookout Mountain
The most numerous immigrant groups reported in Lookout Mountain came from Europe (51 | 2.4%), Eastern Europe (18 | 0.9%), Russia (18 | 0.9%), Western Europe (17 | 0.8%), and Northern Europe (16 | 0.7%), together accounting for 5.7% of all Lookout Mountain residents.
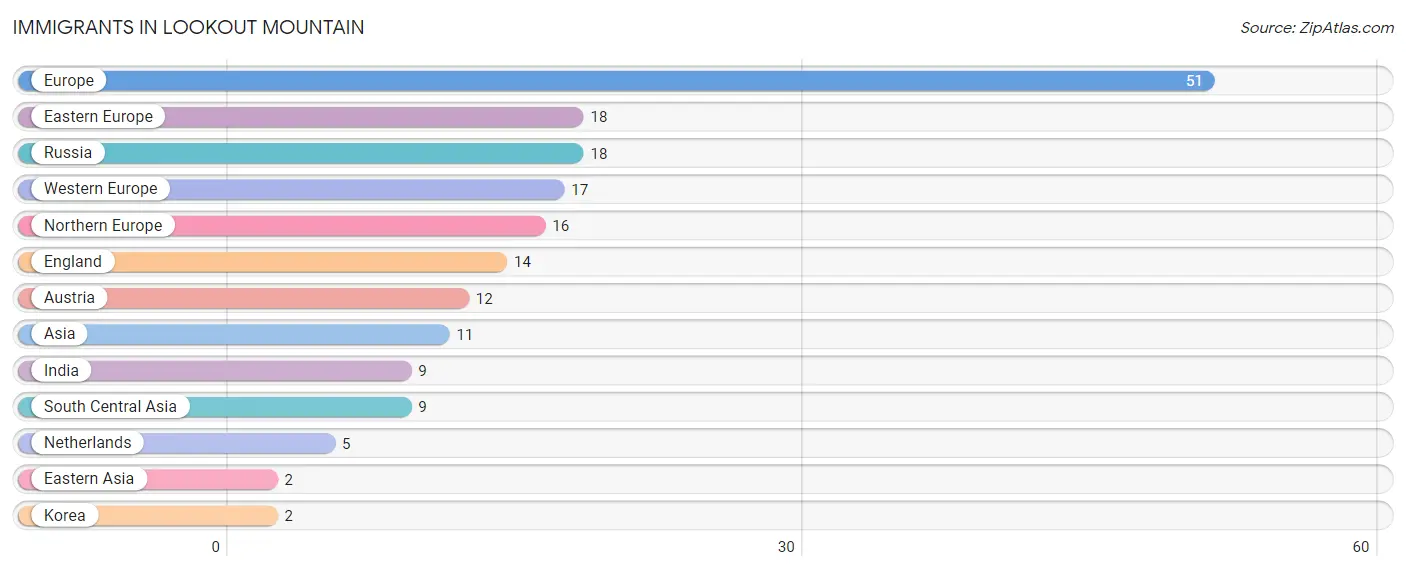
| Immigration Origin | # Population | % Population |
| Asia | 11 | 0.5% |
| Austria | 12 | 0.6% |
| Eastern Asia | 2 | 0.1% |
| Eastern Europe | 18 | 0.9% |
| England | 14 | 0.7% |
| Europe | 51 | 2.4% |
| India | 9 | 0.4% |
| Korea | 2 | 0.1% |
| Netherlands | 5 | 0.2% |
| Northern Europe | 16 | 0.7% |
| Russia | 18 | 0.9% |
| South Central Asia | 9 | 0.4% |
| Western Europe | 17 | 0.8% | View All 13 Rows |
Sex and Age in Lookout Mountain
Sex and Age in Lookout Mountain
The most populous age groups in Lookout Mountain are 10 to 14 Years (101 | 10.6%) for men and 60 to 64 Years (139 | 11.8%) for women.
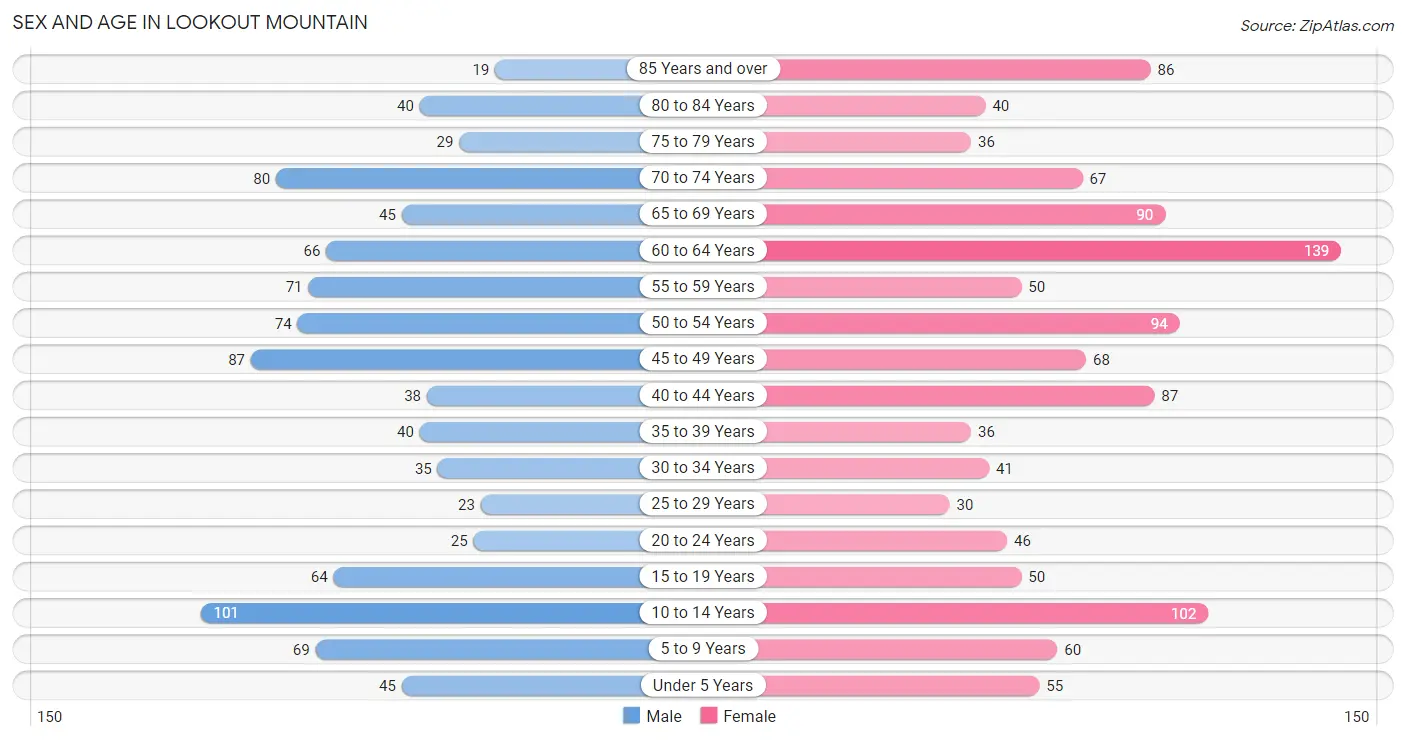
| Age Bracket | Male | Female |
| Under 5 Years | 45 (4.7%) | 55 (4.7%) |
| 5 to 9 Years | 69 (7.3%) | 60 (5.1%) |
| 10 to 14 Years | 101 (10.6%) | 102 (8.7%) |
| 15 to 19 Years | 64 (6.7%) | 50 (4.3%) |
| 20 to 24 Years | 25 (2.6%) | 46 (3.9%) |
| 25 to 29 Years | 23 (2.4%) | 30 (2.5%) |
| 30 to 34 Years | 35 (3.7%) | 41 (3.5%) |
| 35 to 39 Years | 40 (4.2%) | 36 (3.1%) |
| 40 to 44 Years | 38 (4.0%) | 87 (7.4%) |
| 45 to 49 Years | 87 (9.1%) | 68 (5.8%) |
| 50 to 54 Years | 74 (7.8%) | 94 (8.0%) |
| 55 to 59 Years | 71 (7.5%) | 50 (4.3%) |
| 60 to 64 Years | 66 (6.9%) | 139 (11.8%) |
| 65 to 69 Years | 45 (4.7%) | 90 (7.6%) |
| 70 to 74 Years | 80 (8.4%) | 67 (5.7%) |
| 75 to 79 Years | 29 (3.0%) | 36 (3.1%) |
| 80 to 84 Years | 40 (4.2%) | 40 (3.4%) |
| 85 Years and over | 19 (2.0%) | 86 (7.3%) |
| Total | 951 (100.0%) | 1,177 (100.0%) |
Families and Households in Lookout Mountain
Median Family Size in Lookout Mountain
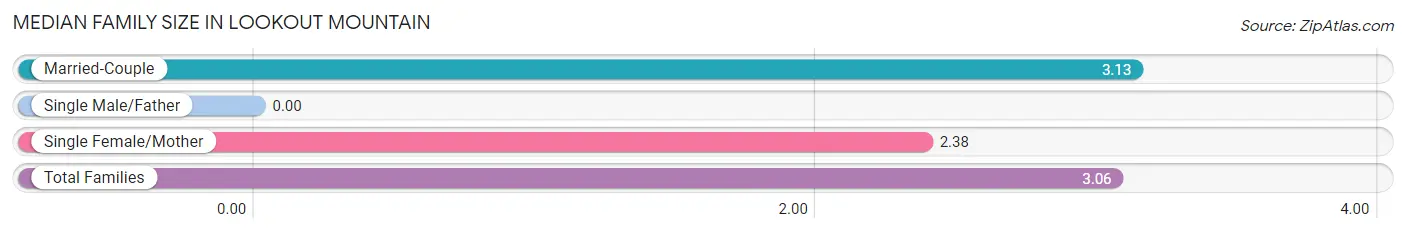
| Family Type | # Families | Family Size |
| Married-Couple | 558 (91.5%) | 3.13 |
| Single Male/Father | 0 (0.0%) | - |
| Single Female/Mother | 52 (8.5%) | 2.38 |
| Total Families | 610 (100.0%) | 3.06 |
Median Household Size in Lookout Mountain
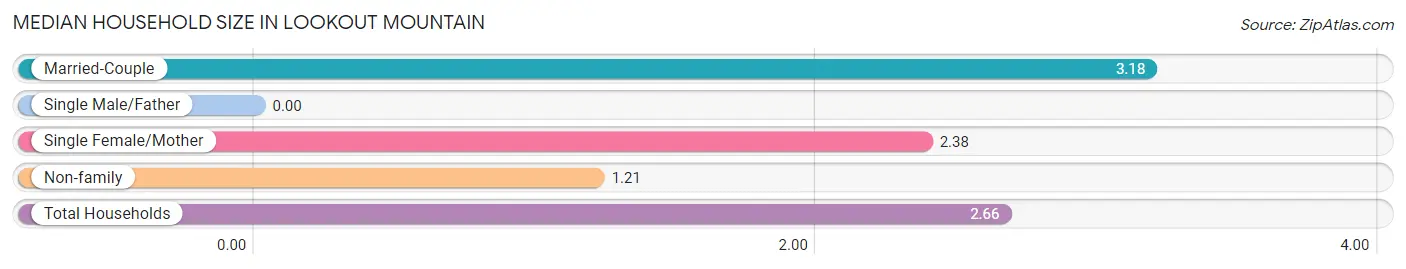
| Household Type | # Households | Household Size |
| Married-Couple | 558 (69.7%) | 3.18 |
| Single Male/Father | 0 (0.0%) | - |
| Single Female/Mother | 52 (6.5%) | 2.38 |
| Non-family | 191 (23.8%) | 1.21 |
| Total Households | 801 (100.0%) | 2.66 |
Household Size by Marriage Status in Lookout Mountain
Out of a total of 801 households in Lookout Mountain, 610 (76.1%) are family households, while 191 (23.8%) are nonfamily households. The most numerous type of family households are 2-person households, comprising 315, and the most common type of nonfamily households are 1-person households, comprising 168.
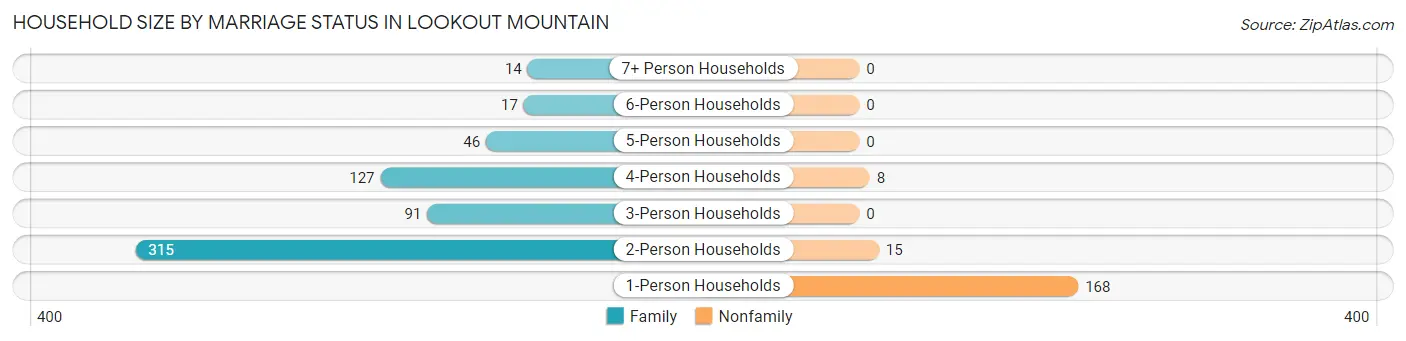
| Household Size | Family Households | Nonfamily Households |
| 1-Person Households | - | 168 (21.0%) |
| 2-Person Households | 315 (39.3%) | 15 (1.9%) |
| 3-Person Households | 91 (11.4%) | 0 (0.0%) |
| 4-Person Households | 127 (15.9%) | 8 (1.0%) |
| 5-Person Households | 46 (5.7%) | 0 (0.0%) |
| 6-Person Households | 17 (2.1%) | 0 (0.0%) |
| 7+ Person Households | 14 (1.8%) | 0 (0.0%) |
| Total | 610 (76.1%) | 191 (23.8%) |
Female Fertility in Lookout Mountain
Fertility by Age in Lookout Mountain
Average fertility rate in Lookout Mountain is 53.0 births per 1,000 women. Women in the age bracket of 20 to 34 years have the highest fertility rate with 171.0 births per 1,000 women. Women in the age bracket of 20 to 34 years acount for 100.0% of all women with births.
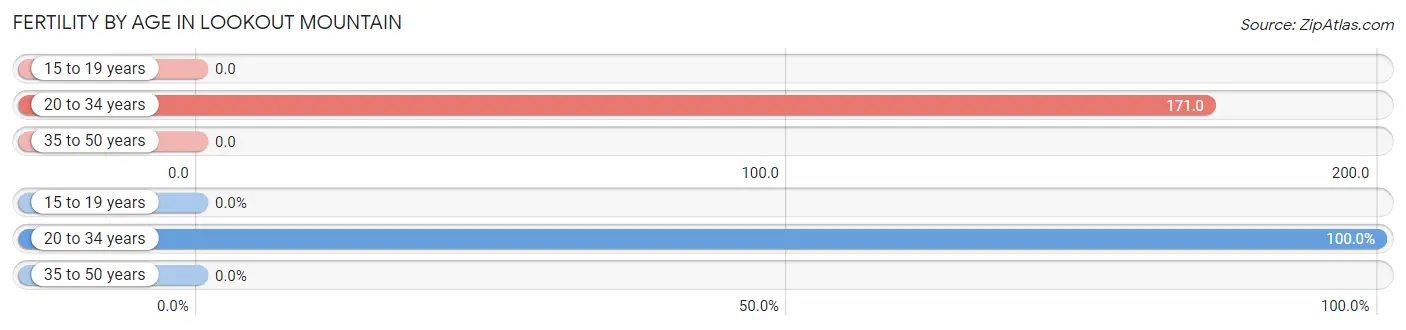
| Age Bracket | Women with Births | Births / 1,000 Women |
| 15 to 19 years | 0 (0.0%) | 0.0 |
| 20 to 34 years | 20 (100.0%) | 171.0 |
| 35 to 50 years | 0 (0.0%) | 0.0 |
| Total | 20 (100.0%) | 53.0 |
Fertility by Age by Marriage Status in Lookout Mountain
60.0% of women with births (20) in Lookout Mountain are married. The highest percentage of unmarried women with births falls into 20 to 34 years age bracket with 40.0% of them unmarried at the time of birth, while the lowest percentage of unmarried women with births belong to 20 to 34 years age bracket with 40.0% of them unmarried.
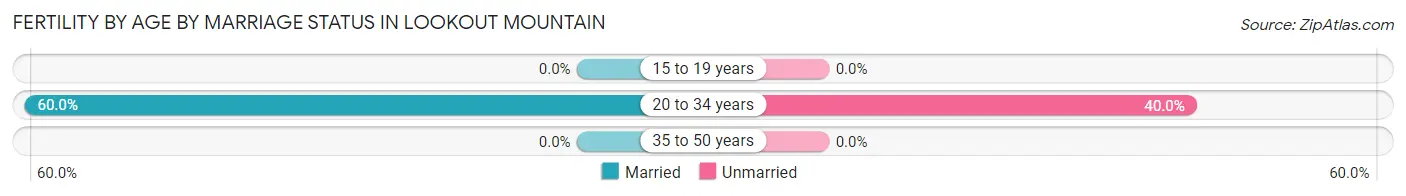
| Age Bracket | Married | Unmarried |
| 15 to 19 years | 0 (0.0%) | 0 (0.0%) |
| 20 to 34 years | 12 (60.0%) | 8 (40.0%) |
| 35 to 50 years | 0 (0.0%) | 0 (0.0%) |
| Total | 12 (60.0%) | 8 (40.0%) |
Fertility by Education in Lookout Mountain
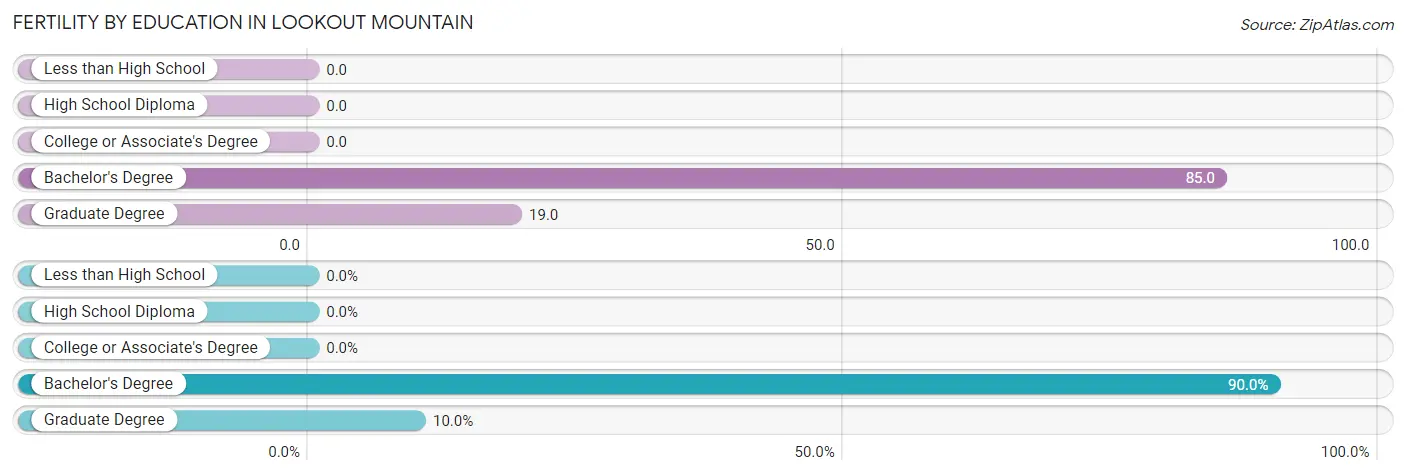
| Educational Attainment | Women with Births | Births / 1,000 Women |
| Less than High School | 0 (0.0%) | 0.0 |
| High School Diploma | 0 (0.0%) | 0.0 |
| College or Associate's Degree | 0 (0.0%) | 0.0 |
| Bachelor's Degree | 18 (90.0%) | 85.0 |
| Graduate Degree | 2 (10.0%) | 19.0 |
| Total | 20 (100.0%) | 53.0 |
Fertility by Education by Marriage Status in Lookout Mountain
40.0% of women with births in Lookout Mountain are unmarried. Women with the educational attainment of graduate degree are most likely to be married with 100.0% of them married at childbirth, while women with the educational attainment of bachelor's degree are least likely to be married with 44.4% of them unmarried at childbirth.
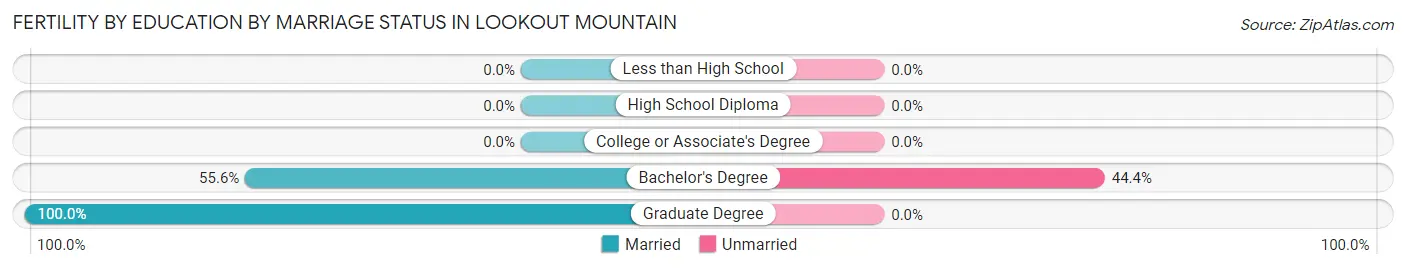
| Educational Attainment | Married | Unmarried |
| Less than High School | 0 (0.0%) | 0 (0.0%) |
| High School Diploma | 0 (0.0%) | 0 (0.0%) |
| College or Associate's Degree | 0 (0.0%) | 0 (0.0%) |
| Bachelor's Degree | 10 (55.6%) | 8 (44.4%) |
| Graduate Degree | 2 (100.0%) | 0 (0.0%) |
| Total | 12 (60.0%) | 8 (40.0%) |
Employment Characteristics in Lookout Mountain
Employment by Class of Employer in Lookout Mountain
Among the 872 employed individuals in Lookout Mountain, private company employees (493 | 56.5%), not-for-profit organizations (129 | 14.8%), and self-employed (not incorporated) (122 | 14.0%) make up the most common classes of employment.
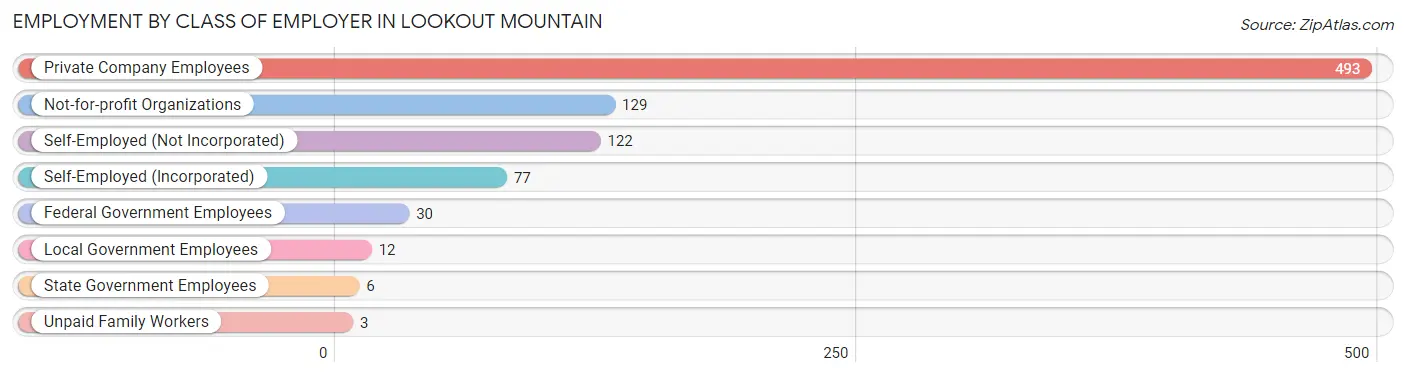
| Employer Class | # Employees | % Employees |
| Private Company Employees | 493 | 56.5% |
| Self-Employed (Incorporated) | 77 | 8.8% |
| Self-Employed (Not Incorporated) | 122 | 14.0% |
| Not-for-profit Organizations | 129 | 14.8% |
| Local Government Employees | 12 | 1.4% |
| State Government Employees | 6 | 0.7% |
| Federal Government Employees | 30 | 3.4% |
| Unpaid Family Workers | 3 | 0.3% |
| Total | 872 | 100.0% |
Employment Status by Age in Lookout Mountain
According to the labor force statistics for Lookout Mountain, out of the total population over 16 years of age (1,677), 52.6% or 882 individuals are in the labor force, with 0.8% or 7 of them unemployed. The age group with the highest labor force participation rate is 35 to 44 years, with 88.6% or 178 individuals in the labor force. Within the labor force, the 35 to 44 years age range has the highest percentage of unemployed individuals, with 3.9% or 7 of them being unemployed.
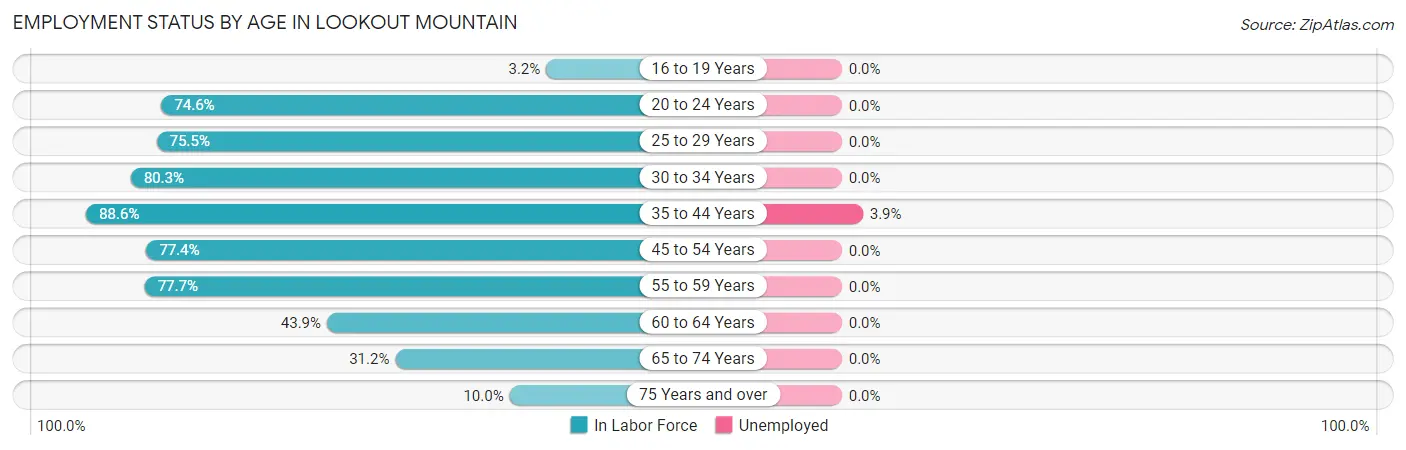
| Age Bracket | In Labor Force | Unemployed |
| 16 to 19 Years | 3 (3.2%) | 0 (0.0%) |
| 20 to 24 Years | 53 (74.6%) | 0 (0.0%) |
| 25 to 29 Years | 40 (75.5%) | 0 (0.0%) |
| 30 to 34 Years | 61 (80.3%) | 0 (0.0%) |
| 35 to 44 Years | 178 (88.6%) | 7 (3.9%) |
| 45 to 54 Years | 250 (77.4%) | 0 (0.0%) |
| 55 to 59 Years | 94 (77.7%) | 0 (0.0%) |
| 60 to 64 Years | 90 (43.9%) | 0 (0.0%) |
| 65 to 74 Years | 88 (31.2%) | 0 (0.0%) |
| 75 Years and over | 25 (10.0%) | 0 (0.0%) |
| Total | 882 (52.6%) | 7 (0.8%) |
Employment Status by Educational Attainment in Lookout Mountain
According to labor force statistics for Lookout Mountain, 72.8% of individuals (713) out of the total population between 25 and 64 years of age (979) are in the labor force, with 1.0% or 7 of them being unemployed. The group with the highest labor force participation rate are those with the educational attainment of less than high school, with 100.0% or 3 individuals in the labor force. Within the labor force, individuals with college / associate degree education have the highest percentage of unemployment, with 5.1% or 3 of them being unemployed.
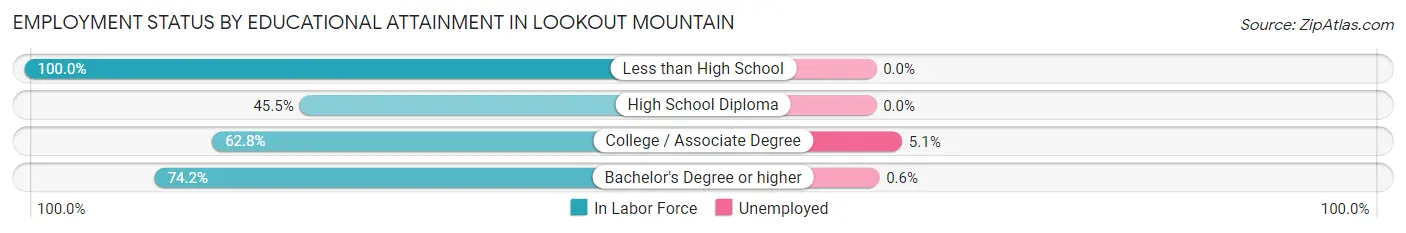
| Educational Attainment | In Labor Force | Unemployed |
| Less than High School | 3 (100.0%) | 0 (0.0%) |
| High School Diploma | 5 (45.5%) | 0 (0.0%) |
| College / Associate Degree | 59 (62.8%) | 5 (5.1%) |
| Bachelor's Degree or higher | 646 (74.2%) | 5 (0.6%) |
| Total | 713 (72.8%) | 10 (1.0%) |
Employment Occupations by Sex in Lookout Mountain
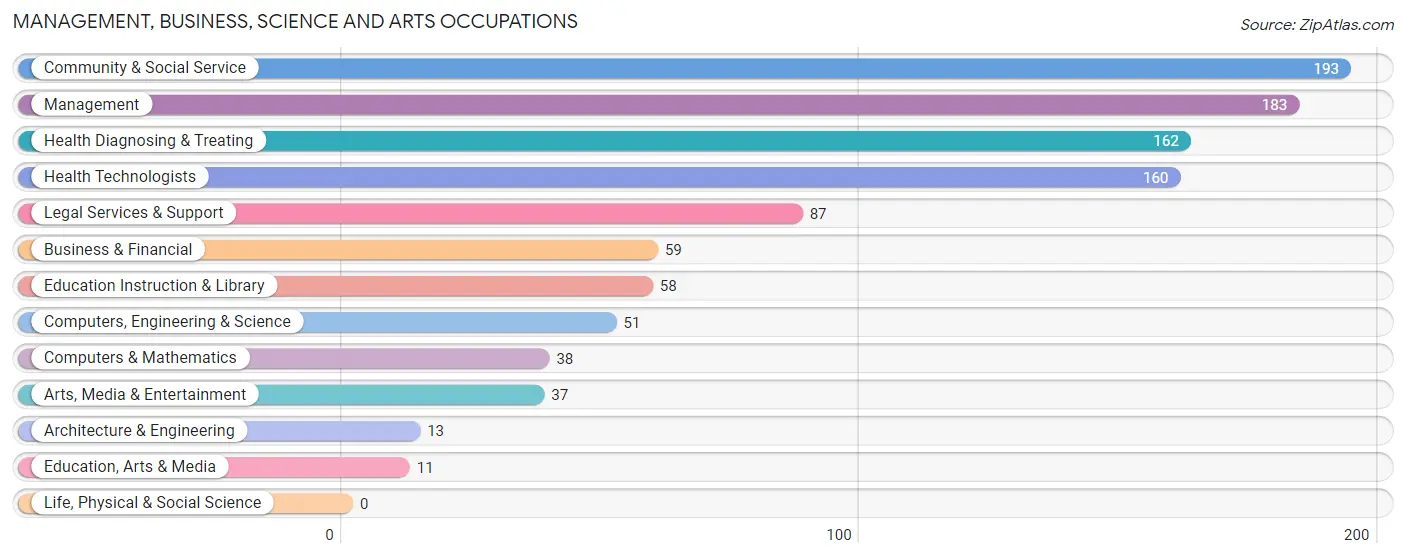
Management, Business, Science and Arts Occupations
The most common Management, Business, Science and Arts occupations in Lookout Mountain are Community & Social Service (193 | 22.1%), Management (183 | 20.9%), Health Diagnosing & Treating (162 | 18.5%), Health Technologists (160 | 18.3%), and Legal Services & Support (87 | 9.9%).
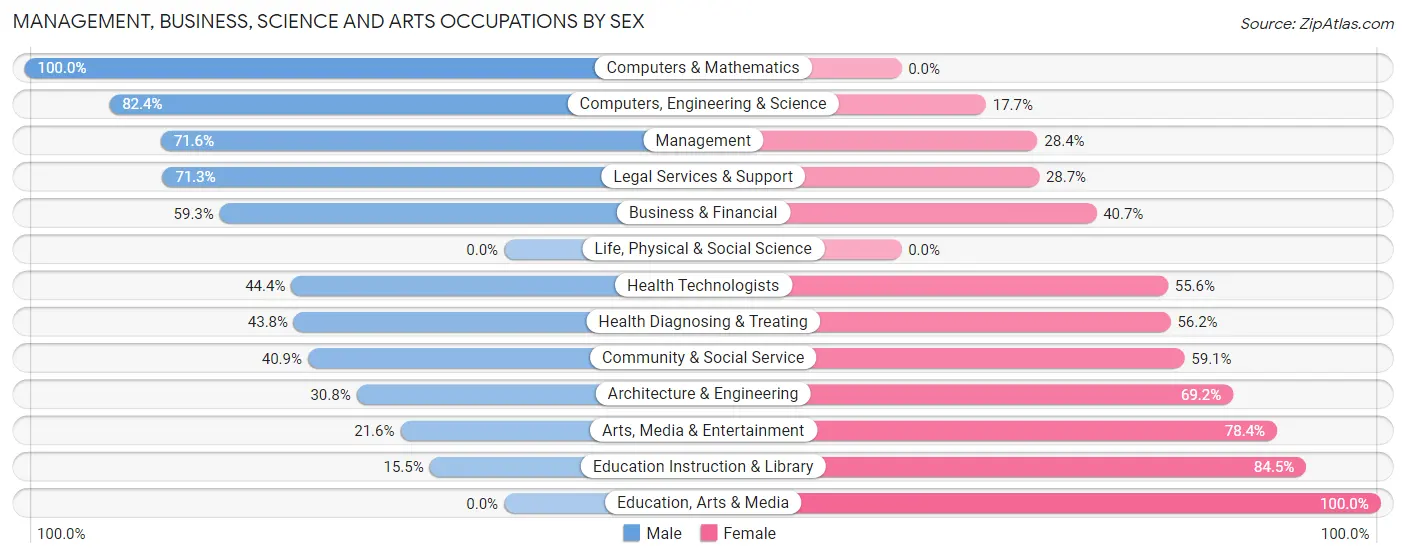
Management, Business, Science and Arts Occupations by Sex
Within the Management, Business, Science and Arts occupations in Lookout Mountain, the most male-oriented occupations are Computers & Mathematics (100.0%), Computers, Engineering & Science (82.4%), and Management (71.6%), while the most female-oriented occupations are Education, Arts & Media (100.0%), Education Instruction & Library (84.5%), and Arts, Media & Entertainment (78.4%).
| Occupation | Male | Female |
| Management | 131 (71.6%) | 52 (28.4%) |
| Business & Financial | 35 (59.3%) | 24 (40.7%) |
| Computers, Engineering & Science | 42 (82.4%) | 9 (17.6%) |
| Computers & Mathematics | 38 (100.0%) | 0 (0.0%) |
| Architecture & Engineering | 4 (30.8%) | 9 (69.2%) |
| Life, Physical & Social Science | 0 (0.0%) | 0 (0.0%) |
| Community & Social Service | 79 (40.9%) | 114 (59.1%) |
| Education, Arts & Media | 0 (0.0%) | 11 (100.0%) |
| Legal Services & Support | 62 (71.3%) | 25 (28.7%) |
| Education Instruction & Library | 9 (15.5%) | 49 (84.5%) |
| Arts, Media & Entertainment | 8 (21.6%) | 29 (78.4%) |
| Health Diagnosing & Treating | 71 (43.8%) | 91 (56.2%) |
| Health Technologists | 71 (44.4%) | 89 (55.6%) |
| Total (Category) | 358 (55.2%) | 290 (44.8%) |
| Total (Overall) | 452 (51.7%) | 423 (48.3%) |
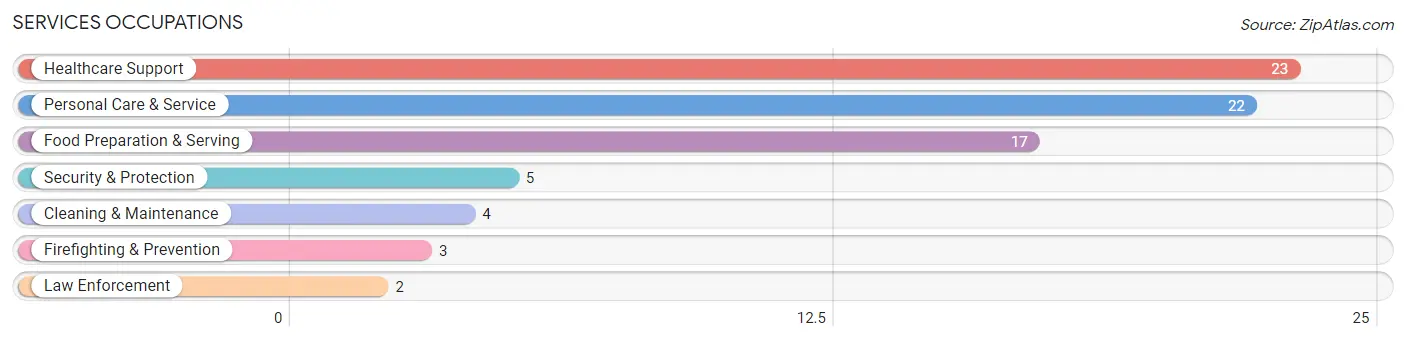
Services Occupations
The most common Services occupations in Lookout Mountain are Healthcare Support (23 | 2.6%), Personal Care & Service (22 | 2.5%), Food Preparation & Serving (17 | 1.9%), Security & Protection (5 | 0.6%), and Cleaning & Maintenance (4 | 0.5%).
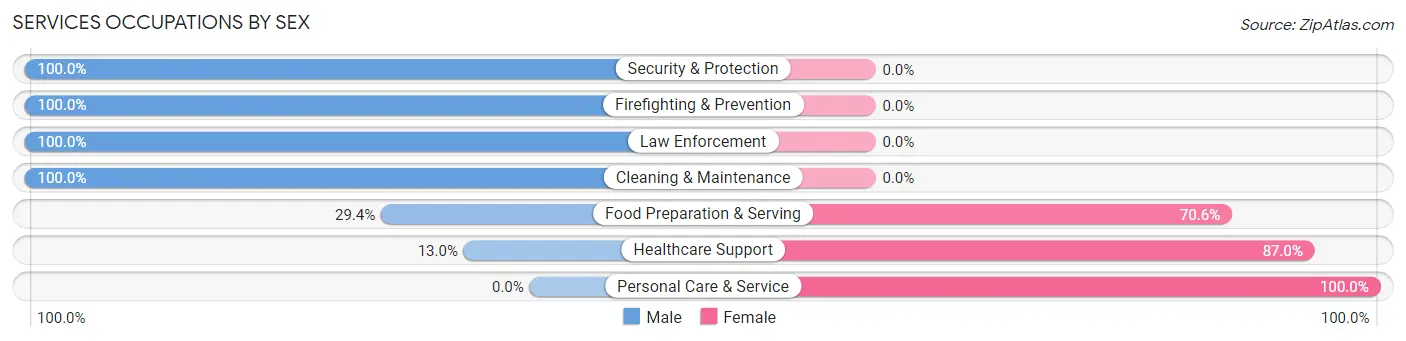
Services Occupations by Sex
Within the Services occupations in Lookout Mountain, the most male-oriented occupations are Security & Protection (100.0%), Firefighting & Prevention (100.0%), and Law Enforcement (100.0%), while the most female-oriented occupations are Personal Care & Service (100.0%), Healthcare Support (87.0%), and Food Preparation & Serving (70.6%).
| Occupation | Male | Female |
| Healthcare Support | 3 (13.0%) | 20 (87.0%) |
| Security & Protection | 5 (100.0%) | 0 (0.0%) |
| Firefighting & Prevention | 3 (100.0%) | 0 (0.0%) |
| Law Enforcement | 2 (100.0%) | 0 (0.0%) |
| Food Preparation & Serving | 5 (29.4%) | 12 (70.6%) |
| Cleaning & Maintenance | 4 (100.0%) | 0 (0.0%) |
| Personal Care & Service | 0 (0.0%) | 22 (100.0%) |
| Total (Category) | 17 (23.9%) | 54 (76.1%) |
| Total (Overall) | 452 (51.7%) | 423 (48.3%) |
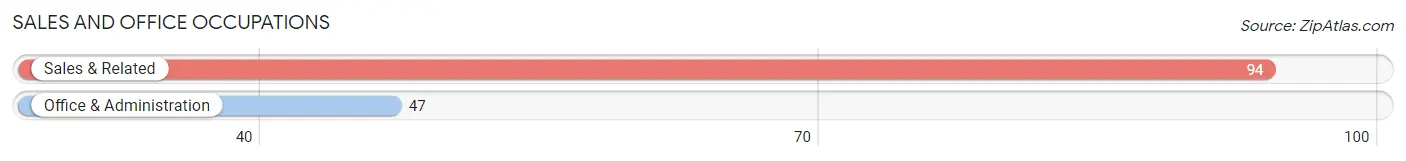
Sales and Office Occupations
The most common Sales and Office occupations in Lookout Mountain are Sales & Related (94 | 10.7%), and Office & Administration (47 | 5.4%).
Sales and Office Occupations by Sex
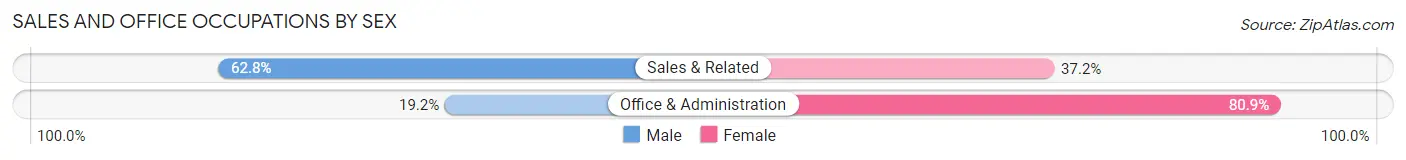
| Occupation | Male | Female |
| Sales & Related | 59 (62.8%) | 35 (37.2%) |
| Office & Administration | 9 (19.2%) | 38 (80.8%) |
| Total (Category) | 68 (48.2%) | 73 (51.8%) |
| Total (Overall) | 452 (51.7%) | 423 (48.3%) |
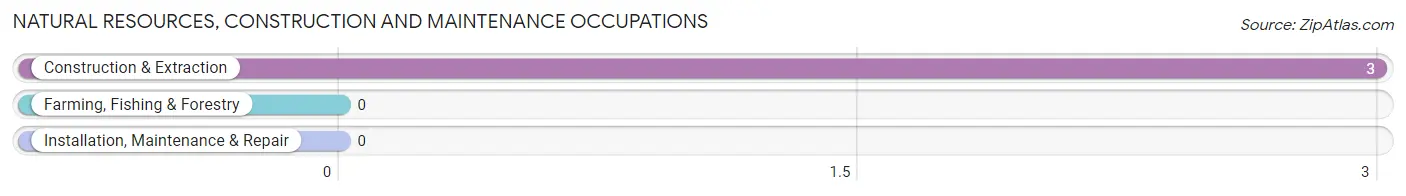
Natural Resources, Construction and Maintenance Occupations
The most common Natural Resources, Construction and Maintenance occupations in Lookout Mountain are , and Construction & Extraction (3 | 0.3%).
Natural Resources, Construction and Maintenance Occupations by Sex
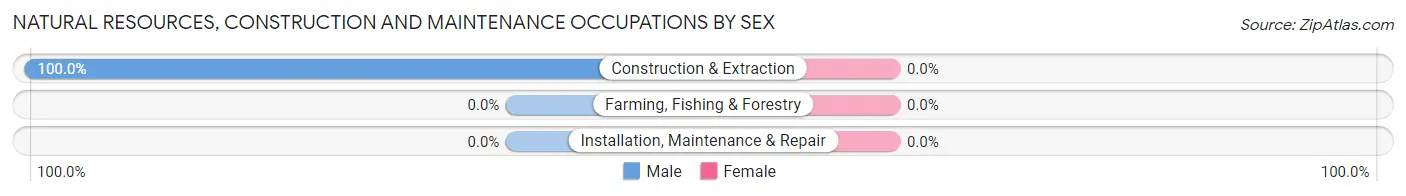
| Occupation | Male | Female |
| Farming, Fishing & Forestry | 0 (0.0%) | 0 (0.0%) |
| Construction & Extraction | 3 (100.0%) | 0 (0.0%) |
| Installation, Maintenance & Repair | 0 (0.0%) | 0 (0.0%) |
| Total (Category) | 3 (100.0%) | 0 (0.0%) |
| Total (Overall) | 452 (51.7%) | 423 (48.3%) |
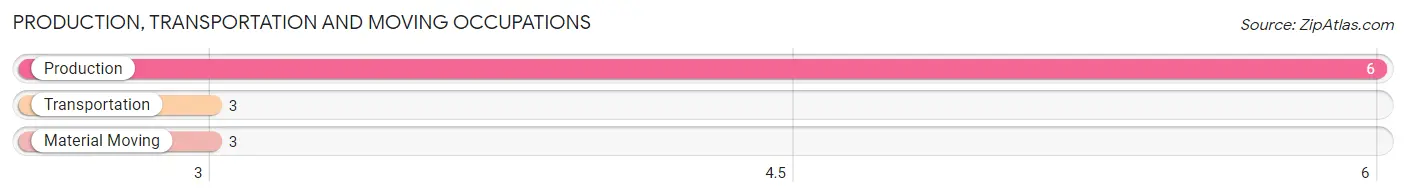
Production, Transportation and Moving Occupations
The most common Production, Transportation and Moving occupations in Lookout Mountain are Production (6 | 0.7%), Transportation (3 | 0.3%), and Material Moving (3 | 0.3%).
Production, Transportation and Moving Occupations by Sex
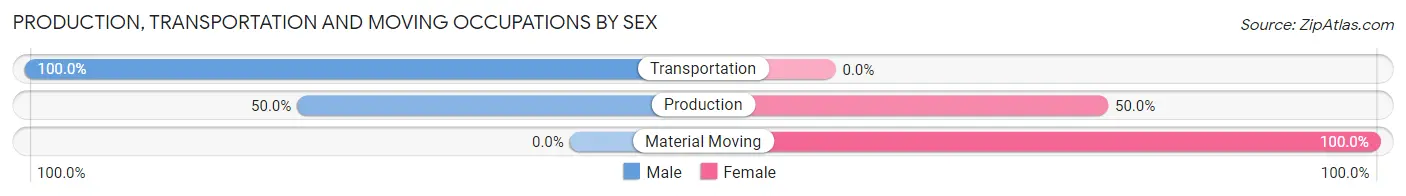
| Occupation | Male | Female |
| Production | 3 (50.0%) | 3 (50.0%) |
| Transportation | 3 (100.0%) | 0 (0.0%) |
| Material Moving | 0 (0.0%) | 3 (100.0%) |
| Total (Category) | 6 (50.0%) | 6 (50.0%) |
| Total (Overall) | 452 (51.7%) | 423 (48.3%) |
Employment Industries by Sex in Lookout Mountain
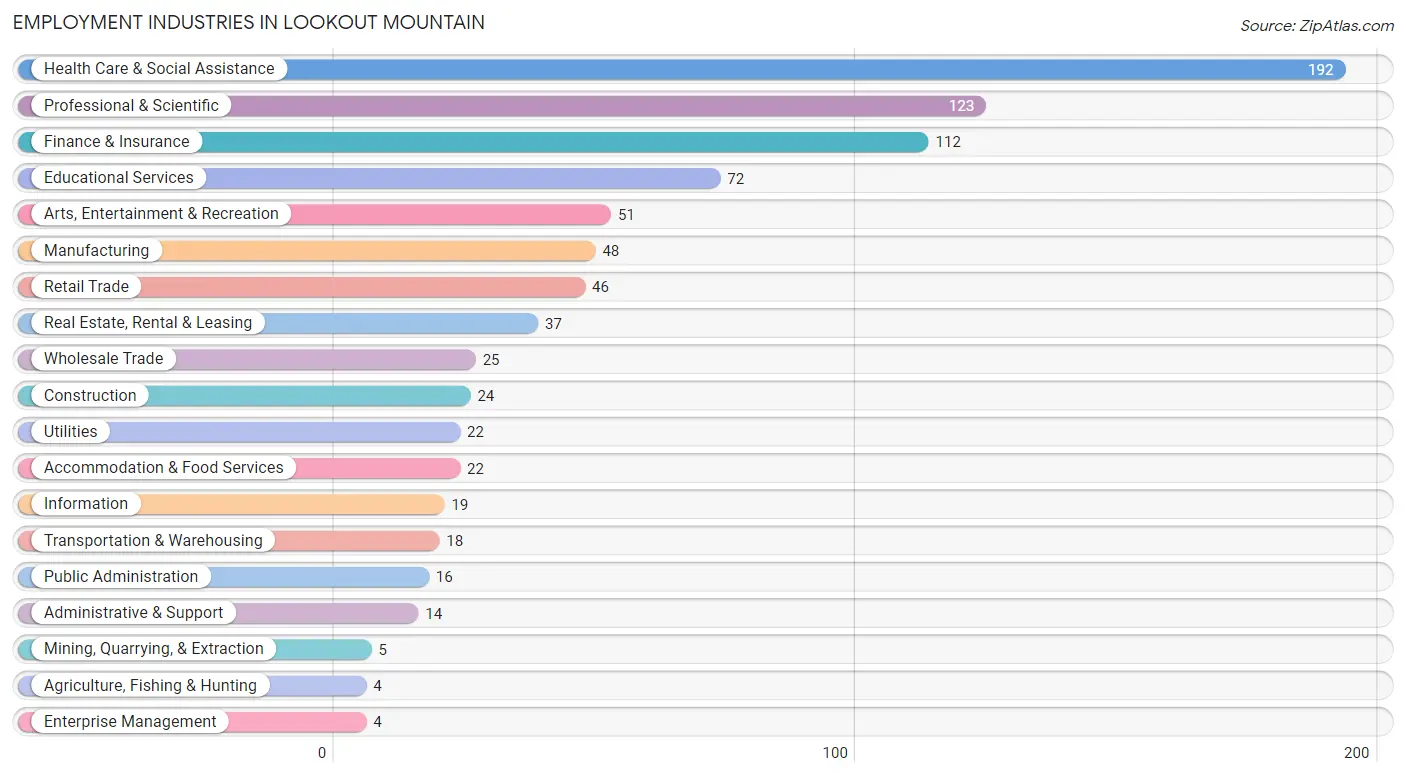
Employment Industries in Lookout Mountain
The major employment industries in Lookout Mountain include Health Care & Social Assistance (192 | 21.9%), Professional & Scientific (123 | 14.1%), Finance & Insurance (112 | 12.8%), Educational Services (72 | 8.2%), and Arts, Entertainment & Recreation (51 | 5.8%).
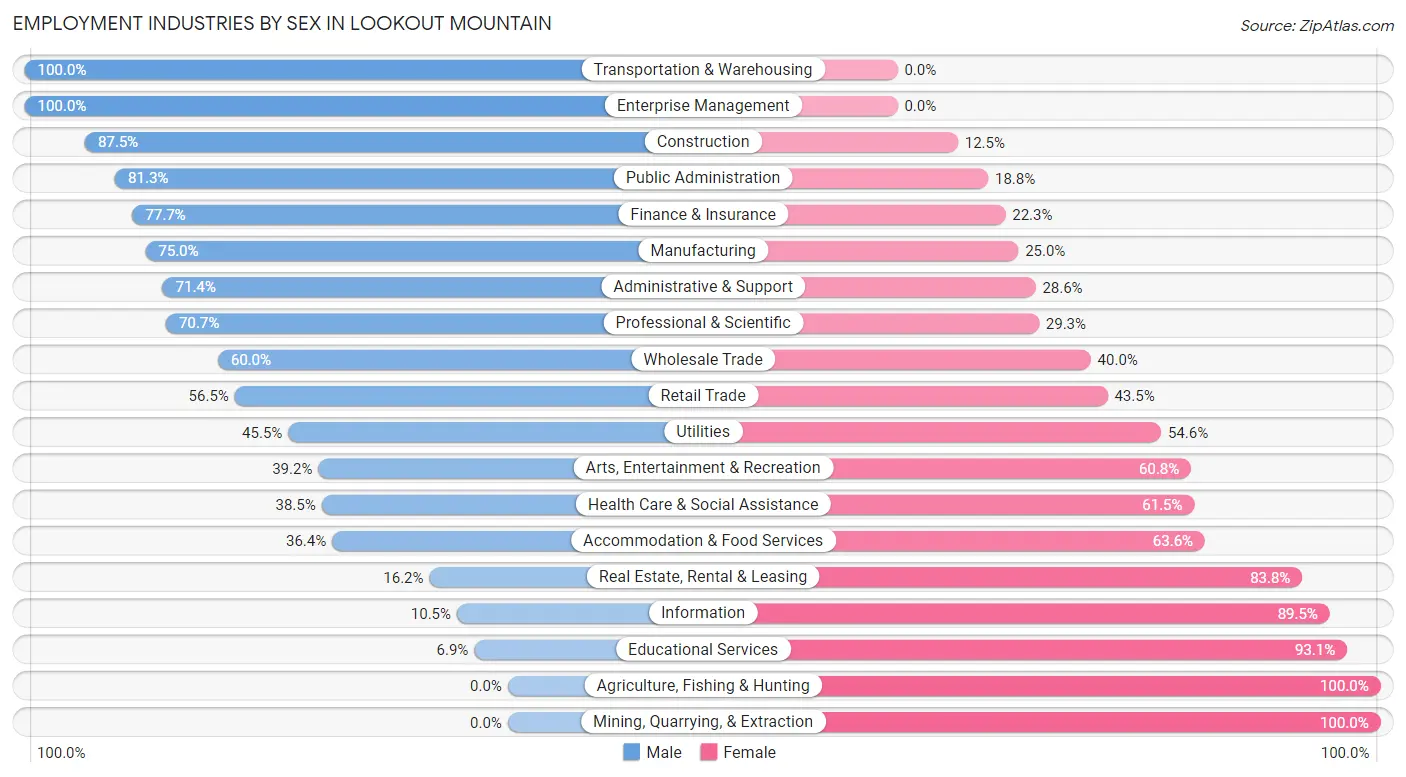
Employment Industries by Sex in Lookout Mountain
The Lookout Mountain industries that see more men than women are Transportation & Warehousing (100.0%), Enterprise Management (100.0%), and Construction (87.5%), whereas the industries that tend to have a higher number of women are Agriculture, Fishing & Hunting (100.0%), Mining, Quarrying, & Extraction (100.0%), and Educational Services (93.1%).
| Industry | Male | Female |
| Agriculture, Fishing & Hunting | 0 (0.0%) | 4 (100.0%) |
| Mining, Quarrying, & Extraction | 0 (0.0%) | 5 (100.0%) |
| Construction | 21 (87.5%) | 3 (12.5%) |
| Manufacturing | 36 (75.0%) | 12 (25.0%) |
| Wholesale Trade | 15 (60.0%) | 10 (40.0%) |
| Retail Trade | 26 (56.5%) | 20 (43.5%) |
| Transportation & Warehousing | 18 (100.0%) | 0 (0.0%) |
| Utilities | 10 (45.5%) | 12 (54.5%) |
| Information | 2 (10.5%) | 17 (89.5%) |
| Finance & Insurance | 87 (77.7%) | 25 (22.3%) |
| Real Estate, Rental & Leasing | 6 (16.2%) | 31 (83.8%) |
| Professional & Scientific | 87 (70.7%) | 36 (29.3%) |
| Enterprise Management | 4 (100.0%) | 0 (0.0%) |
| Administrative & Support | 10 (71.4%) | 4 (28.6%) |
| Educational Services | 5 (6.9%) | 67 (93.1%) |
| Health Care & Social Assistance | 74 (38.5%) | 118 (61.5%) |
| Arts, Entertainment & Recreation | 20 (39.2%) | 31 (60.8%) |
| Accommodation & Food Services | 8 (36.4%) | 14 (63.6%) |
| Public Administration | 13 (81.2%) | 3 (18.8%) |
| Total | 452 (51.7%) | 423 (48.3%) |
Education in Lookout Mountain
School Enrollment in Lookout Mountain
The most common levels of schooling among the 573 students in Lookout Mountain are middle school (155 | 27.1%), high school (131 | 22.9%), and elementary school (113 | 19.7%).
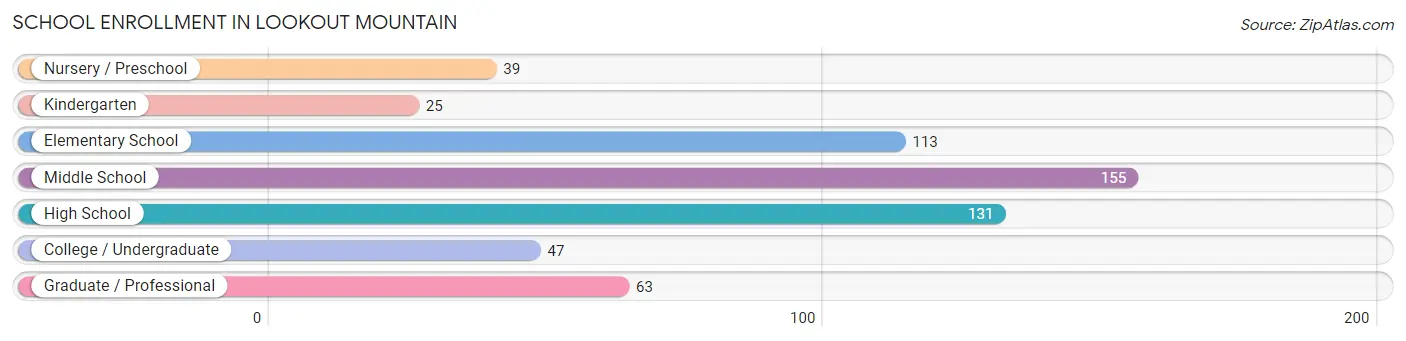
| School Level | # Students | % Students |
| Nursery / Preschool | 39 | 6.8% |
| Kindergarten | 25 | 4.4% |
| Elementary School | 113 | 19.7% |
| Middle School | 155 | 27.1% |
| High School | 131 | 22.9% |
| College / Undergraduate | 47 | 8.2% |
| Graduate / Professional | 63 | 11.0% |
| Total | 573 | 100.0% |
School Enrollment by Age by Funding Source in Lookout Mountain
Out of a total of 573 students who are enrolled in schools in Lookout Mountain, 344 (60.0%) attend a private institution, while the remaining 229 (40.0%) are enrolled in public schools. The age group of 15 to 17 year olds has the highest likelihood of being enrolled in private schools, with 93 (94.9% in the age bracket) enrolled. Conversely, the age group of 5 to 9 year old has the lowest likelihood of being enrolled in a private school, with 111 (89.5% in the age bracket) attending a public institution.
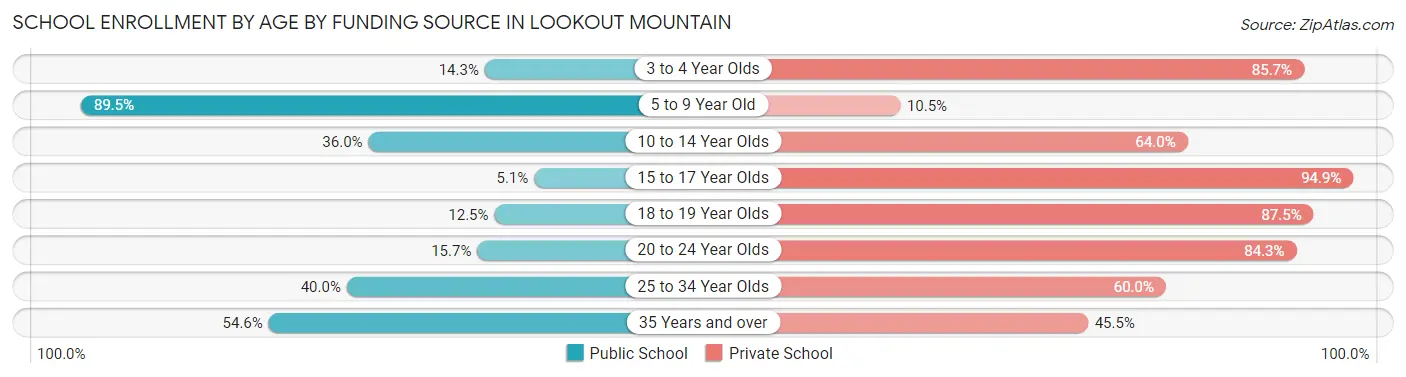
| Age Bracket | Public School | Private School |
| 3 to 4 Year Olds | 4 (14.3%) | 24 (85.7%) |
| 5 to 9 Year Old | 111 (89.5%) | 13 (10.5%) |
| 10 to 14 Year Olds | 73 (36.0%) | 130 (64.0%) |
| 15 to 17 Year Olds | 5 (5.1%) | 93 (94.9%) |
| 18 to 19 Year Olds | 2 (12.5%) | 14 (87.5%) |
| 20 to 24 Year Olds | 8 (15.7%) | 43 (84.3%) |
| 25 to 34 Year Olds | 8 (40.0%) | 12 (60.0%) |
| 35 Years and over | 18 (54.5%) | 15 (45.5%) |
| Total | 229 (40.0%) | 344 (60.0%) |
Educational Attainment by Field of Study in Lookout Mountain
Business (268 | 18.7%), social sciences (160 | 11.2%), literature & languages (136 | 9.5%), education (128 | 8.9%), and science & technology (117 | 8.2%) are the most common fields of study among 1,431 individuals in Lookout Mountain who have obtained a bachelor's degree or higher.
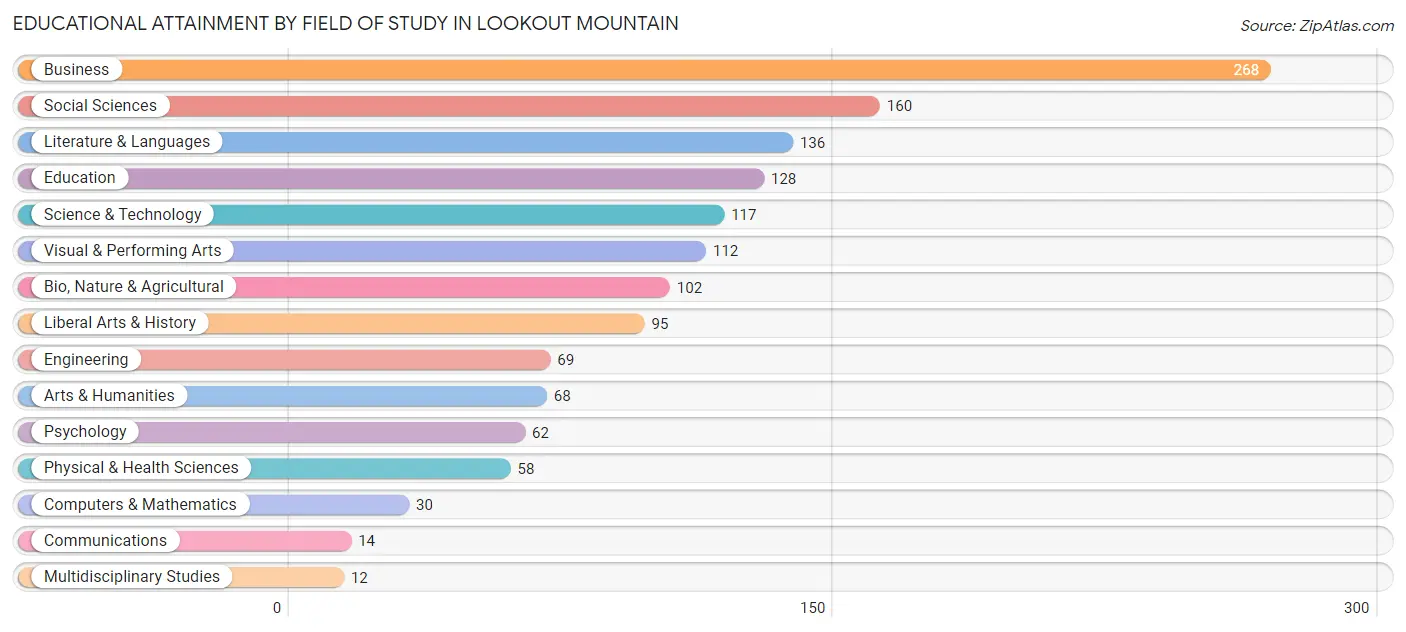
| Field of Study | # Graduates | % Graduates |
| Computers & Mathematics | 30 | 2.1% |
| Bio, Nature & Agricultural | 102 | 7.1% |
| Physical & Health Sciences | 58 | 4.1% |
| Psychology | 62 | 4.3% |
| Social Sciences | 160 | 11.2% |
| Engineering | 69 | 4.8% |
| Multidisciplinary Studies | 12 | 0.8% |
| Science & Technology | 117 | 8.2% |
| Business | 268 | 18.7% |
| Education | 128 | 8.9% |
| Literature & Languages | 136 | 9.5% |
| Liberal Arts & History | 95 | 6.6% |
| Visual & Performing Arts | 112 | 7.8% |
| Communications | 14 | 1.0% |
| Arts & Humanities | 68 | 4.8% |
| Total | 1,431 | 100.0% |
Transportation & Commute in Lookout Mountain
Vehicle Availability by Sex in Lookout Mountain
The most prevalent vehicle ownership categories in Lookout Mountain are males with 2 vehicles (228, accounting for 50.4%) and females with 2 vehicles (180, making up 54.3%).
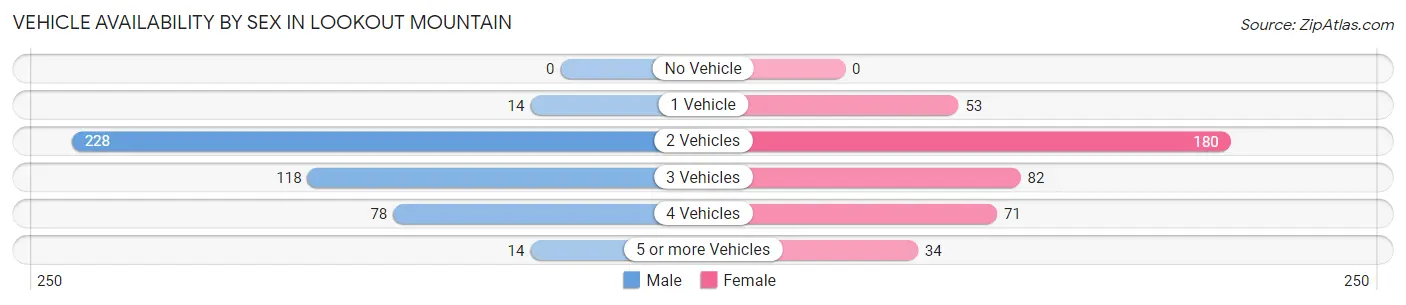
| Vehicles Available | Male | Female |
| No Vehicle | 0 (0.0%) | 0 (0.0%) |
| 1 Vehicle | 14 (3.1%) | 53 (12.6%) |
| 2 Vehicles | 228 (50.4%) | 180 (42.9%) |
| 3 Vehicles | 118 (26.1%) | 82 (19.5%) |
| 4 Vehicles | 78 (17.3%) | 71 (16.9%) |
| 5 or more Vehicles | 14 (3.1%) | 34 (8.1%) |
| Total | 452 (100.0%) | 420 (100.0%) |
Commute Time in Lookout Mountain
The most frequently occuring commute durations in Lookout Mountain are 20 to 24 minutes (210 commuters, 28.3%), 15 to 19 minutes (194 commuters, 26.1%), and 25 to 29 minutes (87 commuters, 11.7%).
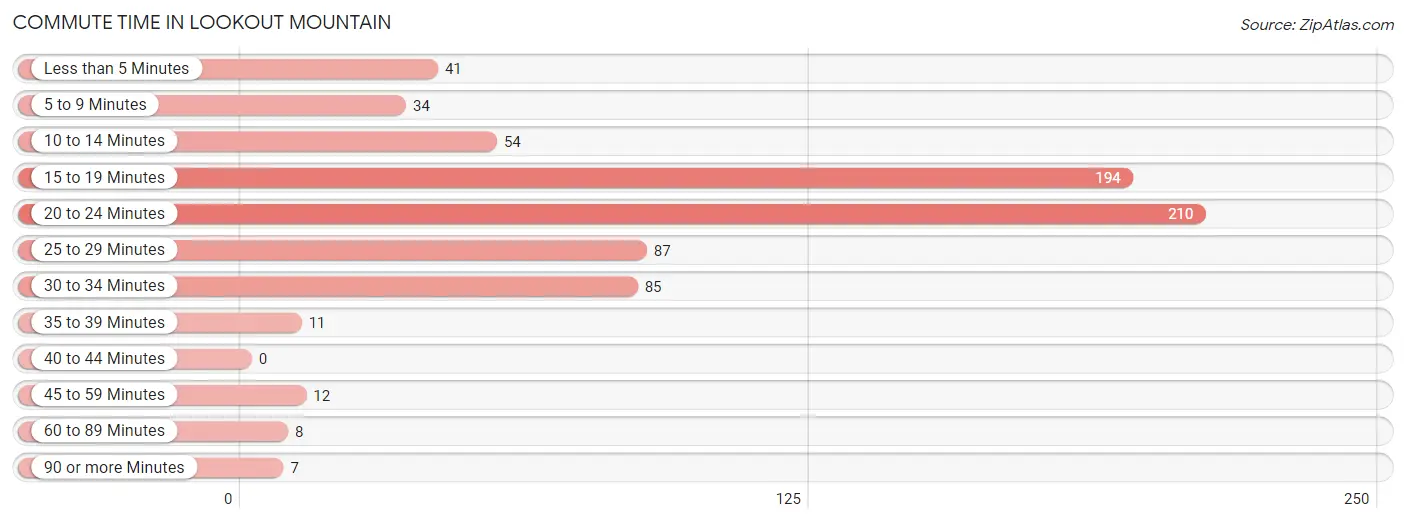
| Commute Time | # Commuters | % Commuters |
| Less than 5 Minutes | 41 | 5.5% |
| 5 to 9 Minutes | 34 | 4.6% |
| 10 to 14 Minutes | 54 | 7.3% |
| 15 to 19 Minutes | 194 | 26.1% |
| 20 to 24 Minutes | 210 | 28.3% |
| 25 to 29 Minutes | 87 | 11.7% |
| 30 to 34 Minutes | 85 | 11.4% |
| 35 to 39 Minutes | 11 | 1.5% |
| 40 to 44 Minutes | 0 | 0.0% |
| 45 to 59 Minutes | 12 | 1.6% |
| 60 to 89 Minutes | 8 | 1.1% |
| 90 or more Minutes | 7 | 0.9% |
Commute Time by Sex in Lookout Mountain
The most common commute times in Lookout Mountain are 15 to 19 minutes (131 commuters, 32.7%) for males and 20 to 24 minutes (103 commuters, 30.1%) for females.
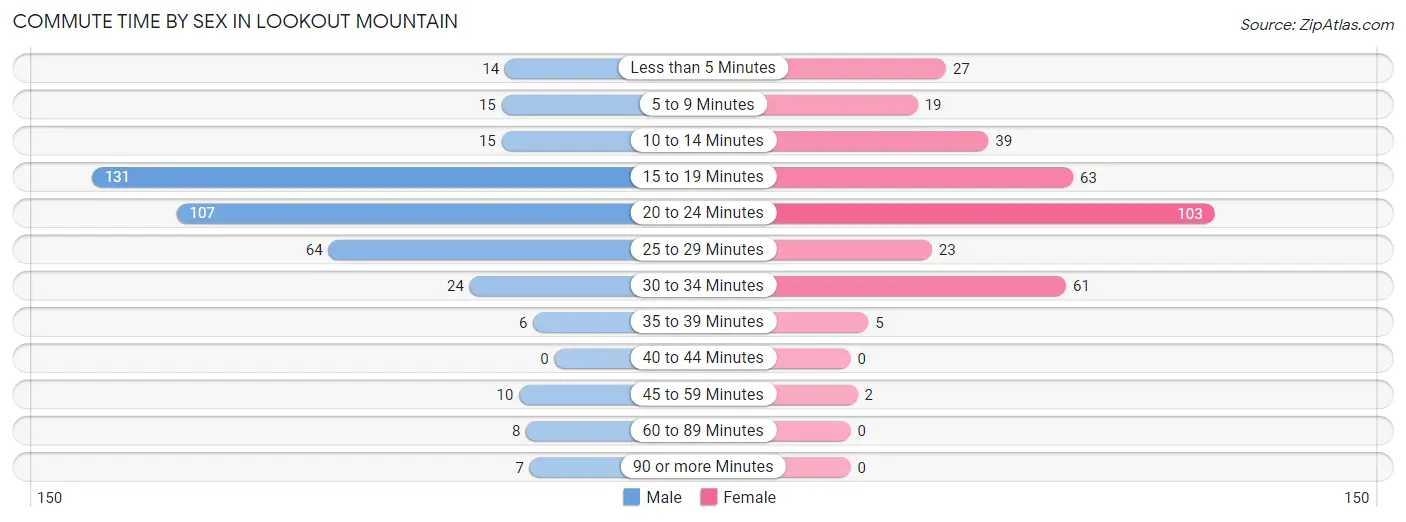
| Commute Time | Male | Female |
| Less than 5 Minutes | 14 (3.5%) | 27 (7.9%) |
| 5 to 9 Minutes | 15 (3.7%) | 19 (5.6%) |
| 10 to 14 Minutes | 15 (3.7%) | 39 (11.4%) |
| 15 to 19 Minutes | 131 (32.7%) | 63 (18.4%) |
| 20 to 24 Minutes | 107 (26.7%) | 103 (30.1%) |
| 25 to 29 Minutes | 64 (16.0%) | 23 (6.7%) |
| 30 to 34 Minutes | 24 (6.0%) | 61 (17.8%) |
| 35 to 39 Minutes | 6 (1.5%) | 5 (1.5%) |
| 40 to 44 Minutes | 0 (0.0%) | 0 (0.0%) |
| 45 to 59 Minutes | 10 (2.5%) | 2 (0.6%) |
| 60 to 89 Minutes | 8 (2.0%) | 0 (0.0%) |
| 90 or more Minutes | 7 (1.8%) | 0 (0.0%) |
Time of Departure to Work by Sex in Lookout Mountain
The most frequent times of departure to work in Lookout Mountain are 7:30 AM to 7:59 AM (101, 25.2%) for males and 7:30 AM to 7:59 AM (65, 19.0%) for females.
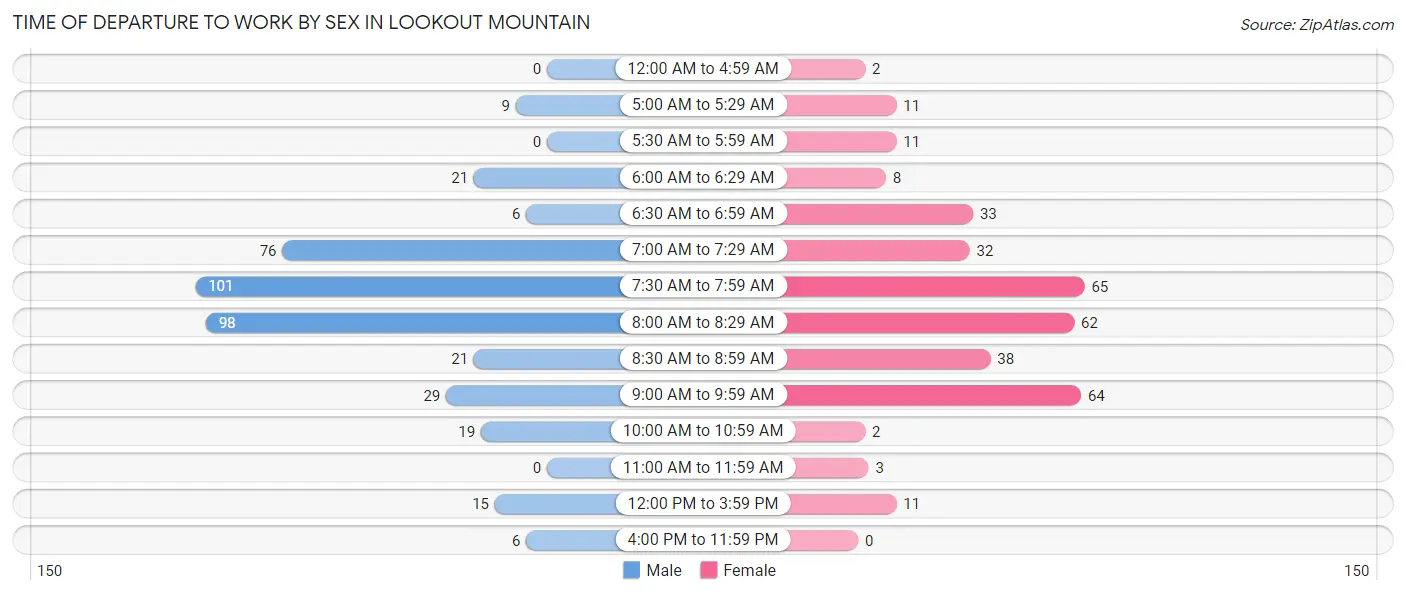
| Time of Departure | Male | Female |
| 12:00 AM to 4:59 AM | 0 (0.0%) | 2 (0.6%) |
| 5:00 AM to 5:29 AM | 9 (2.2%) | 11 (3.2%) |
| 5:30 AM to 5:59 AM | 0 (0.0%) | 11 (3.2%) |
| 6:00 AM to 6:29 AM | 21 (5.2%) | 8 (2.3%) |
| 6:30 AM to 6:59 AM | 6 (1.5%) | 33 (9.7%) |
| 7:00 AM to 7:29 AM | 76 (19.0%) | 32 (9.4%) |
| 7:30 AM to 7:59 AM | 101 (25.2%) | 65 (19.0%) |
| 8:00 AM to 8:29 AM | 98 (24.4%) | 62 (18.1%) |
| 8:30 AM to 8:59 AM | 21 (5.2%) | 38 (11.1%) |
| 9:00 AM to 9:59 AM | 29 (7.2%) | 64 (18.7%) |
| 10:00 AM to 10:59 AM | 19 (4.7%) | 2 (0.6%) |
| 11:00 AM to 11:59 AM | 0 (0.0%) | 3 (0.9%) |
| 12:00 PM to 3:59 PM | 15 (3.7%) | 11 (3.2%) |
| 4:00 PM to 11:59 PM | 6 (1.5%) | 0 (0.0%) |
| Total | 401 (100.0%) | 342 (100.0%) |
Housing Occupancy in Lookout Mountain
Occupancy by Ownership in Lookout Mountain
Of the total 801 dwellings in Lookout Mountain, owner-occupied units account for 743 (92.8%), while renter-occupied units make up 58 (7.2%).
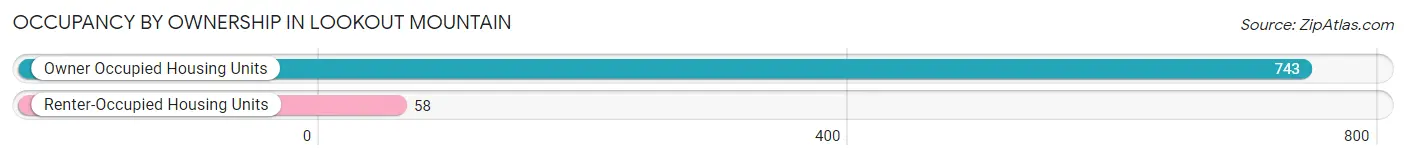
| Occupancy | # Housing Units | % Housing Units |
| Owner Occupied Housing Units | 743 | 92.8% |
| Renter-Occupied Housing Units | 58 | 7.2% |
| Total Occupied Housing Units | 801 | 100.0% |
Occupancy by Household Size in Lookout Mountain
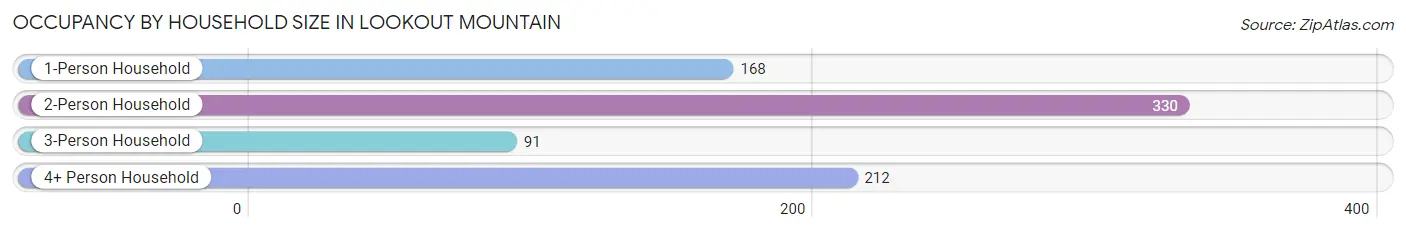
| Household Size | # Housing Units | % Housing Units |
| 1-Person Household | 168 | 21.0% |
| 2-Person Household | 330 | 41.2% |
| 3-Person Household | 91 | 11.4% |
| 4+ Person Household | 212 | 26.5% |
| Total Housing Units | 801 | 100.0% |
Occupancy by Ownership by Household Size in Lookout Mountain
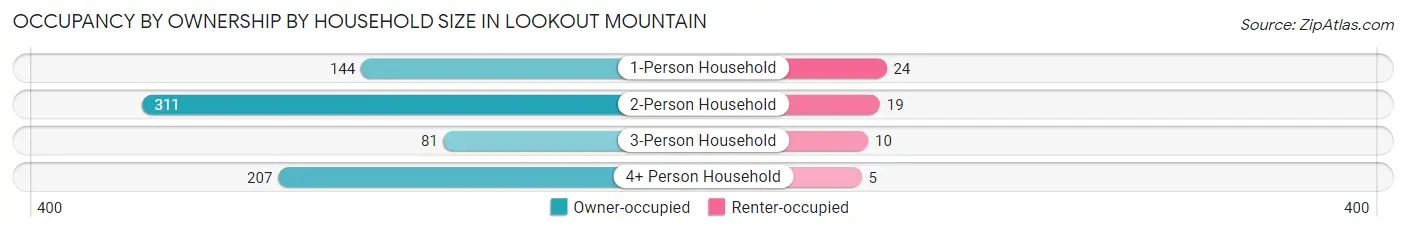
| Household Size | Owner-occupied | Renter-occupied |
| 1-Person Household | 144 (85.7%) | 24 (14.3%) |
| 2-Person Household | 311 (94.2%) | 19 (5.8%) |
| 3-Person Household | 81 (89.0%) | 10 (11.0%) |
| 4+ Person Household | 207 (97.6%) | 5 (2.4%) |
| Total Housing Units | 743 (92.8%) | 58 (7.2%) |
Occupancy by Educational Attainment in Lookout Mountain
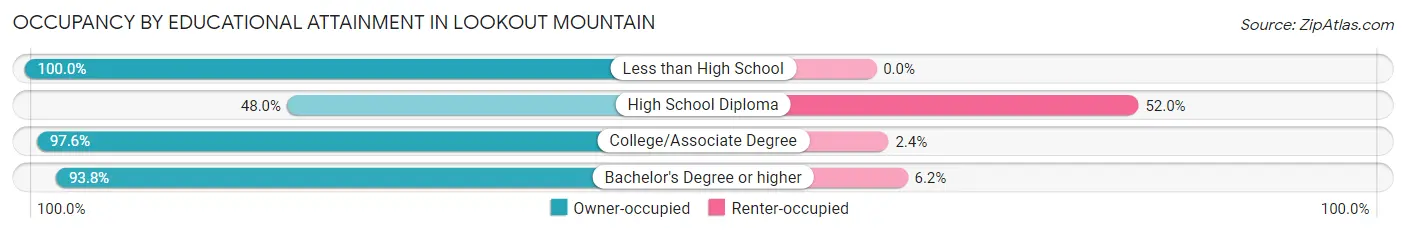
| Household Size | Owner-occupied | Renter-occupied |
| Less than High School | 3 (100.0%) | 0 (0.0%) |
| High School Diploma | 12 (48.0%) | 13 (52.0%) |
| College/Associate Degree | 80 (97.6%) | 2 (2.4%) |
| Bachelor's Degree or higher | 648 (93.8%) | 43 (6.2%) |
Occupancy by Age of Householder in Lookout Mountain
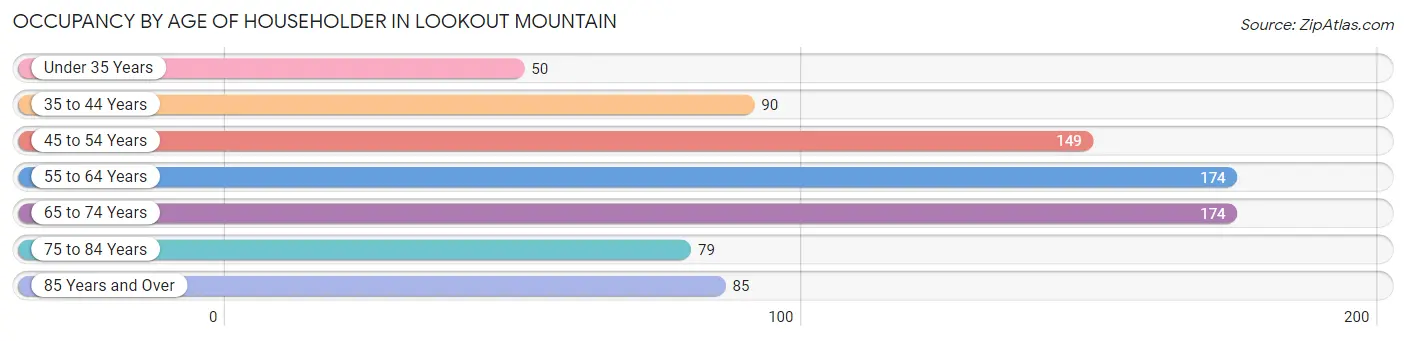
| Age Bracket | # Households | % Households |
| Under 35 Years | 50 | 6.2% |
| 35 to 44 Years | 90 | 11.2% |
| 45 to 54 Years | 149 | 18.6% |
| 55 to 64 Years | 174 | 21.7% |
| 65 to 74 Years | 174 | 21.7% |
| 75 to 84 Years | 79 | 9.9% |
| 85 Years and Over | 85 | 10.6% |
| Total | 801 | 100.0% |
Housing Finances in Lookout Mountain
Median Income by Occupancy in Lookout Mountain
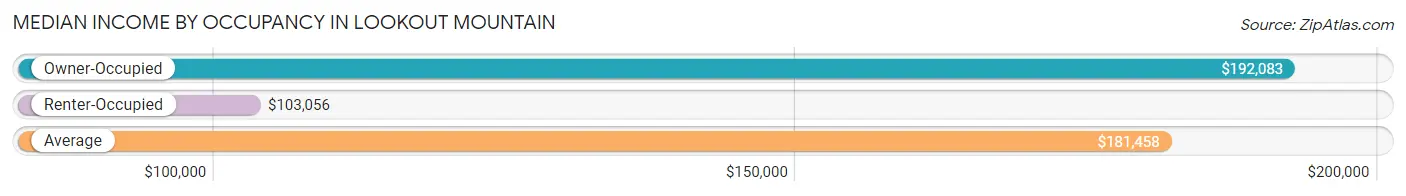
| Occupancy Type | # Households | Median Income |
| Owner-Occupied | 743 (92.8%) | $192,083 |
| Renter-Occupied | 58 (7.2%) | $103,056 |
| Average | 801 (100.0%) | $181,458 |
Occupancy by Householder Income Bracket in Lookout Mountain
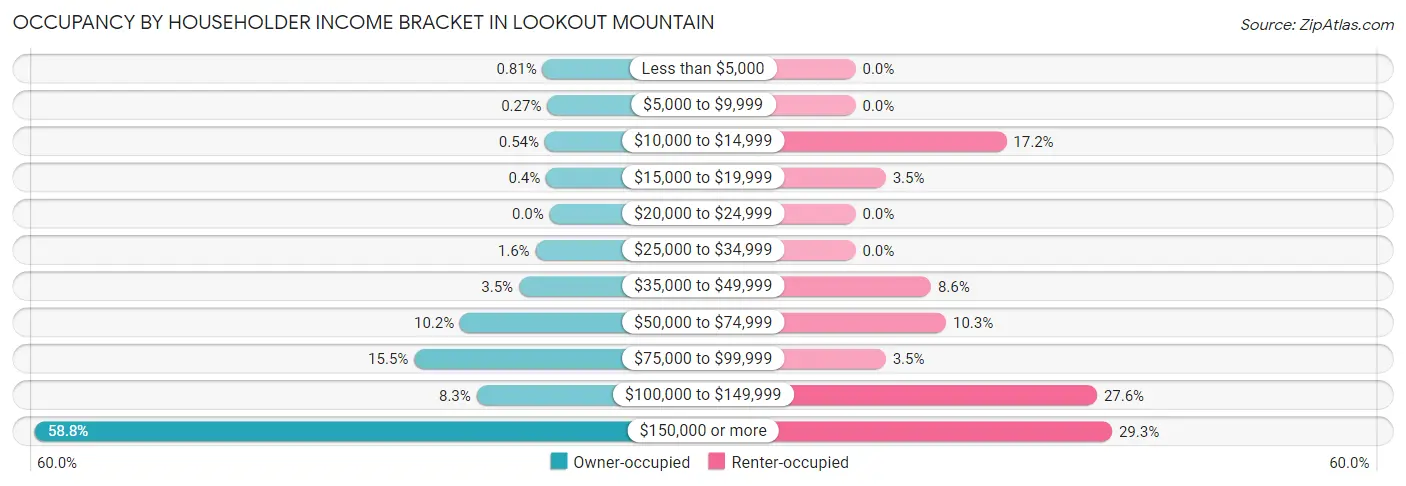
| Income Bracket | Owner-occupied | Renter-occupied |
| Less than $5,000 | 6 (0.8%) | 0 (0.0%) |
| $5,000 to $9,999 | 2 (0.3%) | 0 (0.0%) |
| $10,000 to $14,999 | 4 (0.5%) | 10 (17.2%) |
| $15,000 to $19,999 | 3 (0.4%) | 2 (3.5%) |
| $20,000 to $24,999 | 0 (0.0%) | 0 (0.0%) |
| $25,000 to $34,999 | 12 (1.6%) | 0 (0.0%) |
| $35,000 to $49,999 | 26 (3.5%) | 5 (8.6%) |
| $50,000 to $74,999 | 76 (10.2%) | 6 (10.3%) |
| $75,000 to $99,999 | 115 (15.5%) | 2 (3.5%) |
| $100,000 to $149,999 | 62 (8.3%) | 16 (27.6%) |
| $150,000 or more | 437 (58.8%) | 17 (29.3%) |
| Total | 743 (100.0%) | 58 (100.0%) |
Monthly Housing Cost Tiers in Lookout Mountain
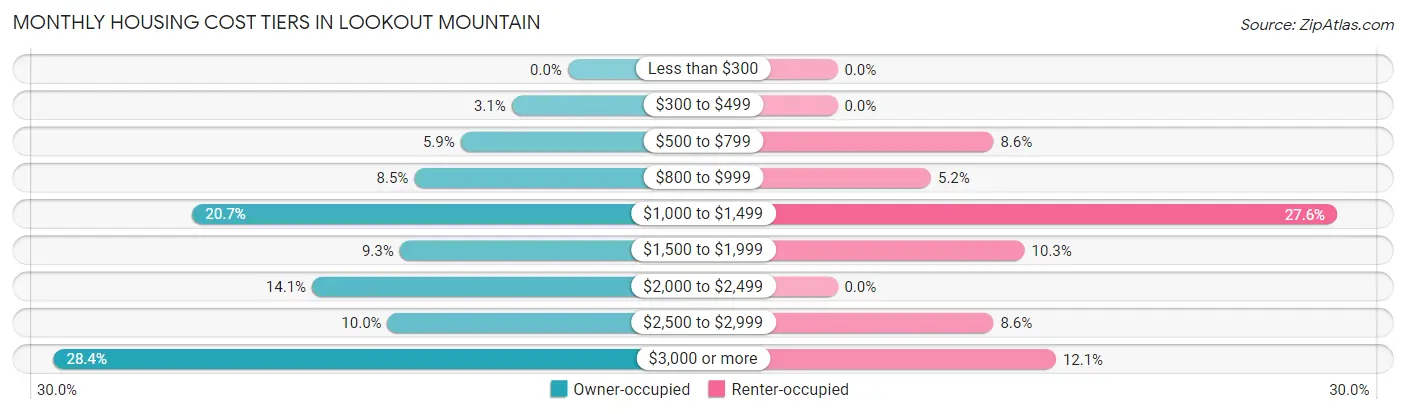
| Monthly Cost | Owner-occupied | Renter-occupied |
| Less than $300 | 0 (0.0%) | 0 (0.0%) |
| $300 to $499 | 23 (3.1%) | 0 (0.0%) |
| $500 to $799 | 44 (5.9%) | 5 (8.6%) |
| $800 to $999 | 63 (8.5%) | 3 (5.2%) |
| $1,000 to $1,499 | 154 (20.7%) | 16 (27.6%) |
| $1,500 to $1,999 | 69 (9.3%) | 6 (10.3%) |
| $2,000 to $2,499 | 105 (14.1%) | 0 (0.0%) |
| $2,500 to $2,999 | 74 (10.0%) | 5 (8.6%) |
| $3,000 or more | 211 (28.4%) | 7 (12.1%) |
| Total | 743 (100.0%) | 58 (100.0%) |
Physical Housing Characteristics in Lookout Mountain
Housing Structures in Lookout Mountain
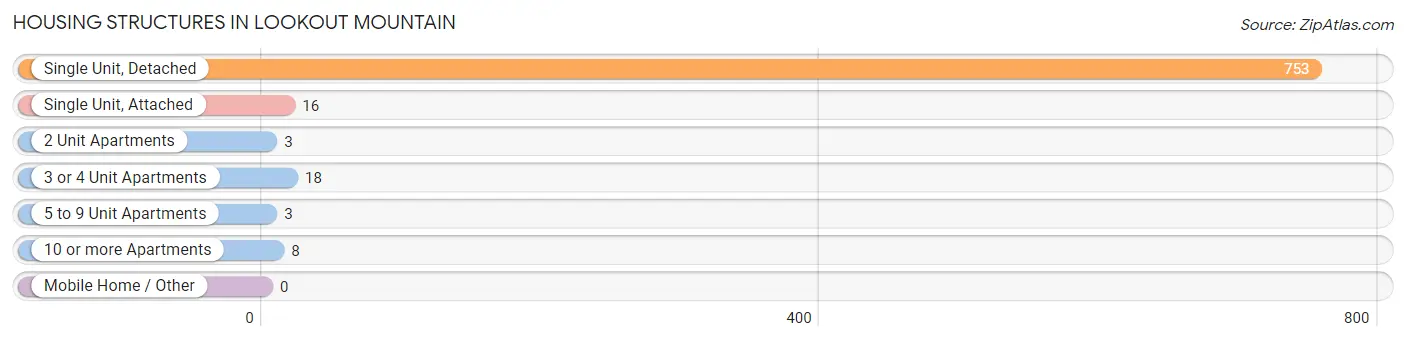
| Structure Type | # Housing Units | % Housing Units |
| Single Unit, Detached | 753 | 94.0% |
| Single Unit, Attached | 16 | 2.0% |
| 2 Unit Apartments | 3 | 0.4% |
| 3 or 4 Unit Apartments | 18 | 2.2% |
| 5 to 9 Unit Apartments | 3 | 0.4% |
| 10 or more Apartments | 8 | 1.0% |
| Mobile Home / Other | 0 | 0.0% |
| Total | 801 | 100.0% |
Housing Structures by Occupancy in Lookout Mountain
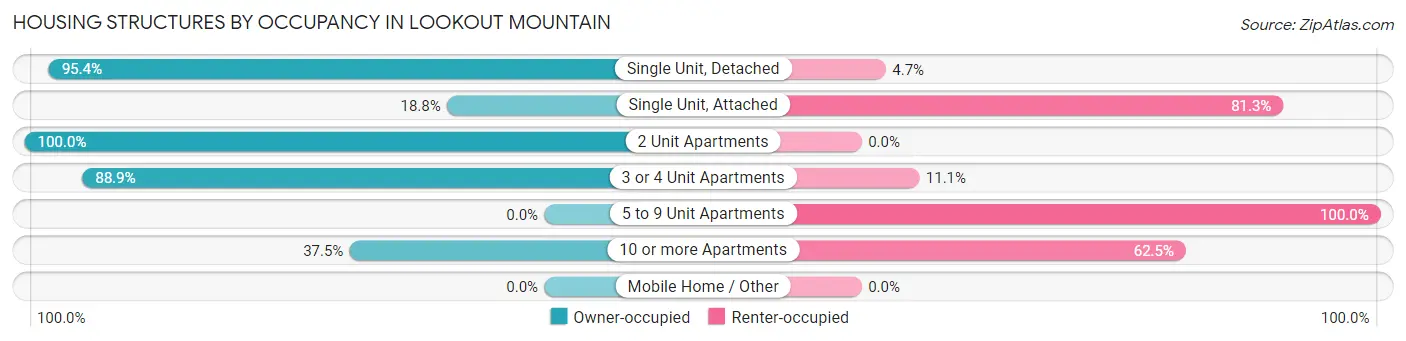
| Structure Type | Owner-occupied | Renter-occupied |
| Single Unit, Detached | 718 (95.4%) | 35 (4.6%) |
| Single Unit, Attached | 3 (18.8%) | 13 (81.2%) |
| 2 Unit Apartments | 3 (100.0%) | 0 (0.0%) |
| 3 or 4 Unit Apartments | 16 (88.9%) | 2 (11.1%) |
| 5 to 9 Unit Apartments | 0 (0.0%) | 3 (100.0%) |
| 10 or more Apartments | 3 (37.5%) | 5 (62.5%) |
| Mobile Home / Other | 0 (0.0%) | 0 (0.0%) |
| Total | 743 (92.8%) | 58 (7.2%) |
Housing Structures by Number of Rooms in Lookout Mountain
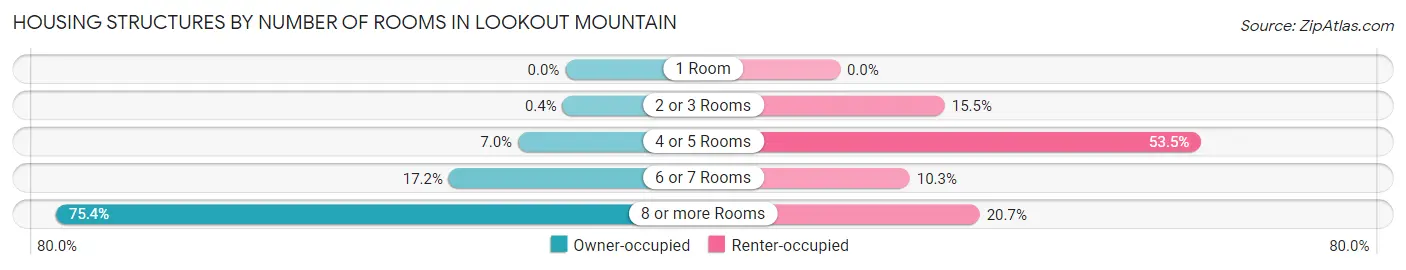
| Number of Rooms | Owner-occupied | Renter-occupied |
| 1 Room | 0 (0.0%) | 0 (0.0%) |
| 2 or 3 Rooms | 3 (0.4%) | 9 (15.5%) |
| 4 or 5 Rooms | 52 (7.0%) | 31 (53.4%) |
| 6 or 7 Rooms | 128 (17.2%) | 6 (10.3%) |
| 8 or more Rooms | 560 (75.4%) | 12 (20.7%) |
| Total | 743 (100.0%) | 58 (100.0%) |
Housing Structure by Heating Type in Lookout Mountain
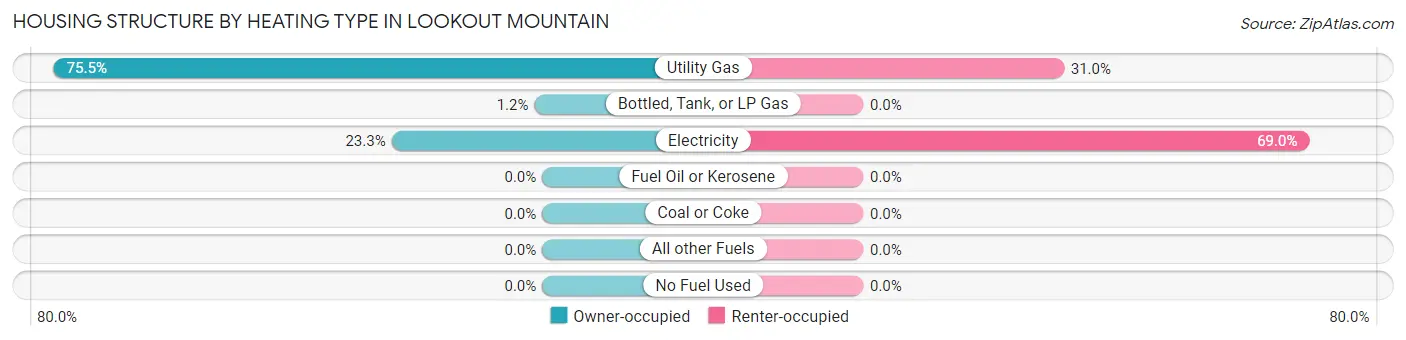
| Heating Type | Owner-occupied | Renter-occupied |
| Utility Gas | 561 (75.5%) | 18 (31.0%) |
| Bottled, Tank, or LP Gas | 9 (1.2%) | 0 (0.0%) |
| Electricity | 173 (23.3%) | 40 (69.0%) |
| Fuel Oil or Kerosene | 0 (0.0%) | 0 (0.0%) |
| Coal or Coke | 0 (0.0%) | 0 (0.0%) |
| All other Fuels | 0 (0.0%) | 0 (0.0%) |
| No Fuel Used | 0 (0.0%) | 0 (0.0%) |
| Total | 743 (100.0%) | 58 (100.0%) |
Household Vehicle Usage in Lookout Mountain
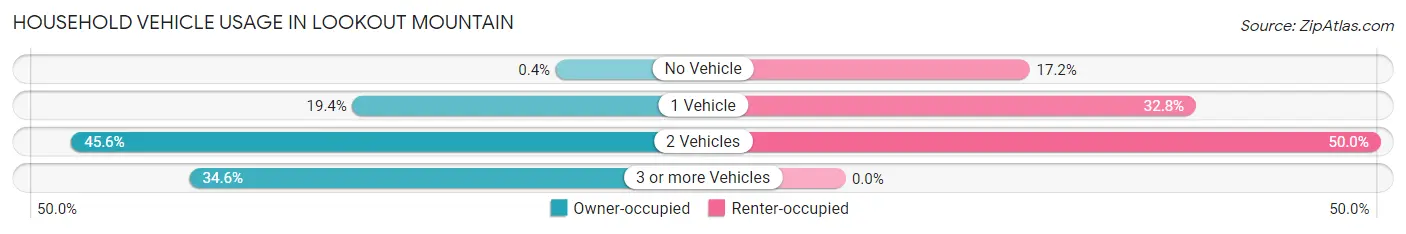
| Vehicles per Household | Owner-occupied | Renter-occupied |
| No Vehicle | 3 (0.4%) | 10 (17.2%) |
| 1 Vehicle | 144 (19.4%) | 19 (32.8%) |
| 2 Vehicles | 339 (45.6%) | 29 (50.0%) |
| 3 or more Vehicles | 257 (34.6%) | 0 (0.0%) |
| Total | 743 (100.0%) | 58 (100.0%) |
Real Estate & Mortgages in Lookout Mountain
Real Estate and Mortgage Overview in Lookout Mountain
| Characteristic | Without Mortgage | With Mortgage |
| Housing Units | 337 | 406 |
| Median Property Value | $536,800 | $823,700 |
| Median Household Income | $118,750 | $276 |
| Monthly Housing Costs | $1,218 | $197 |
| Real Estate Taxes | $6,148 | $0 |
Property Value by Mortgage Status in Lookout Mountain
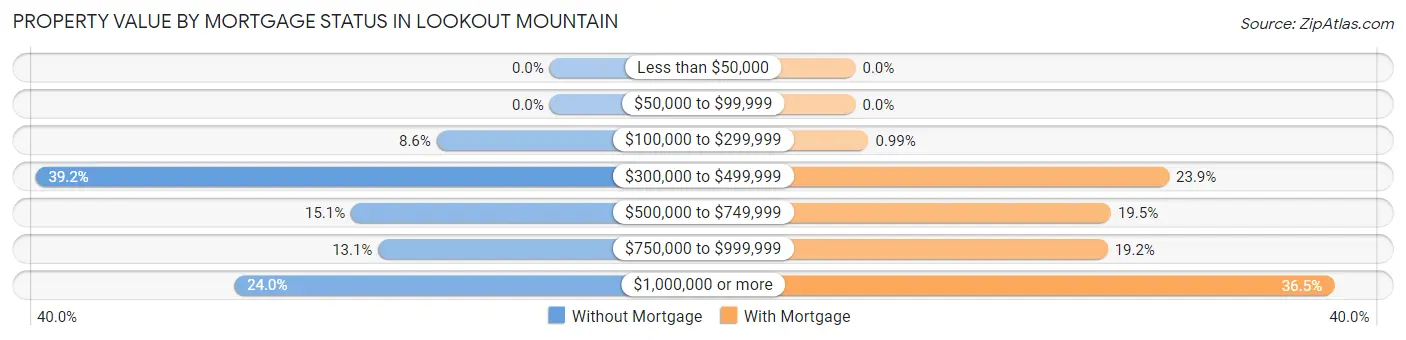
| Property Value | Without Mortgage | With Mortgage |
| Less than $50,000 | 0 (0.0%) | 0 (0.0%) |
| $50,000 to $99,999 | 0 (0.0%) | 0 (0.0%) |
| $100,000 to $299,999 | 29 (8.6%) | 4 (1.0%) |
| $300,000 to $499,999 | 132 (39.2%) | 97 (23.9%) |
| $500,000 to $749,999 | 51 (15.1%) | 79 (19.5%) |
| $750,000 to $999,999 | 44 (13.1%) | 78 (19.2%) |
| $1,000,000 or more | 81 (24.0%) | 148 (36.4%) |
| Total | 337 (100.0%) | 406 (100.0%) |
Household Income by Mortgage Status in Lookout Mountain
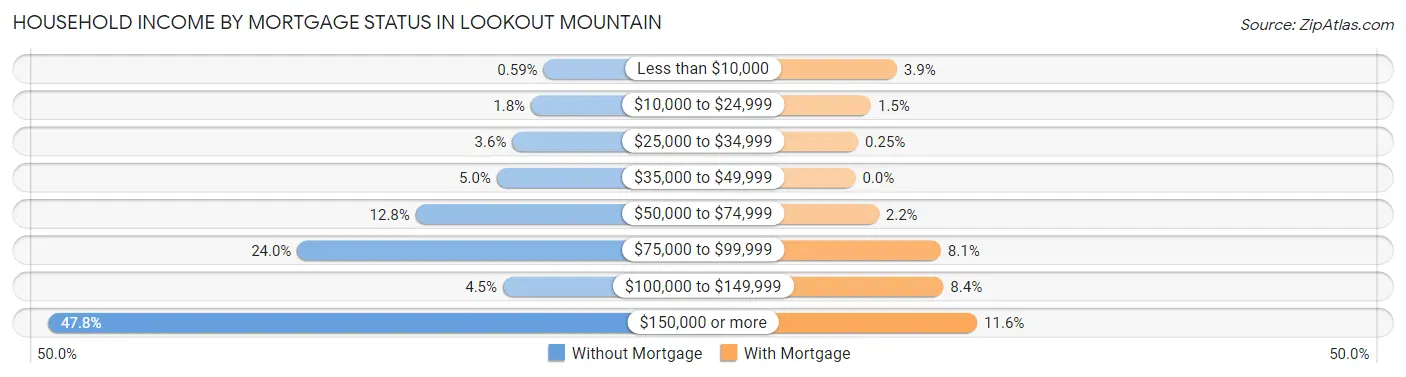
| Household Income | Without Mortgage | With Mortgage |
| Less than $10,000 | 2 (0.6%) | 16 (3.9%) |
| $10,000 to $24,999 | 6 (1.8%) | 6 (1.5%) |
| $25,000 to $34,999 | 12 (3.6%) | 1 (0.3%) |
| $35,000 to $49,999 | 17 (5.0%) | 0 (0.0%) |
| $50,000 to $74,999 | 43 (12.8%) | 9 (2.2%) |
| $75,000 to $99,999 | 81 (24.0%) | 33 (8.1%) |
| $100,000 to $149,999 | 15 (4.4%) | 34 (8.4%) |
| $150,000 or more | 161 (47.8%) | 47 (11.6%) |
| Total | 337 (100.0%) | 406 (100.0%) |
Property Value to Household Income Ratio in Lookout Mountain
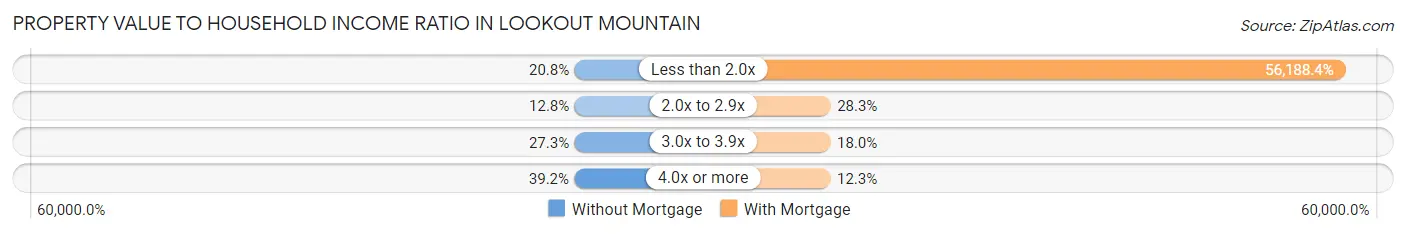
| Value-to-Income Ratio | Without Mortgage | With Mortgage |
| Less than 2.0x | 70 (20.8%) | 228,125 (56,188.4%) |
| 2.0x to 2.9x | 43 (12.8%) | 115 (28.3%) |
| 3.0x to 3.9x | 92 (27.3%) | 73 (18.0%) |
| 4.0x or more | 132 (39.2%) | 50 (12.3%) |
| Total | 337 (100.0%) | 406 (100.0%) |
Real Estate Taxes by Mortgage Status in Lookout Mountain
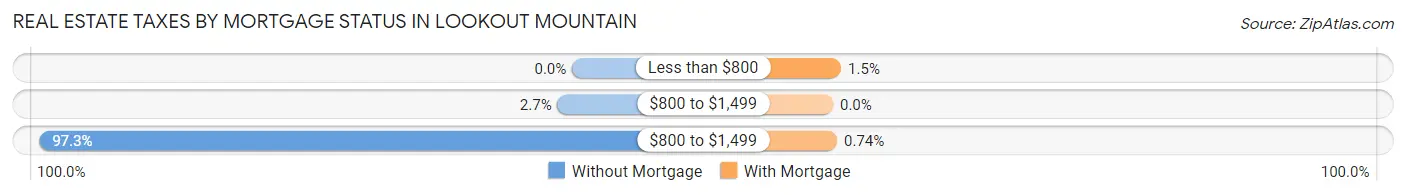
| Property Taxes | Without Mortgage | With Mortgage |
| Less than $800 | 0 (0.0%) | 6 (1.5%) |
| $800 to $1,499 | 9 (2.7%) | 0 (0.0%) |
| $800 to $1,499 | 328 (97.3%) | 3 (0.7%) |
| Total | 337 (100.0%) | 406 (100.0%) |
Health & Disability in Lookout Mountain
Health Insurance Coverage by Age in Lookout Mountain
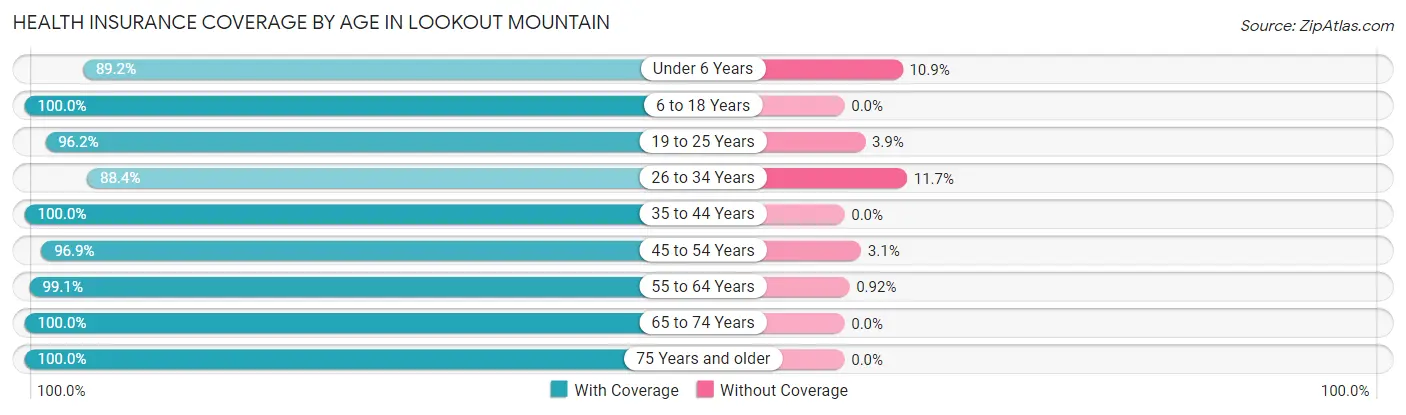
| Age Bracket | With Coverage | Without Coverage |
| Under 6 Years | 115 (89.1%) | 14 (10.8%) |
| 6 to 18 Years | 410 (100.0%) | 0 (0.0%) |
| 19 to 25 Years | 100 (96.2%) | 4 (3.8%) |
| 26 to 34 Years | 91 (88.3%) | 12 (11.7%) |
| 35 to 44 Years | 201 (100.0%) | 0 (0.0%) |
| 45 to 54 Years | 313 (96.9%) | 10 (3.1%) |
| 55 to 64 Years | 323 (99.1%) | 3 (0.9%) |
| 65 to 74 Years | 282 (100.0%) | 0 (0.0%) |
| 75 Years and older | 250 (100.0%) | 0 (0.0%) |
| Total | 2,085 (98.0%) | 43 (2.0%) |
Health Insurance Coverage by Citizenship Status in Lookout Mountain
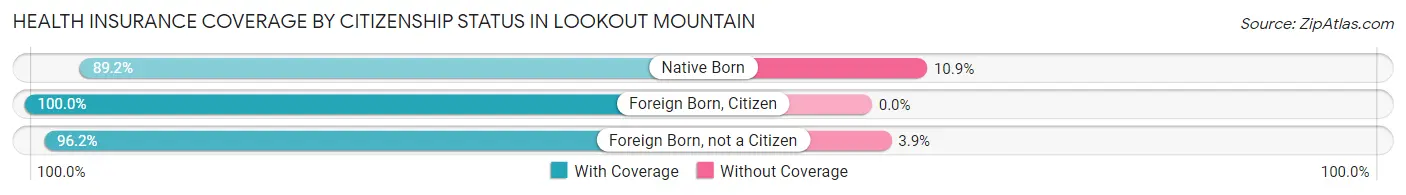
| Citizenship Status | With Coverage | Without Coverage |
| Native Born | 115 (89.1%) | 14 (10.8%) |
| Foreign Born, Citizen | 410 (100.0%) | 0 (0.0%) |
| Foreign Born, not a Citizen | 100 (96.2%) | 4 (3.8%) |
Health Insurance Coverage by Household Income in Lookout Mountain
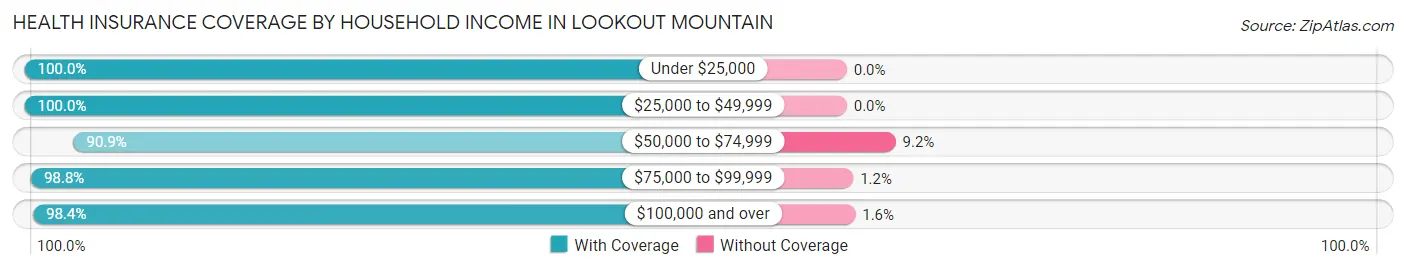
| Household Income | With Coverage | Without Coverage |
| Under $25,000 | 30 (100.0%) | 0 (0.0%) |
| $25,000 to $49,999 | 63 (100.0%) | 0 (0.0%) |
| $50,000 to $74,999 | 139 (90.8%) | 14 (9.1%) |
| $75,000 to $99,999 | 246 (98.8%) | 3 (1.2%) |
| $100,000 and over | 1,607 (98.4%) | 26 (1.6%) |
Public vs Private Health Insurance Coverage by Age in Lookout Mountain
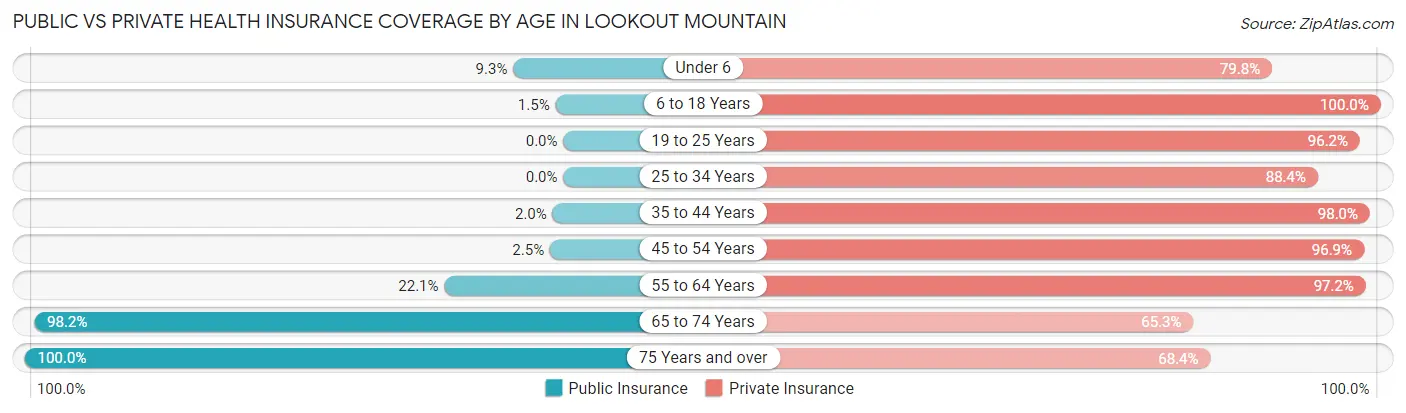
| Age Bracket | Public Insurance | Private Insurance |
| Under 6 | 12 (9.3%) | 103 (79.8%) |
| 6 to 18 Years | 6 (1.5%) | 410 (100.0%) |
| 19 to 25 Years | 0 (0.0%) | 100 (96.2%) |
| 25 to 34 Years | 0 (0.0%) | 91 (88.3%) |
| 35 to 44 Years | 4 (2.0%) | 197 (98.0%) |
| 45 to 54 Years | 8 (2.5%) | 313 (96.9%) |
| 55 to 64 Years | 72 (22.1%) | 317 (97.2%) |
| 65 to 74 Years | 277 (98.2%) | 184 (65.2%) |
| 75 Years and over | 250 (100.0%) | 171 (68.4%) |
| Total | 629 (29.6%) | 1,886 (88.6%) |
Disability Status by Sex by Age in Lookout Mountain
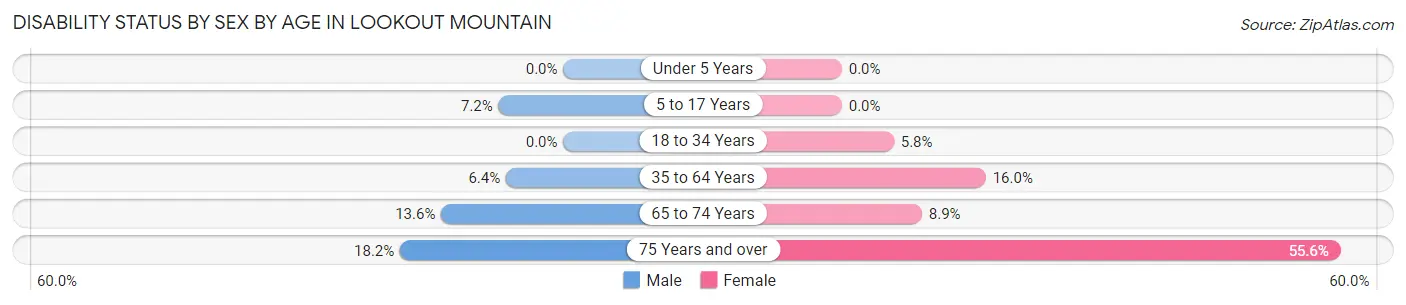
| Age Bracket | Male | Female |
| Under 5 Years | 0 (0.0%) | 0 (0.0%) |
| 5 to 17 Years | 16 (7.2%) | 0 (0.0%) |
| 18 to 34 Years | 0 (0.0%) | 7 (5.8%) |
| 35 to 64 Years | 24 (6.4%) | 76 (16.0%) |
| 65 to 74 Years | 17 (13.6%) | 14 (8.9%) |
| 75 Years and over | 16 (18.2%) | 90 (55.6%) |
Disability Class by Sex by Age in Lookout Mountain
Disability Class: Hearing Difficulty
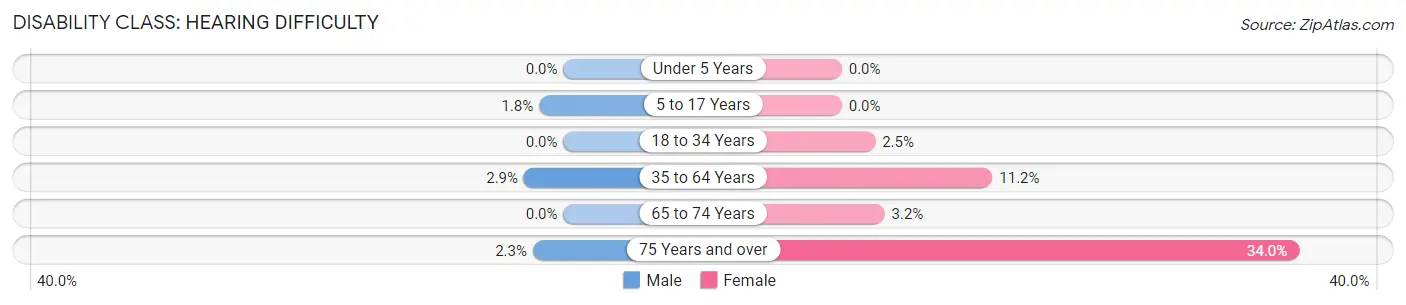
| Age Bracket | Male | Female |
| Under 5 Years | 0 (0.0%) | 0 (0.0%) |
| 5 to 17 Years | 4 (1.8%) | 0 (0.0%) |
| 18 to 34 Years | 0 (0.0%) | 3 (2.5%) |
| 35 to 64 Years | 11 (2.9%) | 53 (11.2%) |
| 65 to 74 Years | 0 (0.0%) | 5 (3.2%) |
| 75 Years and over | 2 (2.3%) | 55 (34.0%) |
Disability Class: Vision Difficulty
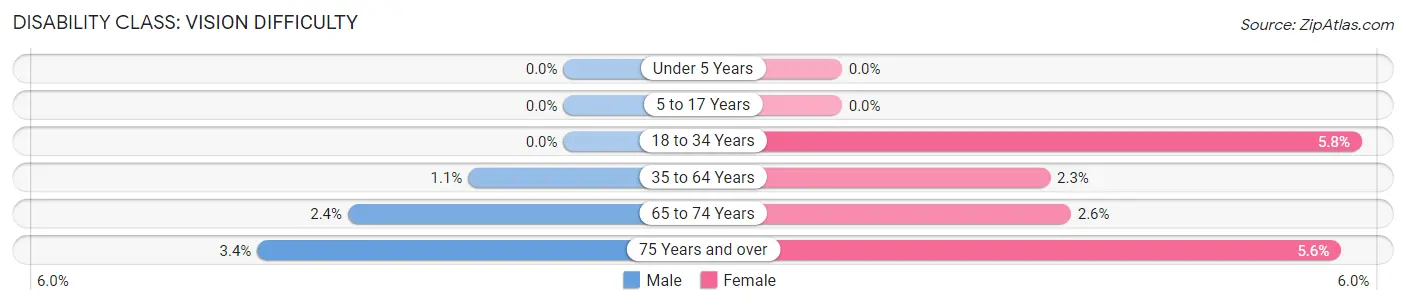
| Age Bracket | Male | Female |
| Under 5 Years | 0 (0.0%) | 0 (0.0%) |
| 5 to 17 Years | 0 (0.0%) | 0 (0.0%) |
| 18 to 34 Years | 0 (0.0%) | 7 (5.8%) |
| 35 to 64 Years | 4 (1.1%) | 11 (2.3%) |
| 65 to 74 Years | 3 (2.4%) | 4 (2.5%) |
| 75 Years and over | 3 (3.4%) | 9 (5.6%) |
Disability Class: Cognitive Difficulty
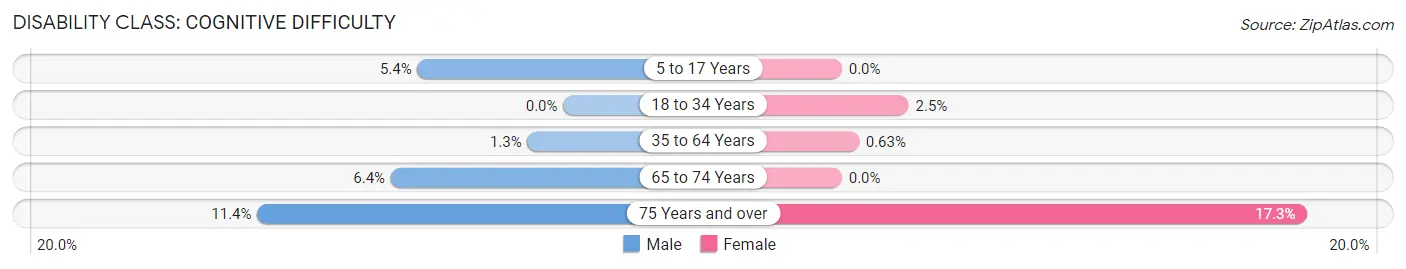
| Age Bracket | Male | Female |
| 5 to 17 Years | 12 (5.4%) | 0 (0.0%) |
| 18 to 34 Years | 0 (0.0%) | 3 (2.5%) |
| 35 to 64 Years | 5 (1.3%) | 3 (0.6%) |
| 65 to 74 Years | 8 (6.4%) | 0 (0.0%) |
| 75 Years and over | 10 (11.4%) | 28 (17.3%) |
Disability Class: Ambulatory Difficulty
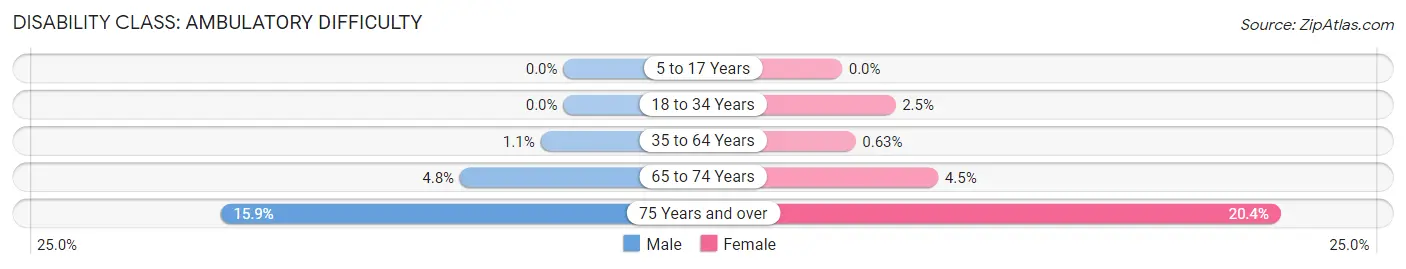
| Age Bracket | Male | Female |
| 5 to 17 Years | 0 (0.0%) | 0 (0.0%) |
| 18 to 34 Years | 0 (0.0%) | 3 (2.5%) |
| 35 to 64 Years | 4 (1.1%) | 3 (0.6%) |
| 65 to 74 Years | 6 (4.8%) | 7 (4.5%) |
| 75 Years and over | 14 (15.9%) | 33 (20.4%) |
Disability Class: Self-Care Difficulty
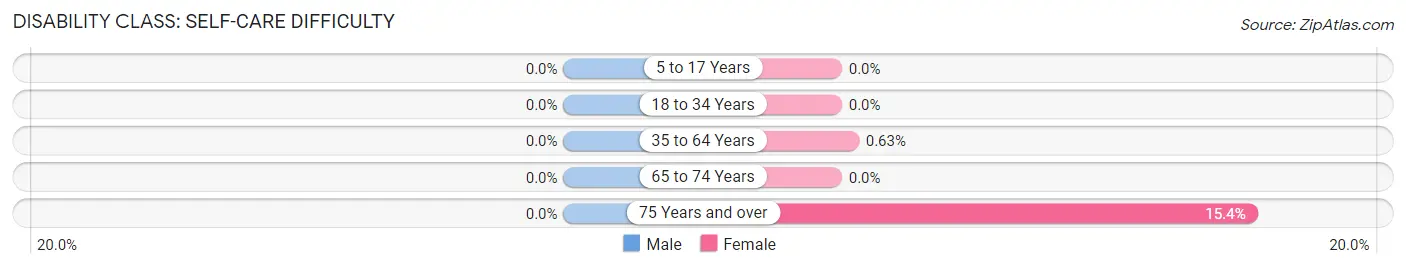
| Age Bracket | Male | Female |
| 5 to 17 Years | 0 (0.0%) | 0 (0.0%) |
| 18 to 34 Years | 0 (0.0%) | 0 (0.0%) |
| 35 to 64 Years | 0 (0.0%) | 3 (0.6%) |
| 65 to 74 Years | 0 (0.0%) | 0 (0.0%) |
| 75 Years and over | 0 (0.0%) | 25 (15.4%) |
Technology Access in Lookout Mountain
Computing Device Access in Lookout Mountain
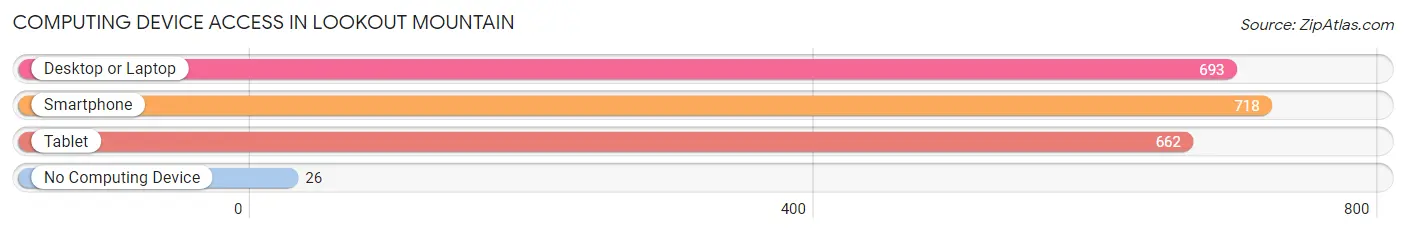
| Device Type | # Households | % Households |
| Desktop or Laptop | 693 | 86.5% |
| Smartphone | 718 | 89.6% |
| Tablet | 662 | 82.7% |
| No Computing Device | 26 | 3.3% |
| Total | 801 | 100.0% |
Internet Access in Lookout Mountain
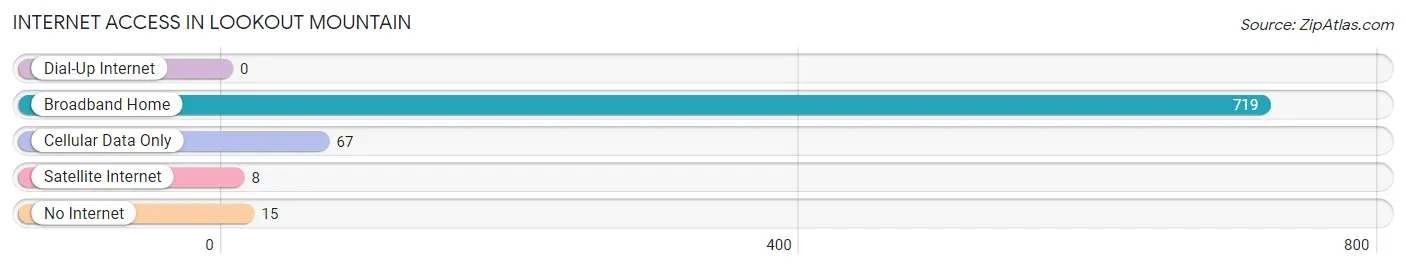
| Internet Type | # Households | % Households |
| Dial-Up Internet | 0 | 0.0% |
| Broadband Home | 719 | 89.8% |
| Cellular Data Only | 67 | 8.4% |
| Satellite Internet | 8 | 1.0% |
| No Internet | 15 | 1.9% |
| Total | 801 | 100.0% |
Lookout Mountain Summary
Lookout Mountain is a small town located in Hamilton County, Tennessee, United States. It is situated on the western side of the Cumberland Plateau, just south of Chattanooga. The town is known for its scenic views of the Tennessee River and the surrounding mountains. It is also home to the Lookout Mountain Incline Railway, the world's steepest passenger railway.
History
The area that is now Lookout Mountain was first inhabited by the Cherokee and Creek Native American tribes. The first European settlers arrived in the area in the late 1700s. The town was originally known as "Point Lookout" and was established in 1838. It was named after the nearby Lookout Mountain, which was used as a lookout point by the Native Americans.
In the late 1800s, Lookout Mountain became a popular tourist destination. The Lookout Mountain Incline Railway was built in 1895 and is still in operation today. The railway is the world's steepest passenger railway and is a popular tourist attraction.
In the early 1900s, Lookout Mountain became a popular summer resort for wealthy families from the South. The town was also home to a number of famous people, including the author F. Scott Fitzgerald and the singer Elvis Presley.
Geography
Lookout Mountain is located in Hamilton County, Tennessee, United States. It is situated on the western side of the Cumberland Plateau, just south of Chattanooga. The town is surrounded by the Lookout Mountain National Military Park, which was established in 1890. The park is home to a number of historic sites, including the Cravens House, the Point Park Civil War Museum, and the Lookout Mountain Battlefield.
The town is located at an elevation of 1,890 feet (576 m) above sea level. The climate is humid subtropical, with hot summers and mild winters. The average annual temperature is 61°F (16°C).
Economy
The economy of Lookout Mountain is largely based on tourism. The town is home to a number of attractions, including the Lookout Mountain Incline Railway, the Point Park Civil War Museum, and the Lookout Mountain Battlefield. The town is also home to a number of restaurants, shops, and other businesses.
Demographics
As of the 2010 census, the population of Lookout Mountain was 1,832. The racial makeup of the town was 95.3% White, 1.2% African American, 0.3% Native American, 0.7% Asian, 0.1% Pacific Islander, 0.7% from other races, and 1.9% from two or more races. Hispanic or Latino of any race were 2.2% of the population.
The median income for a household in Lookout Mountain was $50,000, and the median income for a family was $60,000. The per capita income for the town was $25,000. About 8.3% of families and 10.2% of the population were below the poverty line, including 14.3% of those under age 18 and 5.2% of those age 65 or over.
Common Questions
What is Per Capita Income in Lookout Mountain?
Per Capita income in Lookout Mountain is $110,591.
What is the Median Family Income in Lookout Mountain?
Median Family Income in Lookout Mountain is $228,478.
What is the Median Household income in Lookout Mountain?
Median Household Income in Lookout Mountain is $181,458.
What is Income or Wage Gap in Lookout Mountain?
Income or Wage Gap in Lookout Mountain is 69.9%.
Women in Lookout Mountain earn 30.1 cents for every dollar earned by a man.
What is Inequality or Gini Index in Lookout Mountain?
Inequality or Gini Index in Lookout Mountain is 0.51.
What is the Total Population of Lookout Mountain?
Total Population of Lookout Mountain is 2,128.
What is the Total Male Population of Lookout Mountain?
Total Male Population of Lookout Mountain is 951.
What is the Total Female Population of Lookout Mountain?
Total Female Population of Lookout Mountain is 1,177.
What is the Ratio of Males per 100 Females in Lookout Mountain?
There are 80.80 Males per 100 Females in Lookout Mountain.
What is the Ratio of Females per 100 Males in Lookout Mountain?
There are 123.76 Females per 100 Males in Lookout Mountain.
What is the Median Population Age in Lookout Mountain?
Median Population Age in Lookout Mountain is 49.3 Years.
What is the Average Family Size in Lookout Mountain
Average Family Size in Lookout Mountain is 3.1 People.
What is the Average Household Size in Lookout Mountain
Average Household Size in Lookout Mountain is 2.7 People.
How Large is the Labor Force in Lookout Mountain?
There are 882 People in the Labor Forcein in Lookout Mountain.
What is the Percentage of People in the Labor Force in Lookout Mountain?
52.6% of People are in the Labor Force in Lookout Mountain.
What is the Unemployment Rate in Lookout Mountain?
Unemployment Rate in Lookout Mountain is 0.8%.