Cities with the Highest Percentage of Hispanic or Latino Population in New Hampshire
RELATED REPORTS & OPTIONS
Hispanic or Latino
New Hampshire
Compare Cities
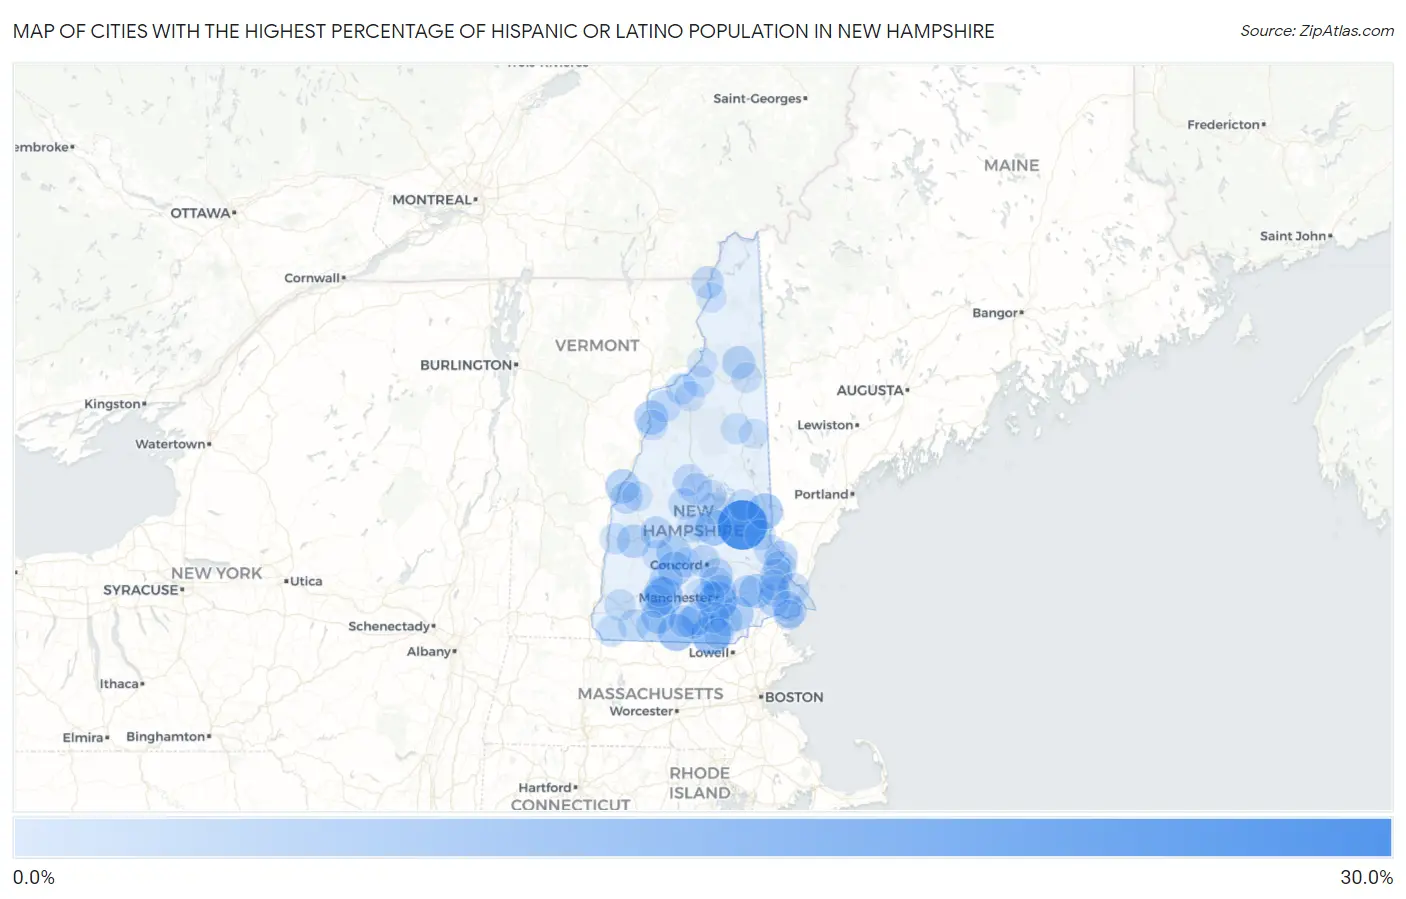
Map of Cities with the Highest Percentage of Hispanic or Latino Population in New Hampshire
0.0%
30.0%
Cities with the Highest Percentage of Hispanic or Latino Population in New Hampshire
| City | Hispanic or Latino | vs State | vs National | |
| 1. | Alton | 28.8% | 4.3%(+24.6)#1 | 18.7%(+10.2)#3,525 |
| 2. | Nashua | 13.1% | 4.3%(+8.89)#2 | 18.7%(-5.51)#7,075 |
| 3. | Manchester | 12.3% | 4.3%(+8.08)#3 | 18.7%(-6.32)#7,424 |
| 4. | Bennington | 11.5% | 4.3%(+7.21)#4 | 18.7%(-7.19)#7,877 |
| 5. | Greenville | 9.9% | 4.3%(+5.64)#5 | 18.7%(-8.76)#8,782 |
| 6. | Belmont | 8.9% | 4.3%(+4.61)#6 | 18.7%(-9.79)#9,526 |
| 7. | Sanbornville | 8.4% | 4.3%(+4.13)#7 | 18.7%(-10.3)#9,916 |
| 8. | Francestown | 7.8% | 4.3%(+3.50)#8 | 18.7%(-10.9)#10,518 |
| 9. | Peterborough | 7.0% | 4.3%(+2.74)#9 | 18.7%(-11.7)#11,252 |
| 10. | Warner | 6.8% | 4.3%(+2.57)#10 | 18.7%(-11.8)#11,428 |
| 11. | Derry | 6.6% | 4.3%(+2.33)#11 | 18.7%(-12.1)#11,697 |
| 12. | Henniker | 6.4% | 4.3%(+2.13)#12 | 18.7%(-12.3)#11,919 |
| 13. | Hanover | 6.2% | 4.3%(+1.94)#13 | 18.7%(-12.5)#12,142 |
| 14. | Epping | 6.1% | 4.3%(+1.89)#14 | 18.7%(-12.5)#12,209 |
| 15. | Woodsville | 5.7% | 4.3%(+1.47)#15 | 18.7%(-12.9)#12,726 |
| 16. | Newport | 4.9% | 4.3%(+0.626)#16 | 18.7%(-13.8)#13,902 |
| 17. | Somersworth | 4.6% | 4.3%(+0.359)#17 | 18.7%(-14.0)#14,297 |
| 18. | Hampton Beach | 4.6% | 4.3%(+0.352)#18 | 18.7%(-14.0)#14,306 |
| 19. | Hancock | 4.5% | 4.3%(+0.271)#19 | 18.7%(-14.1)#14,449 |
| 20. | Berlin | 4.4% | 4.3%(+0.187)#20 | 18.7%(-14.2)#14,559 |
| 21. | Suncook | 4.4% | 4.3%(+0.161)#21 | 18.7%(-14.2)#14,594 |
| 22. | Hillsborough | 4.4% | 4.3%(+0.152)#22 | 18.7%(-14.2)#14,606 |
| 23. | Amherst | 4.3% | 4.3%(+0.001)#23 | 18.7%(-14.4)#14,865 |
| 24. | Dover | 4.2% | 4.3%(-0.090)#24 | 18.7%(-14.5)#15,021 |
| 25. | Milford | 3.9% | 4.3%(-0.324)#25 | 18.7%(-14.7)#15,383 |
| 26. | South Hooksett | 3.9% | 4.3%(-0.395)#26 | 18.7%(-14.8)#15,488 |
| 27. | Londonderry | 3.8% | 4.3%(-0.463)#27 | 18.7%(-14.9)#15,611 |
| 28. | Exeter | 3.7% | 4.3%(-0.551)#28 | 18.7%(-15.0)#15,746 |
| 29. | Concord | 3.6% | 4.3%(-0.626)#29 | 18.7%(-15.0)#15,869 |
| 30. | Durham | 3.6% | 4.3%(-0.646)#30 | 18.7%(-15.0)#15,906 |
| 31. | Lebanon | 3.4% | 4.3%(-0.807)#31 | 18.7%(-15.2)#16,216 |
| 32. | West Stewartstown | 3.4% | 4.3%(-0.811)#32 | 18.7%(-15.2)#16,221 |
| 33. | New London | 3.3% | 4.3%(-0.968)#33 | 18.7%(-15.4)#16,507 |
| 34. | Wilton | 3.2% | 4.3%(-1.03)#34 | 18.7%(-15.4)#16,609 |
| 35. | Raymond | 3.1% | 4.3%(-1.11)#35 | 18.7%(-15.5)#16,773 |
| 36. | Laconia | 2.9% | 4.3%(-1.39)#36 | 18.7%(-15.8)#17,335 |
| 37. | Lisbon | 2.8% | 4.3%(-1.50)#37 | 18.7%(-15.9)#17,574 |
| 38. | Hooksett | 2.6% | 4.3%(-1.67)#38 | 18.7%(-16.1)#17,950 |
| 39. | Plymouth | 2.5% | 4.3%(-1.72)#39 | 18.7%(-16.1)#18,055 |
| 40. | Portsmouth | 2.4% | 4.3%(-1.81)#40 | 18.7%(-16.2)#18,227 |
| 41. | Ashland | 2.4% | 4.3%(-1.82)#41 | 18.7%(-16.2)#18,252 |
| 42. | Newfields | 2.4% | 4.3%(-1.85)#42 | 18.7%(-16.2)#18,312 |
| 43. | Keene | 2.3% | 4.3%(-1.96)#43 | 18.7%(-16.4)#18,561 |
| 44. | Littleton | 2.2% | 4.3%(-2.03)#44 | 18.7%(-16.4)#18,700 |
| 45. | Troy | 2.2% | 4.3%(-2.08)#45 | 18.7%(-16.5)#18,811 |
| 46. | Wolfeboro | 2.2% | 4.3%(-2.08)#46 | 18.7%(-16.5)#18,829 |
| 47. | East Merrimack | 2.2% | 4.3%(-2.10)#47 | 18.7%(-16.5)#18,865 |
| 48. | Pinardville | 2.1% | 4.3%(-2.11)#48 | 18.7%(-16.5)#18,882 |
| 49. | Bristol | 2.1% | 4.3%(-2.20)#49 | 18.7%(-16.6)#19,061 |
| 50. | Antrim | 2.0% | 4.3%(-2.21)#50 | 18.7%(-16.6)#19,075 |
| 51. | Rochester | 2.0% | 4.3%(-2.30)#51 | 18.7%(-16.7)#19,283 |
| 52. | Claremont | 1.6% | 4.3%(-2.63)#52 | 18.7%(-17.0)#20,061 |
| 53. | Jaffrey | 1.5% | 4.3%(-2.70)#53 | 18.7%(-17.1)#20,228 |
| 54. | Bartlett | 1.5% | 4.3%(-2.71)#54 | 18.7%(-17.1)#20,240 |
| 55. | Winchester | 1.5% | 4.3%(-2.79)#55 | 18.7%(-17.2)#20,423 |
| 56. | Farmington | 1.5% | 4.3%(-2.80)#56 | 18.7%(-17.2)#20,440 |
| 57. | Whitefield | 1.4% | 4.3%(-2.90)#57 | 18.7%(-17.3)#20,679 |
| 58. | Bradford | 1.3% | 4.3%(-2.96)#58 | 18.7%(-17.4)#20,833 |
| 59. | North Haverhill | 1.2% | 4.3%(-3.03)#59 | 18.7%(-17.4)#21,003 |
| 60. | Meredith | 1.1% | 4.3%(-3.16)#60 | 18.7%(-17.6)#21,340 |
| 61. | Gorham | 1.1% | 4.3%(-3.17)#61 | 18.7%(-17.6)#21,378 |
| 62. | Newmarket | 1.1% | 4.3%(-3.19)#62 | 18.7%(-17.6)#21,420 |
| 63. | Hampton | 0.99% | 4.3%(-3.27)#63 | 18.7%(-17.7)#21,635 |
| 64. | Hudson | 0.94% | 4.3%(-3.31)#64 | 18.7%(-17.7)#21,744 |
| 65. | Bethlehem | 0.63% | 4.3%(-3.62)#65 | 18.7%(-18.0)#22,534 |
| 66. | Lancaster | 0.62% | 4.3%(-3.63)#66 | 18.7%(-18.0)#22,546 |
| 67. | Seabrook Beach | 0.58% | 4.3%(-3.67)#67 | 18.7%(-18.1)#22,645 |
| 68. | Franklin | 0.55% | 4.3%(-3.70)#68 | 18.7%(-18.1)#22,732 |
| 69. | Colebrook | 0.45% | 4.3%(-3.80)#69 | 18.7%(-18.2)#22,949 |
| 70. | Tilton Northfield | 0.33% | 4.3%(-3.92)#70 | 18.7%(-18.3)#23,240 |
| 71. | Contoocook | 0.31% | 4.3%(-3.94)#71 | 18.7%(-18.3)#23,292 |
| 72. | North Conway | 0.29% | 4.3%(-3.96)#72 | 18.7%(-18.4)#23,335 |
| 73. | Goffstown | 0.23% | 4.3%(-4.02)#73 | 18.7%(-18.4)#23,456 |
| 74. | Enfield | 0.14% | 4.3%(-4.11)#74 | 18.7%(-18.5)#23,619 |
1
Common Questions
What are the Top 10 Cities with the Highest Percentage of Hispanic or Latino Population in New Hampshire?
Top 10 Cities with the Highest Percentage of Hispanic or Latino Population in New Hampshire are:
#1
28.8%
#2
13.1%
#3
12.3%
#4
11.5%
#5
9.9%
#6
8.9%
#7
8.4%
#8
7.0%
#9
6.8%
#10
6.6%
What city has the Highest Percentage of Hispanic or Latino Population in New Hampshire?
Alton has the Highest Percentage of Hispanic or Latino Population in New Hampshire with 28.8%.
What is the Percentage of Hispanic or Latino Population in the State of New Hampshire?
Percentage of Hispanic or Latino Population in New Hampshire is 4.3%.
What is the Percentage of Hispanic or Latino Population in the United States?
Percentage of Hispanic or Latino Population in the United States is 18.7%.