North Haverhill, NH Map & Demographics
North Haverhill Map
North Haverhill Overview
$48,702
PER CAPITA INCOME
$54,692
AVG FAMILY INCOME
$52,808
AVG HOUSEHOLD INCOME
0.62
INEQUALITY / GINI INDEX
819
TOTAL POPULATION
311
MALE POPULATION
508
FEMALE POPULATION
61.22
MALES / 100 FEMALES
163.34
FEMALES / 100 MALES
66.2
MEDIAN AGE
2.5
AVG FAMILY SIZE
1.8
AVG HOUSEHOLD SIZE
303
LABOR FORCE [ PEOPLE ]
39.0%
PERCENT IN LABOR FORCE
North Haverhill Zip Codes
North Haverhill Area Codes
Income in North Haverhill
Income Overview in North Haverhill
Per Capita Income in North Haverhill is $48,702, while median incomes of families and households are $54,692 and $52,808 respectively.
| Characteristic | Number | Measure |
| Per Capita Income | 819 | $48,702 |
| Median Family Income | 154 | $54,692 |
| Mean Family Income | 154 | $71,592 |
| Median Household Income | 322 | $52,808 |
| Mean Household Income | 322 | $105,218 |
| Income Deficit | 154 | $0 |
| Wage / Income Gap (%) | 819 | 0.00% |
| Wage / Income Gap ($) | 819 | 100.00¢ per $1 |
| Gini / Inequality Index | 819 | 0.62 |
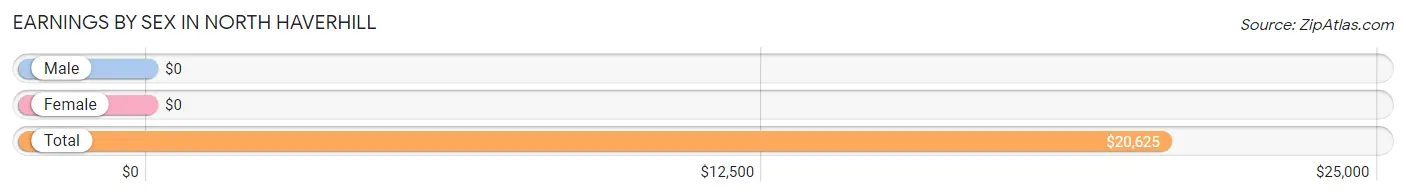
Earnings by Sex in North Haverhill
| Sex | Number | Average Earnings |
| Male | 139 (36.5%) | $0 |
| Female | 242 (63.5%) | $0 |
| Total | 381 (100.0%) | $20,625 |
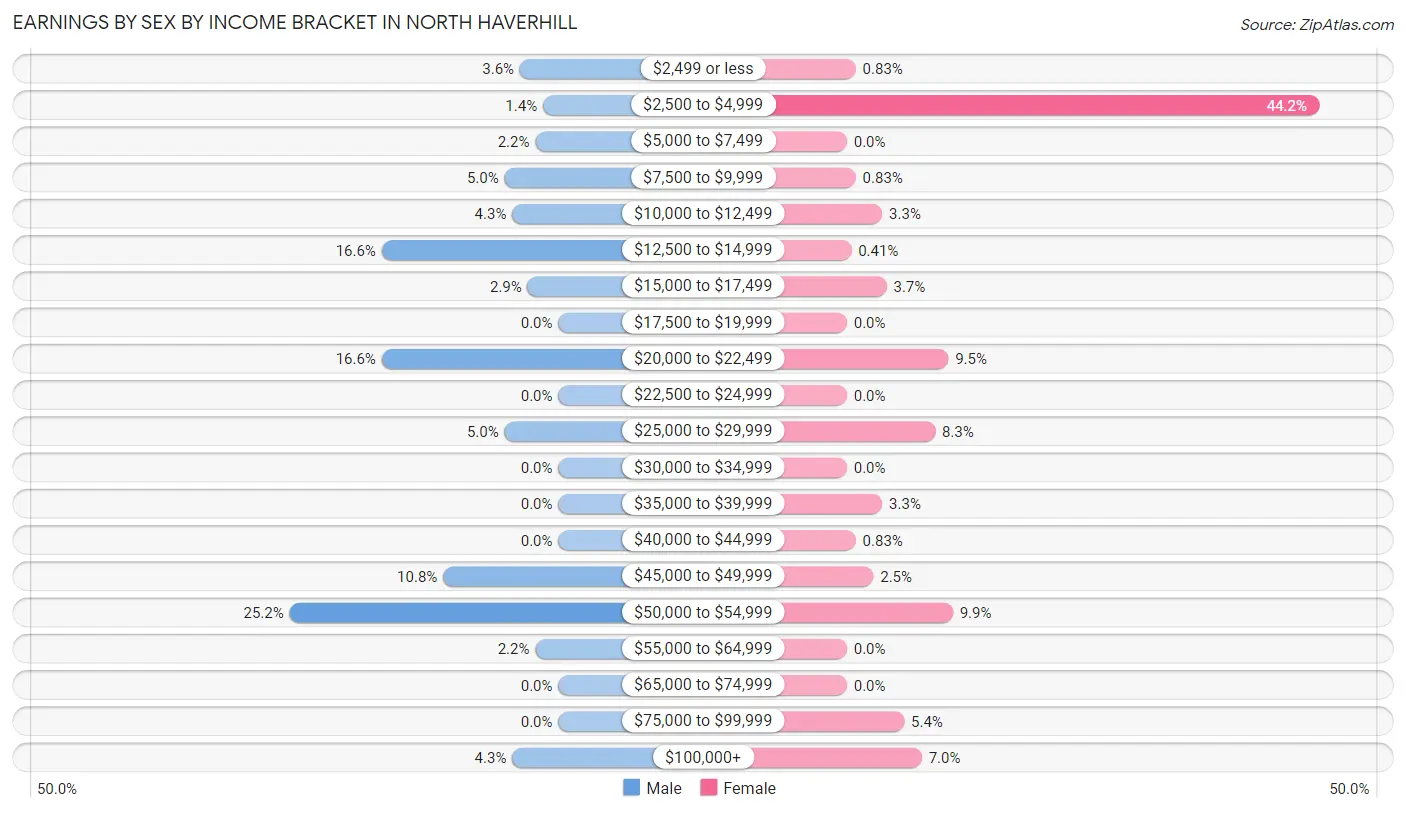
Earnings by Sex by Income Bracket in North Haverhill
The most common earnings brackets in North Haverhill are $50,000 to $54,999 for men (35 | 25.2%) and $2,500 to $4,999 for women (107 | 44.2%).
| Income | Male | Female |
| $2,499 or less | 5 (3.6%) | 2 (0.8%) |
| $2,500 to $4,999 | 2 (1.4%) | 107 (44.2%) |
| $5,000 to $7,499 | 3 (2.2%) | 0 (0.0%) |
| $7,500 to $9,999 | 7 (5.0%) | 2 (0.8%) |
| $10,000 to $12,499 | 6 (4.3%) | 8 (3.3%) |
| $12,500 to $14,999 | 23 (16.6%) | 1 (0.4%) |
| $15,000 to $17,499 | 4 (2.9%) | 9 (3.7%) |
| $17,500 to $19,999 | 0 (0.0%) | 0 (0.0%) |
| $20,000 to $22,499 | 23 (16.6%) | 23 (9.5%) |
| $22,500 to $24,999 | 0 (0.0%) | 0 (0.0%) |
| $25,000 to $29,999 | 7 (5.0%) | 20 (8.3%) |
| $30,000 to $34,999 | 0 (0.0%) | 0 (0.0%) |
| $35,000 to $39,999 | 0 (0.0%) | 8 (3.3%) |
| $40,000 to $44,999 | 0 (0.0%) | 2 (0.8%) |
| $45,000 to $49,999 | 15 (10.8%) | 6 (2.5%) |
| $50,000 to $54,999 | 35 (25.2%) | 24 (9.9%) |
| $55,000 to $64,999 | 3 (2.2%) | 0 (0.0%) |
| $65,000 to $74,999 | 0 (0.0%) | 0 (0.0%) |
| $75,000 to $99,999 | 0 (0.0%) | 13 (5.4%) |
| $100,000+ | 6 (4.3%) | 17 (7.0%) |
| Total | 139 (100.0%) | 242 (100.0%) |
Earnings by Sex by Educational Attainment in North Haverhill
| Educational Attainment | Male Income | Female Income |
| Less than High School | - | - |
| High School Diploma | - | - |
| College or Associate's Degree | - | - |
| Bachelor's Degree | - | - |
| Graduate Degree | - | - |
| Total | - | - |
Family Income in North Haverhill
Family Income Brackets in North Haverhill
According to the North Haverhill family income data, there are 80 families falling into the $50,000 to $74,999 income range, which is the most common income bracket and makes up 51.9% of all families.
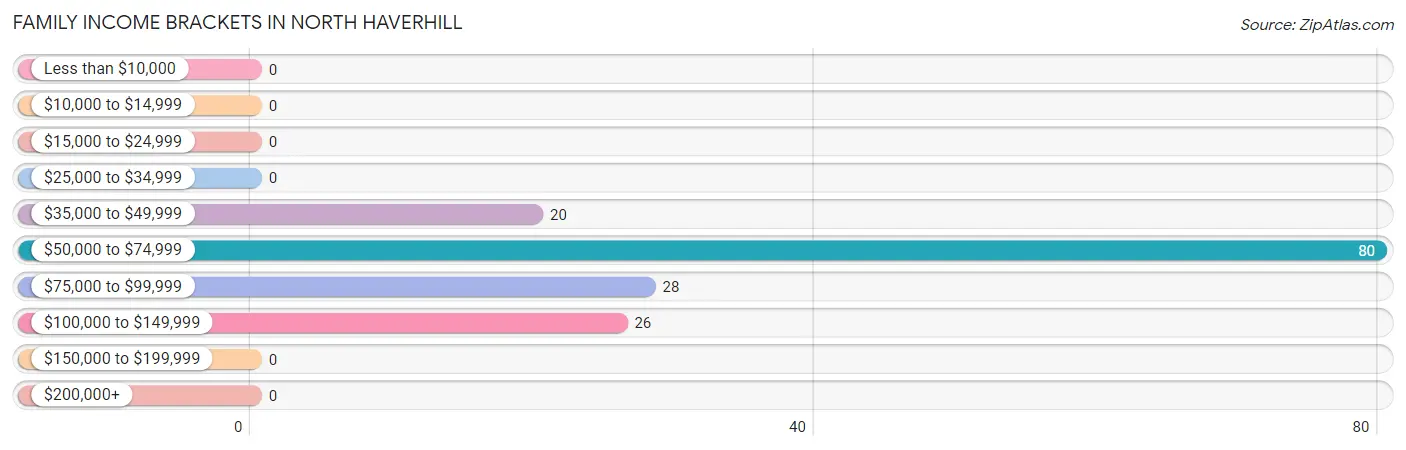
| Income Bracket | # Families | % Families |
| Less than $10,000 | 0 | 0.0% |
| $10,000 to $14,999 | 0 | 0.0% |
| $15,000 to $24,999 | 0 | 0.0% |
| $25,000 to $34,999 | 0 | 0.0% |
| $35,000 to $49,999 | 20 | 13.0% |
| $50,000 to $74,999 | 80 | 51.9% |
| $75,000 to $99,999 | 28 | 18.2% |
| $100,000 to $149,999 | 26 | 16.9% |
| $150,000 to $199,999 | 0 | 0.0% |
| $200,000+ | 0 | 0.0% |
Family Income by Famaliy Size in North Haverhill
2-person families (119 | 77.3%) account for the highest median family income in North Haverhill with $54,788 per family, while 2-person families (119 | 77.3%) have the highest median income of $27,394 per family member.
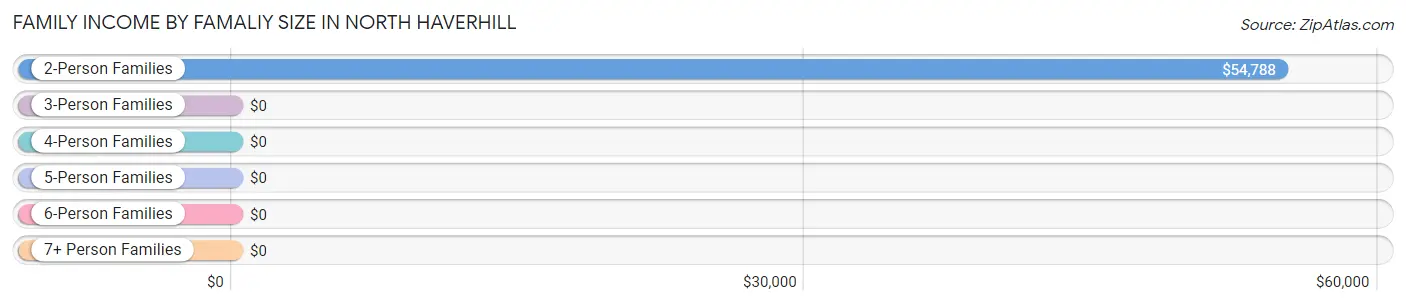
| Income Bracket | # Families | Median Income |
| 2-Person Families | 119 (77.3%) | $54,788 |
| 3-Person Families | 35 (22.7%) | $0 |
| 4-Person Families | 0 (0.0%) | $0 |
| 5-Person Families | 0 (0.0%) | $0 |
| 6-Person Families | 0 (0.0%) | $0 |
| 7+ Person Families | 0 (0.0%) | $0 |
| Total | 154 (100.0%) | $54,692 |
Family Income by Number of Earners in North Haverhill
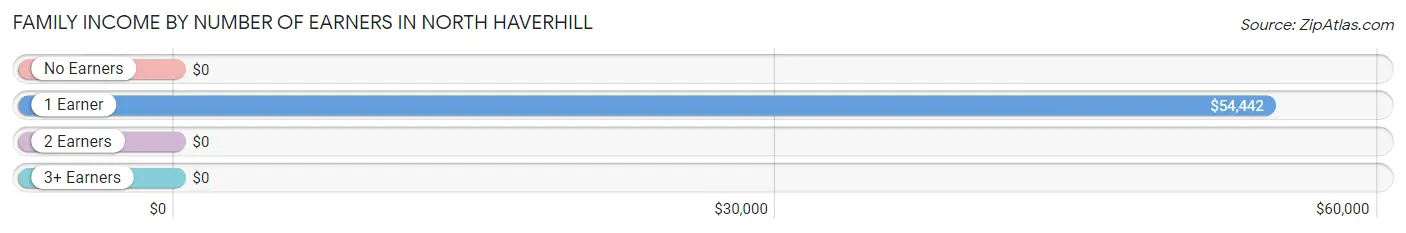
| Number of Earners | # Families | Median Income |
| No Earners | 0 (0.0%) | $0 |
| 1 Earner | 101 (65.6%) | $54,442 |
| 2 Earners | 53 (34.4%) | $0 |
| 3+ Earners | 0 (0.0%) | $0 |
| Total | 154 (100.0%) | $54,692 |
Household Income in North Haverhill
Household Income Brackets in North Haverhill
With 96 households falling in the category, the $15,000 to $24,999 income range is the most frequent in North Haverhill, accounting for 29.8% of all households.
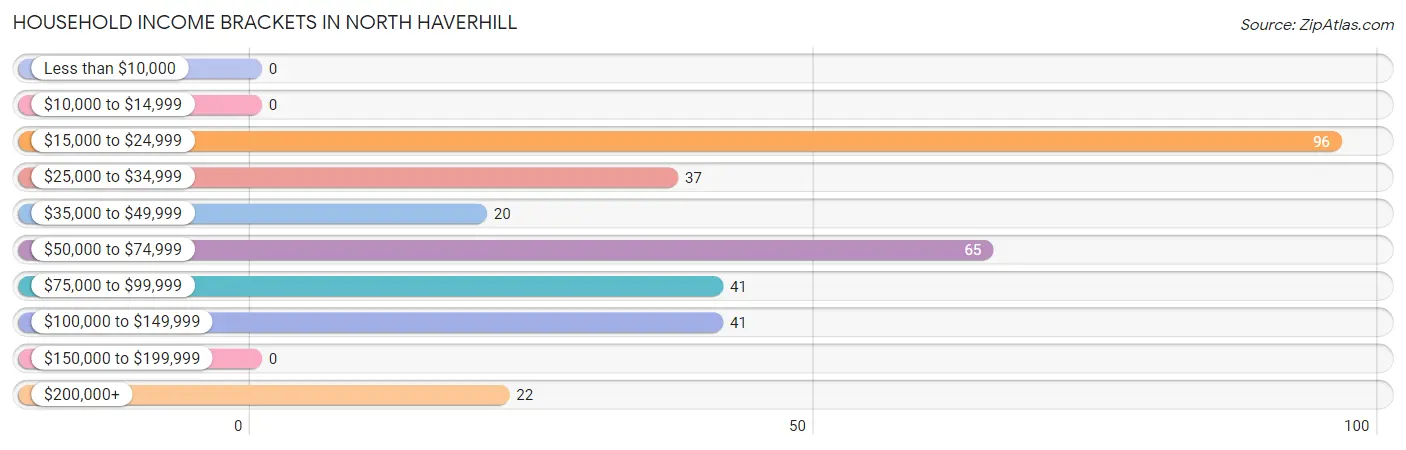
| Income Bracket | # Households | % Households |
| Less than $10,000 | 0 | 0.0% |
| $10,000 to $14,999 | 0 | 0.0% |
| $15,000 to $24,999 | 96 | 29.8% |
| $25,000 to $34,999 | 37 | 11.5% |
| $35,000 to $49,999 | 20 | 6.2% |
| $50,000 to $74,999 | 65 | 20.2% |
| $75,000 to $99,999 | 41 | 12.7% |
| $100,000 to $149,999 | 41 | 12.7% |
| $150,000 to $199,999 | 0 | 0.0% |
| $200,000+ | 22 | 6.8% |
Household Income by Householder Age in North Haverhill
The median household income in North Haverhill is $52,808, with the highest median household income of $88,750 found in the 45 to 64 years age bracket for the primary householder. A total of 56 households (17.4%) fall into this category.
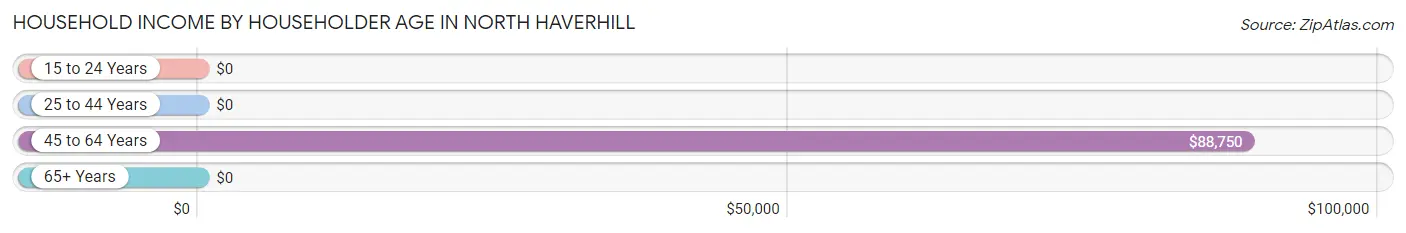
| Income Bracket | # Households | Median Income |
| 15 to 24 Years | 0 (0.0%) | $0 |
| 25 to 44 Years | 20 (6.2%) | $0 |
| 45 to 64 Years | 56 (17.4%) | $88,750 |
| 65+ Years | 246 (76.4%) | $0 |
| Total | 322 (100.0%) | $52,808 |
Poverty in North Haverhill
Income Below Poverty by Sex and Age in North Haverhill
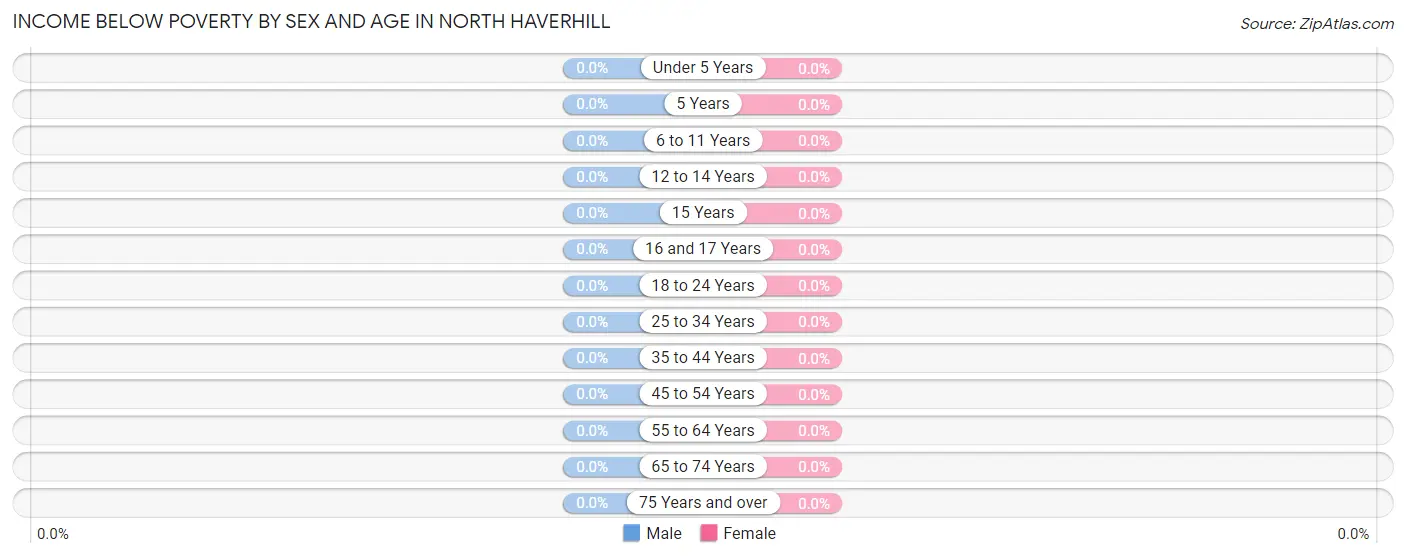
| Age Bracket | Male | Female |
| Under 5 Years | 0 (0.0%) | 0 (0.0%) |
| 5 Years | 0 (0.0%) | 0 (0.0%) |
| 6 to 11 Years | 0 (0.0%) | 0 (0.0%) |
| 12 to 14 Years | 0 (0.0%) | 0 (0.0%) |
| 15 Years | 0 (0.0%) | 0 (0.0%) |
| 16 and 17 Years | 0 (0.0%) | 0 (0.0%) |
| 18 to 24 Years | 0 (0.0%) | 0 (0.0%) |
| 25 to 34 Years | 0 (0.0%) | 0 (0.0%) |
| 35 to 44 Years | 0 (0.0%) | 0 (0.0%) |
| 45 to 54 Years | 0 (0.0%) | 0 (0.0%) |
| 55 to 64 Years | 0 (0.0%) | 0 (0.0%) |
| 65 to 74 Years | 0 (0.0%) | 0 (0.0%) |
| 75 Years and over | 0 (0.0%) | 0 (0.0%) |
| Total | 0 (0.0%) | 0 (0.0%) |
Income Above Poverty by Sex and Age in North Haverhill
According to the poverty statistics in North Haverhill, males aged 6 to 11 years and females aged 16 and 17 years are the age groups that are most secure financially, with 100.0% of males and 100.0% of females in these age groups living above the poverty line.
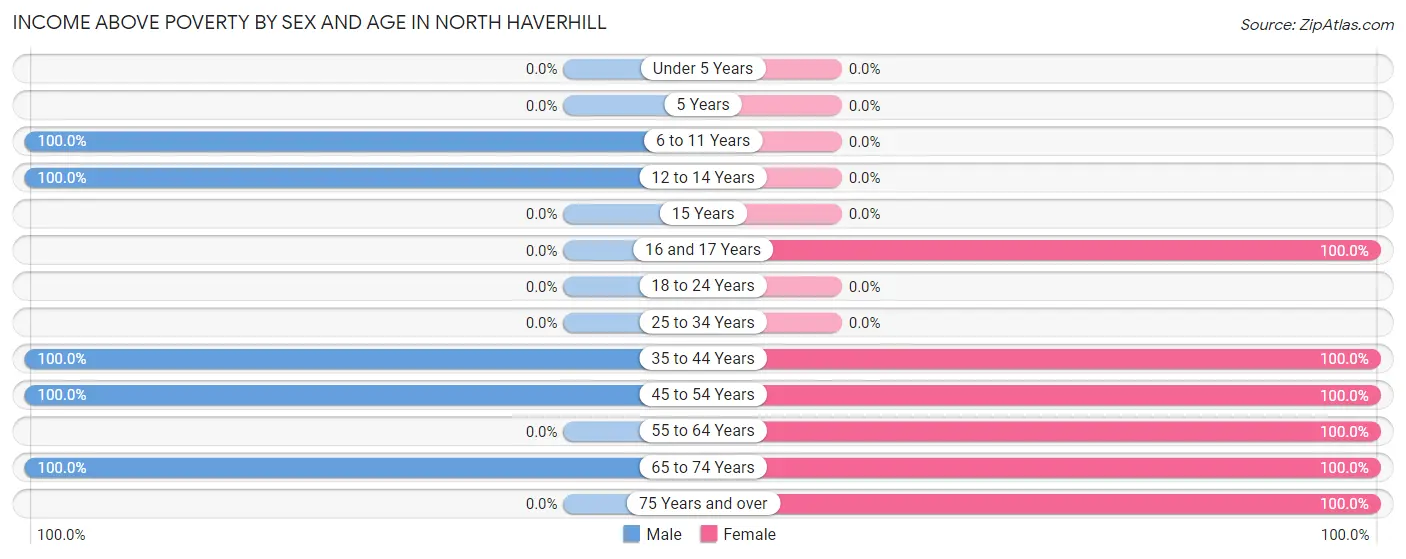
| Age Bracket | Male | Female |
| Under 5 Years | 0 (0.0%) | 0 (0.0%) |
| 5 Years | 0 (0.0%) | 0 (0.0%) |
| 6 to 11 Years | 22 (100.0%) | 0 (0.0%) |
| 12 to 14 Years | 20 (100.0%) | 0 (0.0%) |
| 15 Years | 0 (0.0%) | 0 (0.0%) |
| 16 and 17 Years | 0 (0.0%) | 8 (100.0%) |
| 18 to 24 Years | 0 (0.0%) | 0 (0.0%) |
| 25 to 34 Years | 0 (0.0%) | 0 (0.0%) |
| 35 to 44 Years | 55 (100.0%) | 21 (100.0%) |
| 45 to 54 Years | 43 (100.0%) | 24 (100.0%) |
| 55 to 64 Years | 0 (0.0%) | 30 (100.0%) |
| 65 to 74 Years | 49 (100.0%) | 154 (100.0%) |
| 75 Years and over | 0 (0.0%) | 161 (100.0%) |
| Total | 189 (100.0%) | 398 (100.0%) |
Income Below Poverty Among Married-Couple Families in North Haverhill
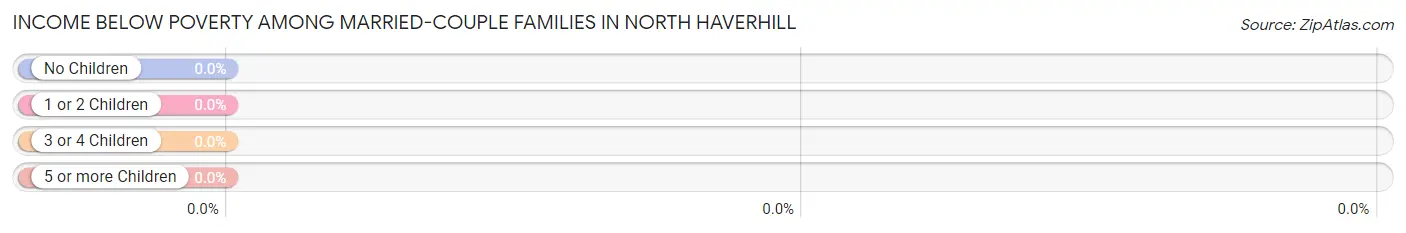
| Children | Above Poverty | Below Poverty |
| No Children | 54 (100.0%) | 0 (0.0%) |
| 1 or 2 Children | 20 (100.0%) | 0 (0.0%) |
| 3 or 4 Children | 0 (0.0%) | 0 (0.0%) |
| 5 or more Children | 0 (0.0%) | 0 (0.0%) |
| Total | 74 (100.0%) | 0 (0.0%) |
Income Below Poverty Among Single-Parent Households in North Haverhill
| Children | Single Father | Single Mother |
| No Children | 0 (0.0%) | 0 (0.0%) |
| 1 or 2 Children | 0 (0.0%) | 0 (0.0%) |
| 3 or 4 Children | 0 (0.0%) | 0 (0.0%) |
| 5 or more Children | 0 (0.0%) | 0 (0.0%) |
| Total | 0 (0.0%) | 0 (0.0%) |
Income Below Poverty Among Married-Couple vs Single-Parent Households in North Haverhill
| Children | Married-Couple Families | Single-Parent Households |
| No Children | 0 (0.0%) | 0 (0.0%) |
| 1 or 2 Children | 0 (0.0%) | 0 (0.0%) |
| 3 or 4 Children | 0 (0.0%) | 0 (0.0%) |
| 5 or more Children | 0 (0.0%) | 0 (0.0%) |
| Total | 0 (0.0%) | 0 (0.0%) |
Race in North Haverhill
The most populous races in North Haverhill are White / Caucasian (758 | 92.5%), Two or more Races (55 | 6.7%), and Hispanic or Latino (10 | 1.2%).
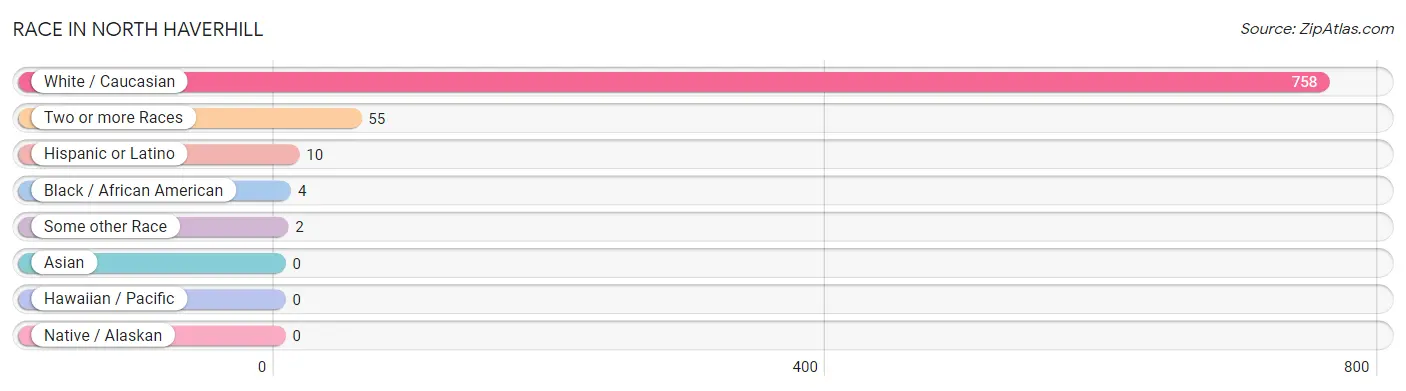
| Race | # Population | % Population |
| Asian | 0 | 0.0% |
| Black / African American | 4 | 0.5% |
| Hawaiian / Pacific | 0 | 0.0% |
| Hispanic or Latino | 10 | 1.2% |
| Native / Alaskan | 0 | 0.0% |
| White / Caucasian | 758 | 92.5% |
| Two or more Races | 55 | 6.7% |
| Some other Race | 2 | 0.2% |
| Total | 819 | 100.0% |
Ancestry in North Haverhill
The most populous ancestries reported in North Haverhill are English (180 | 22.0%), American (174 | 21.2%), German (165 | 20.2%), Irish (116 | 14.2%), and French (91 | 11.1%), together accounting for 88.7% of all North Haverhill residents.
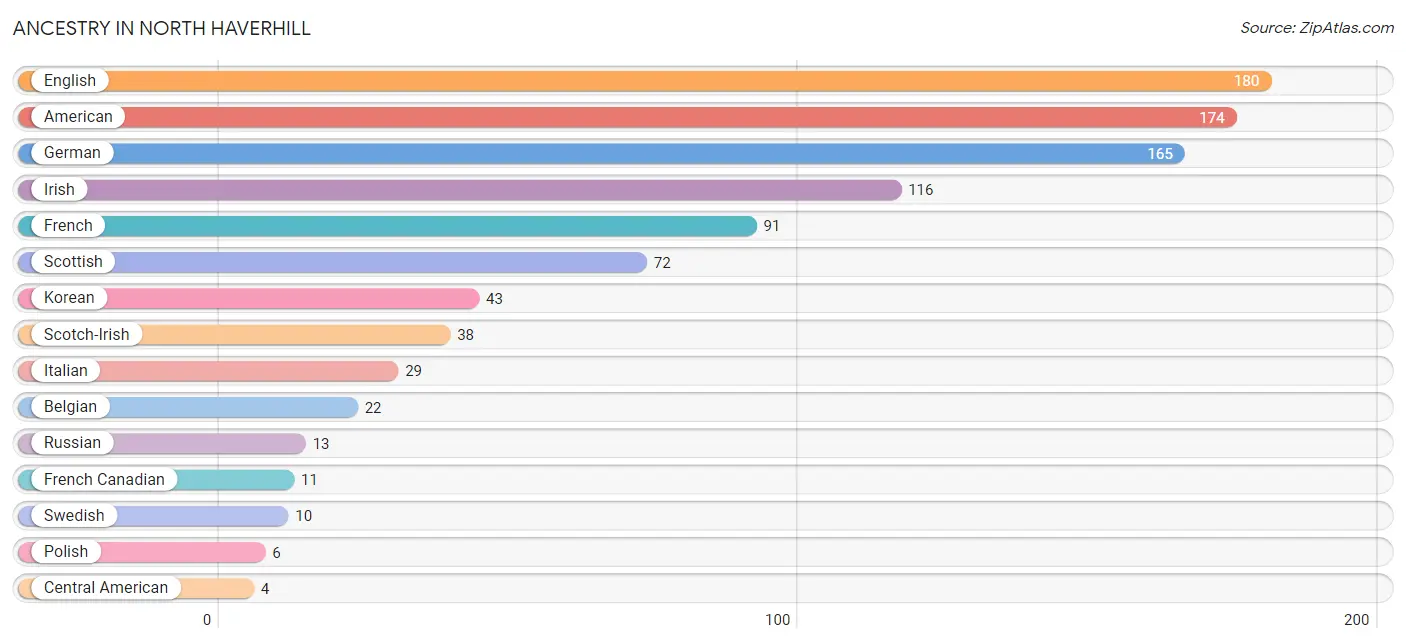
| Ancestry | # Population | % Population |
| American | 174 | 21.2% |
| Belgian | 22 | 2.7% |
| Central American | 4 | 0.5% |
| Dutch | 3 | 0.4% |
| English | 180 | 22.0% |
| Finnish | 2 | 0.2% |
| French | 91 | 11.1% |
| French Canadian | 11 | 1.3% |
| German | 165 | 20.2% |
| Greek | 3 | 0.4% |
| Honduran | 4 | 0.5% |
| Irish | 116 | 14.2% |
| Italian | 29 | 3.5% |
| Korean | 43 | 5.2% |
| Mexican | 2 | 0.2% |
| New Zealander | 2 | 0.2% |
| Polish | 6 | 0.7% |
| Portuguese | 4 | 0.5% |
| Puerto Rican | 2 | 0.2% |
| Russian | 13 | 1.6% |
| Scotch-Irish | 38 | 4.6% |
| Scottish | 72 | 8.8% |
| Spanish | 2 | 0.2% |
| Swedish | 10 | 1.2% | View All 24 Rows |
Immigrants in North Haverhill
The most numerous immigrant groups reported in North Haverhill came from Canada (9 | 1.1%), Central America (4 | 0.5%), Honduras (4 | 0.5%), Latin America (4 | 0.5%), and Europe (2 | 0.2%), together accounting for 2.8% of all North Haverhill residents.
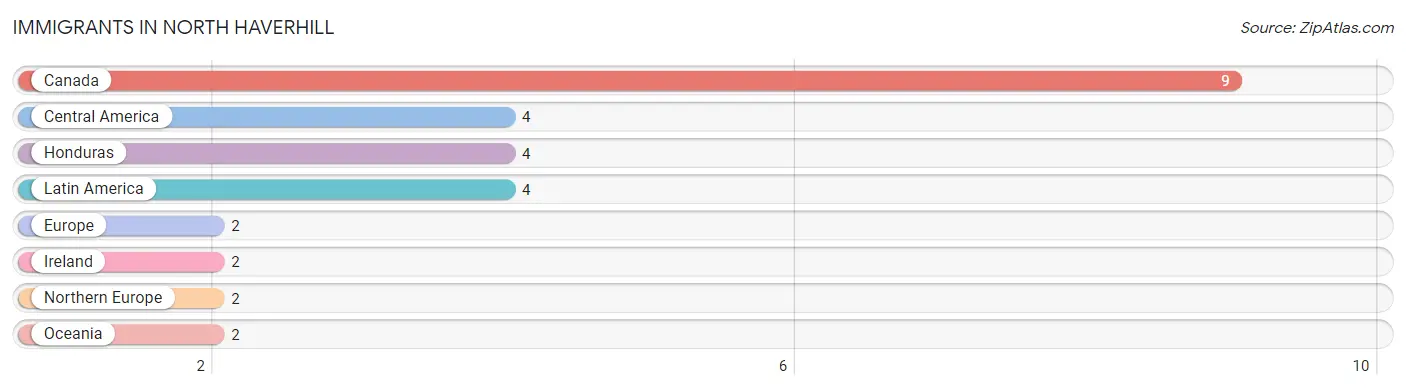
| Immigration Origin | # Population | % Population |
| Canada | 9 | 1.1% |
| Central America | 4 | 0.5% |
| Europe | 2 | 0.2% |
| Honduras | 4 | 0.5% |
| Ireland | 2 | 0.2% |
| Latin America | 4 | 0.5% |
| Northern Europe | 2 | 0.2% |
| Oceania | 2 | 0.2% | View All 8 Rows |
Sex and Age in North Haverhill
Sex and Age in North Haverhill
The most populous age groups in North Haverhill are 40 to 44 Years (65 | 20.9%) for men and 85 Years and over (190 | 37.4%) for women.
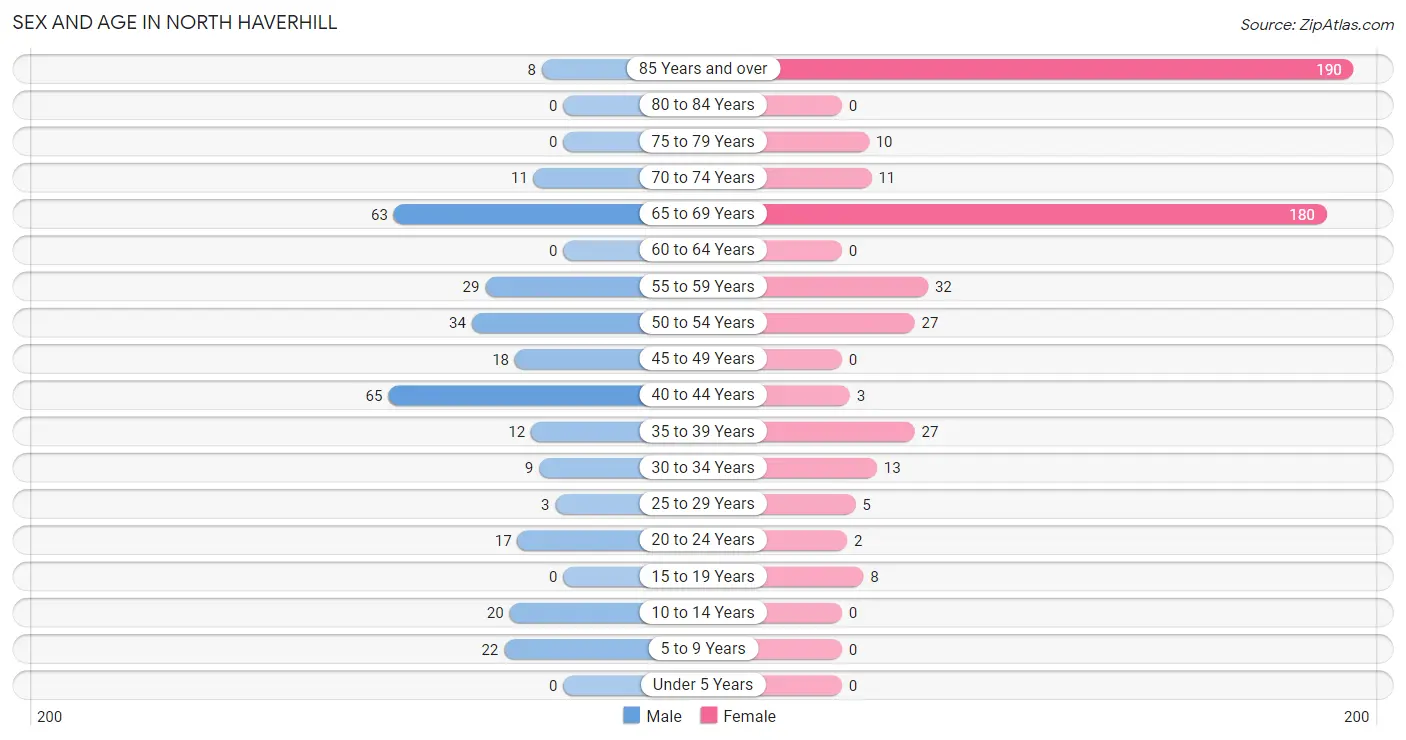
| Age Bracket | Male | Female |
| Under 5 Years | 0 (0.0%) | 0 (0.0%) |
| 5 to 9 Years | 22 (7.1%) | 0 (0.0%) |
| 10 to 14 Years | 20 (6.4%) | 0 (0.0%) |
| 15 to 19 Years | 0 (0.0%) | 8 (1.6%) |
| 20 to 24 Years | 17 (5.5%) | 2 (0.4%) |
| 25 to 29 Years | 3 (1.0%) | 5 (1.0%) |
| 30 to 34 Years | 9 (2.9%) | 13 (2.6%) |
| 35 to 39 Years | 12 (3.9%) | 27 (5.3%) |
| 40 to 44 Years | 65 (20.9%) | 3 (0.6%) |
| 45 to 49 Years | 18 (5.8%) | 0 (0.0%) |
| 50 to 54 Years | 34 (10.9%) | 27 (5.3%) |
| 55 to 59 Years | 29 (9.3%) | 32 (6.3%) |
| 60 to 64 Years | 0 (0.0%) | 0 (0.0%) |
| 65 to 69 Years | 63 (20.3%) | 180 (35.4%) |
| 70 to 74 Years | 11 (3.5%) | 11 (2.2%) |
| 75 to 79 Years | 0 (0.0%) | 10 (2.0%) |
| 80 to 84 Years | 0 (0.0%) | 0 (0.0%) |
| 85 Years and over | 8 (2.6%) | 190 (37.4%) |
| Total | 311 (100.0%) | 508 (100.0%) |
Families and Households in North Haverhill
Median Family Size in North Haverhill
The median family size in North Haverhill is 2.49 persons per family, with single male/father families (15 | 9.7%) accounting for the largest median family size of 2.87 persons per family. On the other hand, married-couple families (74 | 48.0%) represent the smallest median family size with 2.28 persons per family.
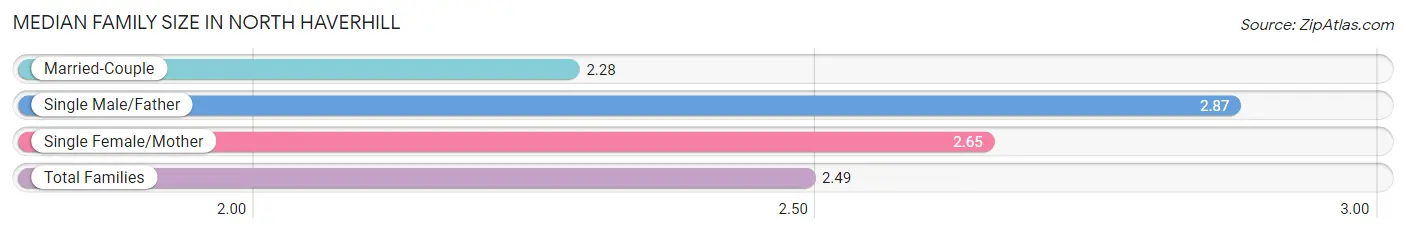
| Family Type | # Families | Family Size |
| Married-Couple | 74 (48.0%) | 2.28 |
| Single Male/Father | 15 (9.7%) | 2.87 |
| Single Female/Mother | 65 (42.2%) | 2.65 |
| Total Families | 154 (100.0%) | 2.49 |
Median Household Size in North Haverhill
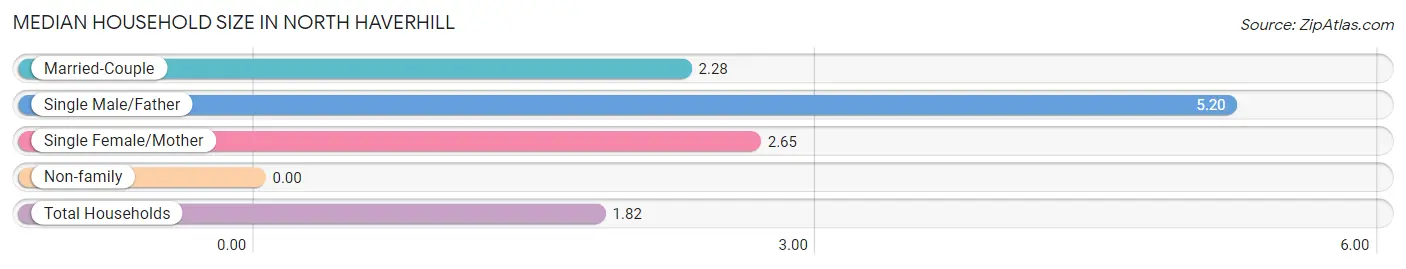
| Household Type | # Households | Household Size |
| Married-Couple | 74 (23.0%) | 2.28 |
| Single Male/Father | 15 (4.7%) | 5.20 |
| Single Female/Mother | 65 (20.2%) | 2.65 |
| Non-family | 168 (52.2%) | - |
| Total Households | 322 (100.0%) | 1.82 |
Household Size by Marriage Status in North Haverhill
Out of a total of 322 households in North Haverhill, 154 (47.8%) are family households, while 168 (52.2%) are nonfamily households. The most numerous type of family households are 2-person households, comprising 119, and the most common type of nonfamily households are 1-person households, comprising 168.
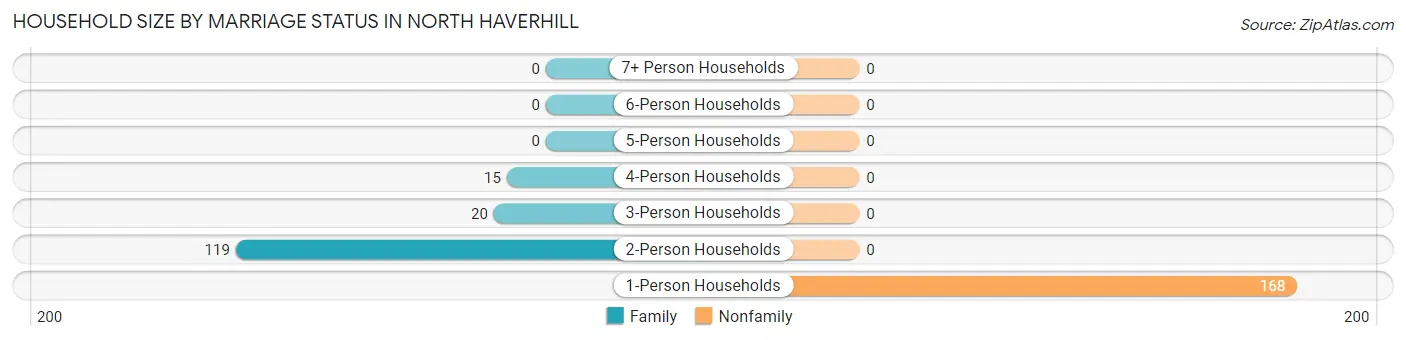
| Household Size | Family Households | Nonfamily Households |
| 1-Person Households | - | 168 (52.2%) |
| 2-Person Households | 119 (37.0%) | 0 (0.0%) |
| 3-Person Households | 20 (6.2%) | 0 (0.0%) |
| 4-Person Households | 15 (4.7%) | 0 (0.0%) |
| 5-Person Households | 0 (0.0%) | 0 (0.0%) |
| 6-Person Households | 0 (0.0%) | 0 (0.0%) |
| 7+ Person Households | 0 (0.0%) | 0 (0.0%) |
| Total | 154 (47.8%) | 168 (52.2%) |
Female Fertility in North Haverhill
Fertility by Age in North Haverhill
Average fertility rate in North Haverhill is 34.0 births per 1,000 women. Women in the age bracket of 20 to 34 years have the highest fertility rate with 100.0 births per 1,000 women. Women in the age bracket of 20 to 34 years acount for 100.0% of all women with births.

| Age Bracket | Women with Births | Births / 1,000 Women |
| 15 to 19 years | 0 (0.0%) | 0.0 |
| 20 to 34 years | 2 (100.0%) | 100.0 |
| 35 to 50 years | 0 (0.0%) | 0.0 |
| Total | 2 (100.0%) | 34.0 |
Fertility by Age by Marriage Status in North Haverhill
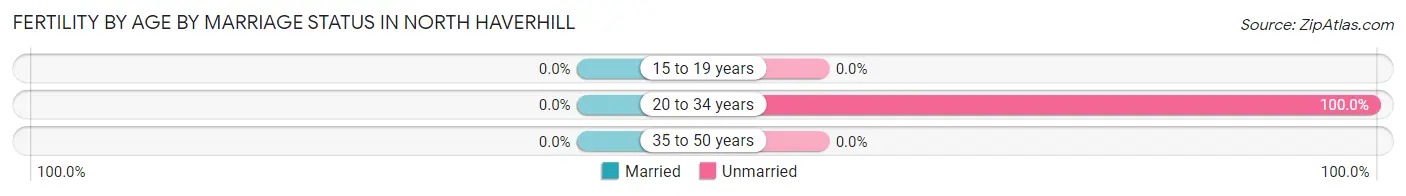
| Age Bracket | Married | Unmarried |
| 15 to 19 years | 0 (0.0%) | 0 (0.0%) |
| 20 to 34 years | 0 (0.0%) | 2 (100.0%) |
| 35 to 50 years | 0 (0.0%) | 0 (0.0%) |
| Total | 0 (0.0%) | 2 (100.0%) |
Fertility by Education in North Haverhill
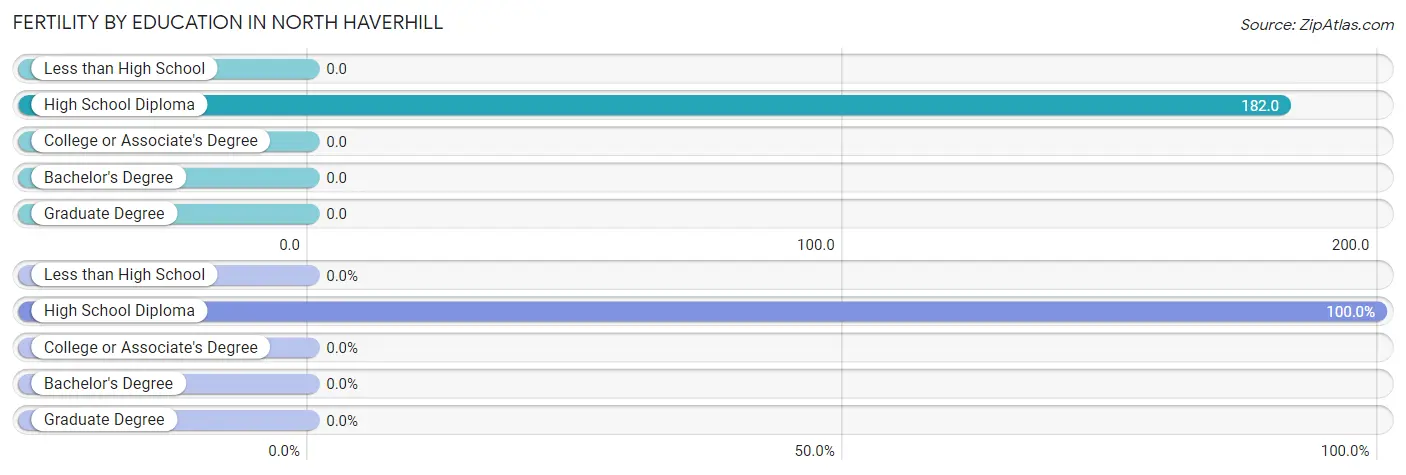
| Educational Attainment | Women with Births | Births / 1,000 Women |
| Less than High School | 0 (0.0%) | 0.0 |
| High School Diploma | 2 (100.0%) | 182.0 |
| College or Associate's Degree | 0 (0.0%) | 0.0 |
| Bachelor's Degree | 0 (0.0%) | 0.0 |
| Graduate Degree | 0 (0.0%) | 0.0 |
| Total | 2 (100.0%) | 34.0 |
Fertility by Education by Marriage Status in North Haverhill
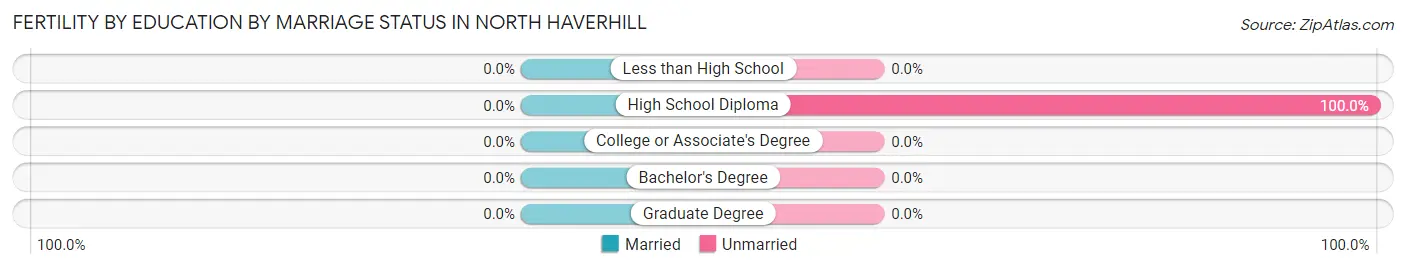
| Educational Attainment | Married | Unmarried |
| Less than High School | 0 (0.0%) | 0 (0.0%) |
| High School Diploma | 0 (0.0%) | 2 (100.0%) |
| College or Associate's Degree | 0 (0.0%) | 0 (0.0%) |
| Bachelor's Degree | 0 (0.0%) | 0 (0.0%) |
| Graduate Degree | 0 (0.0%) | 0 (0.0%) |
| Total | 0 (0.0%) | 2 (100.0%) |
Employment Characteristics in North Haverhill
Employment by Class of Employer in North Haverhill
Among the 303 employed individuals in North Haverhill, not-for-profit organizations (131 | 43.2%), private company employees (123 | 40.6%), and state government employees (21 | 6.9%) make up the most common classes of employment.
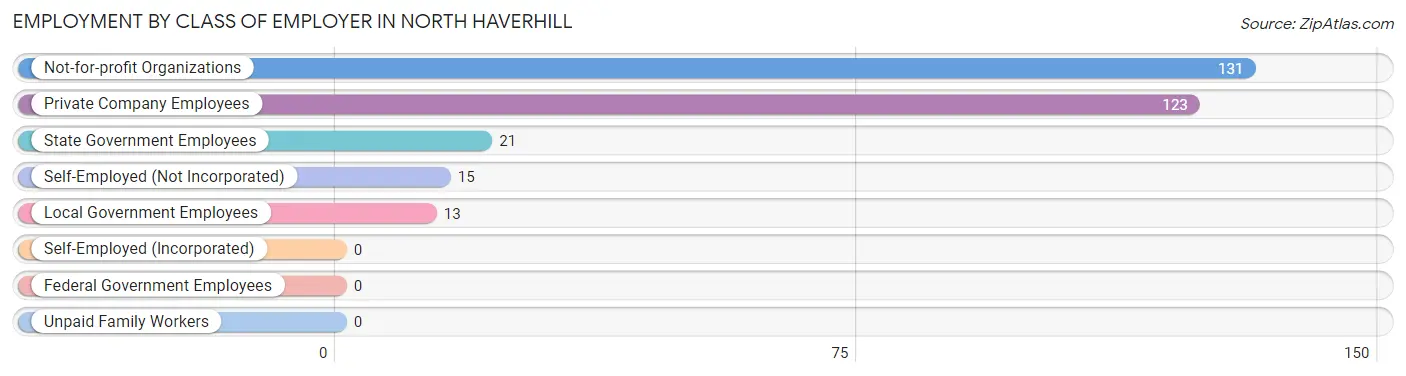
| Employer Class | # Employees | % Employees |
| Private Company Employees | 123 | 40.6% |
| Self-Employed (Incorporated) | 0 | 0.0% |
| Self-Employed (Not Incorporated) | 15 | 5.0% |
| Not-for-profit Organizations | 131 | 43.2% |
| Local Government Employees | 13 | 4.3% |
| State Government Employees | 21 | 6.9% |
| Federal Government Employees | 0 | 0.0% |
| Unpaid Family Workers | 0 | 0.0% |
| Total | 303 | 100.0% |
Employment Status by Age in North Haverhill
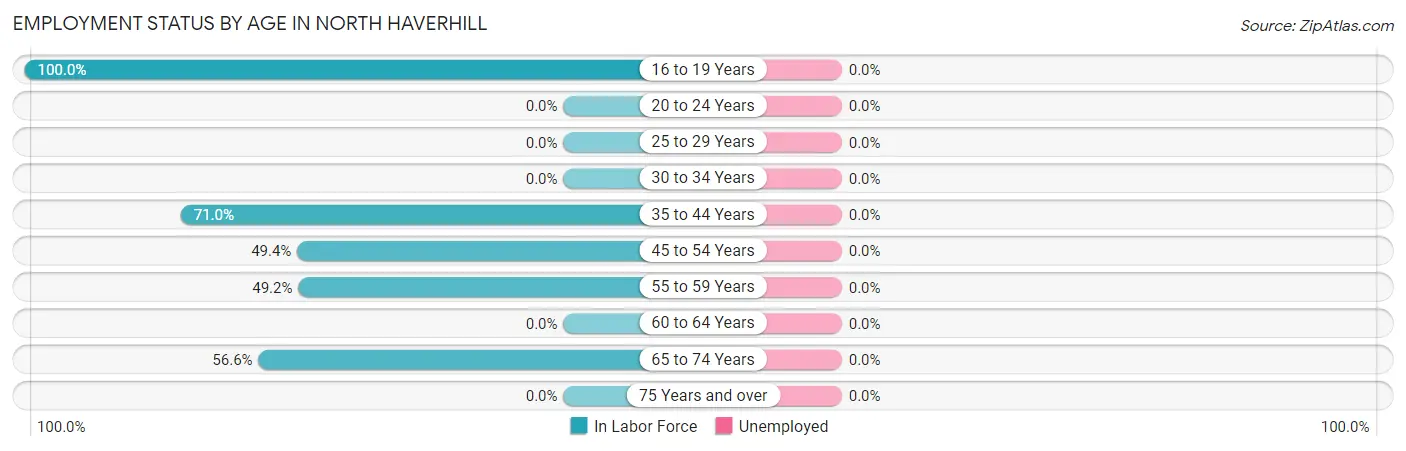
| Age Bracket | In Labor Force | Unemployed |
| 16 to 19 Years | 8 (100.0%) | 0 (0.0%) |
| 20 to 24 Years | 0 (0.0%) | 0 (0.0%) |
| 25 to 29 Years | 0 (0.0%) | 0 (0.0%) |
| 30 to 34 Years | 0 (0.0%) | 0 (0.0%) |
| 35 to 44 Years | 76 (71.0%) | 0 (0.0%) |
| 45 to 54 Years | 39 (49.4%) | 0 (0.0%) |
| 55 to 59 Years | 30 (49.2%) | 0 (0.0%) |
| 60 to 64 Years | 0 (0.0%) | 0 (0.0%) |
| 65 to 74 Years | 150 (56.6%) | 0 (0.0%) |
| 75 Years and over | 0 (0.0%) | 0 (0.0%) |
| Total | 303 (39.0%) | 0 (0.0%) |
Employment Status by Educational Attainment in North Haverhill
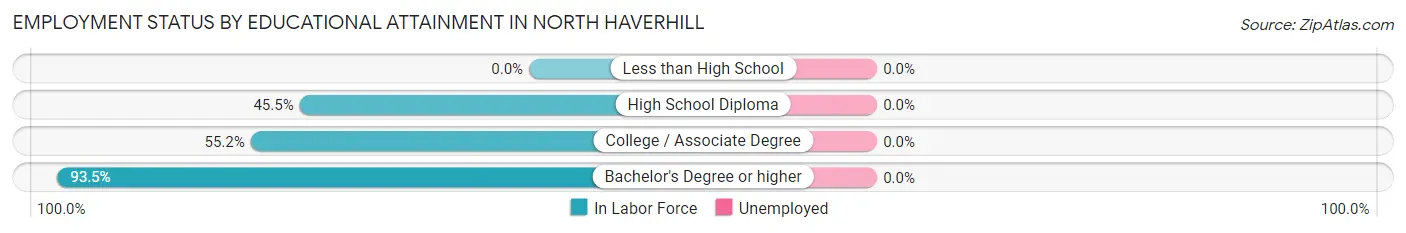
| Educational Attainment | In Labor Force | Unemployed |
| Less than High School | 0 (0.0%) | 0 (0.0%) |
| High School Diploma | 55 (45.5%) | 0 (0.0%) |
| College / Associate Degree | 32 (55.2%) | 0 (0.0%) |
| Bachelor's Degree or higher | 58 (93.5%) | 0 (0.0%) |
| Total | 145 (52.3%) | 0 (0.0%) |
Employment Occupations by Sex in North Haverhill
Management, Business, Science and Arts Occupations
The most common Management, Business, Science and Arts occupations in North Haverhill are Community & Social Service (45 | 14.8%), Management (28 | 9.2%), Education, Arts & Media (24 | 7.9%), Education Instruction & Library (21 | 6.9%), and Health Diagnosing & Treating (17 | 5.6%).
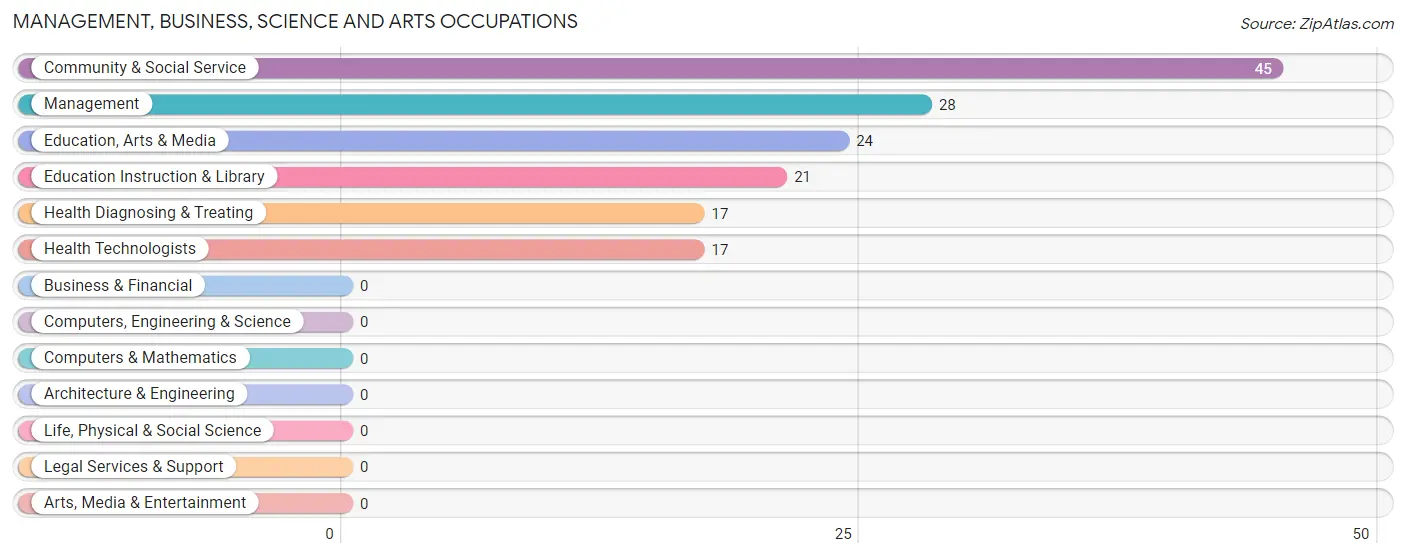
Management, Business, Science and Arts Occupations by Sex
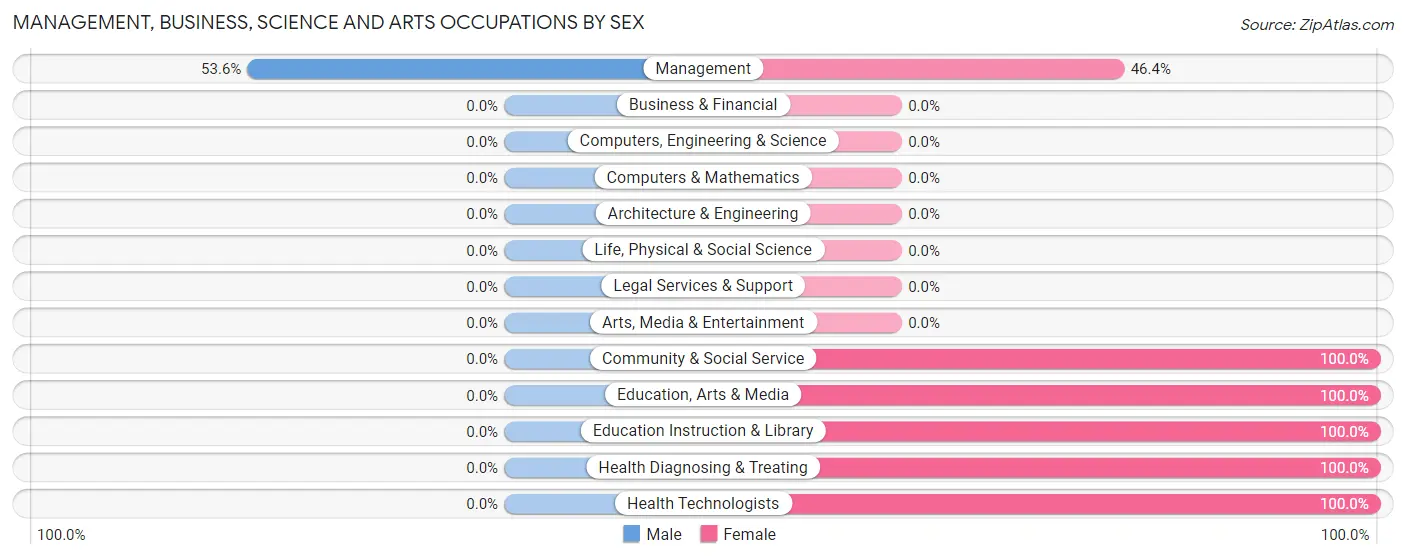
| Occupation | Male | Female |
| Management | 15 (53.6%) | 13 (46.4%) |
| Business & Financial | 0 (0.0%) | 0 (0.0%) |
| Computers, Engineering & Science | 0 (0.0%) | 0 (0.0%) |
| Computers & Mathematics | 0 (0.0%) | 0 (0.0%) |
| Architecture & Engineering | 0 (0.0%) | 0 (0.0%) |
| Life, Physical & Social Science | 0 (0.0%) | 0 (0.0%) |
| Community & Social Service | 0 (0.0%) | 45 (100.0%) |
| Education, Arts & Media | 0 (0.0%) | 24 (100.0%) |
| Legal Services & Support | 0 (0.0%) | 0 (0.0%) |
| Education Instruction & Library | 0 (0.0%) | 21 (100.0%) |
| Arts, Media & Entertainment | 0 (0.0%) | 0 (0.0%) |
| Health Diagnosing & Treating | 0 (0.0%) | 17 (100.0%) |
| Health Technologists | 0 (0.0%) | 17 (100.0%) |
| Total (Category) | 15 (16.7%) | 75 (83.3%) |
| Total (Overall) | 88 (29.0%) | 215 (71.0%) |
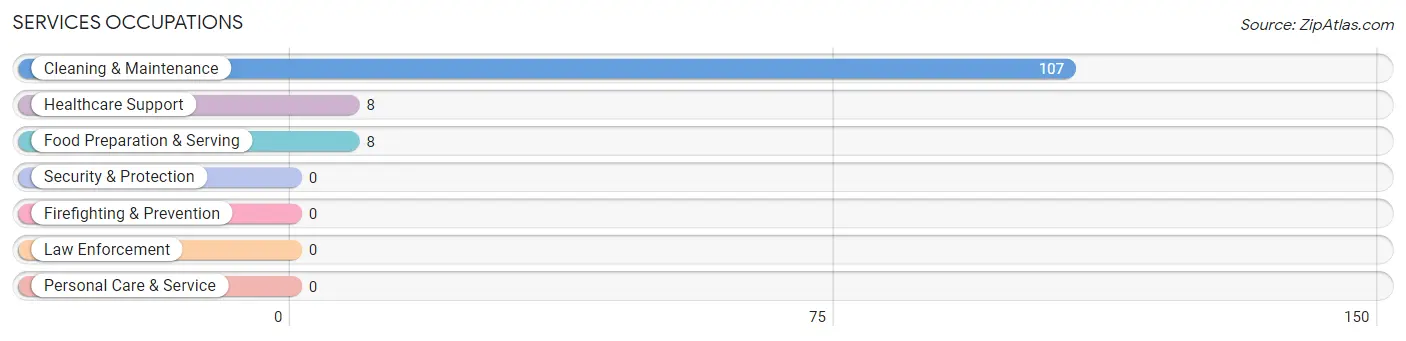
Services Occupations
The most common Services occupations in North Haverhill are Cleaning & Maintenance (107 | 35.3%), Healthcare Support (8 | 2.6%), and Food Preparation & Serving (8 | 2.6%).
Services Occupations by Sex
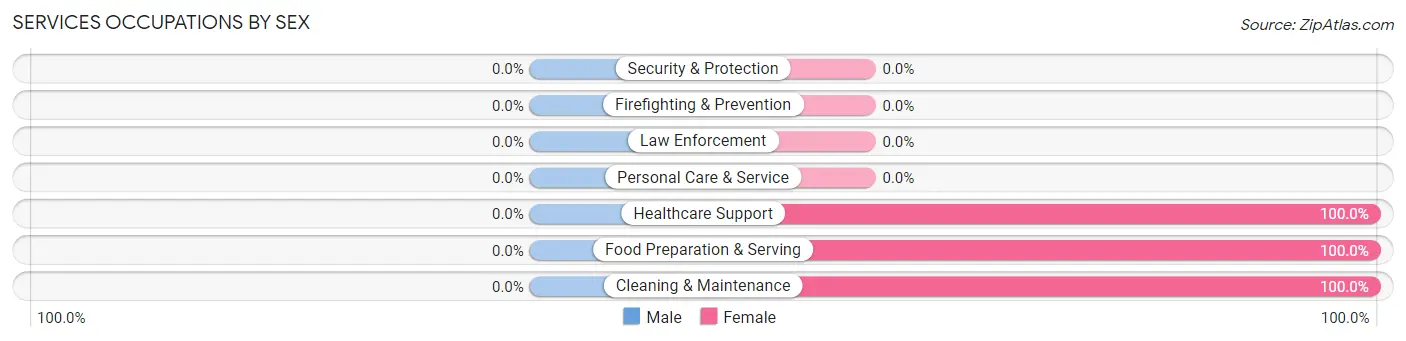
| Occupation | Male | Female |
| Healthcare Support | 0 (0.0%) | 8 (100.0%) |
| Security & Protection | 0 (0.0%) | 0 (0.0%) |
| Firefighting & Prevention | 0 (0.0%) | 0 (0.0%) |
| Law Enforcement | 0 (0.0%) | 0 (0.0%) |
| Food Preparation & Serving | 0 (0.0%) | 8 (100.0%) |
| Cleaning & Maintenance | 0 (0.0%) | 107 (100.0%) |
| Personal Care & Service | 0 (0.0%) | 0 (0.0%) |
| Total (Category) | 0 (0.0%) | 123 (100.0%) |
| Total (Overall) | 88 (29.0%) | 215 (71.0%) |
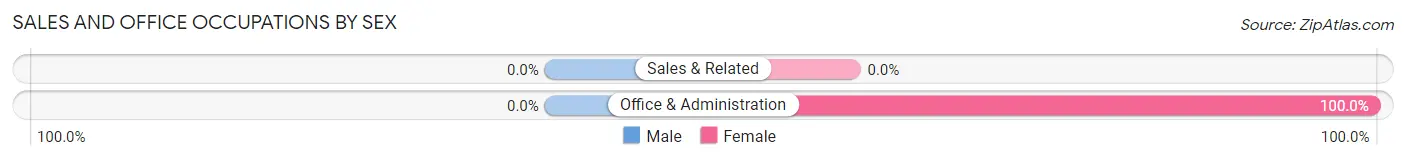
Sales and Office Occupations
The most common Sales and Office occupations in North Haverhill are , and Office & Administration (17 | 5.6%).
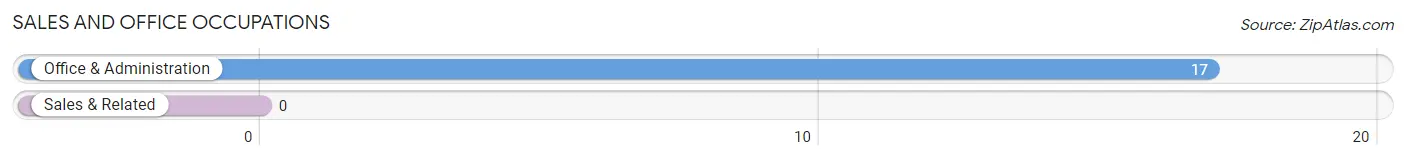
Sales and Office Occupations by Sex
| Occupation | Male | Female |
| Sales & Related | 0 (0.0%) | 0 (0.0%) |
| Office & Administration | 0 (0.0%) | 17 (100.0%) |
| Total (Category) | 0 (0.0%) | 17 (100.0%) |
| Total (Overall) | 88 (29.0%) | 215 (71.0%) |
Natural Resources, Construction and Maintenance Occupations
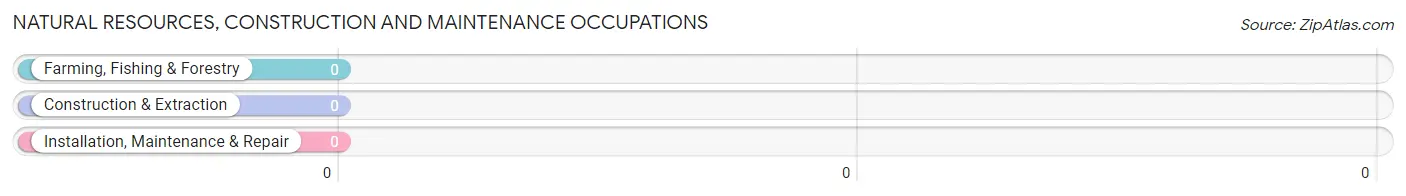
Natural Resources, Construction and Maintenance Occupations by Sex
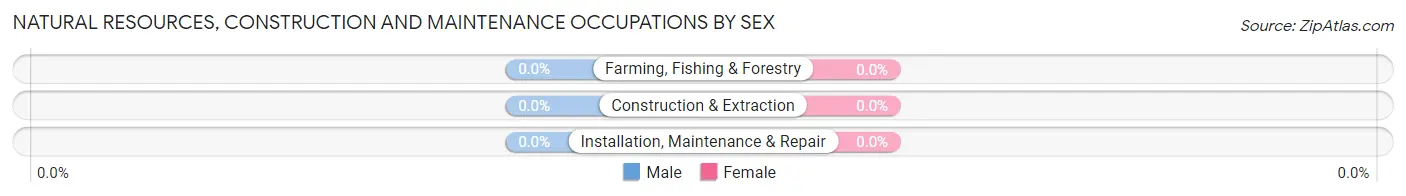
| Occupation | Male | Female |
| Farming, Fishing & Forestry | 0 (0.0%) | 0 (0.0%) |
| Construction & Extraction | 0 (0.0%) | 0 (0.0%) |
| Installation, Maintenance & Repair | 0 (0.0%) | 0 (0.0%) |
| Total (Category) | 0 (0.0%) | 0 (0.0%) |
| Total (Overall) | 88 (29.0%) | 215 (71.0%) |
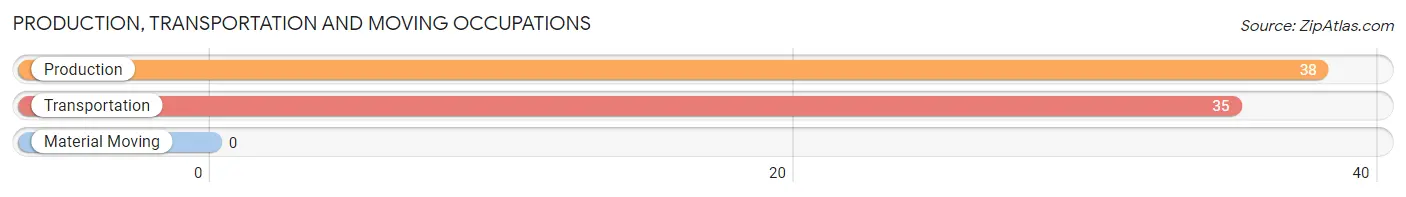
Production, Transportation and Moving Occupations
The most common Production, Transportation and Moving occupations in North Haverhill are Production (38 | 12.5%), and Transportation (35 | 11.6%).
Production, Transportation and Moving Occupations by Sex
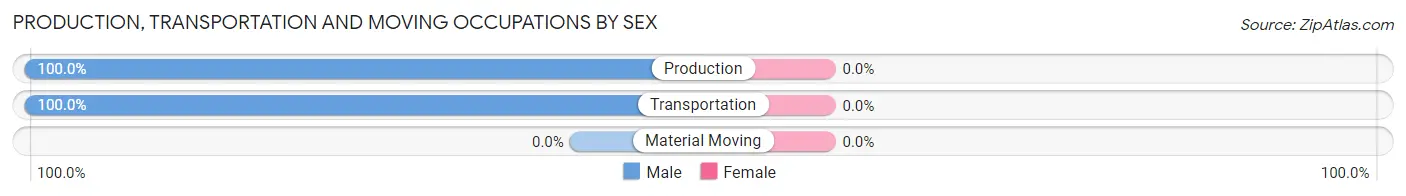
| Occupation | Male | Female |
| Production | 38 (100.0%) | 0 (0.0%) |
| Transportation | 35 (100.0%) | 0 (0.0%) |
| Material Moving | 0 (0.0%) | 0 (0.0%) |
| Total (Category) | 73 (100.0%) | 0 (0.0%) |
| Total (Overall) | 88 (29.0%) | 215 (71.0%) |
Employment Industries by Sex in North Haverhill
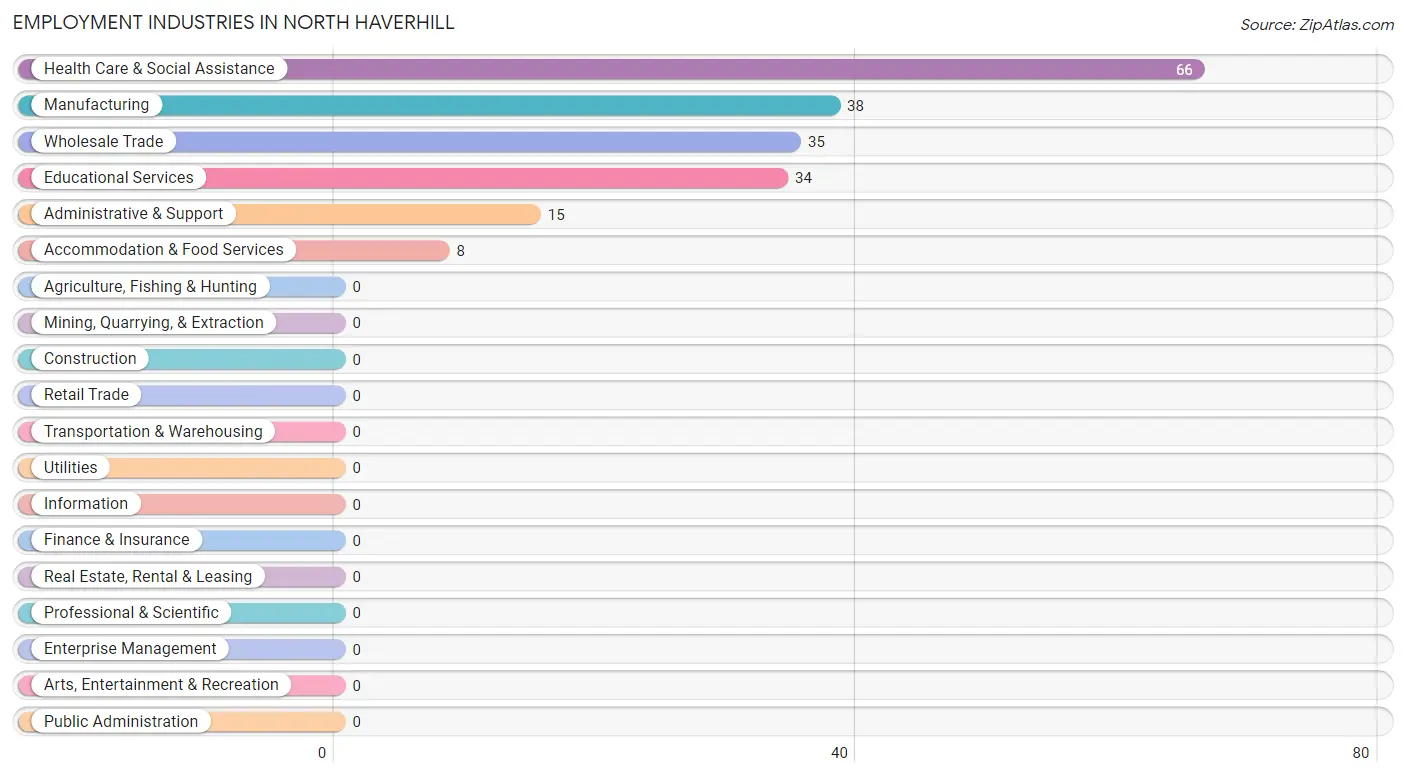
Employment Industries in North Haverhill
The major employment industries in North Haverhill include Health Care & Social Assistance (66 | 21.8%), Manufacturing (38 | 12.5%), Wholesale Trade (35 | 11.6%), Educational Services (34 | 11.2%), and Administrative & Support (15 | 5.0%).
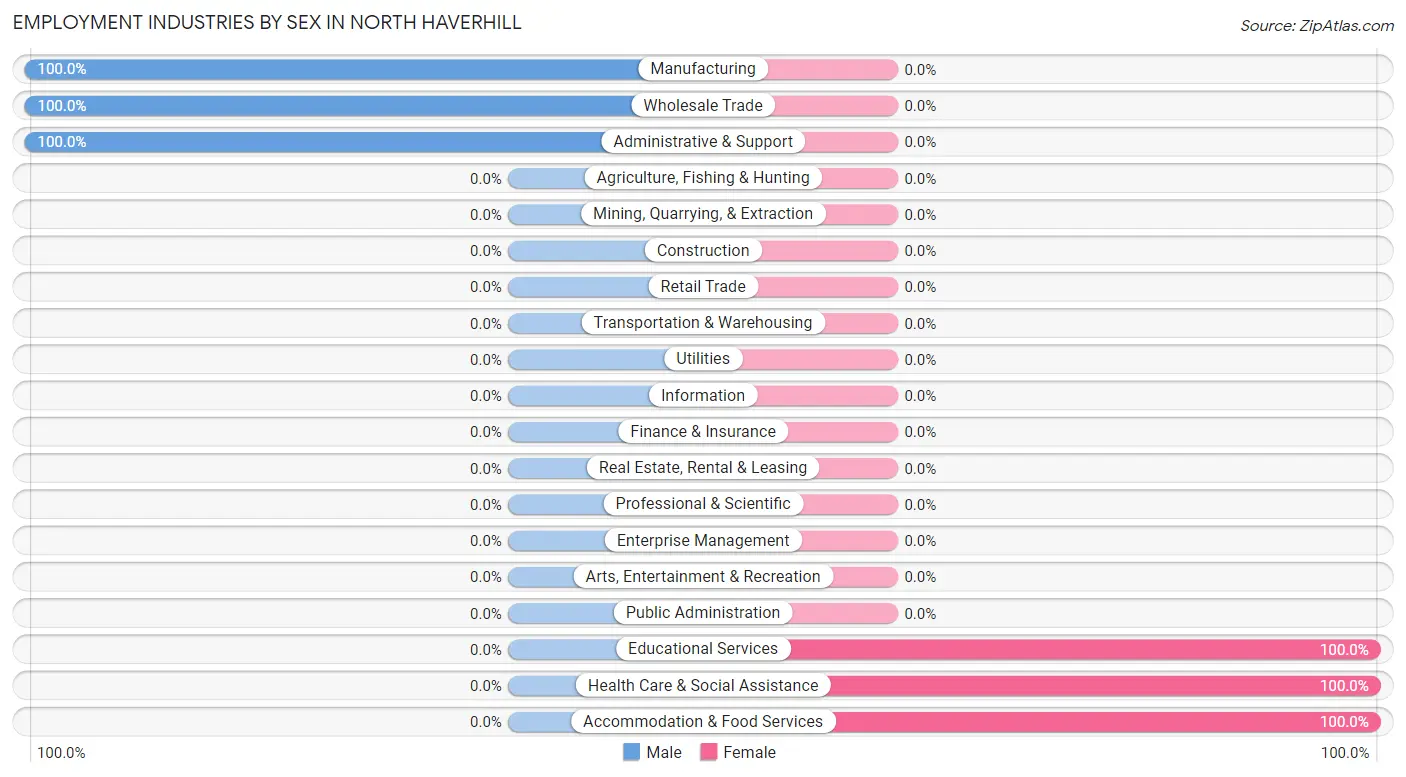
Employment Industries by Sex in North Haverhill
The North Haverhill industries that see more men than women are Manufacturing (100.0%), Wholesale Trade (100.0%), and Administrative & Support (100.0%), whereas the industries that tend to have a higher number of women are Educational Services (100.0%), Health Care & Social Assistance (100.0%), and Accommodation & Food Services (100.0%).
| Industry | Male | Female |
| Agriculture, Fishing & Hunting | 0 (0.0%) | 0 (0.0%) |
| Mining, Quarrying, & Extraction | 0 (0.0%) | 0 (0.0%) |
| Construction | 0 (0.0%) | 0 (0.0%) |
| Manufacturing | 38 (100.0%) | 0 (0.0%) |
| Wholesale Trade | 35 (100.0%) | 0 (0.0%) |
| Retail Trade | 0 (0.0%) | 0 (0.0%) |
| Transportation & Warehousing | 0 (0.0%) | 0 (0.0%) |
| Utilities | 0 (0.0%) | 0 (0.0%) |
| Information | 0 (0.0%) | 0 (0.0%) |
| Finance & Insurance | 0 (0.0%) | 0 (0.0%) |
| Real Estate, Rental & Leasing | 0 (0.0%) | 0 (0.0%) |
| Professional & Scientific | 0 (0.0%) | 0 (0.0%) |
| Enterprise Management | 0 (0.0%) | 0 (0.0%) |
| Administrative & Support | 15 (100.0%) | 0 (0.0%) |
| Educational Services | 0 (0.0%) | 34 (100.0%) |
| Health Care & Social Assistance | 0 (0.0%) | 66 (100.0%) |
| Arts, Entertainment & Recreation | 0 (0.0%) | 0 (0.0%) |
| Accommodation & Food Services | 0 (0.0%) | 8 (100.0%) |
| Public Administration | 0 (0.0%) | 0 (0.0%) |
| Total | 88 (29.0%) | 215 (71.0%) |
Education in North Haverhill
School Enrollment in North Haverhill
The most common levels of schooling among the 73 students in North Haverhill are elementary school (22 | 30.1%), middle school (20 | 27.4%), and college / undergraduate (19 | 26.0%).
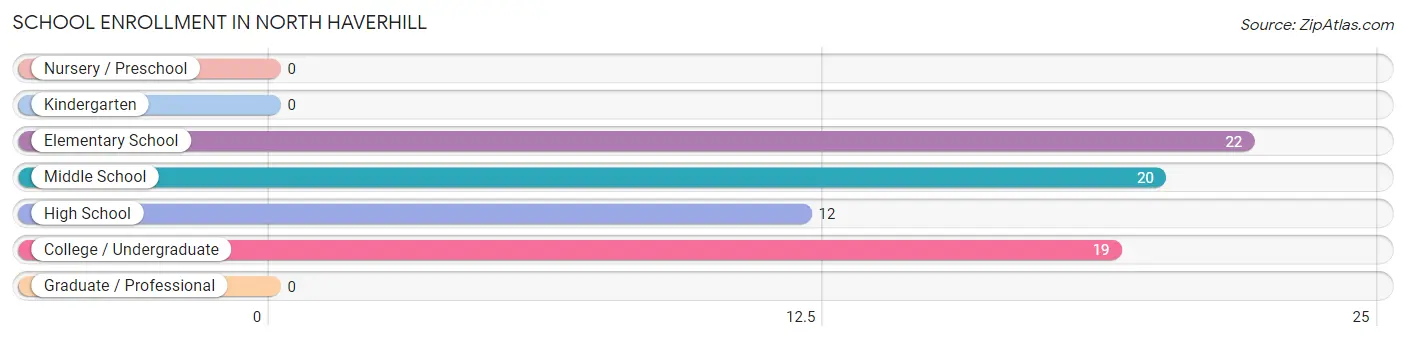
| School Level | # Students | % Students |
| Nursery / Preschool | 0 | 0.0% |
| Kindergarten | 0 | 0.0% |
| Elementary School | 22 | 30.1% |
| Middle School | 20 | 27.4% |
| High School | 12 | 16.4% |
| College / Undergraduate | 19 | 26.0% |
| Graduate / Professional | 0 | 0.0% |
| Total | 73 | 100.0% |
School Enrollment by Age by Funding Source in North Haverhill
Out of a total of 73 students who are enrolled in schools in North Haverhill, 4 (5.5%) attend a private institution, while the remaining 69 (94.5%) are enrolled in public schools. The age group of 20 to 24 year olds has the highest likelihood of being enrolled in private schools, with 2 (100.0% in the age bracket) enrolled. Conversely, the age group of 5 to 9 year old has the lowest likelihood of being enrolled in a private school, with 22 (100.0% in the age bracket) attending a public institution.
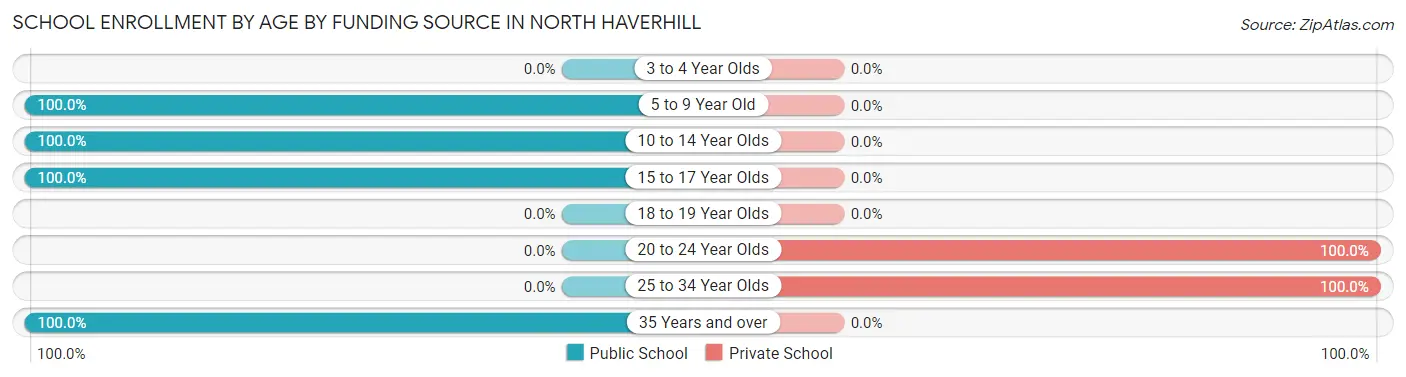
| Age Bracket | Public School | Private School |
| 3 to 4 Year Olds | 0 (0.0%) | 0 (0.0%) |
| 5 to 9 Year Old | 22 (100.0%) | 0 (0.0%) |
| 10 to 14 Year Olds | 20 (100.0%) | 0 (0.0%) |
| 15 to 17 Year Olds | 8 (100.0%) | 0 (0.0%) |
| 18 to 19 Year Olds | 0 (0.0%) | 0 (0.0%) |
| 20 to 24 Year Olds | 0 (0.0%) | 2 (100.0%) |
| 25 to 34 Year Olds | 0 (0.0%) | 2 (100.0%) |
| 35 Years and over | 19 (100.0%) | 0 (0.0%) |
| Total | 69 (94.5%) | 4 (5.5%) |
Educational Attainment by Field of Study in North Haverhill
Education (47 | 64.4%), literature & languages (24 | 32.9%), and psychology (2 | 2.7%) are the most common fields of study among 73 individuals in North Haverhill who have obtained a bachelor's degree or higher.
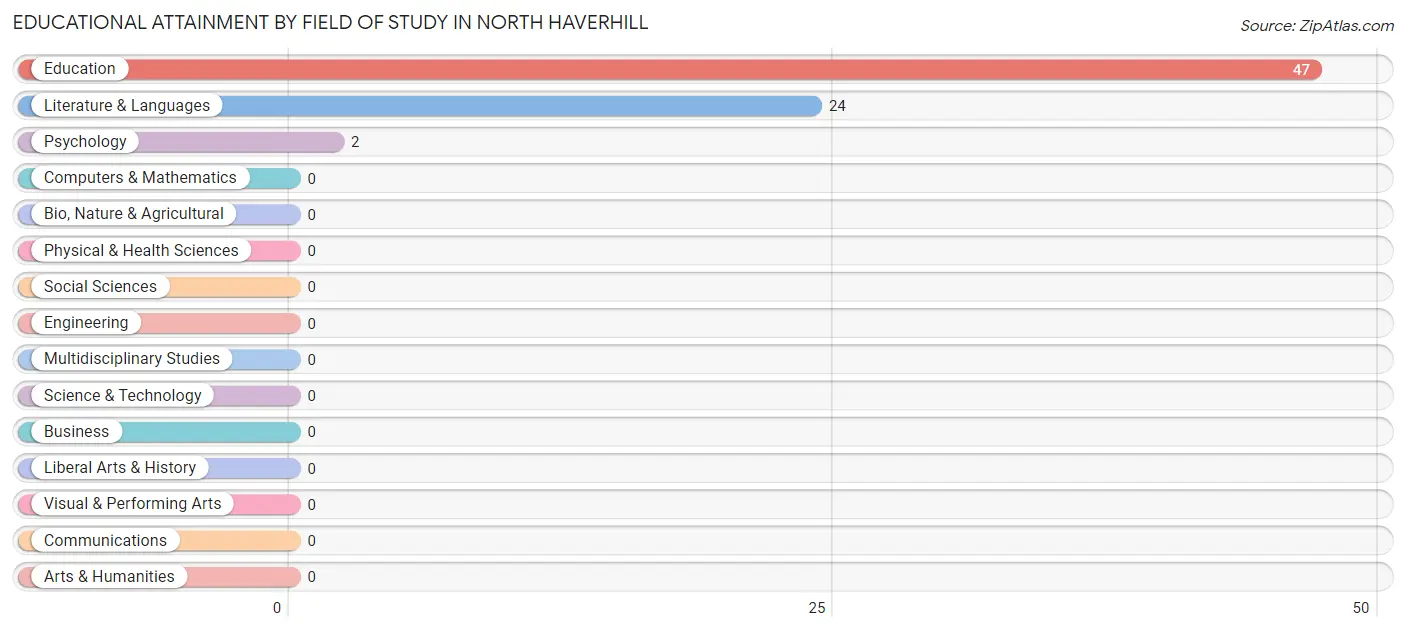
| Field of Study | # Graduates | % Graduates |
| Computers & Mathematics | 0 | 0.0% |
| Bio, Nature & Agricultural | 0 | 0.0% |
| Physical & Health Sciences | 0 | 0.0% |
| Psychology | 2 | 2.7% |
| Social Sciences | 0 | 0.0% |
| Engineering | 0 | 0.0% |
| Multidisciplinary Studies | 0 | 0.0% |
| Science & Technology | 0 | 0.0% |
| Business | 0 | 0.0% |
| Education | 47 | 64.4% |
| Literature & Languages | 24 | 32.9% |
| Liberal Arts & History | 0 | 0.0% |
| Visual & Performing Arts | 0 | 0.0% |
| Communications | 0 | 0.0% |
| Arts & Humanities | 0 | 0.0% |
| Total | 73 | 100.0% |
Transportation & Commute in North Haverhill
Vehicle Availability by Sex in North Haverhill
The most prevalent vehicle ownership categories in North Haverhill are males with 3 vehicles (50, accounting for 56.8%) and females with 3 vehicles (8, making up 23.3%).
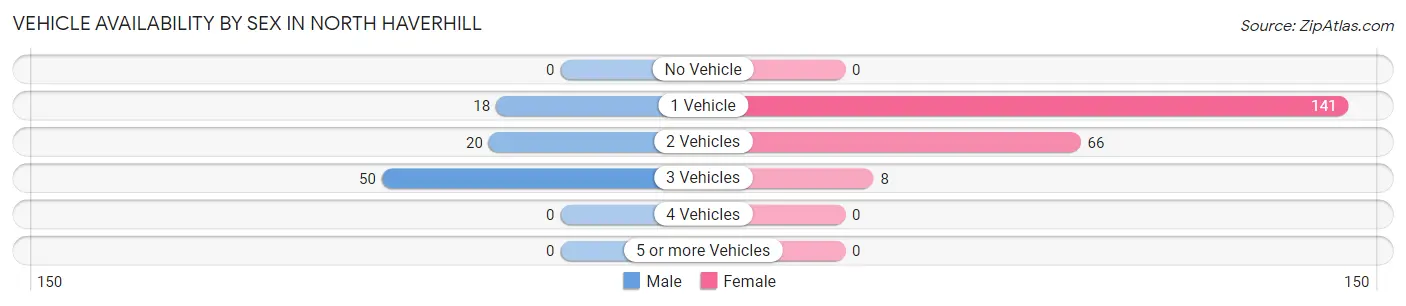
| Vehicles Available | Male | Female |
| No Vehicle | 0 (0.0%) | 0 (0.0%) |
| 1 Vehicle | 18 (20.4%) | 141 (65.6%) |
| 2 Vehicles | 20 (22.7%) | 66 (30.7%) |
| 3 Vehicles | 50 (56.8%) | 8 (3.7%) |
| 4 Vehicles | 0 (0.0%) | 0 (0.0%) |
| 5 or more Vehicles | 0 (0.0%) | 0 (0.0%) |
| Total | 88 (100.0%) | 215 (100.0%) |
Commute Time in North Haverhill
The most frequently occuring commute durations in North Haverhill are 10 to 14 minutes (124 commuters, 40.9%), less than 5 minutes (70 commuters, 23.1%), and 15 to 19 minutes (55 commuters, 18.1%).
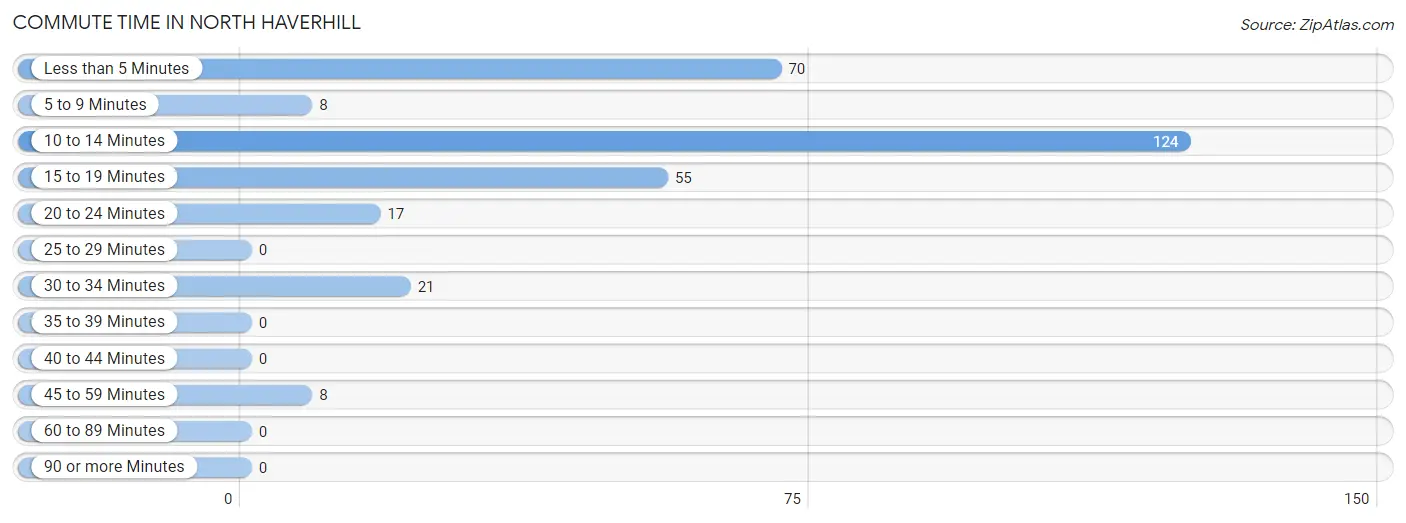
| Commute Time | # Commuters | % Commuters |
| Less than 5 Minutes | 70 | 23.1% |
| 5 to 9 Minutes | 8 | 2.6% |
| 10 to 14 Minutes | 124 | 40.9% |
| 15 to 19 Minutes | 55 | 18.1% |
| 20 to 24 Minutes | 17 | 5.6% |
| 25 to 29 Minutes | 0 | 0.0% |
| 30 to 34 Minutes | 21 | 6.9% |
| 35 to 39 Minutes | 0 | 0.0% |
| 40 to 44 Minutes | 0 | 0.0% |
| 45 to 59 Minutes | 8 | 2.6% |
| 60 to 89 Minutes | 0 | 0.0% |
| 90 or more Minutes | 0 | 0.0% |
Commute Time by Sex in North Haverhill
The most common commute times in North Haverhill are less than 5 minutes (70 commuters, 79.5%) for males and 10 to 14 minutes (124 commuters, 57.7%) for females.
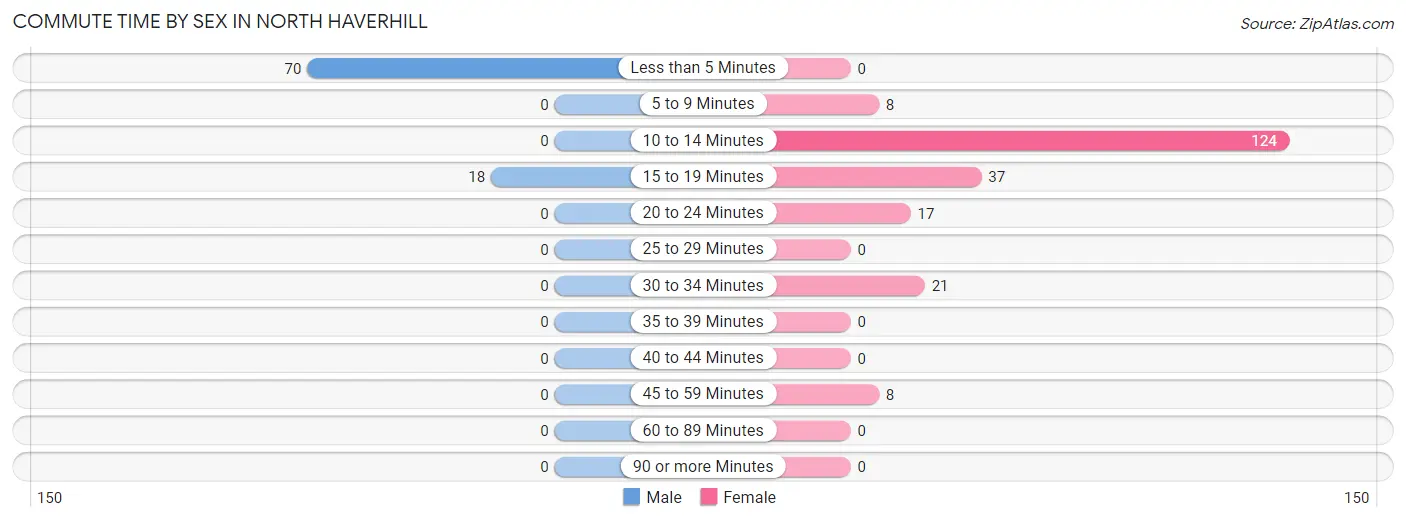
| Commute Time | Male | Female |
| Less than 5 Minutes | 70 (79.5%) | 0 (0.0%) |
| 5 to 9 Minutes | 0 (0.0%) | 8 (3.7%) |
| 10 to 14 Minutes | 0 (0.0%) | 124 (57.7%) |
| 15 to 19 Minutes | 18 (20.4%) | 37 (17.2%) |
| 20 to 24 Minutes | 0 (0.0%) | 17 (7.9%) |
| 25 to 29 Minutes | 0 (0.0%) | 0 (0.0%) |
| 30 to 34 Minutes | 0 (0.0%) | 21 (9.8%) |
| 35 to 39 Minutes | 0 (0.0%) | 0 (0.0%) |
| 40 to 44 Minutes | 0 (0.0%) | 0 (0.0%) |
| 45 to 59 Minutes | 0 (0.0%) | 8 (3.7%) |
| 60 to 89 Minutes | 0 (0.0%) | 0 (0.0%) |
| 90 or more Minutes | 0 (0.0%) | 0 (0.0%) |
Time of Departure to Work by Sex in North Haverhill
The most frequent times of departure to work in North Haverhill are 6:00 AM to 6:29 AM (68, 77.3%) for males and 11:00 AM to 11:59 AM (115, 53.5%) for females.
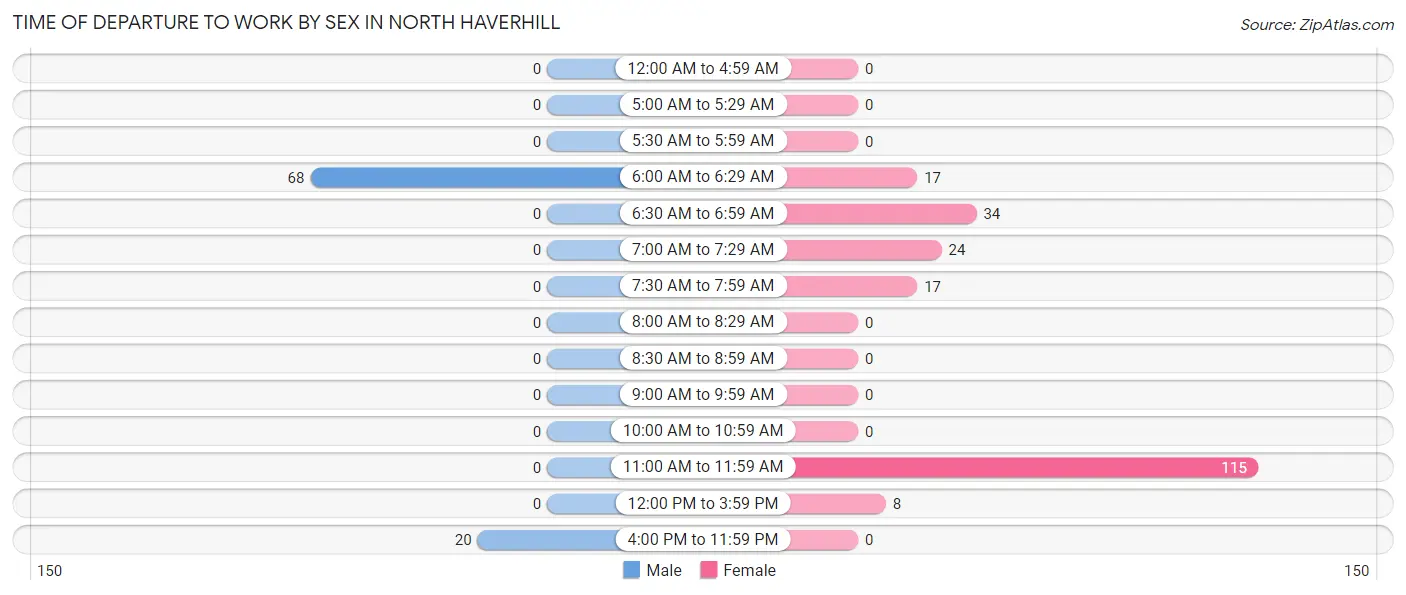
| Time of Departure | Male | Female |
| 12:00 AM to 4:59 AM | 0 (0.0%) | 0 (0.0%) |
| 5:00 AM to 5:29 AM | 0 (0.0%) | 0 (0.0%) |
| 5:30 AM to 5:59 AM | 0 (0.0%) | 0 (0.0%) |
| 6:00 AM to 6:29 AM | 68 (77.3%) | 17 (7.9%) |
| 6:30 AM to 6:59 AM | 0 (0.0%) | 34 (15.8%) |
| 7:00 AM to 7:29 AM | 0 (0.0%) | 24 (11.2%) |
| 7:30 AM to 7:59 AM | 0 (0.0%) | 17 (7.9%) |
| 8:00 AM to 8:29 AM | 0 (0.0%) | 0 (0.0%) |
| 8:30 AM to 8:59 AM | 0 (0.0%) | 0 (0.0%) |
| 9:00 AM to 9:59 AM | 0 (0.0%) | 0 (0.0%) |
| 10:00 AM to 10:59 AM | 0 (0.0%) | 0 (0.0%) |
| 11:00 AM to 11:59 AM | 0 (0.0%) | 115 (53.5%) |
| 12:00 PM to 3:59 PM | 0 (0.0%) | 8 (3.7%) |
| 4:00 PM to 11:59 PM | 20 (22.7%) | 0 (0.0%) |
| Total | 88 (100.0%) | 215 (100.0%) |
Housing Occupancy in North Haverhill
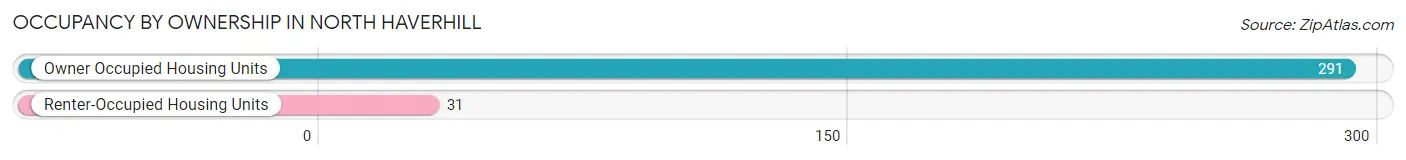
Occupancy by Ownership in North Haverhill
Of the total 322 dwellings in North Haverhill, owner-occupied units account for 291 (90.4%), while renter-occupied units make up 31 (9.6%).
| Occupancy | # Housing Units | % Housing Units |
| Owner Occupied Housing Units | 291 | 90.4% |
| Renter-Occupied Housing Units | 31 | 9.6% |
| Total Occupied Housing Units | 322 | 100.0% |
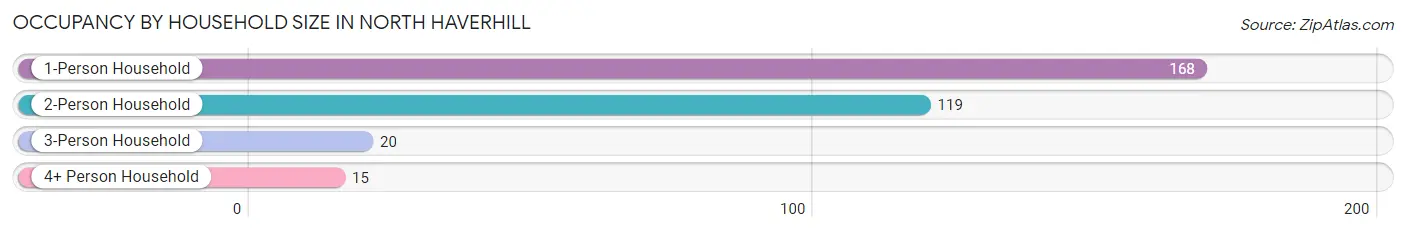
Occupancy by Household Size in North Haverhill
| Household Size | # Housing Units | % Housing Units |
| 1-Person Household | 168 | 52.2% |
| 2-Person Household | 119 | 37.0% |
| 3-Person Household | 20 | 6.2% |
| 4+ Person Household | 15 | 4.7% |
| Total Housing Units | 322 | 100.0% |
Occupancy by Ownership by Household Size in North Haverhill
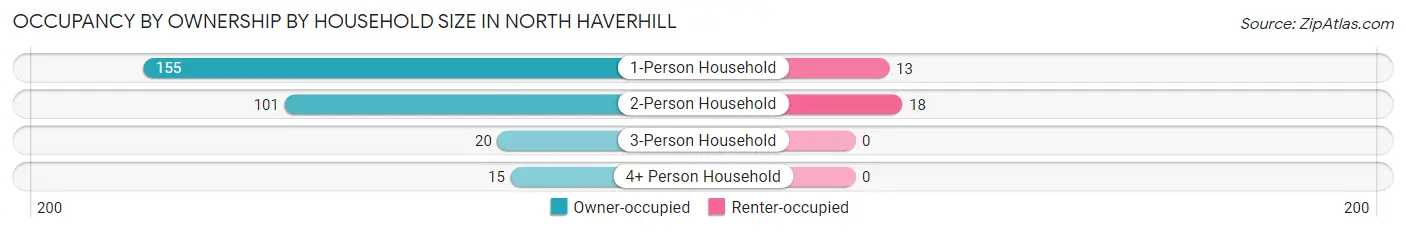
| Household Size | Owner-occupied | Renter-occupied |
| 1-Person Household | 155 (92.3%) | 13 (7.7%) |
| 2-Person Household | 101 (84.9%) | 18 (15.1%) |
| 3-Person Household | 20 (100.0%) | 0 (0.0%) |
| 4+ Person Household | 15 (100.0%) | 0 (0.0%) |
| Total Housing Units | 291 (90.4%) | 31 (9.6%) |
Occupancy by Educational Attainment in North Haverhill
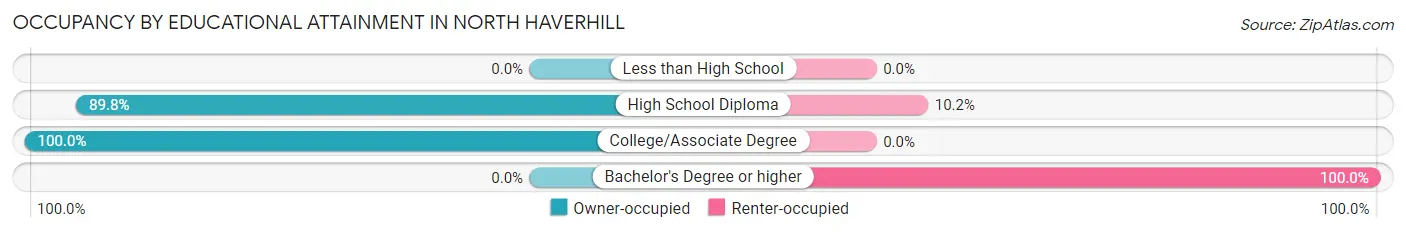
| Household Size | Owner-occupied | Renter-occupied |
| Less than High School | 0 (0.0%) | 0 (0.0%) |
| High School Diploma | 158 (89.8%) | 18 (10.2%) |
| College/Associate Degree | 133 (100.0%) | 0 (0.0%) |
| Bachelor's Degree or higher | 0 (0.0%) | 13 (100.0%) |
Occupancy by Age of Householder in North Haverhill
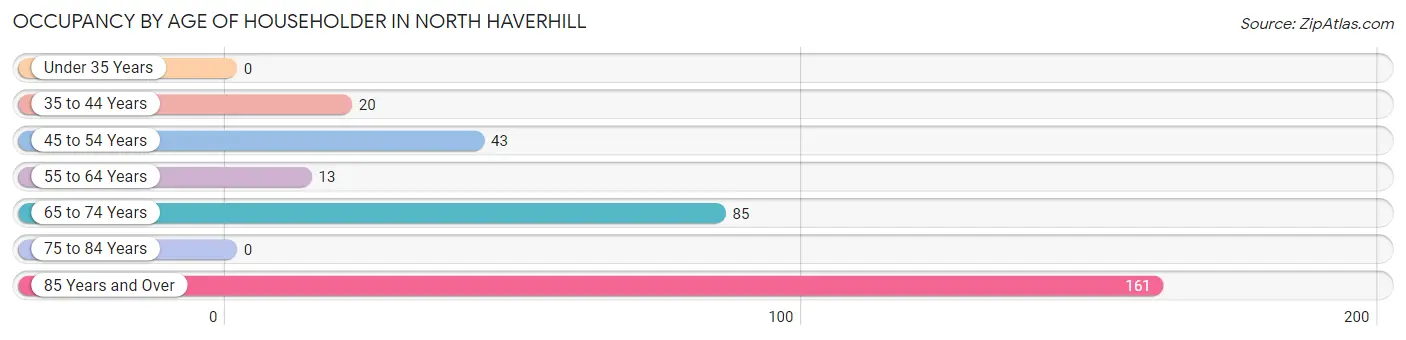
| Age Bracket | # Households | % Households |
| Under 35 Years | 0 | 0.0% |
| 35 to 44 Years | 20 | 6.2% |
| 45 to 54 Years | 43 | 13.4% |
| 55 to 64 Years | 13 | 4.0% |
| 65 to 74 Years | 85 | 26.4% |
| 75 to 84 Years | 0 | 0.0% |
| 85 Years and Over | 161 | 50.0% |
| Total | 322 | 100.0% |
Housing Finances in North Haverhill
Median Income by Occupancy in North Haverhill
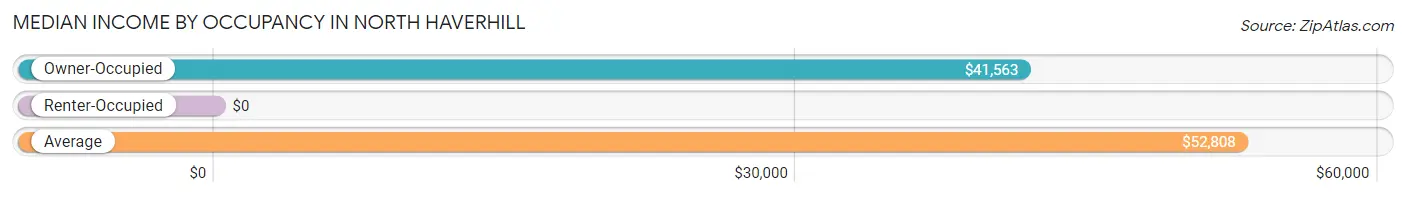
| Occupancy Type | # Households | Median Income |
| Owner-Occupied | 291 (90.4%) | $41,563 |
| Renter-Occupied | 31 (9.6%) | $0 |
| Average | 322 (100.0%) | $52,808 |
Occupancy by Householder Income Bracket in North Haverhill
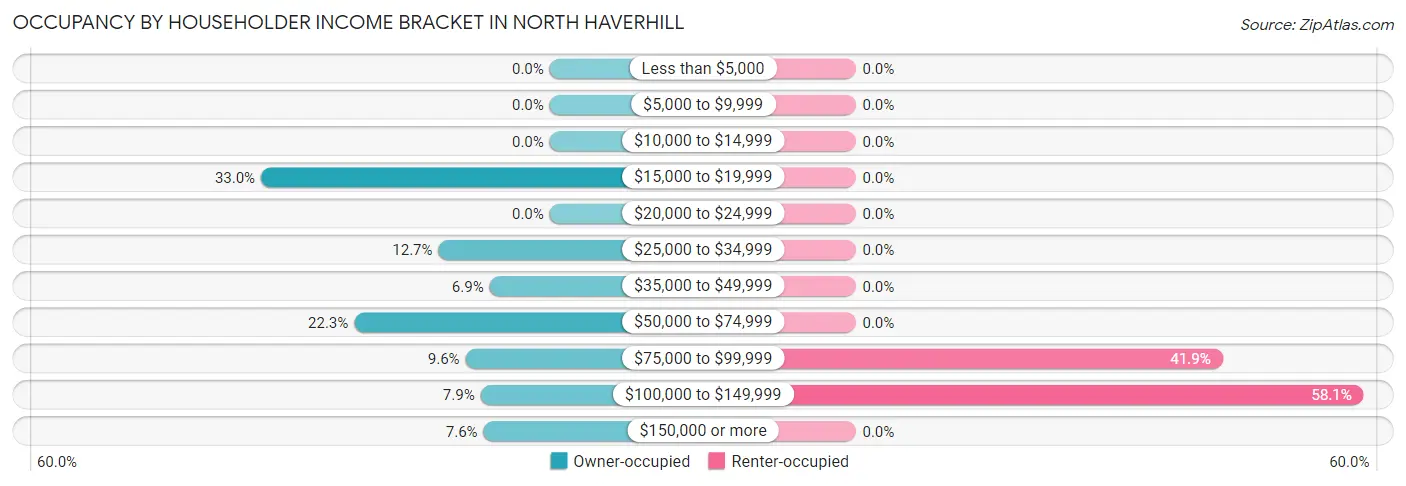
| Income Bracket | Owner-occupied | Renter-occupied |
| Less than $5,000 | 0 (0.0%) | 0 (0.0%) |
| $5,000 to $9,999 | 0 (0.0%) | 0 (0.0%) |
| $10,000 to $14,999 | 0 (0.0%) | 0 (0.0%) |
| $15,000 to $19,999 | 96 (33.0%) | 0 (0.0%) |
| $20,000 to $24,999 | 0 (0.0%) | 0 (0.0%) |
| $25,000 to $34,999 | 37 (12.7%) | 0 (0.0%) |
| $35,000 to $49,999 | 20 (6.9%) | 0 (0.0%) |
| $50,000 to $74,999 | 65 (22.3%) | 0 (0.0%) |
| $75,000 to $99,999 | 28 (9.6%) | 13 (41.9%) |
| $100,000 to $149,999 | 23 (7.9%) | 18 (58.1%) |
| $150,000 or more | 22 (7.6%) | 0 (0.0%) |
| Total | 291 (100.0%) | 31 (100.0%) |
Monthly Housing Cost Tiers in North Haverhill
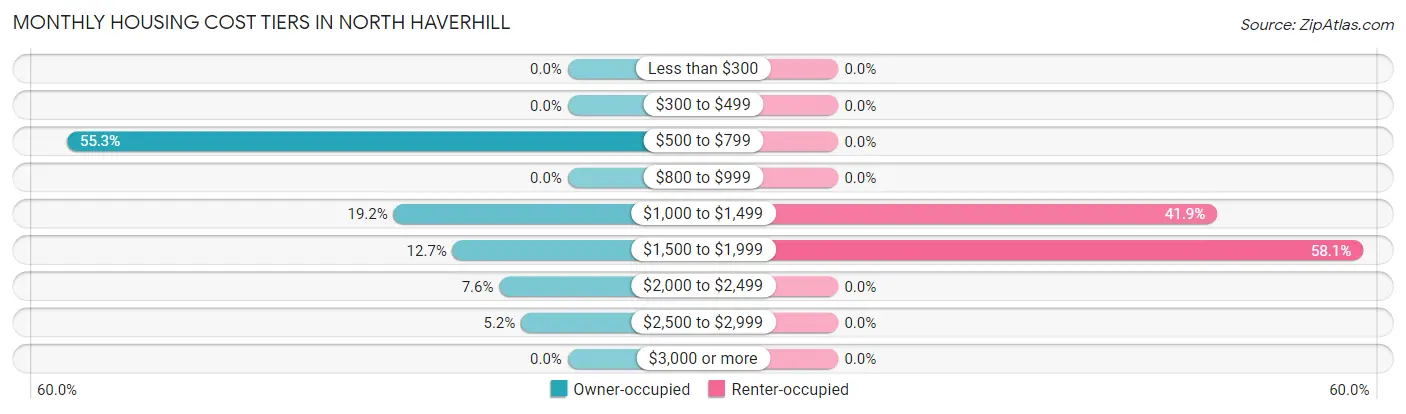
| Monthly Cost | Owner-occupied | Renter-occupied |
| Less than $300 | 0 (0.0%) | 0 (0.0%) |
| $300 to $499 | 0 (0.0%) | 0 (0.0%) |
| $500 to $799 | 161 (55.3%) | 0 (0.0%) |
| $800 to $999 | 0 (0.0%) | 0 (0.0%) |
| $1,000 to $1,499 | 56 (19.2%) | 13 (41.9%) |
| $1,500 to $1,999 | 37 (12.7%) | 18 (58.1%) |
| $2,000 to $2,499 | 22 (7.6%) | 0 (0.0%) |
| $2,500 to $2,999 | 15 (5.1%) | 0 (0.0%) |
| $3,000 or more | 0 (0.0%) | 0 (0.0%) |
| Total | 291 (100.0%) | 31 (100.0%) |
Physical Housing Characteristics in North Haverhill
Housing Structures in North Haverhill
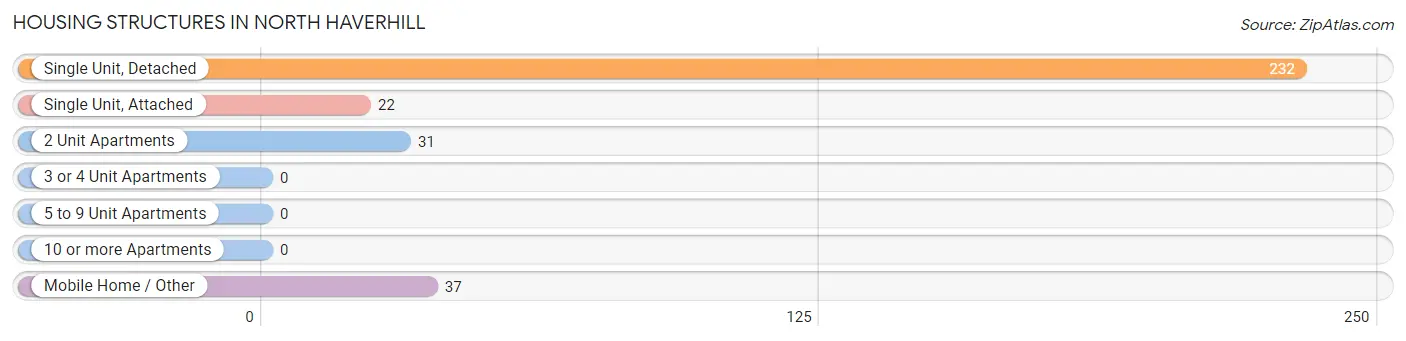
| Structure Type | # Housing Units | % Housing Units |
| Single Unit, Detached | 232 | 72.1% |
| Single Unit, Attached | 22 | 6.8% |
| 2 Unit Apartments | 31 | 9.6% |
| 3 or 4 Unit Apartments | 0 | 0.0% |
| 5 to 9 Unit Apartments | 0 | 0.0% |
| 10 or more Apartments | 0 | 0.0% |
| Mobile Home / Other | 37 | 11.5% |
| Total | 322 | 100.0% |
Housing Structures by Occupancy in North Haverhill
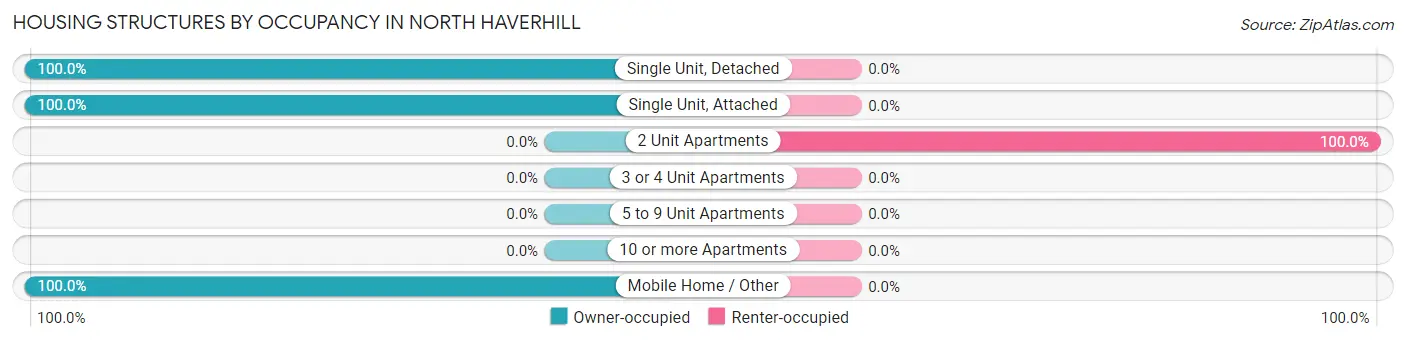
| Structure Type | Owner-occupied | Renter-occupied |
| Single Unit, Detached | 232 (100.0%) | 0 (0.0%) |
| Single Unit, Attached | 22 (100.0%) | 0 (0.0%) |
| 2 Unit Apartments | 0 (0.0%) | 31 (100.0%) |
| 3 or 4 Unit Apartments | 0 (0.0%) | 0 (0.0%) |
| 5 to 9 Unit Apartments | 0 (0.0%) | 0 (0.0%) |
| 10 or more Apartments | 0 (0.0%) | 0 (0.0%) |
| Mobile Home / Other | 37 (100.0%) | 0 (0.0%) |
| Total | 291 (90.4%) | 31 (9.6%) |
Housing Structures by Number of Rooms in North Haverhill
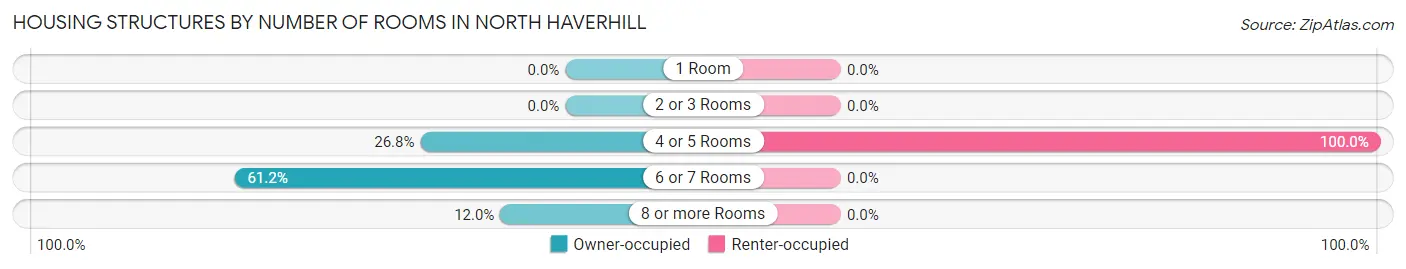
| Number of Rooms | Owner-occupied | Renter-occupied |
| 1 Room | 0 (0.0%) | 0 (0.0%) |
| 2 or 3 Rooms | 0 (0.0%) | 0 (0.0%) |
| 4 or 5 Rooms | 78 (26.8%) | 31 (100.0%) |
| 6 or 7 Rooms | 178 (61.2%) | 0 (0.0%) |
| 8 or more Rooms | 35 (12.0%) | 0 (0.0%) |
| Total | 291 (100.0%) | 31 (100.0%) |
Housing Structure by Heating Type in North Haverhill
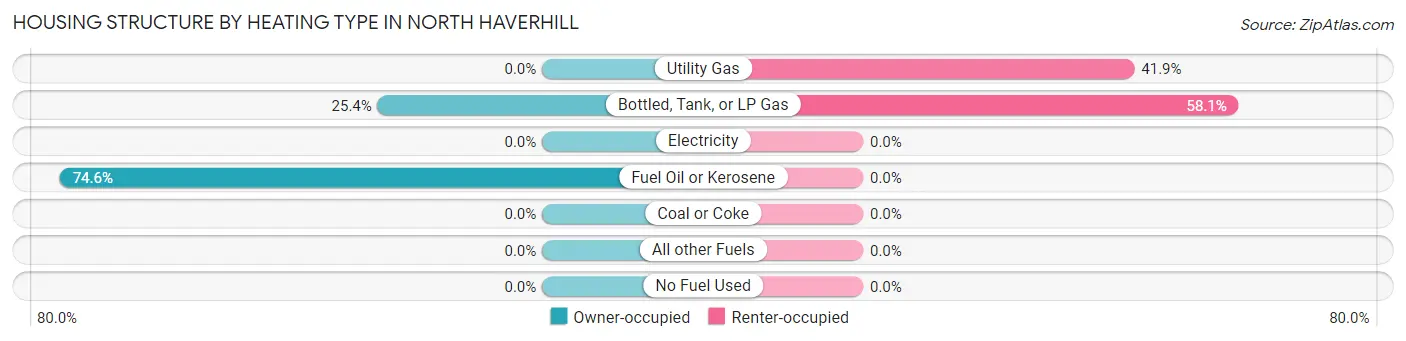
| Heating Type | Owner-occupied | Renter-occupied |
| Utility Gas | 0 (0.0%) | 13 (41.9%) |
| Bottled, Tank, or LP Gas | 74 (25.4%) | 18 (58.1%) |
| Electricity | 0 (0.0%) | 0 (0.0%) |
| Fuel Oil or Kerosene | 217 (74.6%) | 0 (0.0%) |
| Coal or Coke | 0 (0.0%) | 0 (0.0%) |
| All other Fuels | 0 (0.0%) | 0 (0.0%) |
| No Fuel Used | 0 (0.0%) | 0 (0.0%) |
| Total | 291 (100.0%) | 31 (100.0%) |
Household Vehicle Usage in North Haverhill
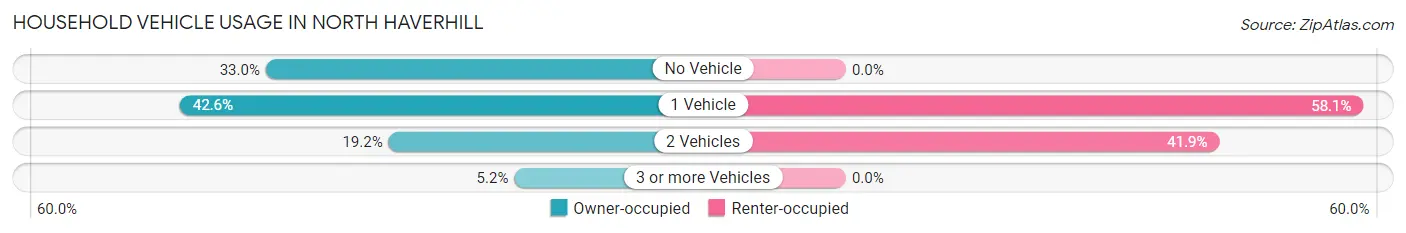
| Vehicles per Household | Owner-occupied | Renter-occupied |
| No Vehicle | 96 (33.0%) | 0 (0.0%) |
| 1 Vehicle | 124 (42.6%) | 18 (58.1%) |
| 2 Vehicles | 56 (19.2%) | 13 (41.9%) |
| 3 or more Vehicles | 15 (5.1%) | 0 (0.0%) |
| Total | 291 (100.0%) | 31 (100.0%) |
Real Estate & Mortgages in North Haverhill
Real Estate and Mortgage Overview in North Haverhill
| Characteristic | Without Mortgage | With Mortgage |
| Housing Units | 181 | 110 |
| Median Property Value | $185,900 | $267,900 |
| Median Household Income | - | - |
| Monthly Housing Costs | $756 | $0 |
| Real Estate Taxes | $5,143 | $0 |
Property Value by Mortgage Status in North Haverhill
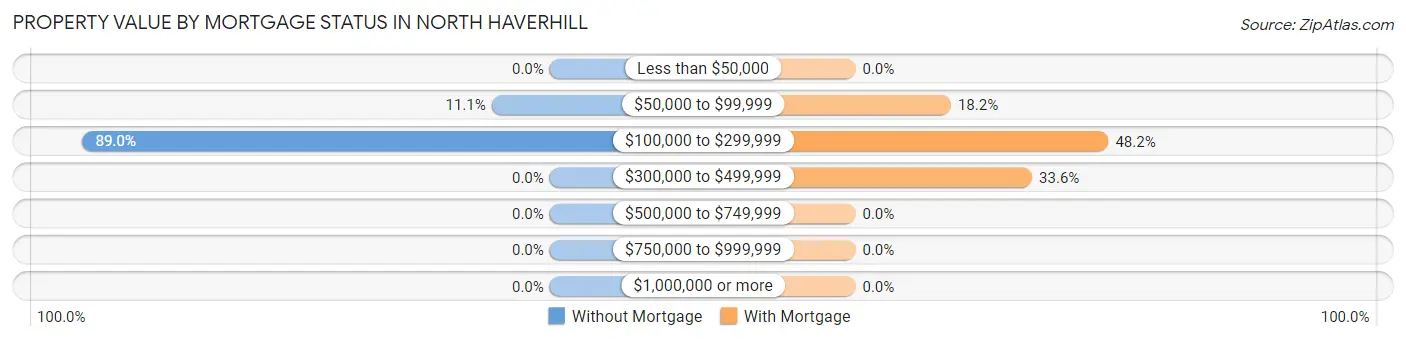
| Property Value | Without Mortgage | With Mortgage |
| Less than $50,000 | 0 (0.0%) | 0 (0.0%) |
| $50,000 to $99,999 | 20 (11.1%) | 20 (18.2%) |
| $100,000 to $299,999 | 161 (88.9%) | 53 (48.2%) |
| $300,000 to $499,999 | 0 (0.0%) | 37 (33.6%) |
| $500,000 to $749,999 | 0 (0.0%) | 0 (0.0%) |
| $750,000 to $999,999 | 0 (0.0%) | 0 (0.0%) |
| $1,000,000 or more | 0 (0.0%) | 0 (0.0%) |
| Total | 181 (100.0%) | 110 (100.0%) |
Household Income by Mortgage Status in North Haverhill
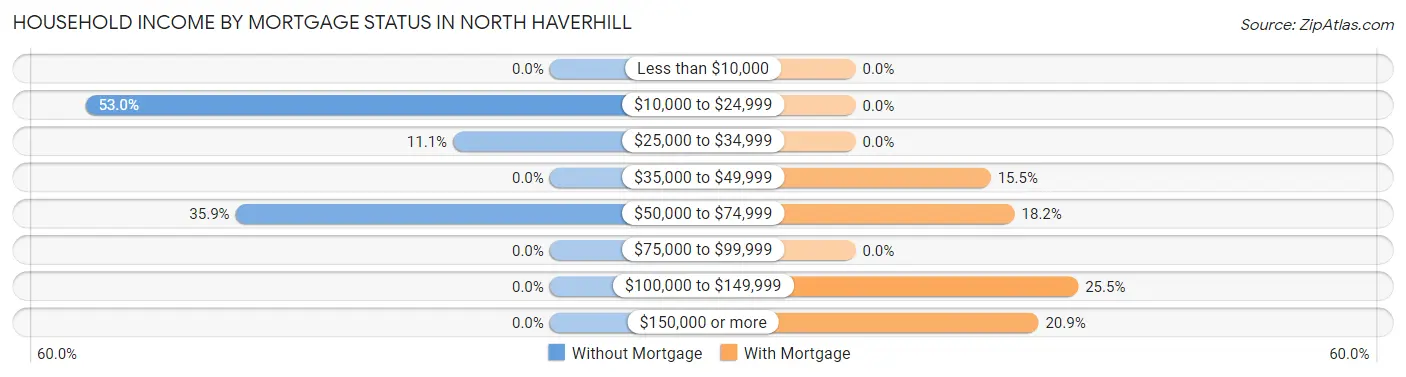
| Household Income | Without Mortgage | With Mortgage |
| Less than $10,000 | 0 (0.0%) | 0 (0.0%) |
| $10,000 to $24,999 | 96 (53.0%) | 0 (0.0%) |
| $25,000 to $34,999 | 20 (11.1%) | 0 (0.0%) |
| $35,000 to $49,999 | 0 (0.0%) | 17 (15.4%) |
| $50,000 to $74,999 | 65 (35.9%) | 20 (18.2%) |
| $75,000 to $99,999 | 0 (0.0%) | 0 (0.0%) |
| $100,000 to $149,999 | 0 (0.0%) | 28 (25.5%) |
| $150,000 or more | 0 (0.0%) | 23 (20.9%) |
| Total | 181 (100.0%) | 110 (100.0%) |
Property Value to Household Income Ratio in North Haverhill
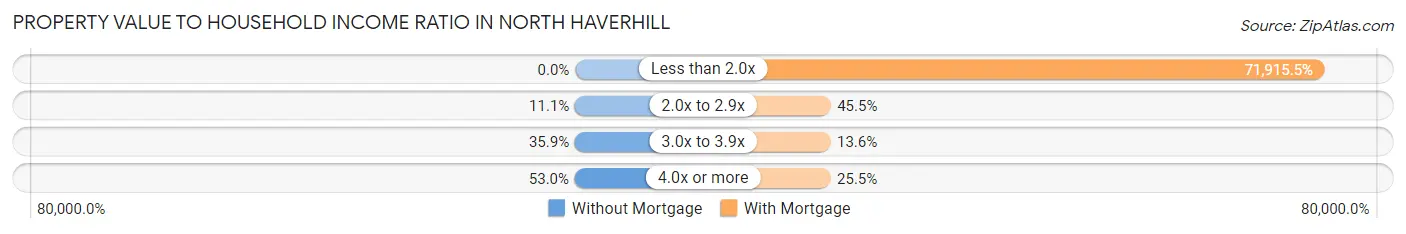
| Value-to-Income Ratio | Without Mortgage | With Mortgage |
| Less than 2.0x | 0 (0.0%) | 79,107 (71,915.4%) |
| 2.0x to 2.9x | 20 (11.1%) | 50 (45.5%) |
| 3.0x to 3.9x | 65 (35.9%) | 15 (13.6%) |
| 4.0x or more | 96 (53.0%) | 28 (25.5%) |
| Total | 181 (100.0%) | 110 (100.0%) |
Real Estate Taxes by Mortgage Status in North Haverhill
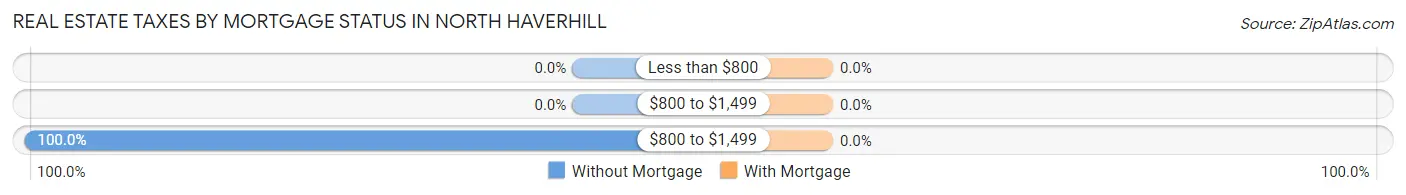
| Property Taxes | Without Mortgage | With Mortgage |
| Less than $800 | 0 (0.0%) | 0 (0.0%) |
| $800 to $1,499 | 0 (0.0%) | 0 (0.0%) |
| $800 to $1,499 | 181 (100.0%) | 0 (0.0%) |
| Total | 181 (100.0%) | 110 (100.0%) |
Health & Disability in North Haverhill
Health Insurance Coverage by Age in North Haverhill
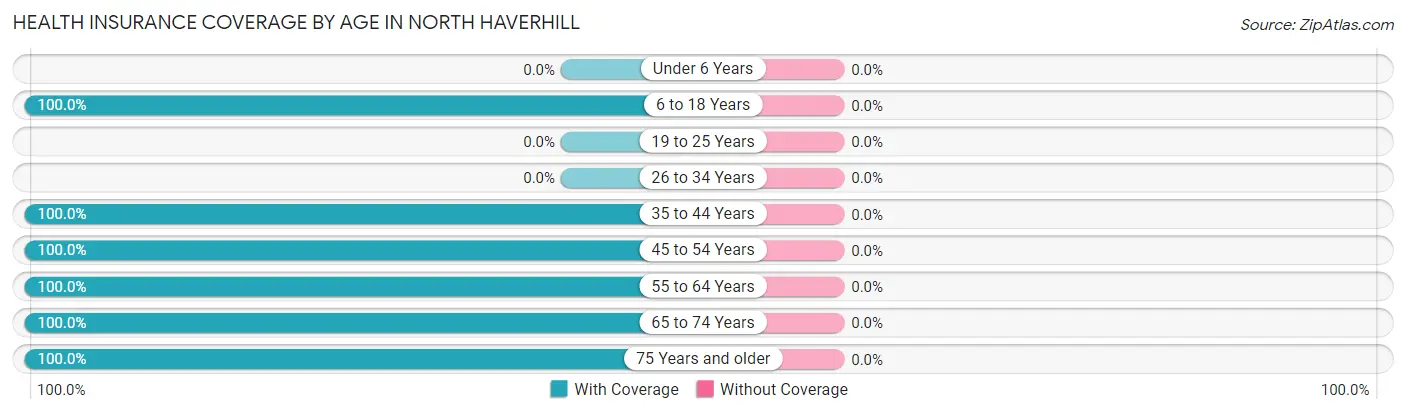
| Age Bracket | With Coverage | Without Coverage |
| Under 6 Years | 0 (0.0%) | 0 (0.0%) |
| 6 to 18 Years | 50 (100.0%) | 0 (0.0%) |
| 19 to 25 Years | 0 (0.0%) | 0 (0.0%) |
| 26 to 34 Years | 0 (0.0%) | 0 (0.0%) |
| 35 to 44 Years | 76 (100.0%) | 0 (0.0%) |
| 45 to 54 Years | 67 (100.0%) | 0 (0.0%) |
| 55 to 64 Years | 30 (100.0%) | 0 (0.0%) |
| 65 to 74 Years | 203 (100.0%) | 0 (0.0%) |
| 75 Years and older | 161 (100.0%) | 0 (0.0%) |
| Total | 587 (100.0%) | 0 (0.0%) |
Health Insurance Coverage by Citizenship Status in North Haverhill
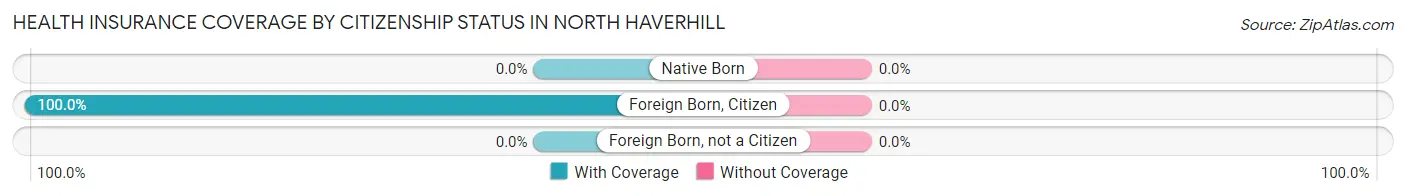
| Citizenship Status | With Coverage | Without Coverage |
| Native Born | 0 (0.0%) | 0 (0.0%) |
| Foreign Born, Citizen | 50 (100.0%) | 0 (0.0%) |
| Foreign Born, not a Citizen | 0 (0.0%) | 0 (0.0%) |
Health Insurance Coverage by Household Income in North Haverhill
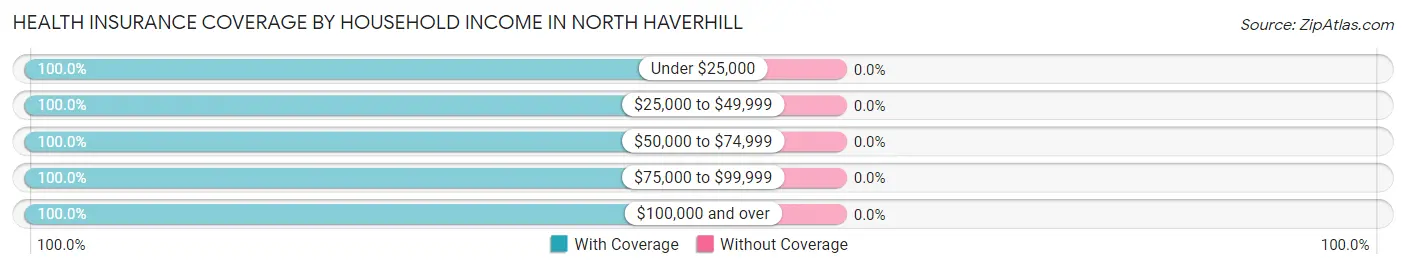
| Household Income | With Coverage | Without Coverage |
| Under $25,000 | 96 (100.0%) | 0 (0.0%) |
| $25,000 to $49,999 | 100 (100.0%) | 0 (0.0%) |
| $50,000 to $74,999 | 172 (100.0%) | 0 (0.0%) |
| $75,000 to $99,999 | 65 (100.0%) | 0 (0.0%) |
| $100,000 and over | 154 (100.0%) | 0 (0.0%) |
Public vs Private Health Insurance Coverage by Age in North Haverhill
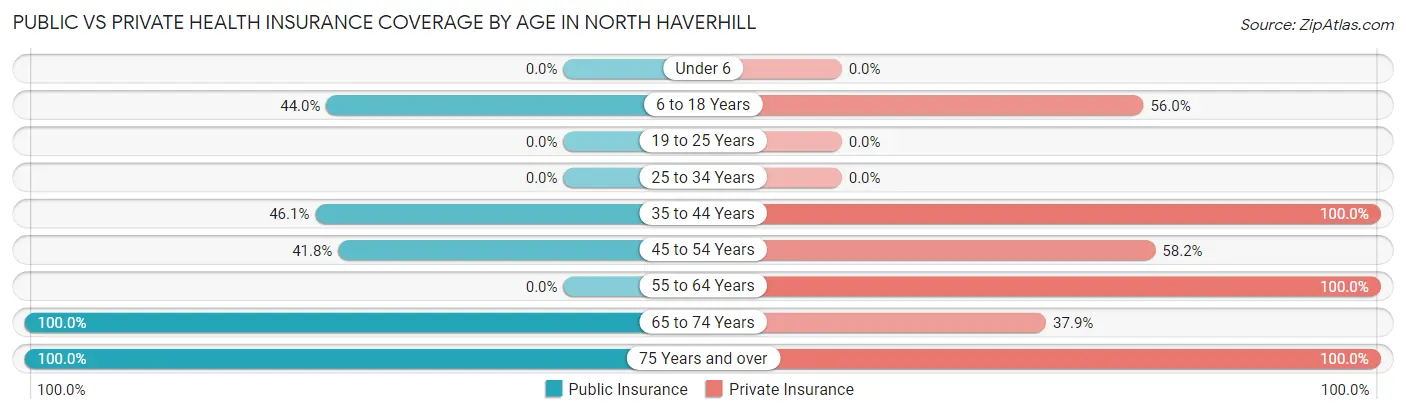
| Age Bracket | Public Insurance | Private Insurance |
| Under 6 | 0 (0.0%) | 0 (0.0%) |
| 6 to 18 Years | 22 (44.0%) | 28 (56.0%) |
| 19 to 25 Years | 0 (0.0%) | 0 (0.0%) |
| 25 to 34 Years | 0 (0.0%) | 0 (0.0%) |
| 35 to 44 Years | 35 (46.1%) | 76 (100.0%) |
| 45 to 54 Years | 28 (41.8%) | 39 (58.2%) |
| 55 to 64 Years | 0 (0.0%) | 30 (100.0%) |
| 65 to 74 Years | 203 (100.0%) | 77 (37.9%) |
| 75 Years and over | 161 (100.0%) | 161 (100.0%) |
| Total | 449 (76.5%) | 411 (70.0%) |
Disability Status by Sex by Age in North Haverhill
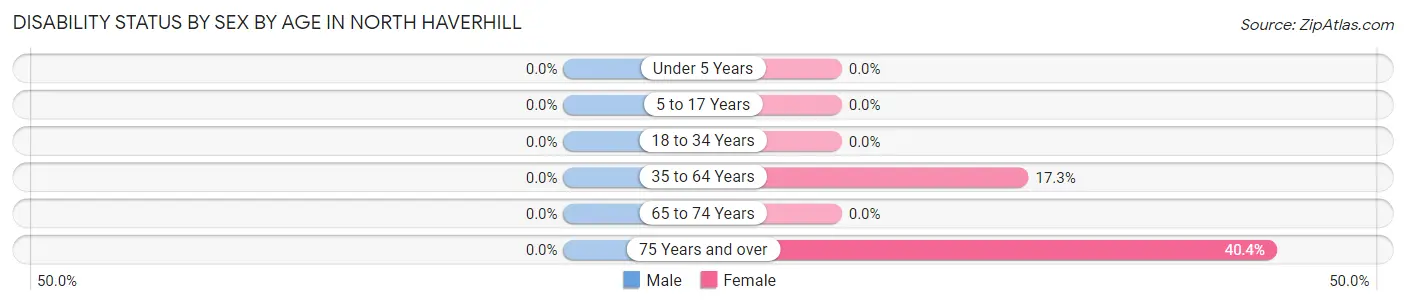
| Age Bracket | Male | Female |
| Under 5 Years | 0 (0.0%) | 0 (0.0%) |
| 5 to 17 Years | 0 (0.0%) | 0 (0.0%) |
| 18 to 34 Years | 0 (0.0%) | 0 (0.0%) |
| 35 to 64 Years | 0 (0.0%) | 13 (17.3%) |
| 65 to 74 Years | 0 (0.0%) | 0 (0.0%) |
| 75 Years and over | 0 (0.0%) | 65 (40.4%) |
Disability Class by Sex by Age in North Haverhill
Disability Class: Hearing Difficulty
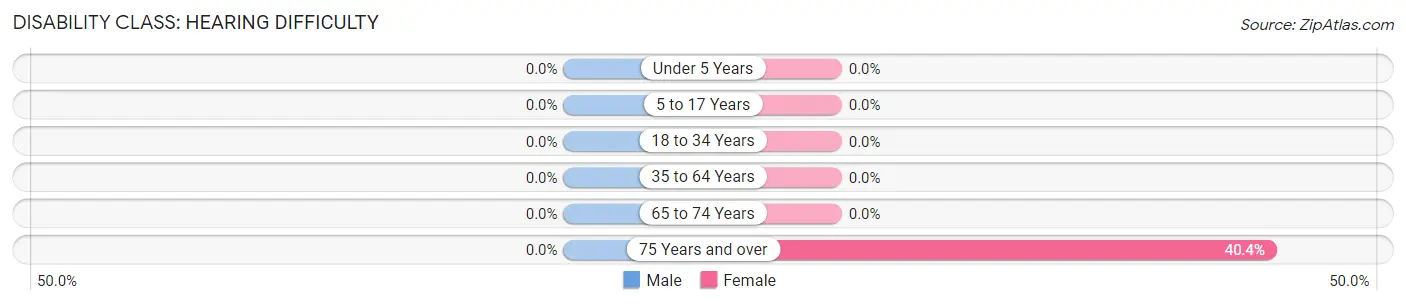
| Age Bracket | Male | Female |
| Under 5 Years | 0 (0.0%) | 0 (0.0%) |
| 5 to 17 Years | 0 (0.0%) | 0 (0.0%) |
| 18 to 34 Years | 0 (0.0%) | 0 (0.0%) |
| 35 to 64 Years | 0 (0.0%) | 0 (0.0%) |
| 65 to 74 Years | 0 (0.0%) | 0 (0.0%) |
| 75 Years and over | 0 (0.0%) | 65 (40.4%) |
Disability Class: Vision Difficulty
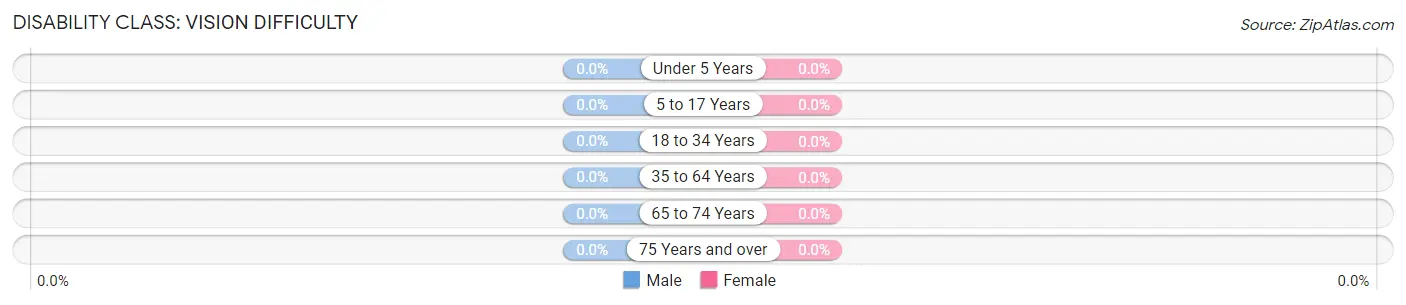
| Age Bracket | Male | Female |
| Under 5 Years | 0 (0.0%) | 0 (0.0%) |
| 5 to 17 Years | 0 (0.0%) | 0 (0.0%) |
| 18 to 34 Years | 0 (0.0%) | 0 (0.0%) |
| 35 to 64 Years | 0 (0.0%) | 0 (0.0%) |
| 65 to 74 Years | 0 (0.0%) | 0 (0.0%) |
| 75 Years and over | 0 (0.0%) | 0 (0.0%) |
Disability Class: Cognitive Difficulty
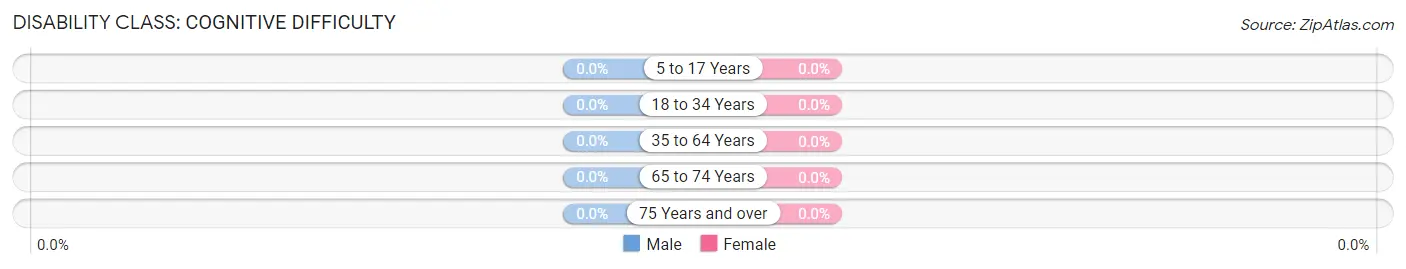
| Age Bracket | Male | Female |
| 5 to 17 Years | 0 (0.0%) | 0 (0.0%) |
| 18 to 34 Years | 0 (0.0%) | 0 (0.0%) |
| 35 to 64 Years | 0 (0.0%) | 0 (0.0%) |
| 65 to 74 Years | 0 (0.0%) | 0 (0.0%) |
| 75 Years and over | 0 (0.0%) | 0 (0.0%) |
Disability Class: Ambulatory Difficulty
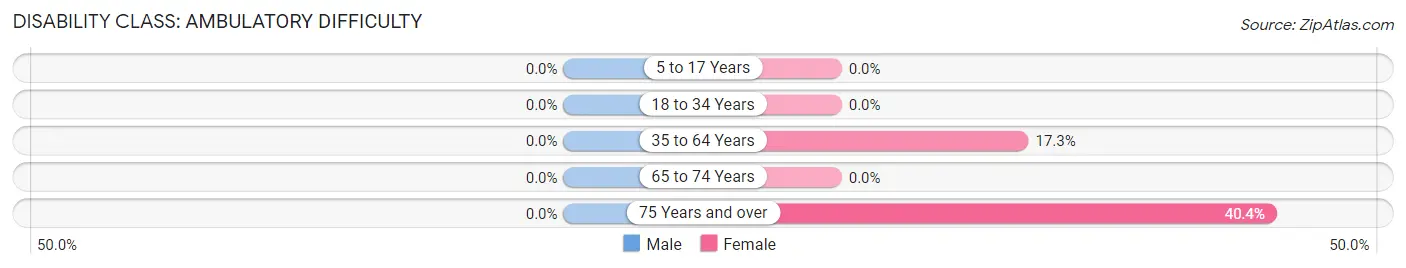
| Age Bracket | Male | Female |
| 5 to 17 Years | 0 (0.0%) | 0 (0.0%) |
| 18 to 34 Years | 0 (0.0%) | 0 (0.0%) |
| 35 to 64 Years | 0 (0.0%) | 13 (17.3%) |
| 65 to 74 Years | 0 (0.0%) | 0 (0.0%) |
| 75 Years and over | 0 (0.0%) | 65 (40.4%) |
Disability Class: Self-Care Difficulty
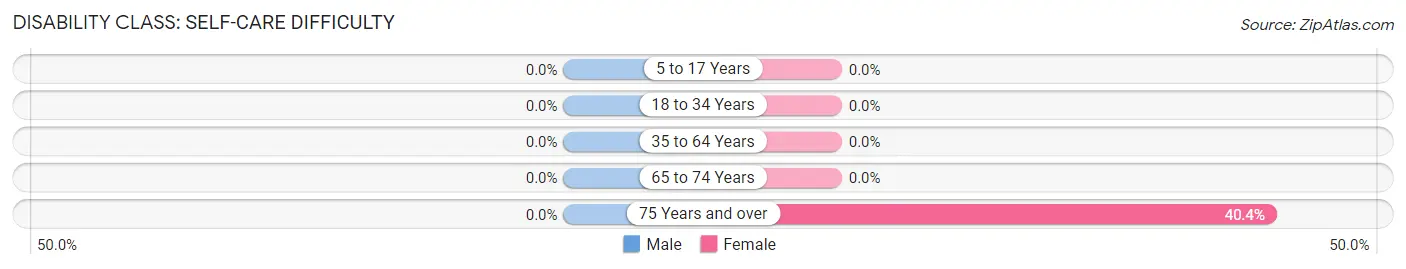
| Age Bracket | Male | Female |
| 5 to 17 Years | 0 (0.0%) | 0 (0.0%) |
| 18 to 34 Years | 0 (0.0%) | 0 (0.0%) |
| 35 to 64 Years | 0 (0.0%) | 0 (0.0%) |
| 65 to 74 Years | 0 (0.0%) | 0 (0.0%) |
| 75 Years and over | 0 (0.0%) | 65 (40.4%) |
Technology Access in North Haverhill
Computing Device Access in North Haverhill
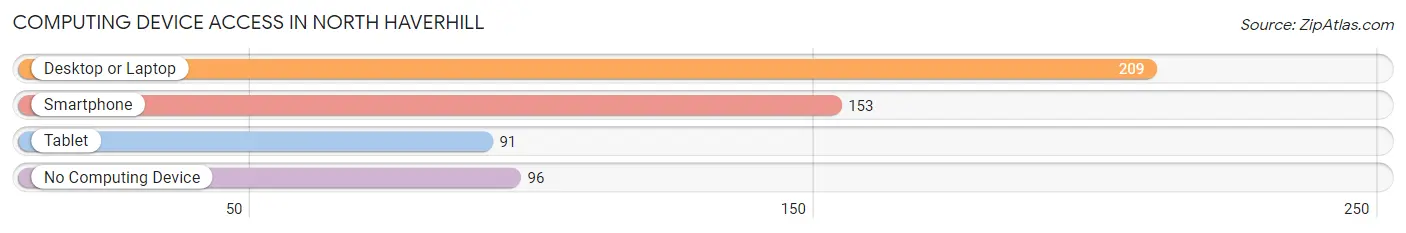
| Device Type | # Households | % Households |
| Desktop or Laptop | 209 | 64.9% |
| Smartphone | 153 | 47.5% |
| Tablet | 91 | 28.3% |
| No Computing Device | 96 | 29.8% |
| Total | 322 | 100.0% |
Internet Access in North Haverhill
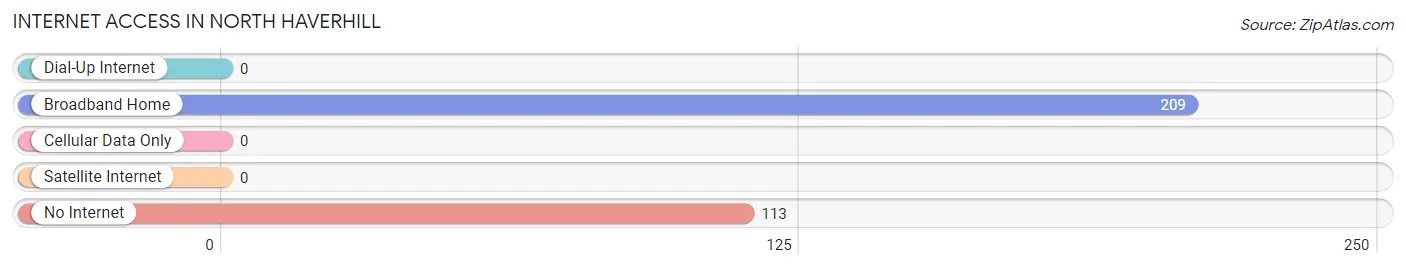
| Internet Type | # Households | % Households |
| Dial-Up Internet | 0 | 0.0% |
| Broadband Home | 209 | 64.9% |
| Cellular Data Only | 0 | 0.0% |
| Satellite Internet | 0 | 0.0% |
| No Internet | 113 | 35.1% |
| Total | 322 | 100.0% |
North Haverhill Summary
North Haverhill is a small town located in Grafton County, New Hampshire, United States. It is situated in the White Mountains region of the state, and is part of the Dartmouth-Lake Sunapee region. The town has a population of 1,845 as of the 2010 census.
History
North Haverhill was first settled in 1764 by a group of settlers from Haverhill, Massachusetts. The town was originally known as "Upper Haverhill", and was incorporated in 1790. The town was named after the original settlement of Haverhill, Massachusetts, which was named after the town of Haverhill in England.
The town was an important center of industry in the 19th century, with several mills and factories located in the area. The town was also home to a number of prominent citizens, including the first governor of New Hampshire, John Taylor Gilman.
Geography
North Haverhill is located in the White Mountains region of New Hampshire. The town is situated in the Connecticut River Valley, and is bordered by the towns of Haverhill, Bath, and Piermont. The town is located approximately 25 miles north of the city of Concord, and is about an hour's drive from the state capital of Manchester.
The town is located in a mountainous region, and is home to several peaks, including Mount Moosilauke, which is the highest peak in the White Mountains. The town is also home to several rivers, including the Connecticut River, which forms the town's western border.
Economy
North Haverhill is a rural town, and the economy is largely based on agriculture and tourism. The town is home to several farms, and is also home to several small businesses, including restaurants, stores, and other services.
The town is also home to several ski resorts, including Loon Mountain and Cannon Mountain. These resorts attract visitors from all over the region, and provide a boost to the local economy.
Demographics
As of the 2010 census, North Haverhill had a population of 1,845. The racial makeup of the town was 97.2% White, 0.3% African American, 0.2% Native American, 0.4% Asian, 0.1% Pacific Islander, 0.3% from other races, and 1.5% from two or more races. Hispanic or Latino of any race were 1.2% of the population.
The median income for a household in the town was $45,938, and the median income for a family was $51,250. The per capita income for the town was $21,945. About 8.2% of families and 10.3% of the population were below the poverty line, including 14.2% of those under age 18 and 5.2% of those age 65 or over.
North Haverhill is a small town with a rich history and a strong sense of community. The town is home to several ski resorts, farms, and businesses, and is a popular destination for tourists. The town has a diverse population, and is a great place to live and work.
Common Questions
What is Per Capita Income in North Haverhill?
Per Capita income in North Haverhill is $48,702.
What is the Median Family Income in North Haverhill?
Median Family Income in North Haverhill is $54,692.
What is the Median Household income in North Haverhill?
Median Household Income in North Haverhill is $52,808.
What is Inequality or Gini Index in North Haverhill?
Inequality or Gini Index in North Haverhill is 0.62.
What is the Total Population of North Haverhill?
Total Population of North Haverhill is 819.
What is the Total Male Population of North Haverhill?
Total Male Population of North Haverhill is 311.
What is the Total Female Population of North Haverhill?
Total Female Population of North Haverhill is 508.
What is the Ratio of Males per 100 Females in North Haverhill?
There are 61.22 Males per 100 Females in North Haverhill.
What is the Ratio of Females per 100 Males in North Haverhill?
There are 163.34 Females per 100 Males in North Haverhill.
What is the Median Population Age in North Haverhill?
Median Population Age in North Haverhill is 66.2 Years.
What is the Average Family Size in North Haverhill
Average Family Size in North Haverhill is 2.5 People.
What is the Average Household Size in North Haverhill
Average Household Size in North Haverhill is 1.8 People.
How Large is the Labor Force in North Haverhill?
There are 303 People in the Labor Forcein in North Haverhill.
What is the Percentage of People in the Labor Force in North Haverhill?
39.0% of People are in the Labor Force in North Haverhill.