Wallace, NC Map & Demographics
Wallace Map
Wallace Overview
$28,395
PER CAPITA INCOME
$62,878
AVG FAMILY INCOME
$47,318
AVG HOUSEHOLD INCOME
4.2%
WAGE / INCOME GAP [ % ]
95.8¢/ $1
WAGE / INCOME GAP [ $ ]
0.38
INEQUALITY / GINI INDEX
3,443
TOTAL POPULATION
1,487
MALE POPULATION
1,956
FEMALE POPULATION
76.02
MALES / 100 FEMALES
131.54
FEMALES / 100 MALES
46.2
MEDIAN AGE
2.7
AVG FAMILY SIZE
2.0
AVG HOUSEHOLD SIZE
1,554
LABOR FORCE [ PEOPLE ]
56.8%
PERCENT IN LABOR FORCE
13.1%
UNEMPLOYMENT RATE
Wallace Zip Codes
Wallace Area Codes
Income in Wallace
Income Overview in Wallace
Per Capita Income in Wallace is $28,395, while median incomes of families and households are $62,878 and $47,318 respectively.
| Characteristic | Number | Measure |
| Per Capita Income | 3,443 | $28,395 |
| Median Family Income | 988 | $62,878 |
| Mean Family Income | 988 | $75,872 |
| Median Household Income | 1,664 | $47,318 |
| Mean Household Income | 1,664 | $61,373 |
| Income Deficit | 988 | $0 |
| Wage / Income Gap (%) | 3,443 | 4.21% |
| Wage / Income Gap ($) | 3,443 | 95.79¢ per $1 |
| Gini / Inequality Index | 3,443 | 0.38 |
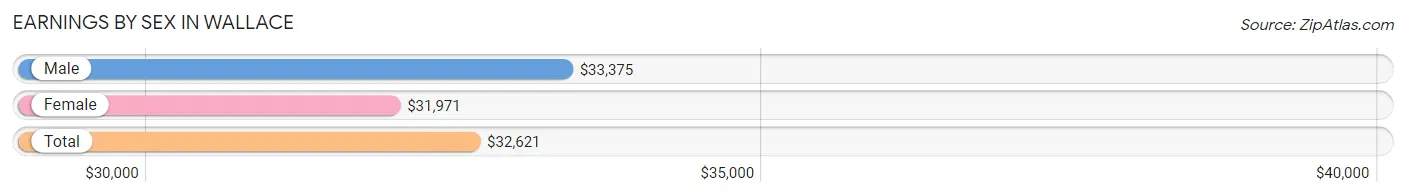
Earnings by Sex in Wallace
Average Earnings in Wallace are $32,621, $33,375 for men and $31,971 for women, a difference of 4.2%.
| Sex | Number | Average Earnings |
| Male | 579 (36.0%) | $33,375 |
| Female | 1,027 (63.9%) | $31,971 |
| Total | 1,606 (100.0%) | $32,621 |
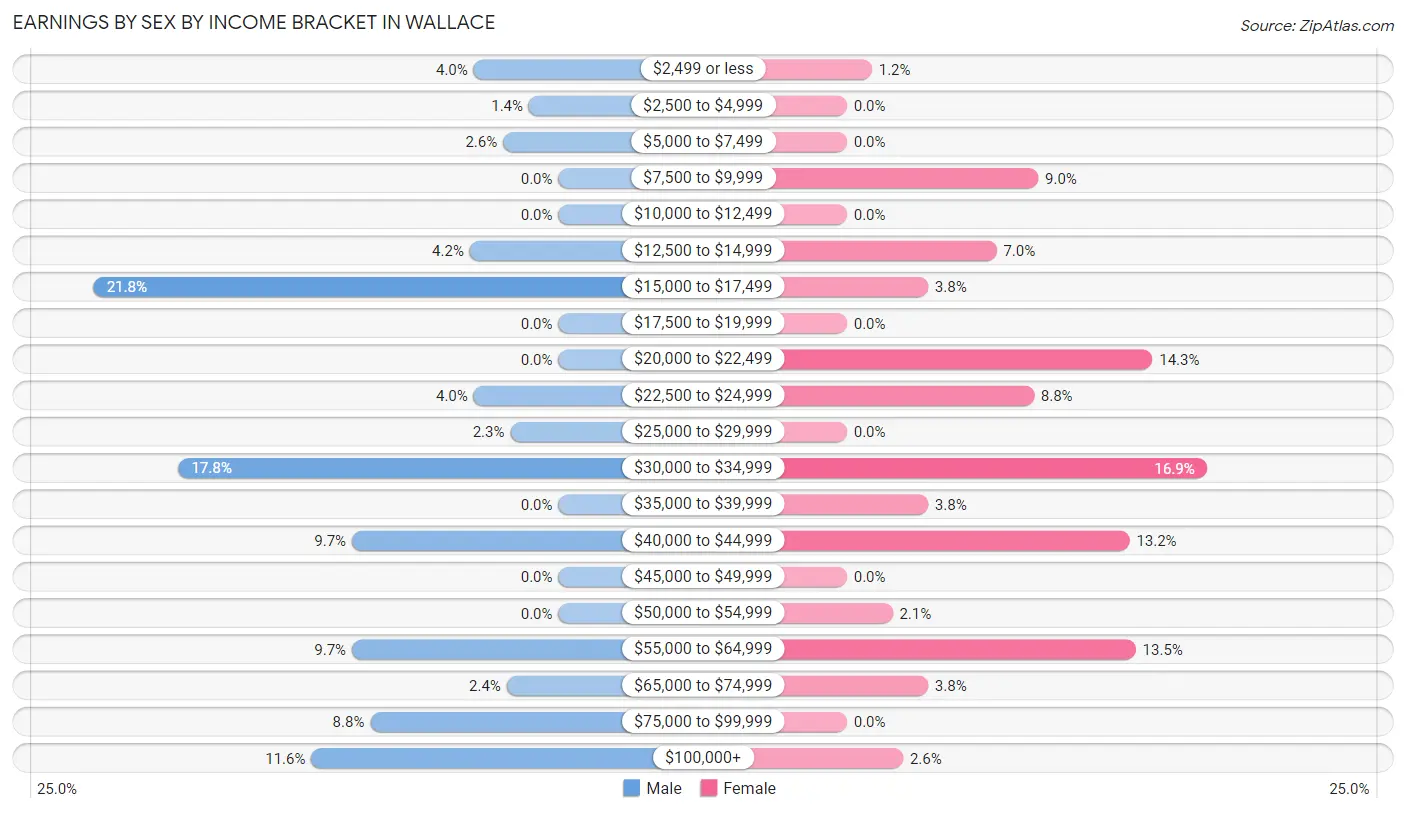
Earnings by Sex by Income Bracket in Wallace
The most common earnings brackets in Wallace are $15,000 to $17,499 for men (126 | 21.8%) and $30,000 to $34,999 for women (173 | 16.9%).
| Income | Male | Female |
| $2,499 or less | 23 (4.0%) | 12 (1.2%) |
| $2,500 to $4,999 | 8 (1.4%) | 0 (0.0%) |
| $5,000 to $7,499 | 15 (2.6%) | 0 (0.0%) |
| $7,500 to $9,999 | 0 (0.0%) | 92 (9.0%) |
| $10,000 to $12,499 | 0 (0.0%) | 0 (0.0%) |
| $12,500 to $14,999 | 24 (4.2%) | 72 (7.0%) |
| $15,000 to $17,499 | 126 (21.8%) | 39 (3.8%) |
| $17,500 to $19,999 | 0 (0.0%) | 0 (0.0%) |
| $20,000 to $22,499 | 0 (0.0%) | 147 (14.3%) |
| $22,500 to $24,999 | 23 (4.0%) | 90 (8.8%) |
| $25,000 to $29,999 | 13 (2.2%) | 0 (0.0%) |
| $30,000 to $34,999 | 103 (17.8%) | 173 (16.9%) |
| $35,000 to $39,999 | 0 (0.0%) | 39 (3.8%) |
| $40,000 to $44,999 | 56 (9.7%) | 136 (13.2%) |
| $45,000 to $49,999 | 0 (0.0%) | 0 (0.0%) |
| $50,000 to $54,999 | 0 (0.0%) | 22 (2.1%) |
| $55,000 to $64,999 | 56 (9.7%) | 139 (13.5%) |
| $65,000 to $74,999 | 14 (2.4%) | 39 (3.8%) |
| $75,000 to $99,999 | 51 (8.8%) | 0 (0.0%) |
| $100,000+ | 67 (11.6%) | 27 (2.6%) |
| Total | 579 (100.0%) | 1,027 (100.0%) |
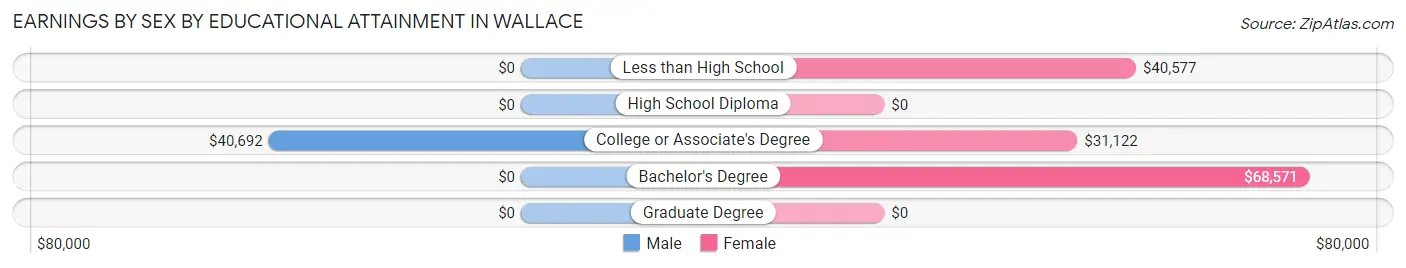
Earnings by Sex by Educational Attainment in Wallace
Average earnings in Wallace are $34,083 for men and $31,651 for women, a difference of 7.1%. Men with an educational attainment of college or associate's degree enjoy the highest average annual earnings of $40,692, while those with college or associate's degree education earn the least with $40,692. Women with an educational attainment of bachelor's degree earn the most with the average annual earnings of $68,571, while those with college or associate's degree education have the smallest earnings of $31,122.
| Educational Attainment | Male Income | Female Income |
| Less than High School | - | - |
| High School Diploma | - | - |
| College or Associate's Degree | $40,692 | $31,122 |
| Bachelor's Degree | - | - |
| Graduate Degree | - | - |
| Total | $34,083 | $31,651 |
Family Income in Wallace
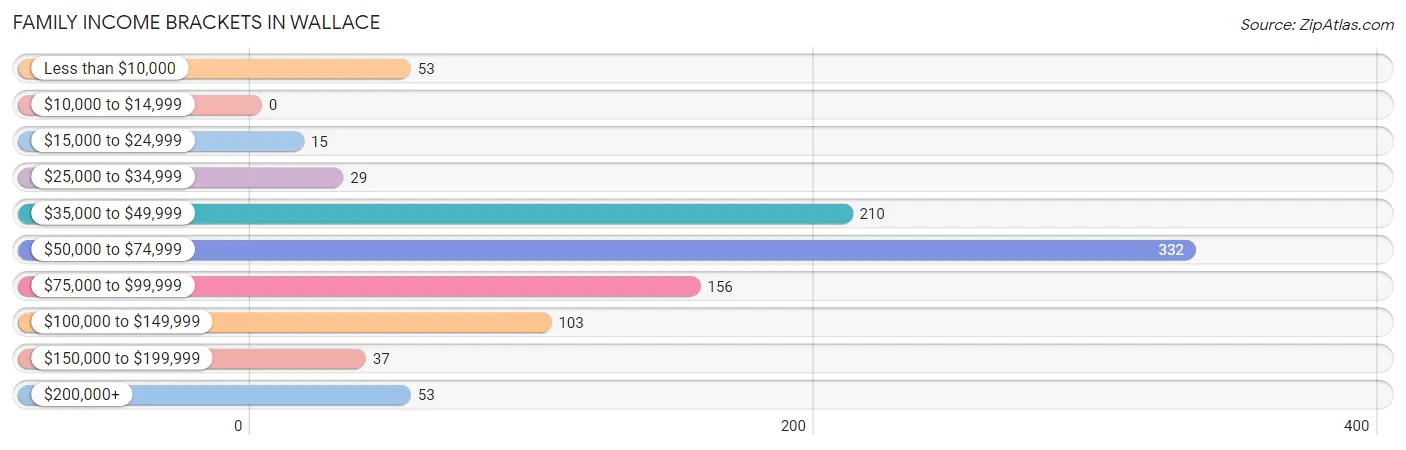
Family Income Brackets in Wallace
According to the Wallace family income data, there are 332 families falling into the $50,000 to $74,999 income range, which is the most common income bracket and makes up 33.6% of all families.
| Income Bracket | # Families | % Families |
| Less than $10,000 | 53 | 5.4% |
| $10,000 to $14,999 | 0 | 0.0% |
| $15,000 to $24,999 | 15 | 1.5% |
| $25,000 to $34,999 | 29 | 2.9% |
| $35,000 to $49,999 | 210 | 21.3% |
| $50,000 to $74,999 | 332 | 33.6% |
| $75,000 to $99,999 | 156 | 15.8% |
| $100,000 to $149,999 | 103 | 10.4% |
| $150,000 to $199,999 | 37 | 3.7% |
| $200,000+ | 53 | 5.4% |
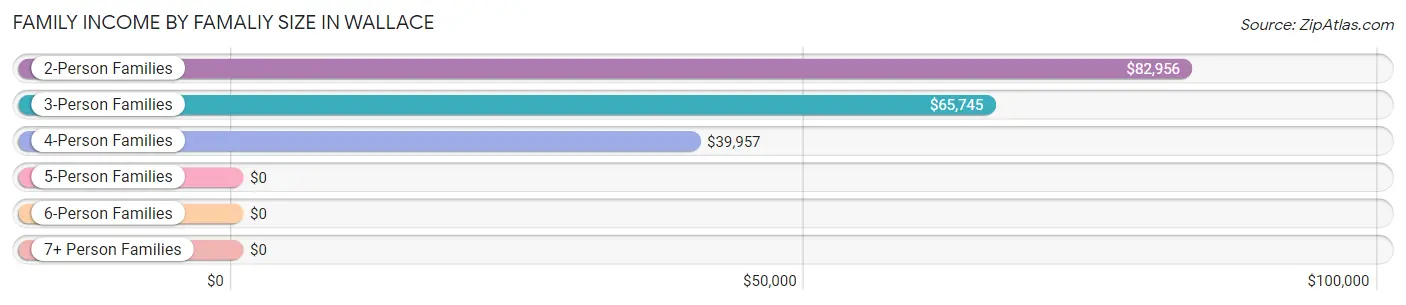
Family Income by Famaliy Size in Wallace
2-person families (527 | 53.3%) account for the highest median family income in Wallace with $82,956 per family, while 2-person families (527 | 53.3%) have the highest median income of $41,478 per family member.
| Income Bracket | # Families | Median Income |
| 2-Person Families | 527 (53.3%) | $82,956 |
| 3-Person Families | 140 (14.2%) | $65,745 |
| 4-Person Families | 307 (31.1%) | $39,957 |
| 5-Person Families | 0 (0.0%) | $0 |
| 6-Person Families | 0 (0.0%) | $0 |
| 7+ Person Families | 14 (1.4%) | $0 |
| Total | 988 (100.0%) | $62,878 |
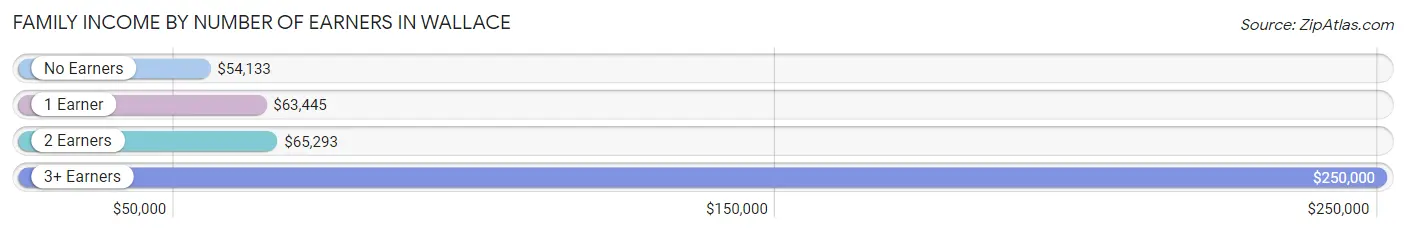
Family Income by Number of Earners in Wallace
The median family income in Wallace is $62,878, with families comprising 3+ earners (28) having the highest median family income of $250,000, while families with no earners (150) have the lowest median family income of $54,133, accounting for 2.8% and 15.2% of families, respectively.
| Number of Earners | # Families | Median Income |
| No Earners | 150 (15.2%) | $54,133 |
| 1 Earner | 265 (26.8%) | $63,445 |
| 2 Earners | 545 (55.2%) | $65,293 |
| 3+ Earners | 28 (2.8%) | $250,000 |
| Total | 988 (100.0%) | $62,878 |
Household Income in Wallace
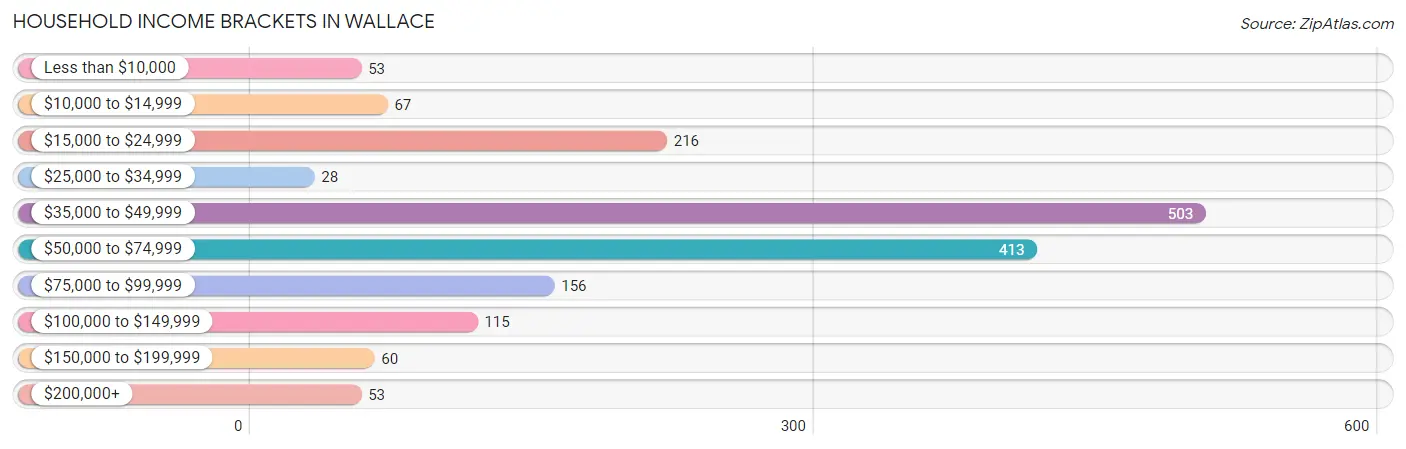
Household Income Brackets in Wallace
With 503 households falling in the category, the $35,000 to $49,999 income range is the most frequent in Wallace, accounting for 30.2% of all households. In contrast, only 28 households (1.7%) fall into the $25,000 to $34,999 income bracket, making it the least populous group.
| Income Bracket | # Households | % Households |
| Less than $10,000 | 53 | 3.2% |
| $10,000 to $14,999 | 67 | 4.0% |
| $15,000 to $24,999 | 216 | 13.0% |
| $25,000 to $34,999 | 28 | 1.7% |
| $35,000 to $49,999 | 503 | 30.2% |
| $50,000 to $74,999 | 413 | 24.8% |
| $75,000 to $99,999 | 156 | 9.4% |
| $100,000 to $149,999 | 115 | 6.9% |
| $150,000 to $199,999 | 60 | 3.6% |
| $200,000+ | 53 | 3.2% |
Household Income by Householder Age in Wallace
The median household income in Wallace is $47,318, with the highest median household income of $53,242 found in the 65+ years age bracket for the primary householder. A total of 606 households (36.4%) fall into this category. Meanwhile, the 15 to 24 years age bracket for the primary householder has the lowest median household income of $0, with 25 households (1.5%) in this group.
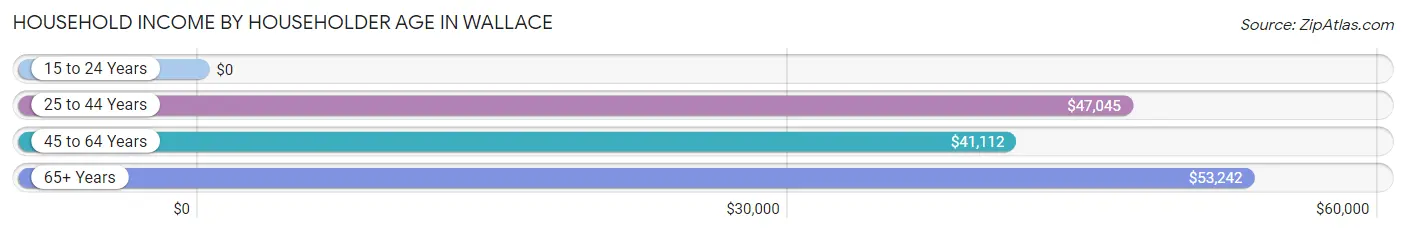
| Income Bracket | # Households | Median Income |
| 15 to 24 Years | 25 (1.5%) | $0 |
| 25 to 44 Years | 342 (20.5%) | $47,045 |
| 45 to 64 Years | 691 (41.5%) | $41,112 |
| 65+ Years | 606 (36.4%) | $53,242 |
| Total | 1,664 (100.0%) | $47,318 |
Poverty in Wallace
Income Below Poverty by Sex and Age in Wallace
With 10.5% poverty level for males and 9.2% for females among the residents of Wallace, 5 year old males and 15 year old females are the most vulnerable to poverty, with 13 males (100.0%) and 48 females (55.2%) in their respective age groups living below the poverty level.
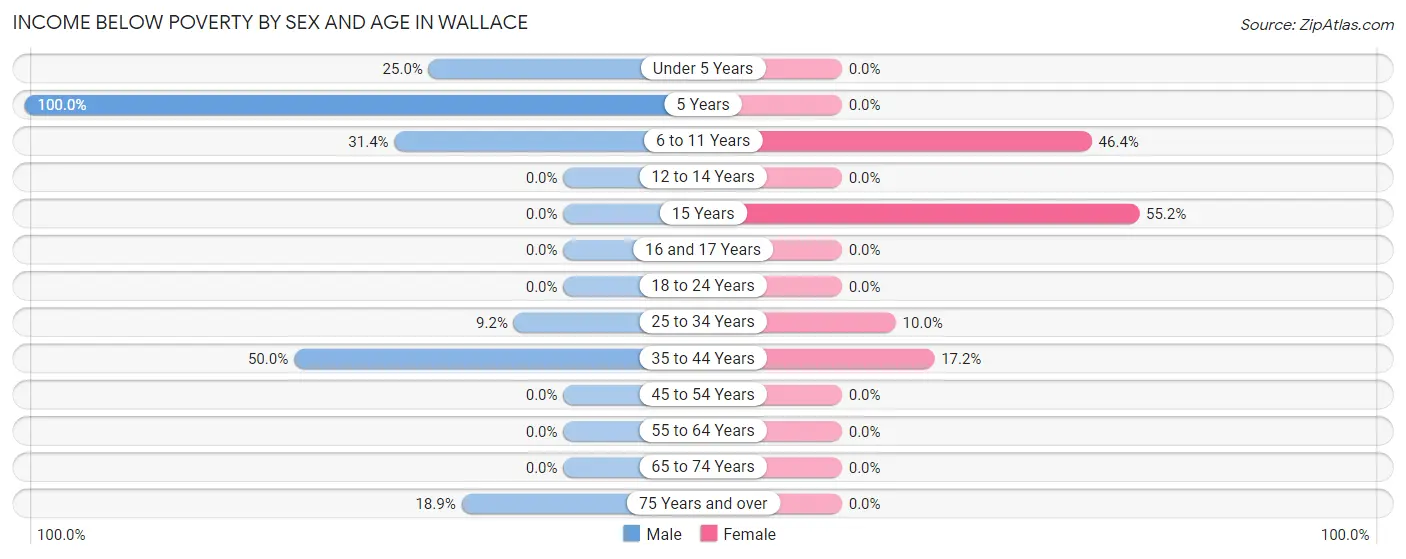
| Age Bracket | Male | Female |
| Under 5 Years | 9 (25.0%) | 0 (0.0%) |
| 5 Years | 13 (100.0%) | 0 (0.0%) |
| 6 to 11 Years | 69 (31.4%) | 64 (46.4%) |
| 12 to 14 Years | 0 (0.0%) | 0 (0.0%) |
| 15 Years | 0 (0.0%) | 48 (55.2%) |
| 16 and 17 Years | 0 (0.0%) | 0 (0.0%) |
| 18 to 24 Years | 0 (0.0%) | 0 (0.0%) |
| 25 to 34 Years | 7 (9.2%) | 13 (10.0%) |
| 35 to 44 Years | 15 (50.0%) | 53 (17.2%) |
| 45 to 54 Years | 0 (0.0%) | 0 (0.0%) |
| 55 to 64 Years | 0 (0.0%) | 0 (0.0%) |
| 65 to 74 Years | 0 (0.0%) | 0 (0.0%) |
| 75 Years and over | 38 (18.9%) | 0 (0.0%) |
| Total | 151 (10.5%) | 178 (9.2%) |
Income Above Poverty by Sex and Age in Wallace
According to the poverty statistics in Wallace, males aged 12 to 14 years and females aged under 5 years are the age groups that are most secure financially, with 100.0% of males and 100.0% of females in these age groups living above the poverty line.
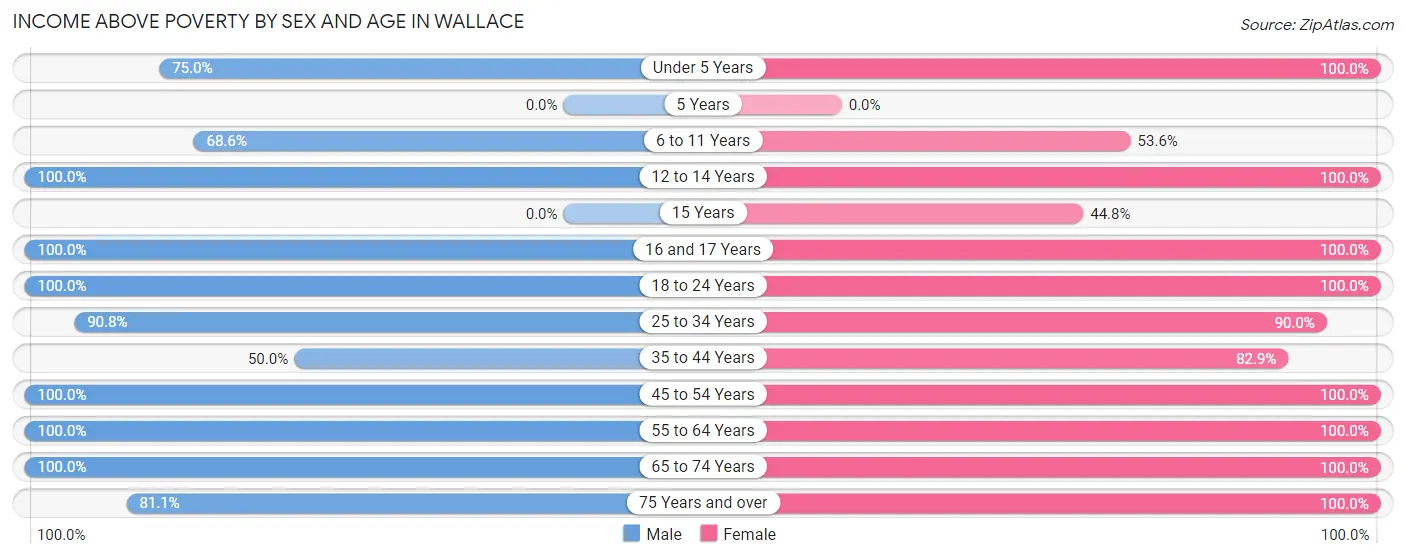
| Age Bracket | Male | Female |
| Under 5 Years | 27 (75.0%) | 8 (100.0%) |
| 5 Years | 0 (0.0%) | 0 (0.0%) |
| 6 to 11 Years | 151 (68.6%) | 74 (53.6%) |
| 12 to 14 Years | 96 (100.0%) | 109 (100.0%) |
| 15 Years | 0 (0.0%) | 39 (44.8%) |
| 16 and 17 Years | 56 (100.0%) | 19 (100.0%) |
| 18 to 24 Years | 90 (100.0%) | 93 (100.0%) |
| 25 to 34 Years | 69 (90.8%) | 117 (90.0%) |
| 35 to 44 Years | 15 (50.0%) | 256 (82.9%) |
| 45 to 54 Years | 267 (100.0%) | 393 (100.0%) |
| 55 to 64 Years | 136 (100.0%) | 241 (100.0%) |
| 65 to 74 Years | 213 (100.0%) | 166 (100.0%) |
| 75 Years and over | 163 (81.1%) | 234 (100.0%) |
| Total | 1,283 (89.5%) | 1,749 (90.8%) |
Income Below Poverty Among Married-Couple Families in Wallace
The poverty statistics for married-couple families in Wallace show that 2.0% or 15 of the total 766 families live below the poverty line. Families with 1 or 2 children have the highest poverty rate of 4.6%, comprising of 15 families. On the other hand, families with no children have the lowest poverty rate of 0.0%, which includes 0 families.
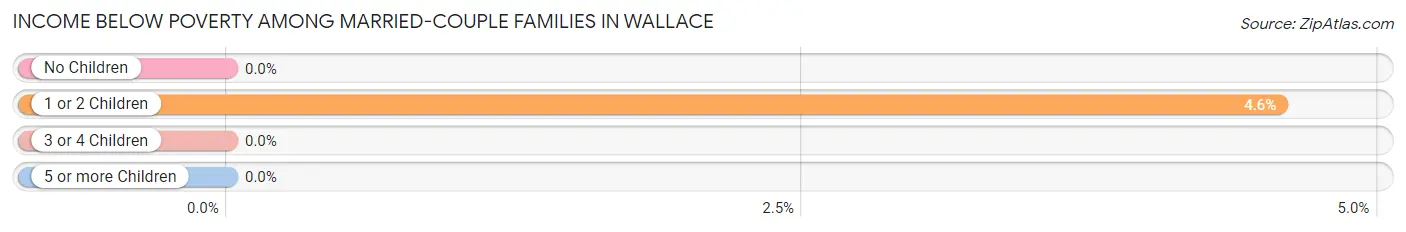
| Children | Above Poverty | Below Poverty |
| No Children | 424 (100.0%) | 0 (0.0%) |
| 1 or 2 Children | 313 (95.4%) | 15 (4.6%) |
| 3 or 4 Children | 0 (0.0%) | 0 (0.0%) |
| 5 or more Children | 14 (100.0%) | 0 (0.0%) |
| Total | 751 (98.0%) | 15 (2.0%) |
Income Below Poverty Among Single-Parent Households in Wallace
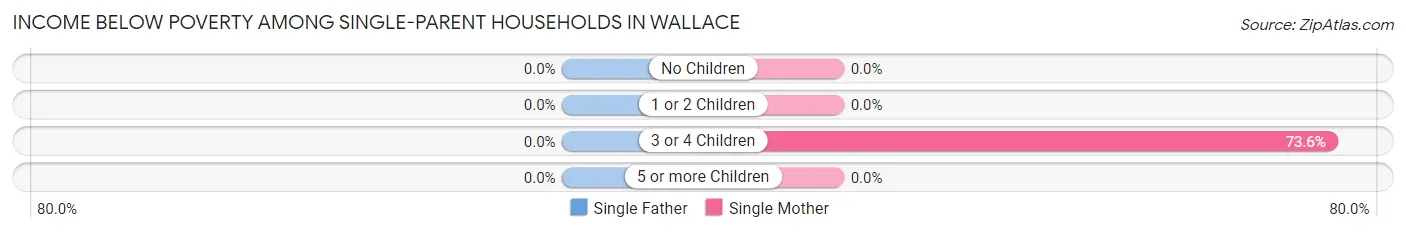
| Children | Single Father | Single Mother |
| No Children | 0 (0.0%) | 0 (0.0%) |
| 1 or 2 Children | 0 (0.0%) | 0 (0.0%) |
| 3 or 4 Children | 0 (0.0%) | 53 (73.6%) |
| 5 or more Children | 0 (0.0%) | 0 (0.0%) |
| Total | 0 (0.0%) | 53 (23.9%) |
Income Below Poverty Among Married-Couple vs Single-Parent Households in Wallace
The poverty data for Wallace shows that 15 of the married-couple family households (2.0%) and 53 of the single-parent households (23.9%) are living below the poverty level. Within the married-couple family households, those with 1 or 2 children have the highest poverty rate, with 15 households (4.6%) falling below the poverty line. Among the single-parent households, those with 3 or 4 children have the highest poverty rate, with 53 household (73.6%) living below poverty.
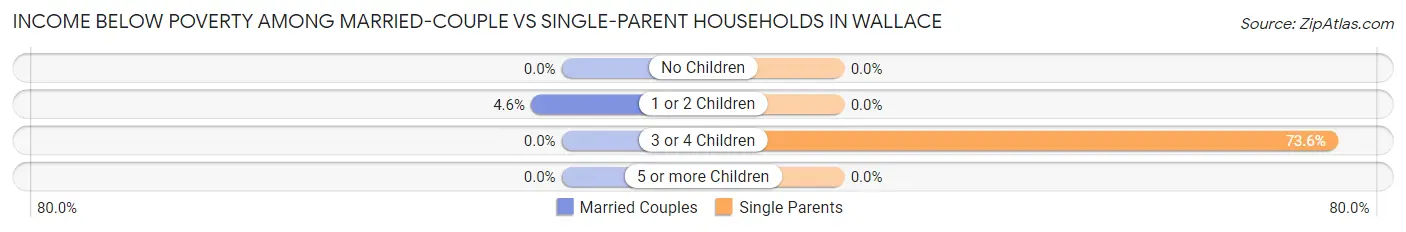
| Children | Married-Couple Families | Single-Parent Households |
| No Children | 0 (0.0%) | 0 (0.0%) |
| 1 or 2 Children | 15 (4.6%) | 0 (0.0%) |
| 3 or 4 Children | 0 (0.0%) | 53 (73.6%) |
| 5 or more Children | 0 (0.0%) | 0 (0.0%) |
| Total | 15 (2.0%) | 53 (23.9%) |
Race in Wallace
The most populous races in Wallace are White / Caucasian (2,205 | 64.0%), Black / African American (786 | 22.8%), and Hispanic or Latino (526 | 15.3%).
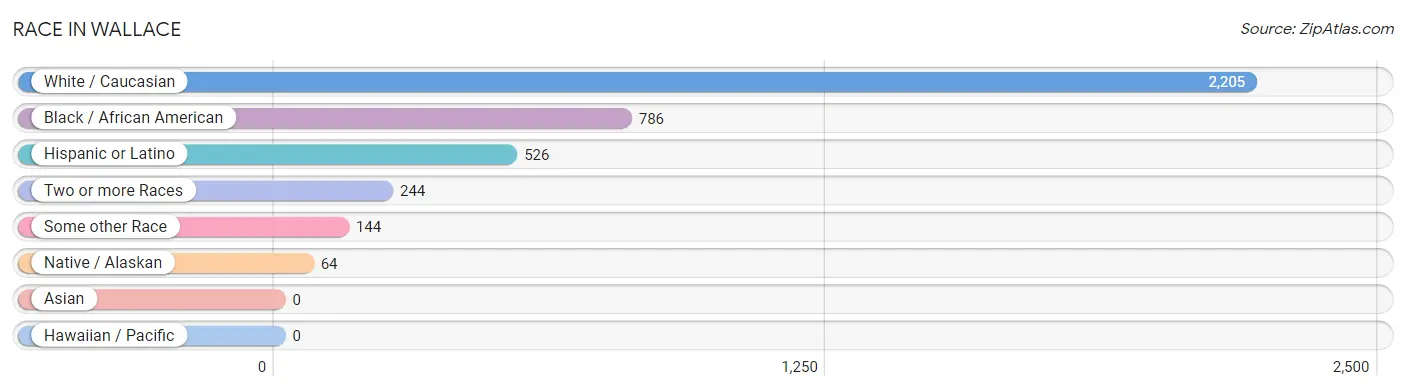
| Race | # Population | % Population |
| Asian | 0 | 0.0% |
| Black / African American | 786 | 22.8% |
| Hawaiian / Pacific | 0 | 0.0% |
| Hispanic or Latino | 526 | 15.3% |
| Native / Alaskan | 64 | 1.9% |
| White / Caucasian | 2,205 | 64.0% |
| Two or more Races | 244 | 7.1% |
| Some other Race | 144 | 4.2% |
| Total | 3,443 | 100.0% |
Ancestry in Wallace
The most populous ancestries reported in Wallace are Central American (451 | 13.1%), Honduran (389 | 11.3%), English (151 | 4.4%), American (138 | 4.0%), and German (122 | 3.5%), together accounting for 36.3% of all Wallace residents.
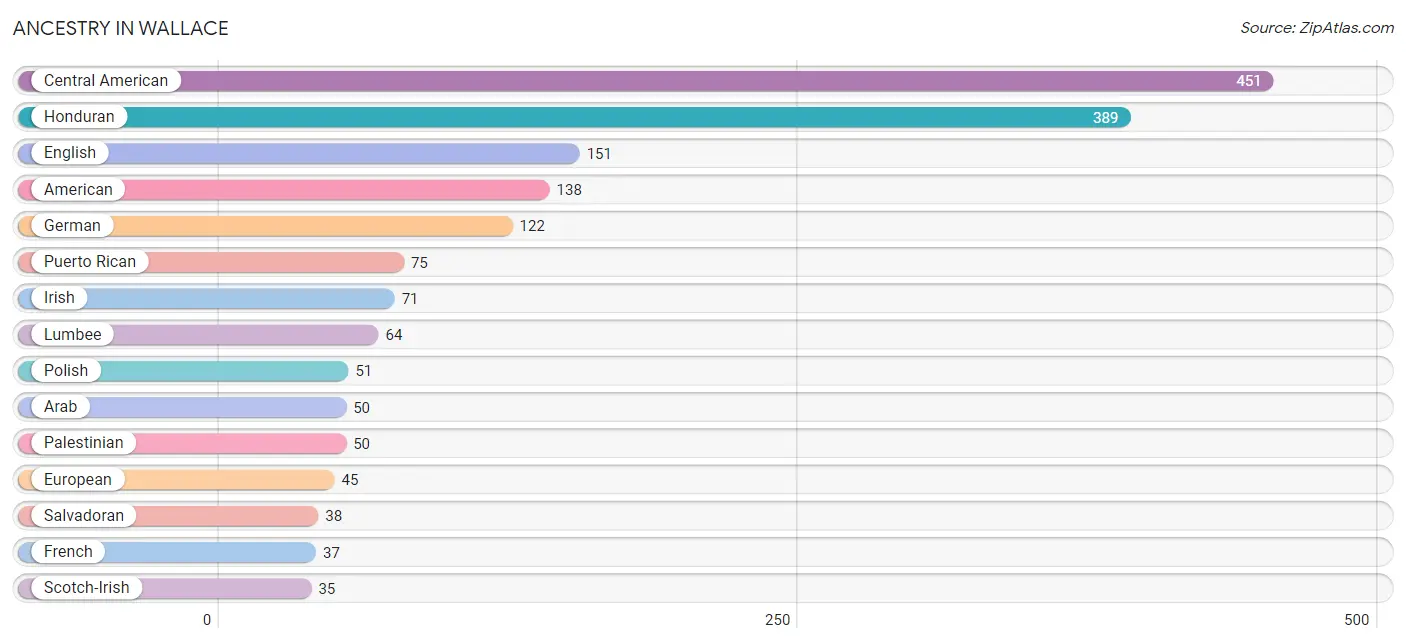
| Ancestry | # Population | % Population |
| American | 138 | 4.0% |
| Arab | 50 | 1.5% |
| Central American | 451 | 13.1% |
| English | 151 | 4.4% |
| European | 45 | 1.3% |
| French | 37 | 1.1% |
| German | 122 | 3.5% |
| Guatemalan | 24 | 0.7% |
| Honduran | 389 | 11.3% |
| Irish | 71 | 2.1% |
| Lumbee | 64 | 1.9% |
| Northern European | 12 | 0.4% |
| Palestinian | 50 | 1.5% |
| Polish | 51 | 1.5% |
| Puerto Rican | 75 | 2.2% |
| Salvadoran | 38 | 1.1% |
| Scandinavian | 8 | 0.2% |
| Scotch-Irish | 35 | 1.0% |
| Scottish | 22 | 0.6% | View All 19 Rows |
Immigrants in Wallace
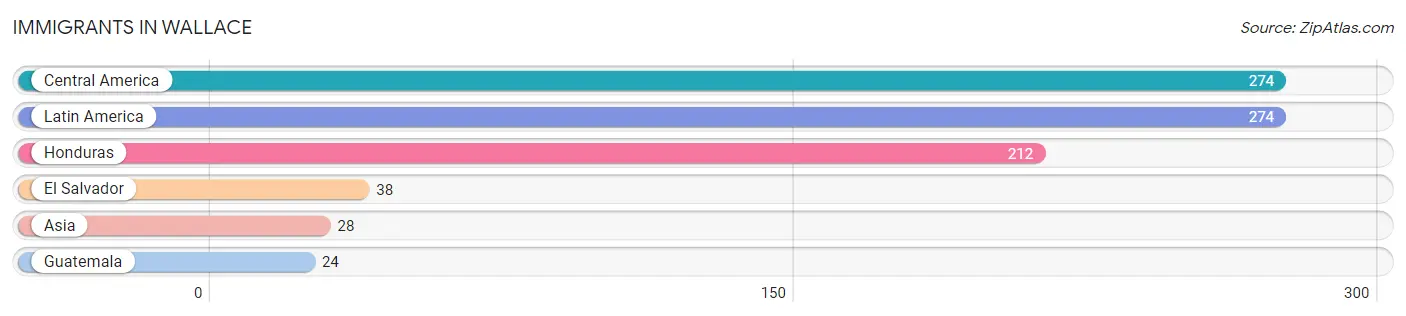
The most numerous immigrant groups reported in Wallace came from Central America (274 | 8.0%), Latin America (274 | 8.0%), Honduras (212 | 6.2%), El Salvador (38 | 1.1%), and Asia (28 | 0.8%), together accounting for 24.0% of all Wallace residents.
| Immigration Origin | # Population | % Population |
| Asia | 28 | 0.8% |
| Central America | 274 | 8.0% |
| El Salvador | 38 | 1.1% |
| Guatemala | 24 | 0.7% |
| Honduras | 212 | 6.2% |
| Latin America | 274 | 8.0% | View All 6 Rows |
Sex and Age in Wallace
Sex and Age in Wallace
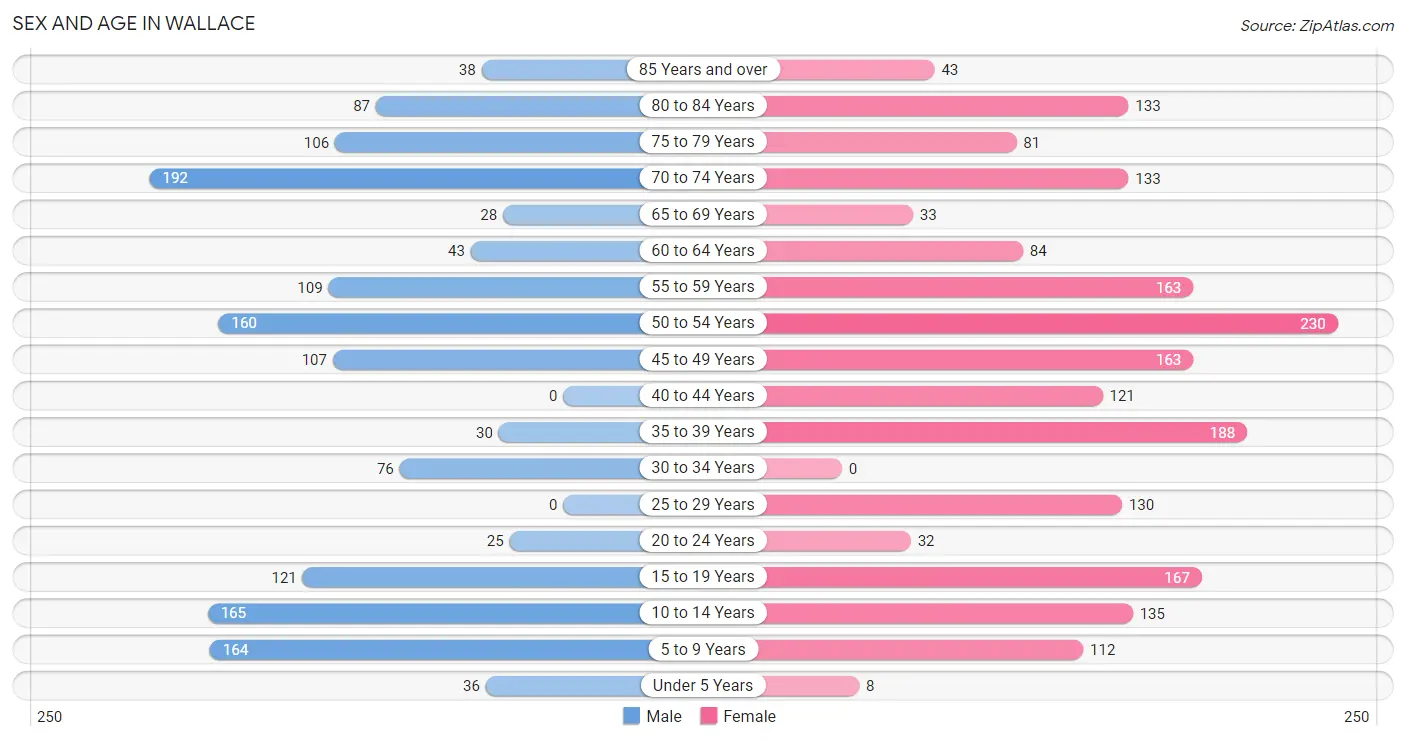
The most populous age groups in Wallace are 70 to 74 Years (192 | 12.9%) for men and 50 to 54 Years (230 | 11.8%) for women.
| Age Bracket | Male | Female |
| Under 5 Years | 36 (2.4%) | 8 (0.4%) |
| 5 to 9 Years | 164 (11.0%) | 112 (5.7%) |
| 10 to 14 Years | 165 (11.1%) | 135 (6.9%) |
| 15 to 19 Years | 121 (8.1%) | 167 (8.5%) |
| 20 to 24 Years | 25 (1.7%) | 32 (1.6%) |
| 25 to 29 Years | 0 (0.0%) | 130 (6.7%) |
| 30 to 34 Years | 76 (5.1%) | 0 (0.0%) |
| 35 to 39 Years | 30 (2.0%) | 188 (9.6%) |
| 40 to 44 Years | 0 (0.0%) | 121 (6.2%) |
| 45 to 49 Years | 107 (7.2%) | 163 (8.3%) |
| 50 to 54 Years | 160 (10.8%) | 230 (11.8%) |
| 55 to 59 Years | 109 (7.3%) | 163 (8.3%) |
| 60 to 64 Years | 43 (2.9%) | 84 (4.3%) |
| 65 to 69 Years | 28 (1.9%) | 33 (1.7%) |
| 70 to 74 Years | 192 (12.9%) | 133 (6.8%) |
| 75 to 79 Years | 106 (7.1%) | 81 (4.1%) |
| 80 to 84 Years | 87 (5.9%) | 133 (6.8%) |
| 85 Years and over | 38 (2.6%) | 43 (2.2%) |
| Total | 1,487 (100.0%) | 1,956 (100.0%) |
Families and Households in Wallace
Median Family Size in Wallace
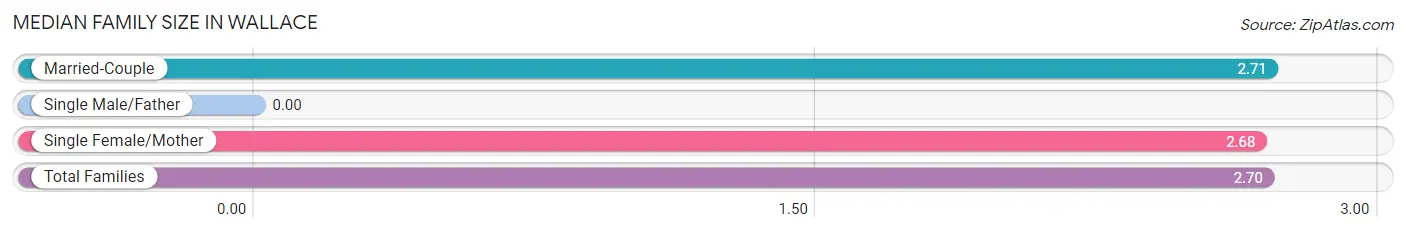
| Family Type | # Families | Family Size |
| Married-Couple | 766 (77.5%) | 2.71 |
| Single Male/Father | 0 (0.0%) | - |
| Single Female/Mother | 222 (22.5%) | 2.68 |
| Total Families | 988 (100.0%) | 2.70 |
Median Household Size in Wallace
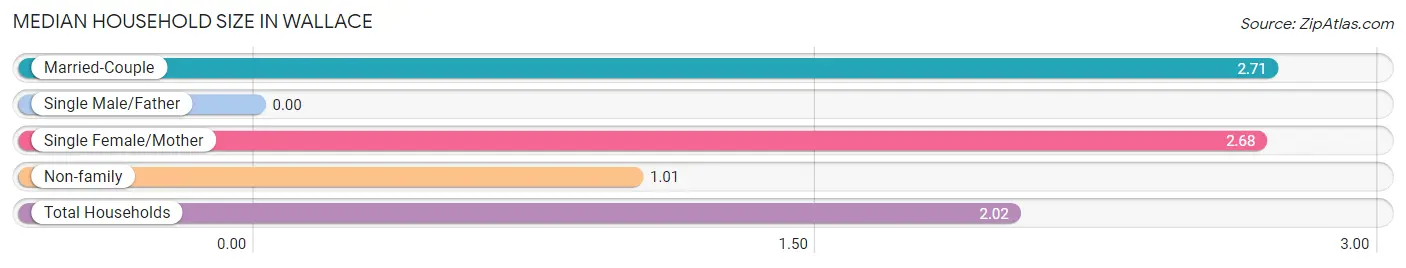
| Household Type | # Households | Household Size |
| Married-Couple | 766 (46.0%) | 2.71 |
| Single Male/Father | 0 (0.0%) | - |
| Single Female/Mother | 222 (13.3%) | 2.68 |
| Non-family | 676 (40.6%) | 1.01 |
| Total Households | 1,664 (100.0%) | 2.02 |
Household Size by Marriage Status in Wallace
Out of a total of 1,664 households in Wallace, 988 (59.4%) are family households, while 676 (40.6%) are nonfamily households. The most numerous type of family households are 2-person households, comprising 527, and the most common type of nonfamily households are 1-person households, comprising 653.
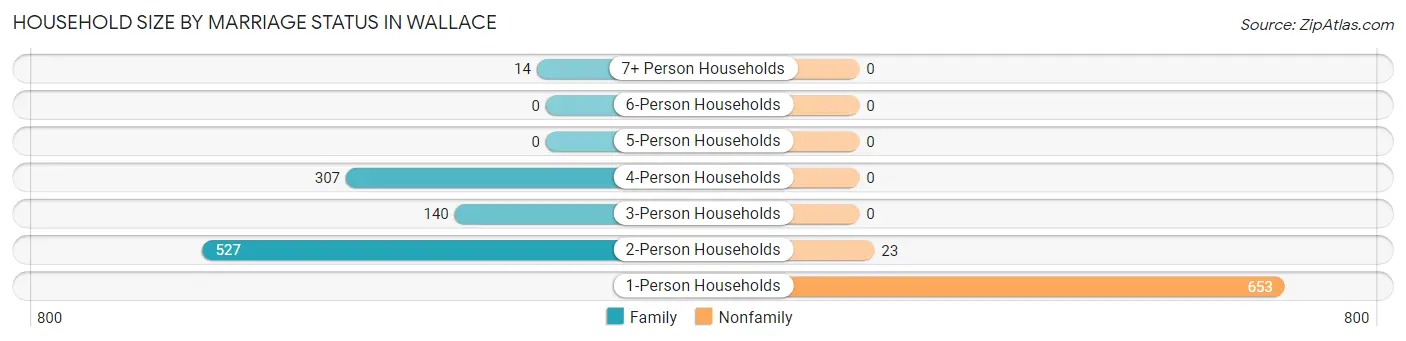
| Household Size | Family Households | Nonfamily Households |
| 1-Person Households | - | 653 (39.2%) |
| 2-Person Households | 527 (31.7%) | 23 (1.4%) |
| 3-Person Households | 140 (8.4%) | 0 (0.0%) |
| 4-Person Households | 307 (18.4%) | 0 (0.0%) |
| 5-Person Households | 0 (0.0%) | 0 (0.0%) |
| 6-Person Households | 0 (0.0%) | 0 (0.0%) |
| 7+ Person Households | 14 (0.8%) | 0 (0.0%) |
| Total | 988 (59.4%) | 676 (40.6%) |
Female Fertility in Wallace
Fertility by Age in Wallace
Average fertility rate in Wallace is 75.0 births per 1,000 women. Women in the age bracket of 20 to 34 years have the highest fertility rate with 401.0 births per 1,000 women. Women in the age bracket of 20 to 34 years acount for 100.0% of all women with births.
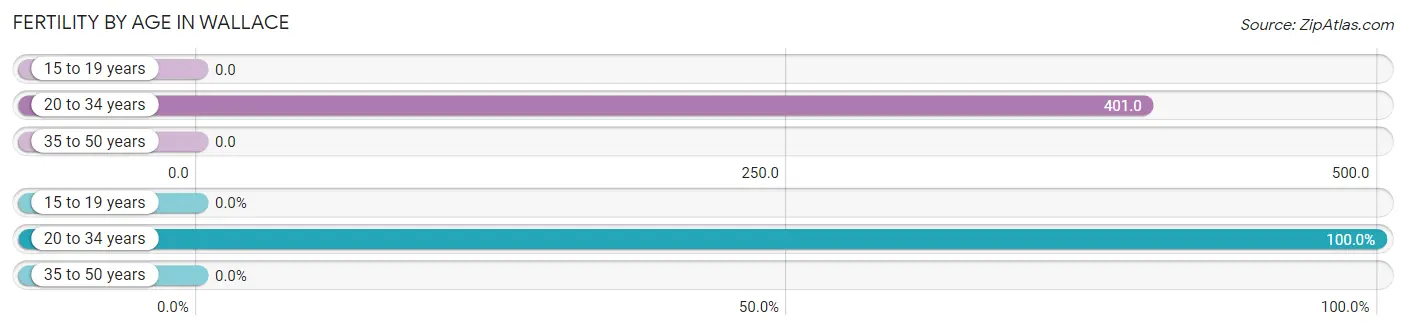
| Age Bracket | Women with Births | Births / 1,000 Women |
| 15 to 19 years | 0 (0.0%) | 0.0 |
| 20 to 34 years | 65 (100.0%) | 401.0 |
| 35 to 50 years | 0 (0.0%) | 0.0 |
| Total | 65 (100.0%) | 75.0 |
Fertility by Age by Marriage Status in Wallace
49.2% of women with births (65) in Wallace are married. The highest percentage of unmarried women with births falls into 20 to 34 years age bracket with 50.8% of them unmarried at the time of birth, while the lowest percentage of unmarried women with births belong to 20 to 34 years age bracket with 50.8% of them unmarried.
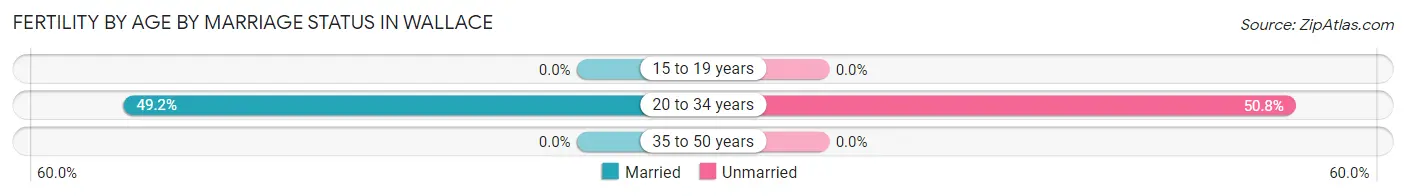
| Age Bracket | Married | Unmarried |
| 15 to 19 years | 0 (0.0%) | 0 (0.0%) |
| 20 to 34 years | 32 (49.2%) | 33 (50.8%) |
| 35 to 50 years | 0 (0.0%) | 0 (0.0%) |
| Total | 32 (49.2%) | 33 (50.8%) |
Fertility by Education in Wallace
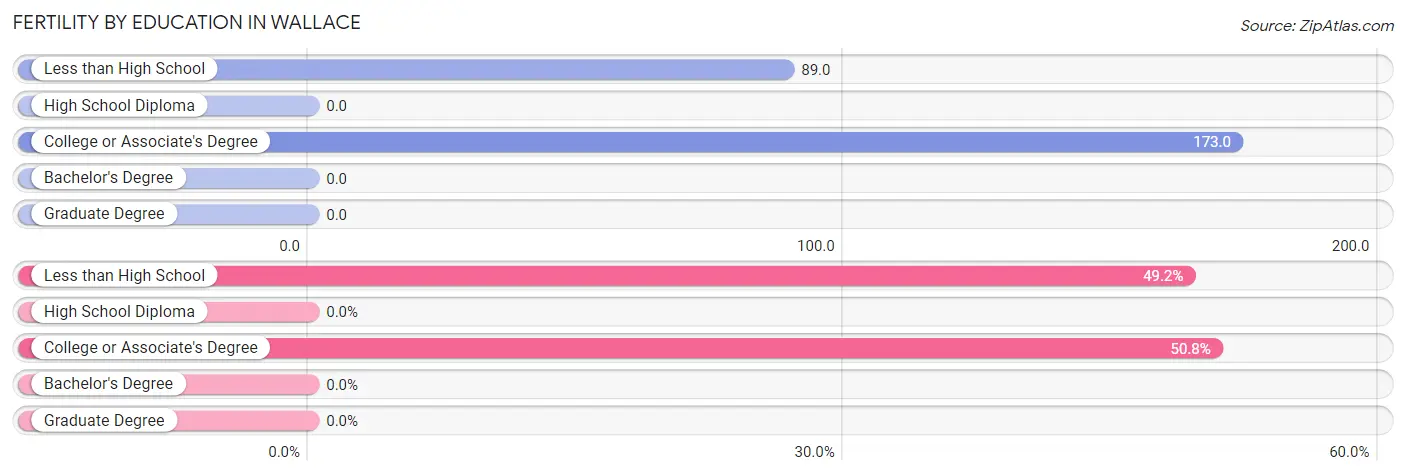
| Educational Attainment | Women with Births | Births / 1,000 Women |
| Less than High School | 32 (49.2%) | 89.0 |
| High School Diploma | 0 (0.0%) | 0.0 |
| College or Associate's Degree | 33 (50.8%) | 173.0 |
| Bachelor's Degree | 0 (0.0%) | 0.0 |
| Graduate Degree | 0 (0.0%) | 0.0 |
| Total | 65 (100.0%) | 75.0 |
Fertility by Education by Marriage Status in Wallace
50.8% of women with births in Wallace are unmarried. Women with the educational attainment of less than high school are most likely to be married with 100.0% of them married at childbirth, while women with the educational attainment of college or associate's degree are least likely to be married with 100.0% of them unmarried at childbirth.
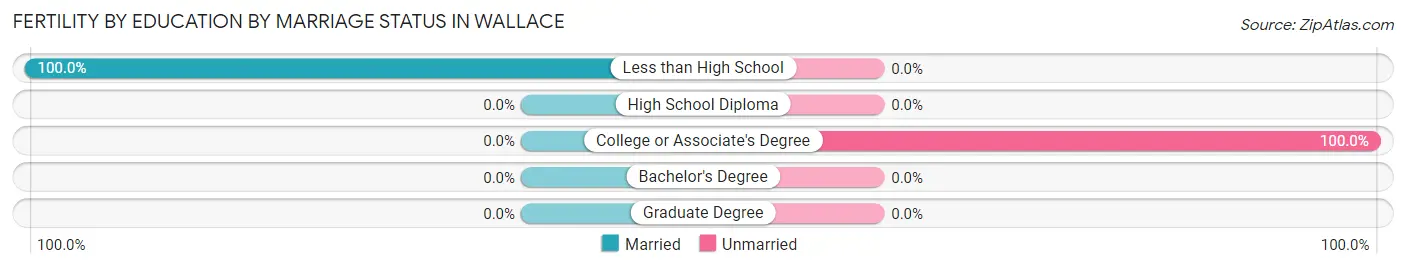
| Educational Attainment | Married | Unmarried |
| Less than High School | 32 (100.0%) | 0 (0.0%) |
| High School Diploma | 0 (0.0%) | 0 (0.0%) |
| College or Associate's Degree | 0 (0.0%) | 33 (100.0%) |
| Bachelor's Degree | 0 (0.0%) | 0 (0.0%) |
| Graduate Degree | 0 (0.0%) | 0 (0.0%) |
| Total | 32 (49.2%) | 33 (50.8%) |
Employment Characteristics in Wallace
Employment by Class of Employer in Wallace
Among the 1,304 employed individuals in Wallace, private company employees (783 | 60.1%), local government employees (275 | 21.1%), and self-employed (not incorporated) (113 | 8.7%) make up the most common classes of employment.
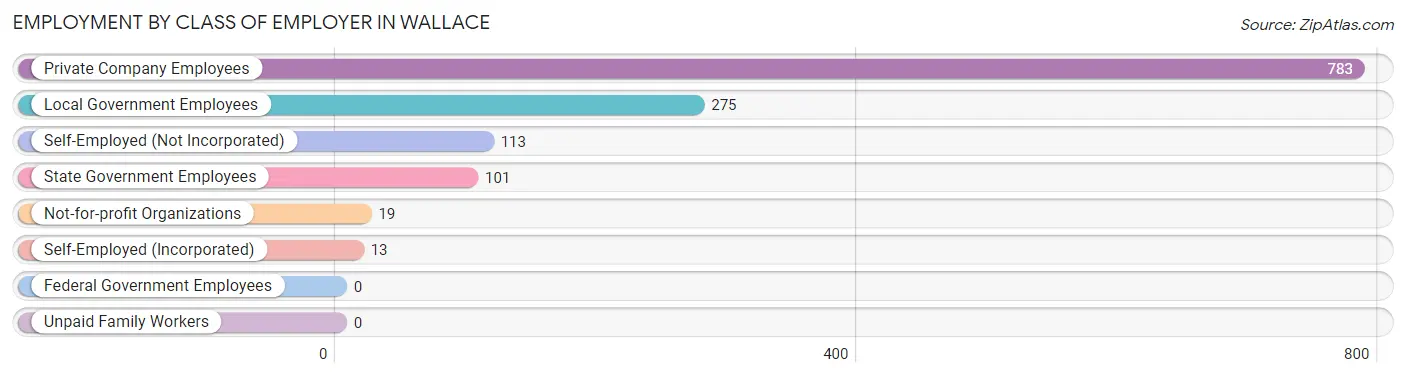
| Employer Class | # Employees | % Employees |
| Private Company Employees | 783 | 60.1% |
| Self-Employed (Incorporated) | 13 | 1.0% |
| Self-Employed (Not Incorporated) | 113 | 8.7% |
| Not-for-profit Organizations | 19 | 1.5% |
| Local Government Employees | 275 | 21.1% |
| State Government Employees | 101 | 7.7% |
| Federal Government Employees | 0 | 0.0% |
| Unpaid Family Workers | 0 | 0.0% |
| Total | 1,304 | 100.0% |
Employment Status by Age in Wallace
According to the labor force statistics for Wallace, out of the total population over 16 years of age (2,736), 56.8% or 1,554 individuals are in the labor force, with 13.1% or 204 of them unemployed. The age group with the highest labor force participation rate is 20 to 24 years, with 100.0% or 57 individuals in the labor force. Within the labor force, the 20 to 24 years age range has the highest percentage of unemployed individuals, with 56.1% or 32 of them being unemployed.
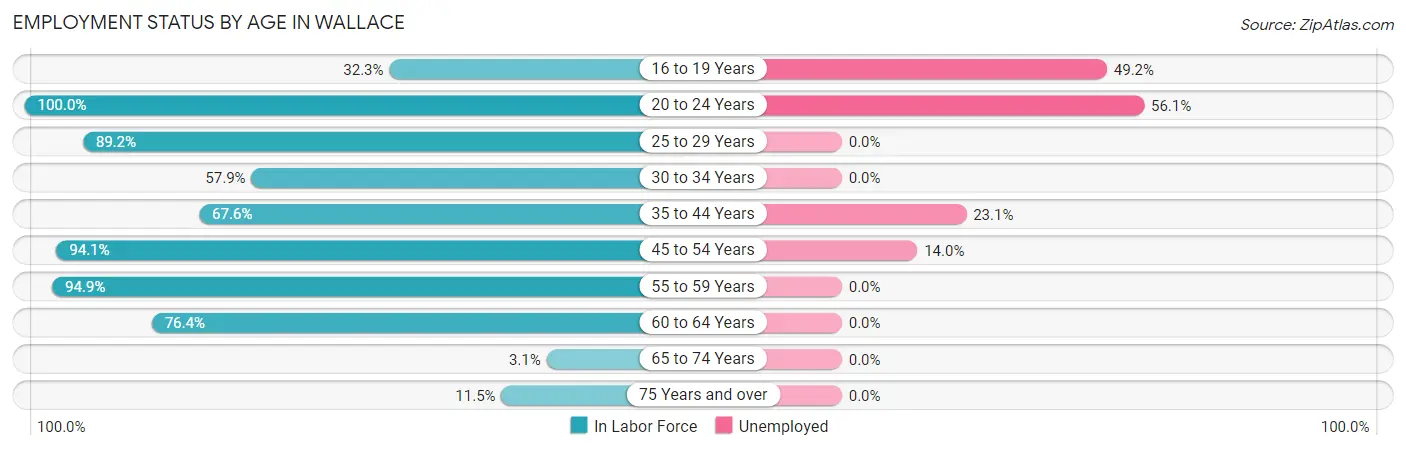
| Age Bracket | In Labor Force | Unemployed |
| 16 to 19 Years | 65 (32.3%) | 32 (49.2%) |
| 20 to 24 Years | 57 (100.0%) | 32 (56.1%) |
| 25 to 29 Years | 116 (89.2%) | 0 (0.0%) |
| 30 to 34 Years | 44 (57.9%) | 0 (0.0%) |
| 35 to 44 Years | 229 (67.6%) | 53 (23.1%) |
| 45 to 54 Years | 621 (94.1%) | 87 (14.0%) |
| 55 to 59 Years | 258 (94.9%) | 0 (0.0%) |
| 60 to 64 Years | 97 (76.4%) | 0 (0.0%) |
| 65 to 74 Years | 12 (3.1%) | 0 (0.0%) |
| 75 Years and over | 56 (11.5%) | 0 (0.0%) |
| Total | 1,554 (56.8%) | 204 (13.1%) |
Employment Status by Educational Attainment in Wallace
According to labor force statistics for Wallace, 85.1% of individuals (1,365) out of the total population between 25 and 64 years of age (1,604) are in the labor force, with 10.3% or 141 of them being unemployed. The group with the highest labor force participation rate are those with the educational attainment of bachelor's degree or higher, with 97.3% or 254 individuals in the labor force. Within the labor force, individuals with less than high school education have the highest percentage of unemployment, with 32.6% or 87 of them being unemployed.
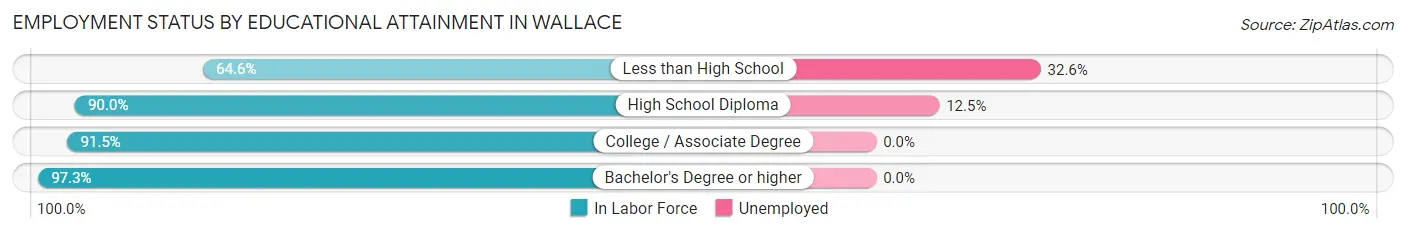
| Educational Attainment | In Labor Force | Unemployed |
| Less than High School | 267 (64.6%) | 135 (32.6%) |
| High School Diploma | 424 (90.0%) | 59 (12.5%) |
| College / Associate Degree | 420 (91.5%) | 0 (0.0%) |
| Bachelor's Degree or higher | 254 (97.3%) | 0 (0.0%) |
| Total | 1,365 (85.1%) | 165 (10.3%) |
Employment Occupations by Sex in Wallace
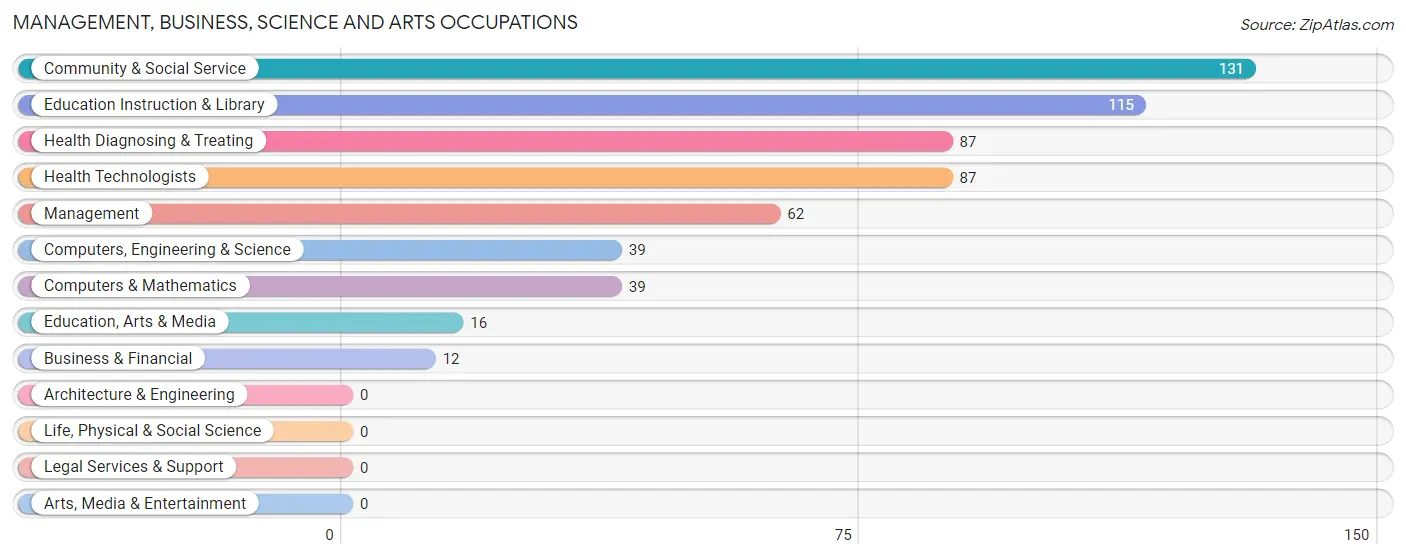
Management, Business, Science and Arts Occupations
The most common Management, Business, Science and Arts occupations in Wallace are Community & Social Service (131 | 9.7%), Education Instruction & Library (115 | 8.5%), Health Diagnosing & Treating (87 | 6.4%), Health Technologists (87 | 6.4%), and Management (62 | 4.6%).
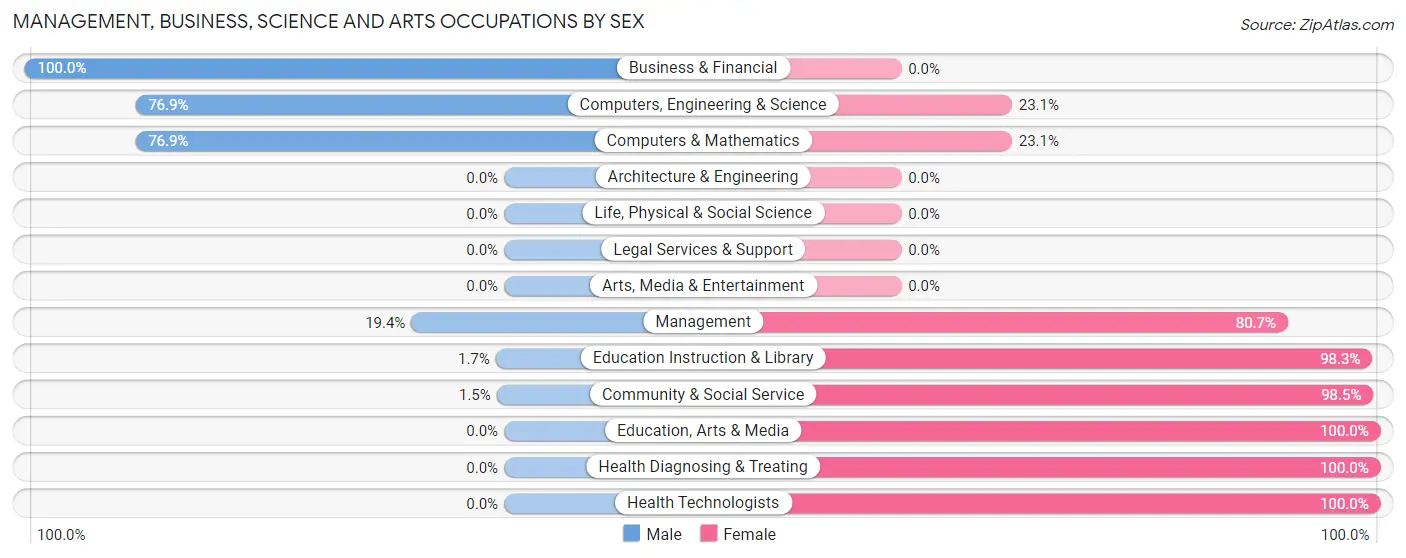
Management, Business, Science and Arts Occupations by Sex
Within the Management, Business, Science and Arts occupations in Wallace, the most male-oriented occupations are Business & Financial (100.0%), Computers, Engineering & Science (76.9%), and Computers & Mathematics (76.9%), while the most female-oriented occupations are Education, Arts & Media (100.0%), Health Diagnosing & Treating (100.0%), and Health Technologists (100.0%).
| Occupation | Male | Female |
| Management | 12 (19.4%) | 50 (80.6%) |
| Business & Financial | 12 (100.0%) | 0 (0.0%) |
| Computers, Engineering & Science | 30 (76.9%) | 9 (23.1%) |
| Computers & Mathematics | 30 (76.9%) | 9 (23.1%) |
| Architecture & Engineering | 0 (0.0%) | 0 (0.0%) |
| Life, Physical & Social Science | 0 (0.0%) | 0 (0.0%) |
| Community & Social Service | 2 (1.5%) | 129 (98.5%) |
| Education, Arts & Media | 0 (0.0%) | 16 (100.0%) |
| Legal Services & Support | 0 (0.0%) | 0 (0.0%) |
| Education Instruction & Library | 2 (1.7%) | 113 (98.3%) |
| Arts, Media & Entertainment | 0 (0.0%) | 0 (0.0%) |
| Health Diagnosing & Treating | 0 (0.0%) | 87 (100.0%) |
| Health Technologists | 0 (0.0%) | 87 (100.0%) |
| Total (Category) | 56 (16.9%) | 275 (83.1%) |
| Total (Overall) | 454 (33.6%) | 897 (66.4%) |
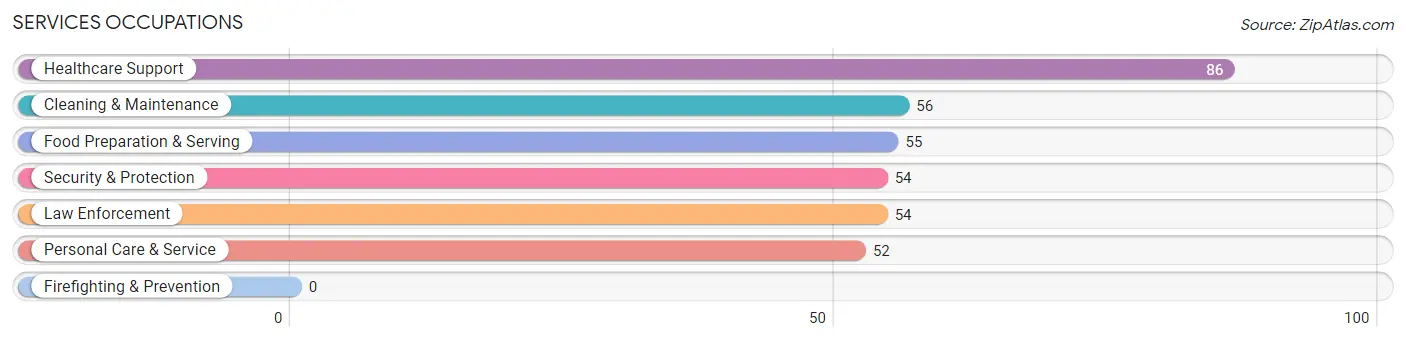
Services Occupations
The most common Services occupations in Wallace are Healthcare Support (86 | 6.4%), Cleaning & Maintenance (56 | 4.2%), Food Preparation & Serving (55 | 4.1%), Security & Protection (54 | 4.0%), and Law Enforcement (54 | 4.0%).
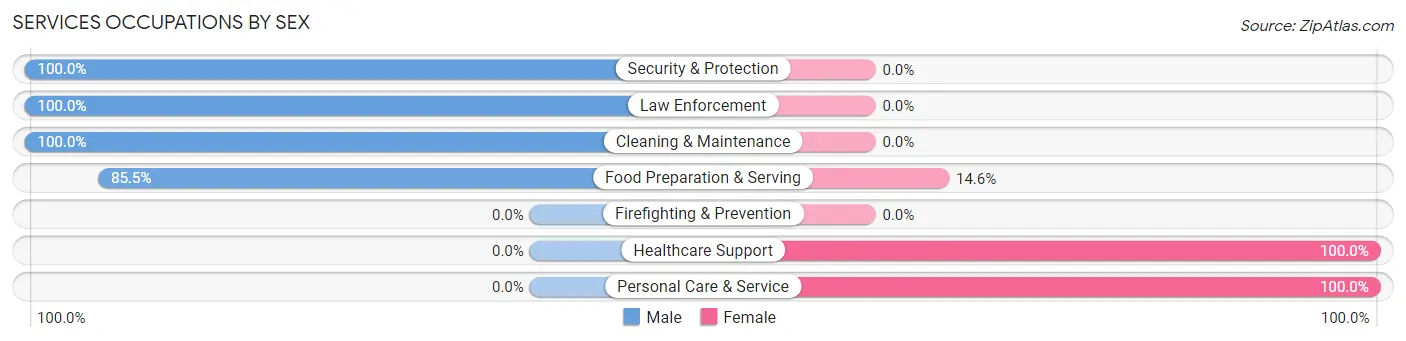
Services Occupations by Sex
Within the Services occupations in Wallace, the most male-oriented occupations are Security & Protection (100.0%), Law Enforcement (100.0%), and Cleaning & Maintenance (100.0%), while the most female-oriented occupations are Healthcare Support (100.0%), Personal Care & Service (100.0%), and Food Preparation & Serving (14.5%).
| Occupation | Male | Female |
| Healthcare Support | 0 (0.0%) | 86 (100.0%) |
| Security & Protection | 54 (100.0%) | 0 (0.0%) |
| Firefighting & Prevention | 0 (0.0%) | 0 (0.0%) |
| Law Enforcement | 54 (100.0%) | 0 (0.0%) |
| Food Preparation & Serving | 47 (85.5%) | 8 (14.5%) |
| Cleaning & Maintenance | 56 (100.0%) | 0 (0.0%) |
| Personal Care & Service | 0 (0.0%) | 52 (100.0%) |
| Total (Category) | 157 (51.8%) | 146 (48.2%) |
| Total (Overall) | 454 (33.6%) | 897 (66.4%) |
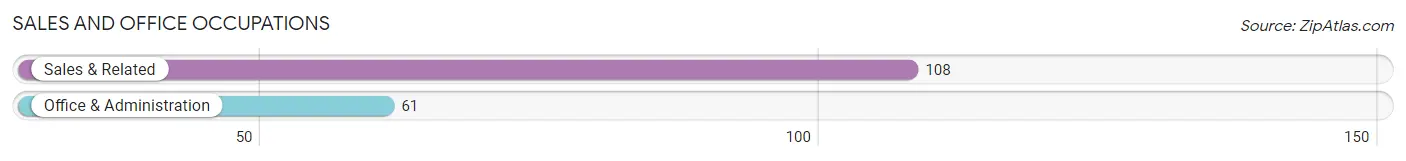
Sales and Office Occupations
The most common Sales and Office occupations in Wallace are Sales & Related (108 | 8.0%), and Office & Administration (61 | 4.5%).
Sales and Office Occupations by Sex
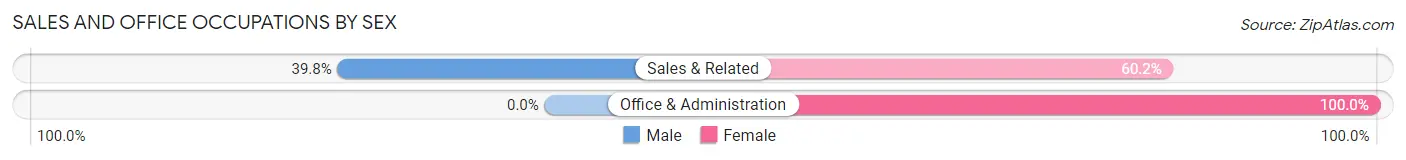
| Occupation | Male | Female |
| Sales & Related | 43 (39.8%) | 65 (60.2%) |
| Office & Administration | 0 (0.0%) | 61 (100.0%) |
| Total (Category) | 43 (25.4%) | 126 (74.6%) |
| Total (Overall) | 454 (33.6%) | 897 (66.4%) |
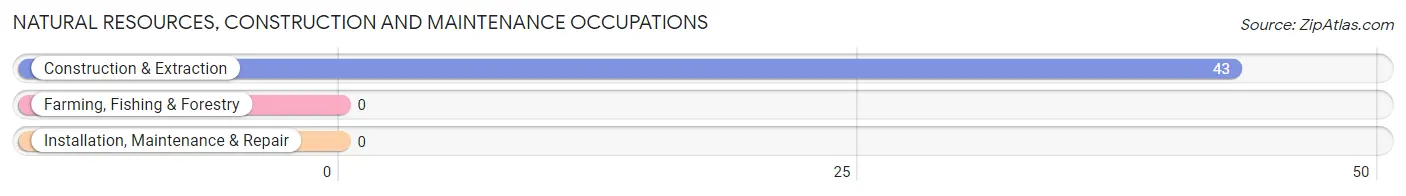
Natural Resources, Construction and Maintenance Occupations
The most common Natural Resources, Construction and Maintenance occupations in Wallace are , and Construction & Extraction (43 | 3.2%).
Natural Resources, Construction and Maintenance Occupations by Sex
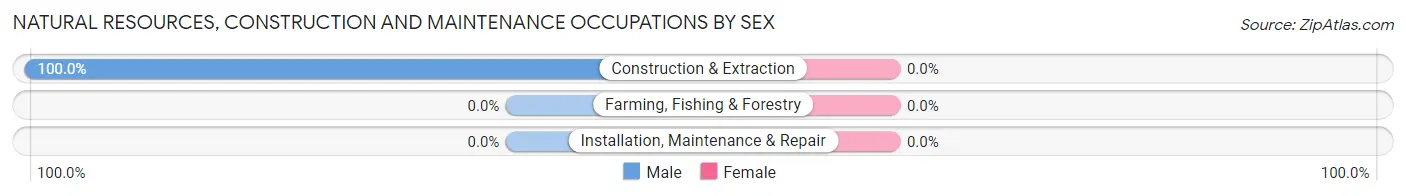
| Occupation | Male | Female |
| Farming, Fishing & Forestry | 0 (0.0%) | 0 (0.0%) |
| Construction & Extraction | 43 (100.0%) | 0 (0.0%) |
| Installation, Maintenance & Repair | 0 (0.0%) | 0 (0.0%) |
| Total (Category) | 43 (100.0%) | 0 (0.0%) |
| Total (Overall) | 454 (33.6%) | 897 (66.4%) |
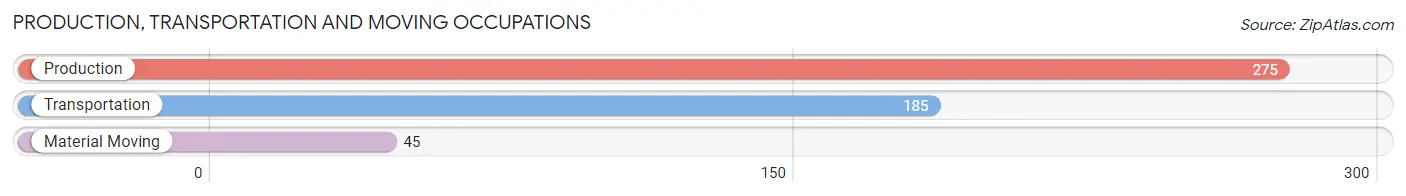
Production, Transportation and Moving Occupations
The most common Production, Transportation and Moving occupations in Wallace are Production (275 | 20.4%), Transportation (185 | 13.7%), and Material Moving (45 | 3.3%).
Production, Transportation and Moving Occupations by Sex
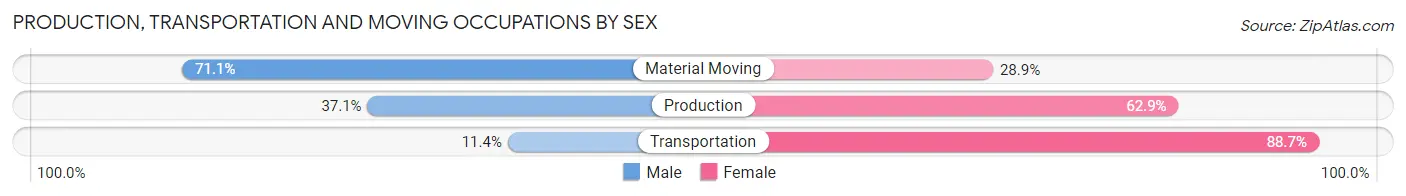
| Occupation | Male | Female |
| Production | 102 (37.1%) | 173 (62.9%) |
| Transportation | 21 (11.4%) | 164 (88.6%) |
| Material Moving | 32 (71.1%) | 13 (28.9%) |
| Total (Category) | 155 (30.7%) | 350 (69.3%) |
| Total (Overall) | 454 (33.6%) | 897 (66.4%) |
Employment Industries by Sex in Wallace
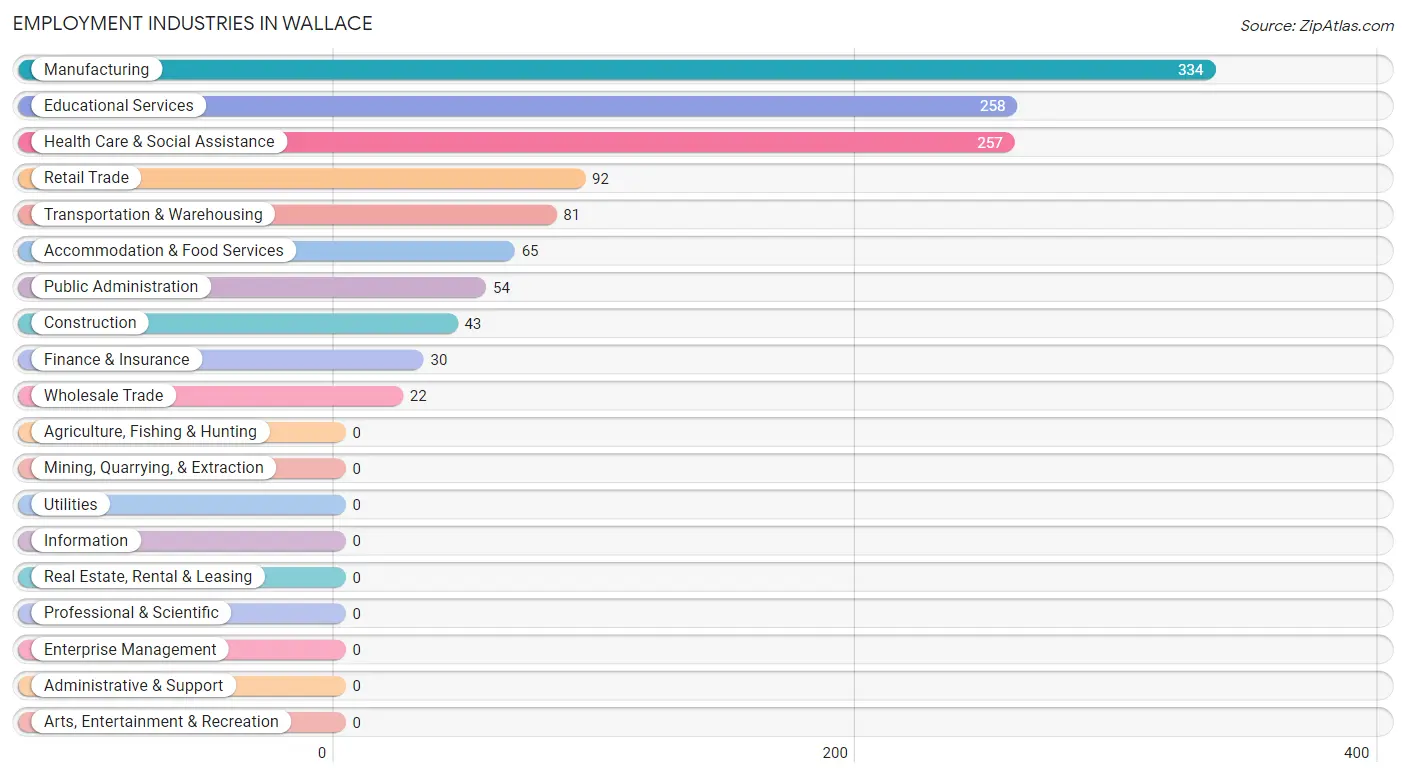
Employment Industries in Wallace
The major employment industries in Wallace include Manufacturing (334 | 24.7%), Educational Services (258 | 19.1%), Health Care & Social Assistance (257 | 19.0%), Retail Trade (92 | 6.8%), and Transportation & Warehousing (81 | 6.0%).
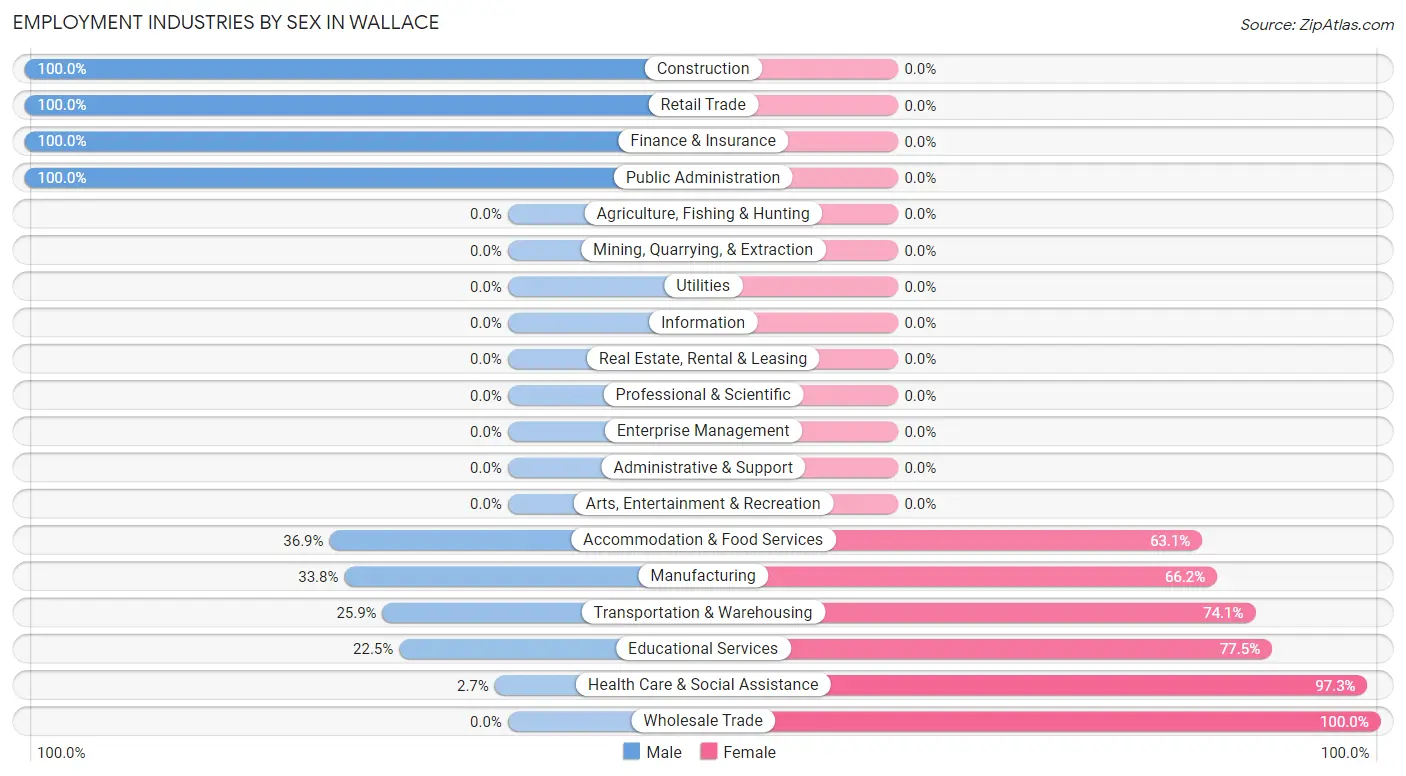
Employment Industries by Sex in Wallace
The Wallace industries that see more men than women are Construction (100.0%), Retail Trade (100.0%), and Finance & Insurance (100.0%), whereas the industries that tend to have a higher number of women are Wholesale Trade (100.0%), Health Care & Social Assistance (97.3%), and Educational Services (77.5%).
| Industry | Male | Female |
| Agriculture, Fishing & Hunting | 0 (0.0%) | 0 (0.0%) |
| Mining, Quarrying, & Extraction | 0 (0.0%) | 0 (0.0%) |
| Construction | 43 (100.0%) | 0 (0.0%) |
| Manufacturing | 113 (33.8%) | 221 (66.2%) |
| Wholesale Trade | 0 (0.0%) | 22 (100.0%) |
| Retail Trade | 92 (100.0%) | 0 (0.0%) |
| Transportation & Warehousing | 21 (25.9%) | 60 (74.1%) |
| Utilities | 0 (0.0%) | 0 (0.0%) |
| Information | 0 (0.0%) | 0 (0.0%) |
| Finance & Insurance | 30 (100.0%) | 0 (0.0%) |
| Real Estate, Rental & Leasing | 0 (0.0%) | 0 (0.0%) |
| Professional & Scientific | 0 (0.0%) | 0 (0.0%) |
| Enterprise Management | 0 (0.0%) | 0 (0.0%) |
| Administrative & Support | 0 (0.0%) | 0 (0.0%) |
| Educational Services | 58 (22.5%) | 200 (77.5%) |
| Health Care & Social Assistance | 7 (2.7%) | 250 (97.3%) |
| Arts, Entertainment & Recreation | 0 (0.0%) | 0 (0.0%) |
| Accommodation & Food Services | 24 (36.9%) | 41 (63.1%) |
| Public Administration | 54 (100.0%) | 0 (0.0%) |
| Total | 454 (33.6%) | 897 (66.4%) |
Education in Wallace
School Enrollment in Wallace
The most common levels of schooling among the 863 students in Wallace are middle school (293 | 34.0%), elementary school (241 | 27.9%), and high school (230 | 26.7%).
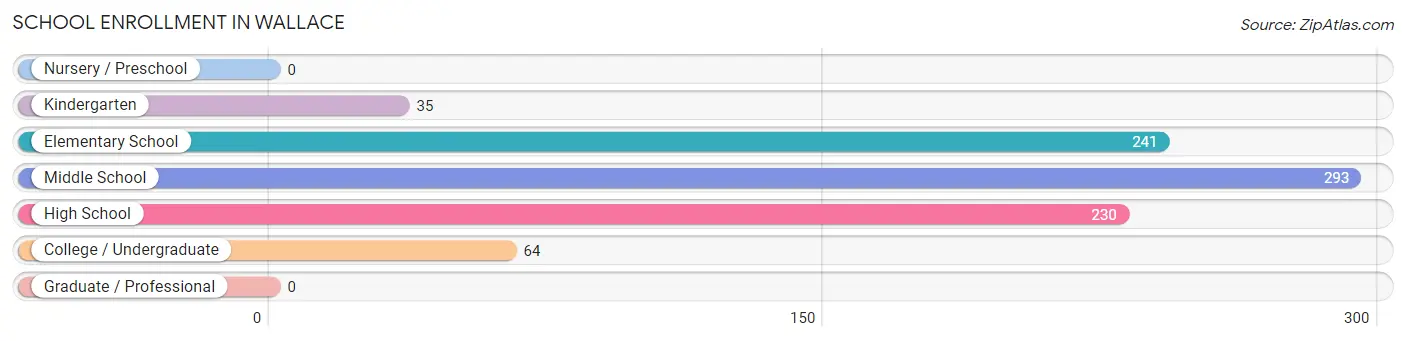
| School Level | # Students | % Students |
| Nursery / Preschool | 0 | 0.0% |
| Kindergarten | 35 | 4.1% |
| Elementary School | 241 | 27.9% |
| Middle School | 293 | 34.0% |
| High School | 230 | 26.7% |
| College / Undergraduate | 64 | 7.4% |
| Graduate / Professional | 0 | 0.0% |
| Total | 863 | 100.0% |
School Enrollment by Age by Funding Source in Wallace
Out of a total of 863 students who are enrolled in schools in Wallace, 45 (5.2%) attend a private institution, while the remaining 818 (94.8%) are enrolled in public schools. The age group of 5 to 9 year old has the highest likelihood of being enrolled in private schools, with 45 (16.3% in the age bracket) enrolled. Conversely, the age group of 10 to 14 year olds has the lowest likelihood of being enrolled in a private school, with 300 (100.0% in the age bracket) attending a public institution.
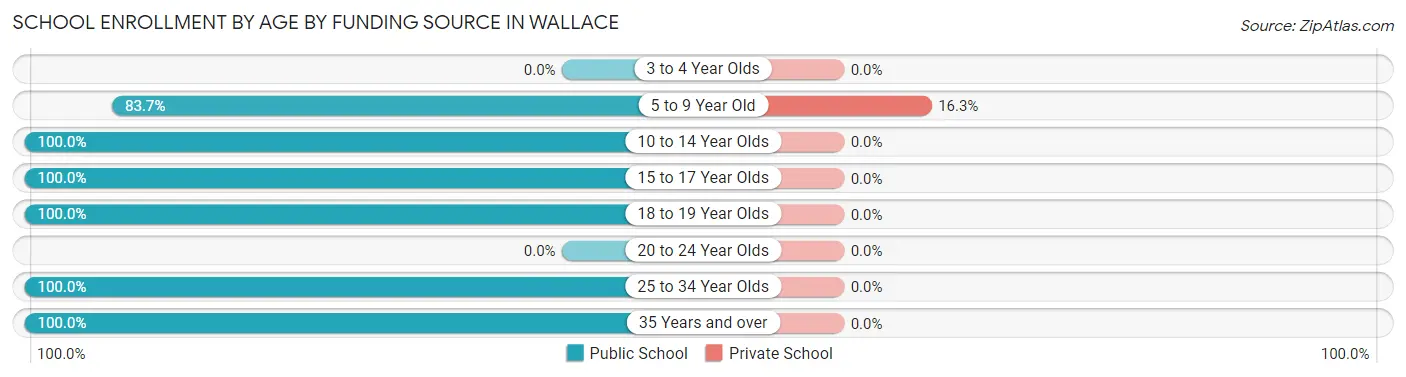
| Age Bracket | Public School | Private School |
| 3 to 4 Year Olds | 0 (0.0%) | 0 (0.0%) |
| 5 to 9 Year Old | 231 (83.7%) | 45 (16.3%) |
| 10 to 14 Year Olds | 300 (100.0%) | 0 (0.0%) |
| 15 to 17 Year Olds | 162 (100.0%) | 0 (0.0%) |
| 18 to 19 Year Olds | 61 (100.0%) | 0 (0.0%) |
| 20 to 24 Year Olds | 0 (0.0%) | 0 (0.0%) |
| 25 to 34 Year Olds | 33 (100.0%) | 0 (0.0%) |
| 35 Years and over | 31 (100.0%) | 0 (0.0%) |
| Total | 818 (94.8%) | 45 (5.2%) |
Educational Attainment by Field of Study in Wallace
Education (126 | 27.6%), arts & humanities (84 | 18.4%), psychology (77 | 16.9%), science & technology (67 | 14.7%), and visual & performing arts (41 | 9.0%) are the most common fields of study among 457 individuals in Wallace who have obtained a bachelor's degree or higher.
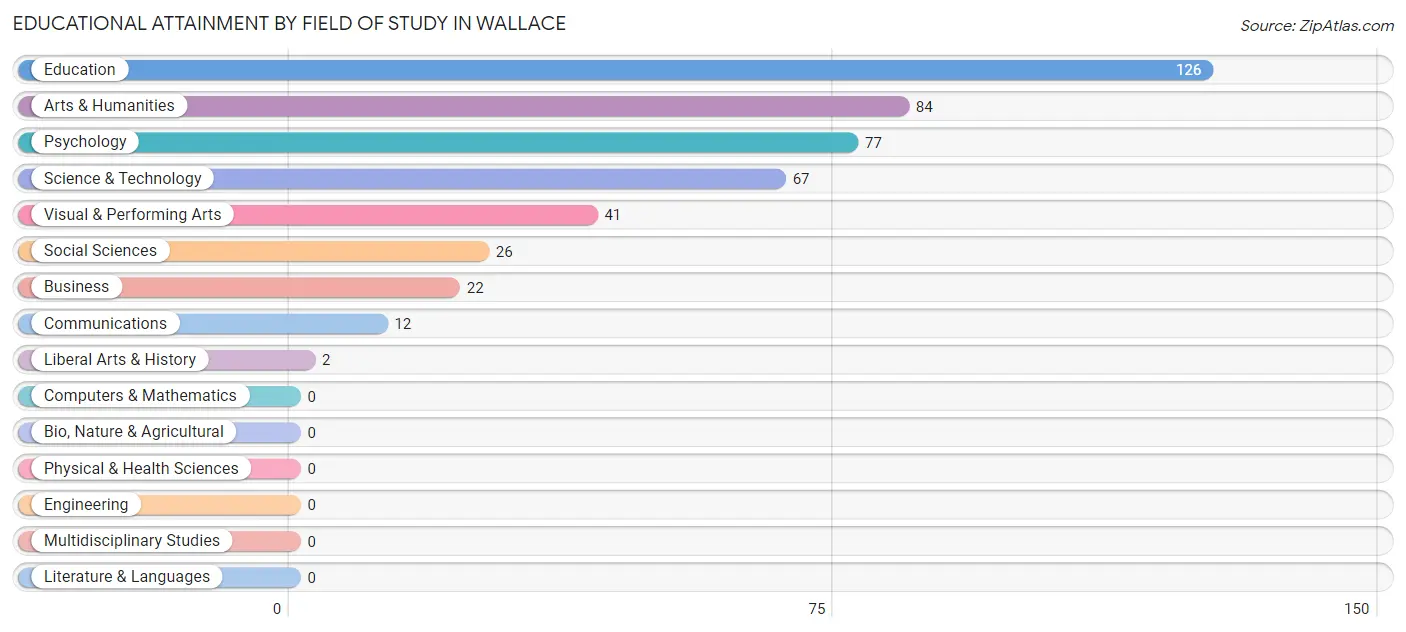
| Field of Study | # Graduates | % Graduates |
| Computers & Mathematics | 0 | 0.0% |
| Bio, Nature & Agricultural | 0 | 0.0% |
| Physical & Health Sciences | 0 | 0.0% |
| Psychology | 77 | 16.9% |
| Social Sciences | 26 | 5.7% |
| Engineering | 0 | 0.0% |
| Multidisciplinary Studies | 0 | 0.0% |
| Science & Technology | 67 | 14.7% |
| Business | 22 | 4.8% |
| Education | 126 | 27.6% |
| Literature & Languages | 0 | 0.0% |
| Liberal Arts & History | 2 | 0.4% |
| Visual & Performing Arts | 41 | 9.0% |
| Communications | 12 | 2.6% |
| Arts & Humanities | 84 | 18.4% |
| Total | 457 | 100.0% |
Transportation & Commute in Wallace
Vehicle Availability by Sex in Wallace
The most prevalent vehicle ownership categories in Wallace are males with 2 vehicles (218, accounting for 48.8%) and females with 2 vehicles (471, making up 25.7%).
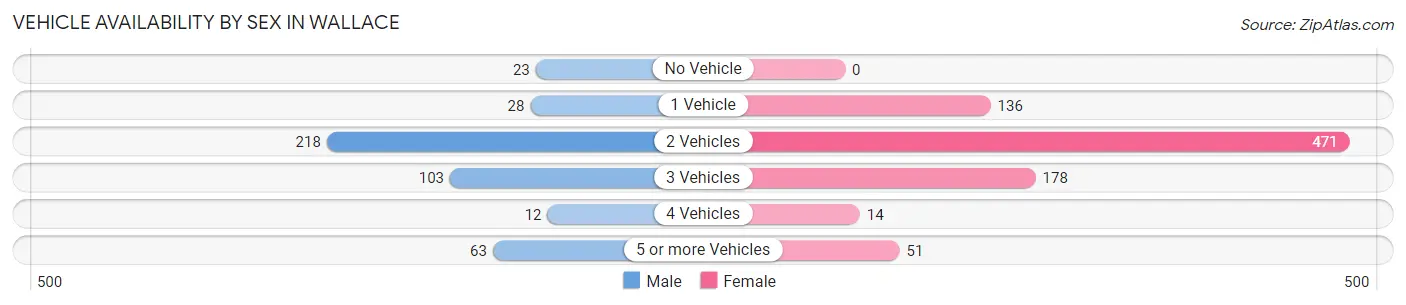
| Vehicles Available | Male | Female |
| No Vehicle | 23 (5.1%) | 0 (0.0%) |
| 1 Vehicle | 28 (6.3%) | 136 (16.0%) |
| 2 Vehicles | 218 (48.8%) | 471 (55.4%) |
| 3 Vehicles | 103 (23.0%) | 178 (20.9%) |
| 4 Vehicles | 12 (2.7%) | 14 (1.7%) |
| 5 or more Vehicles | 63 (14.1%) | 51 (6.0%) |
| Total | 447 (100.0%) | 850 (100.0%) |
Commute Time in Wallace
The most frequently occuring commute durations in Wallace are 5 to 9 minutes (433 commuters, 33.5%), 10 to 14 minutes (357 commuters, 27.7%), and 15 to 19 minutes (151 commuters, 11.7%).
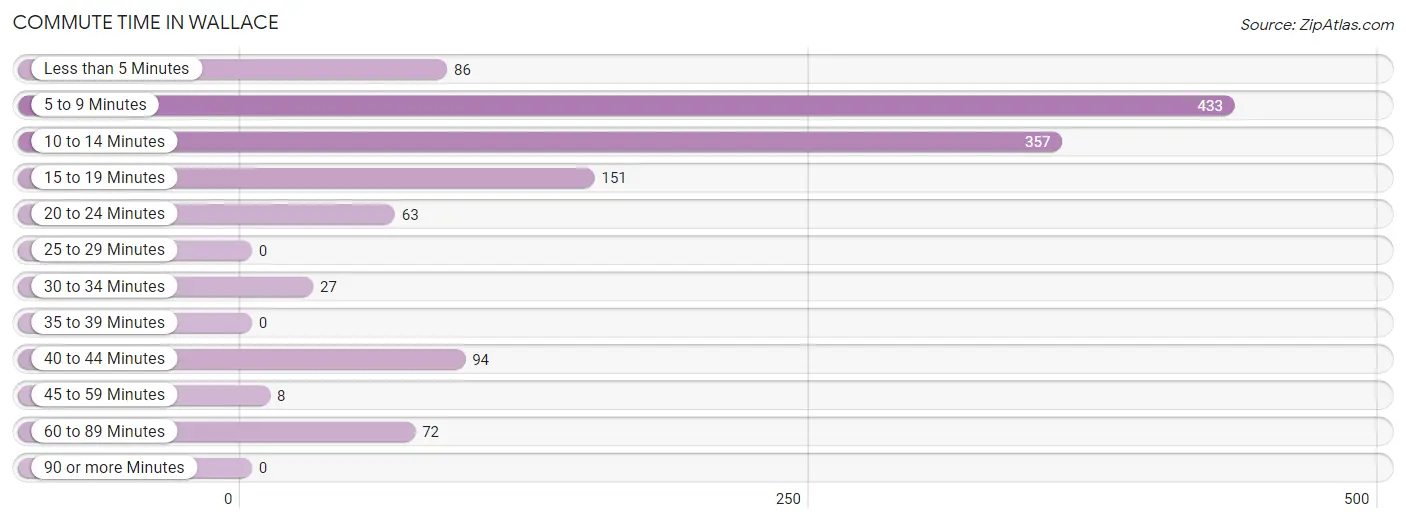
| Commute Time | # Commuters | % Commuters |
| Less than 5 Minutes | 86 | 6.7% |
| 5 to 9 Minutes | 433 | 33.5% |
| 10 to 14 Minutes | 357 | 27.7% |
| 15 to 19 Minutes | 151 | 11.7% |
| 20 to 24 Minutes | 63 | 4.9% |
| 25 to 29 Minutes | 0 | 0.0% |
| 30 to 34 Minutes | 27 | 2.1% |
| 35 to 39 Minutes | 0 | 0.0% |
| 40 to 44 Minutes | 94 | 7.3% |
| 45 to 59 Minutes | 8 | 0.6% |
| 60 to 89 Minutes | 72 | 5.6% |
| 90 or more Minutes | 0 | 0.0% |
Commute Time by Sex in Wallace
The most common commute times in Wallace are 10 to 14 minutes (156 commuters, 34.4%) for males and 5 to 9 minutes (408 commuters, 48.7%) for females.
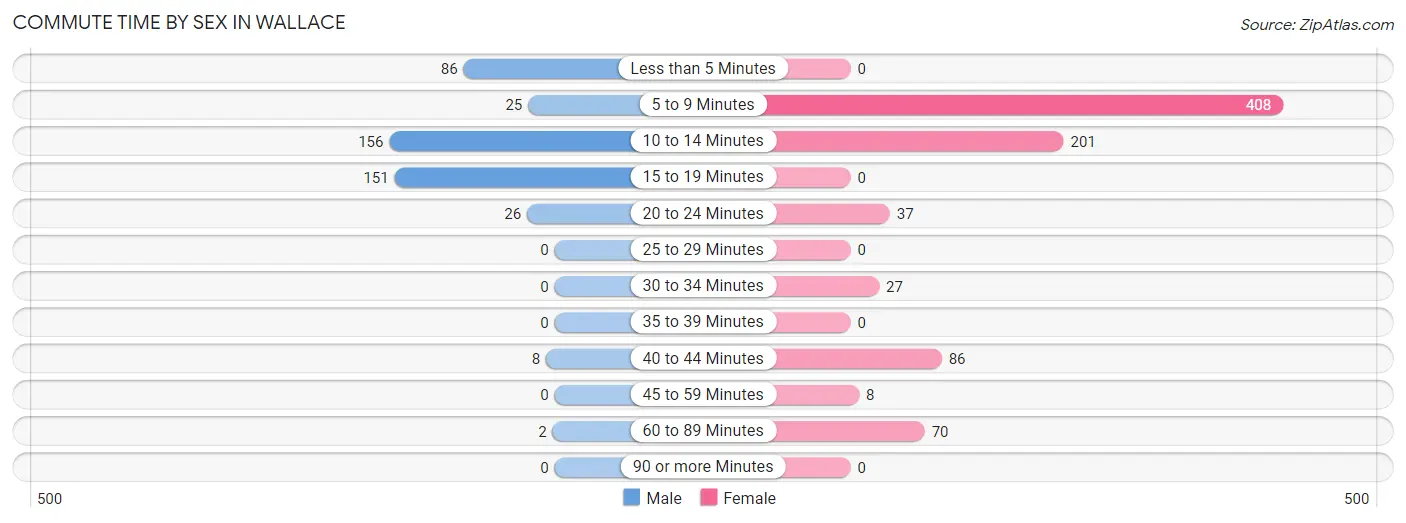
| Commute Time | Male | Female |
| Less than 5 Minutes | 86 (18.9%) | 0 (0.0%) |
| 5 to 9 Minutes | 25 (5.5%) | 408 (48.7%) |
| 10 to 14 Minutes | 156 (34.4%) | 201 (24.0%) |
| 15 to 19 Minutes | 151 (33.3%) | 0 (0.0%) |
| 20 to 24 Minutes | 26 (5.7%) | 37 (4.4%) |
| 25 to 29 Minutes | 0 (0.0%) | 0 (0.0%) |
| 30 to 34 Minutes | 0 (0.0%) | 27 (3.2%) |
| 35 to 39 Minutes | 0 (0.0%) | 0 (0.0%) |
| 40 to 44 Minutes | 8 (1.8%) | 86 (10.3%) |
| 45 to 59 Minutes | 0 (0.0%) | 8 (1.0%) |
| 60 to 89 Minutes | 2 (0.4%) | 70 (8.4%) |
| 90 or more Minutes | 0 (0.0%) | 0 (0.0%) |
Time of Departure to Work by Sex in Wallace
The most frequent times of departure to work in Wallace are 8:00 AM to 8:29 AM (107, 23.6%) for males and 5:00 AM to 5:29 AM (246, 29.4%) for females.
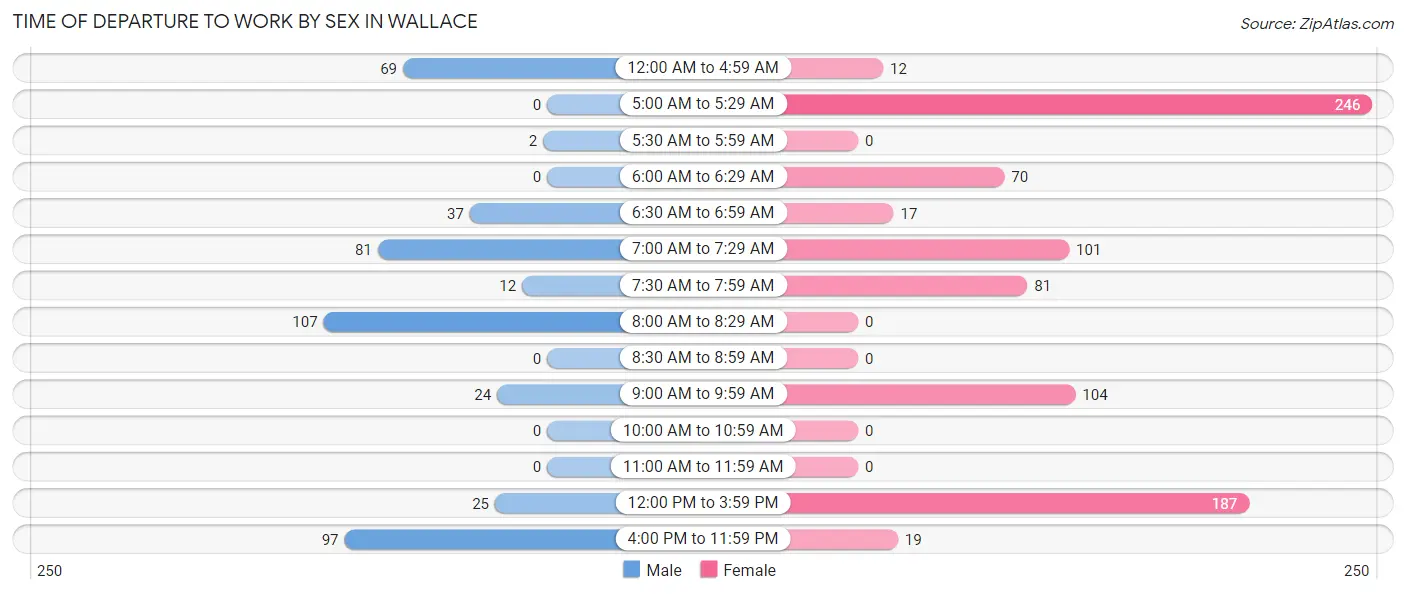
| Time of Departure | Male | Female |
| 12:00 AM to 4:59 AM | 69 (15.2%) | 12 (1.4%) |
| 5:00 AM to 5:29 AM | 0 (0.0%) | 246 (29.4%) |
| 5:30 AM to 5:59 AM | 2 (0.4%) | 0 (0.0%) |
| 6:00 AM to 6:29 AM | 0 (0.0%) | 70 (8.4%) |
| 6:30 AM to 6:59 AM | 37 (8.2%) | 17 (2.0%) |
| 7:00 AM to 7:29 AM | 81 (17.8%) | 101 (12.1%) |
| 7:30 AM to 7:59 AM | 12 (2.6%) | 81 (9.7%) |
| 8:00 AM to 8:29 AM | 107 (23.6%) | 0 (0.0%) |
| 8:30 AM to 8:59 AM | 0 (0.0%) | 0 (0.0%) |
| 9:00 AM to 9:59 AM | 24 (5.3%) | 104 (12.4%) |
| 10:00 AM to 10:59 AM | 0 (0.0%) | 0 (0.0%) |
| 11:00 AM to 11:59 AM | 0 (0.0%) | 0 (0.0%) |
| 12:00 PM to 3:59 PM | 25 (5.5%) | 187 (22.3%) |
| 4:00 PM to 11:59 PM | 97 (21.4%) | 19 (2.3%) |
| Total | 454 (100.0%) | 837 (100.0%) |
Housing Occupancy in Wallace
Occupancy by Ownership in Wallace
Of the total 1,664 dwellings in Wallace, owner-occupied units account for 989 (59.4%), while renter-occupied units make up 675 (40.6%).
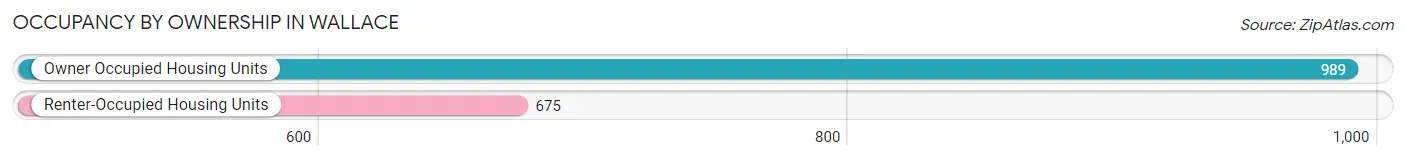
| Occupancy | # Housing Units | % Housing Units |
| Owner Occupied Housing Units | 989 | 59.4% |
| Renter-Occupied Housing Units | 675 | 40.6% |
| Total Occupied Housing Units | 1,664 | 100.0% |
Occupancy by Household Size in Wallace
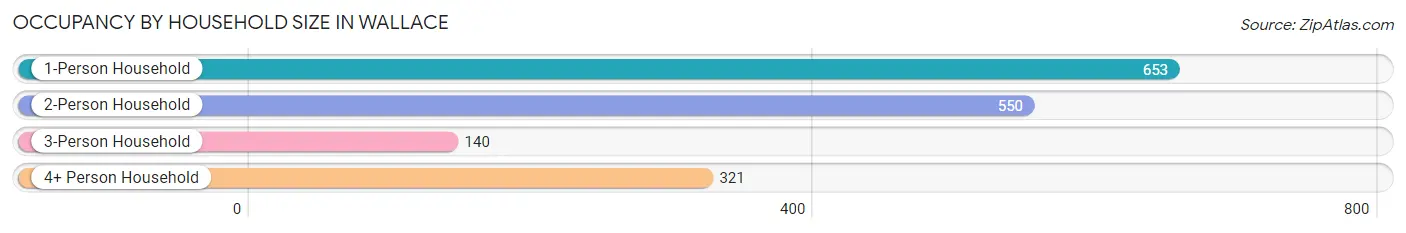
| Household Size | # Housing Units | % Housing Units |
| 1-Person Household | 653 | 39.2% |
| 2-Person Household | 550 | 33.1% |
| 3-Person Household | 140 | 8.4% |
| 4+ Person Household | 321 | 19.3% |
| Total Housing Units | 1,664 | 100.0% |
Occupancy by Ownership by Household Size in Wallace
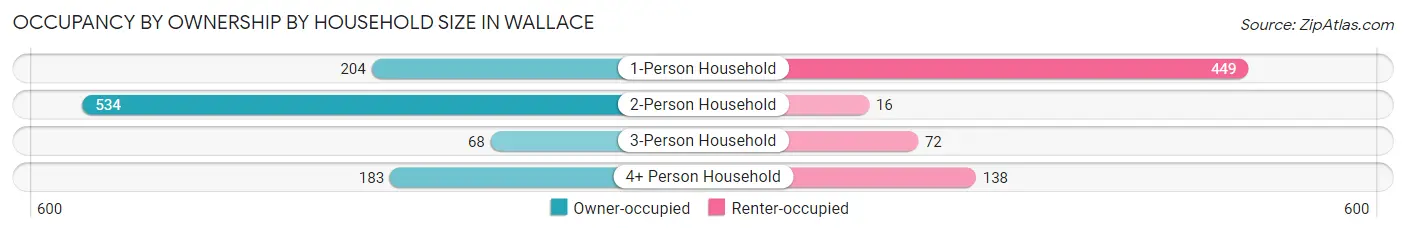
| Household Size | Owner-occupied | Renter-occupied |
| 1-Person Household | 204 (31.2%) | 449 (68.8%) |
| 2-Person Household | 534 (97.1%) | 16 (2.9%) |
| 3-Person Household | 68 (48.6%) | 72 (51.4%) |
| 4+ Person Household | 183 (57.0%) | 138 (43.0%) |
| Total Housing Units | 989 (59.4%) | 675 (40.6%) |
Occupancy by Educational Attainment in Wallace
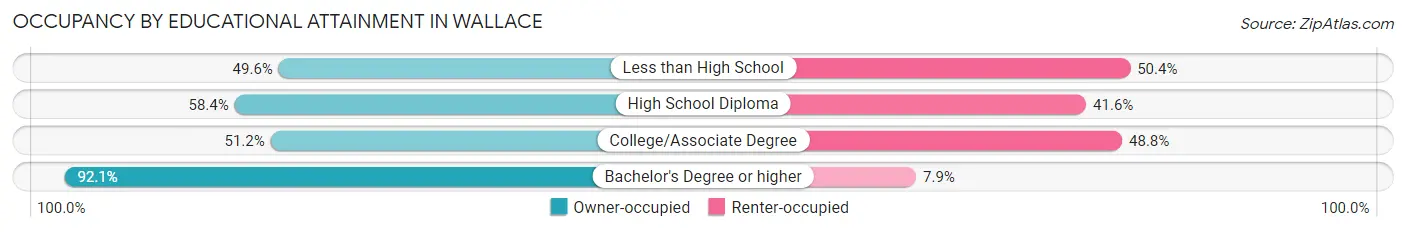
| Household Size | Owner-occupied | Renter-occupied |
| Less than High School | 269 (49.6%) | 273 (50.4%) |
| High School Diploma | 258 (58.4%) | 184 (41.6%) |
| College/Associate Degree | 206 (51.2%) | 196 (48.8%) |
| Bachelor's Degree or higher | 256 (92.1%) | 22 (7.9%) |
Occupancy by Age of Householder in Wallace
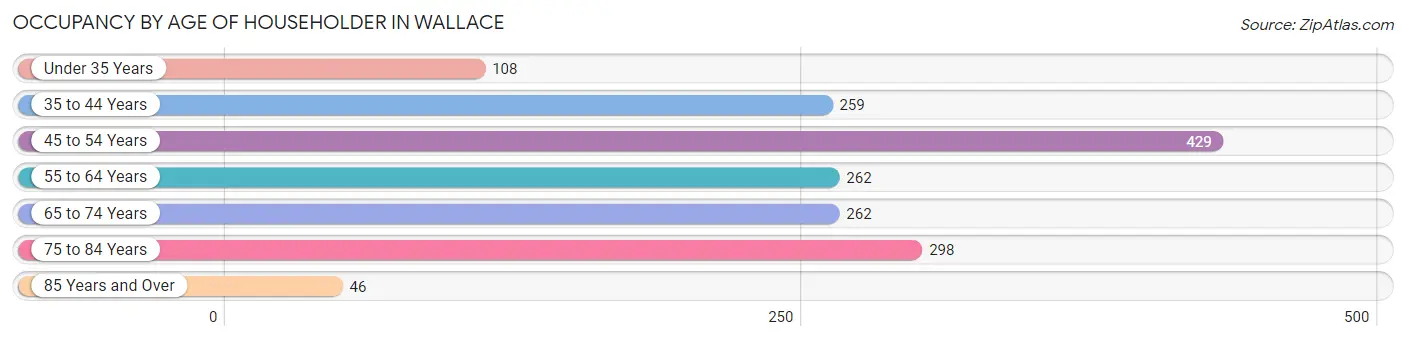
| Age Bracket | # Households | % Households |
| Under 35 Years | 108 | 6.5% |
| 35 to 44 Years | 259 | 15.6% |
| 45 to 54 Years | 429 | 25.8% |
| 55 to 64 Years | 262 | 15.8% |
| 65 to 74 Years | 262 | 15.8% |
| 75 to 84 Years | 298 | 17.9% |
| 85 Years and Over | 46 | 2.8% |
| Total | 1,664 | 100.0% |
Housing Finances in Wallace
Median Income by Occupancy in Wallace
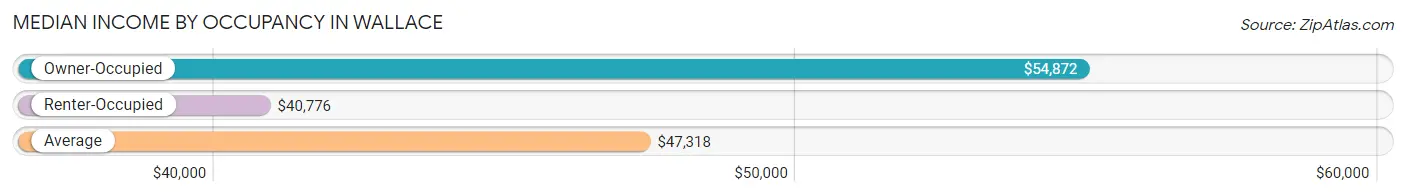
| Occupancy Type | # Households | Median Income |
| Owner-Occupied | 989 (59.4%) | $54,872 |
| Renter-Occupied | 675 (40.6%) | $40,776 |
| Average | 1,664 (100.0%) | $47,318 |
Occupancy by Householder Income Bracket in Wallace
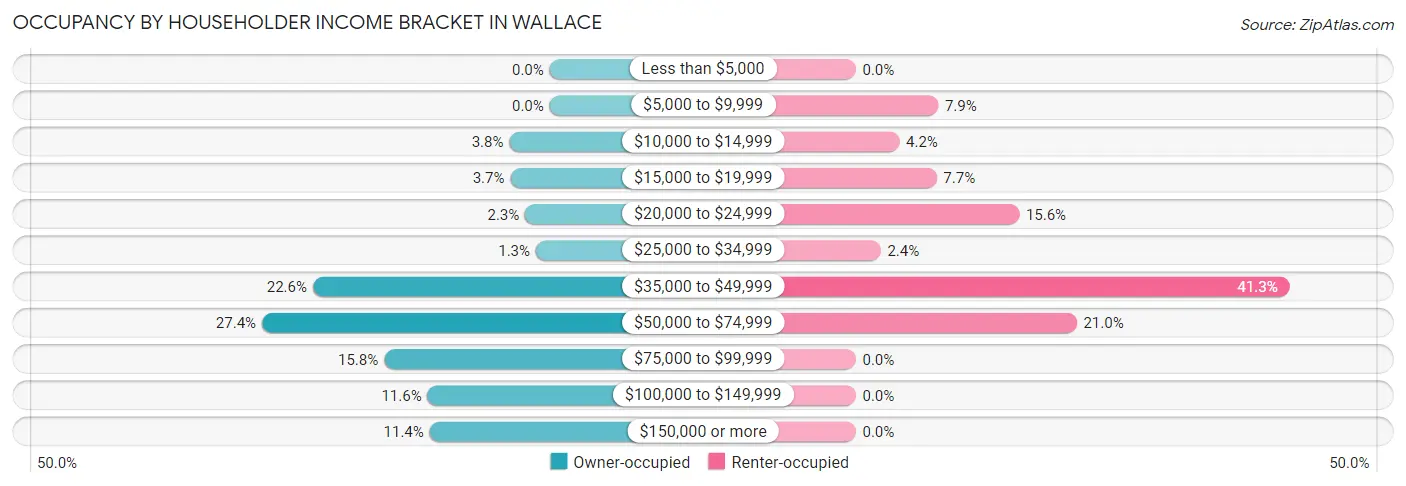
| Income Bracket | Owner-occupied | Renter-occupied |
| Less than $5,000 | 0 (0.0%) | 0 (0.0%) |
| $5,000 to $9,999 | 0 (0.0%) | 53 (7.9%) |
| $10,000 to $14,999 | 38 (3.8%) | 28 (4.2%) |
| $15,000 to $19,999 | 37 (3.7%) | 52 (7.7%) |
| $20,000 to $24,999 | 23 (2.3%) | 105 (15.6%) |
| $25,000 to $34,999 | 13 (1.3%) | 16 (2.4%) |
| $35,000 to $49,999 | 223 (22.6%) | 279 (41.3%) |
| $50,000 to $74,999 | 271 (27.4%) | 142 (21.0%) |
| $75,000 to $99,999 | 156 (15.8%) | 0 (0.0%) |
| $100,000 to $149,999 | 115 (11.6%) | 0 (0.0%) |
| $150,000 or more | 113 (11.4%) | 0 (0.0%) |
| Total | 989 (100.0%) | 675 (100.0%) |
Monthly Housing Cost Tiers in Wallace
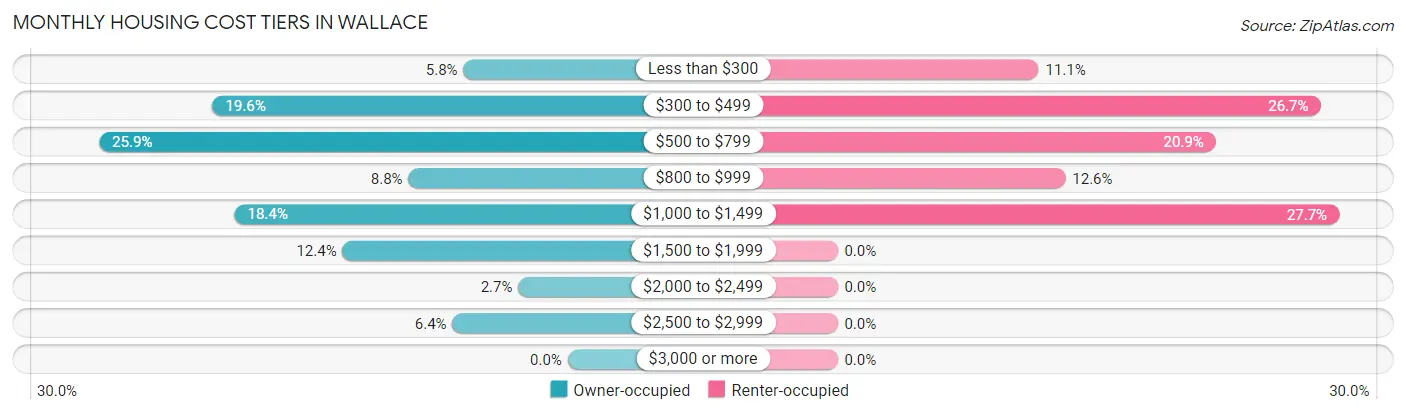
| Monthly Cost | Owner-occupied | Renter-occupied |
| Less than $300 | 57 (5.8%) | 75 (11.1%) |
| $300 to $499 | 194 (19.6%) | 180 (26.7%) |
| $500 to $799 | 256 (25.9%) | 141 (20.9%) |
| $800 to $999 | 87 (8.8%) | 85 (12.6%) |
| $1,000 to $1,499 | 182 (18.4%) | 187 (27.7%) |
| $1,500 to $1,999 | 123 (12.4%) | 0 (0.0%) |
| $2,000 to $2,499 | 27 (2.7%) | 0 (0.0%) |
| $2,500 to $2,999 | 63 (6.4%) | 0 (0.0%) |
| $3,000 or more | 0 (0.0%) | 0 (0.0%) |
| Total | 989 (100.0%) | 675 (100.0%) |
Physical Housing Characteristics in Wallace
Housing Structures in Wallace
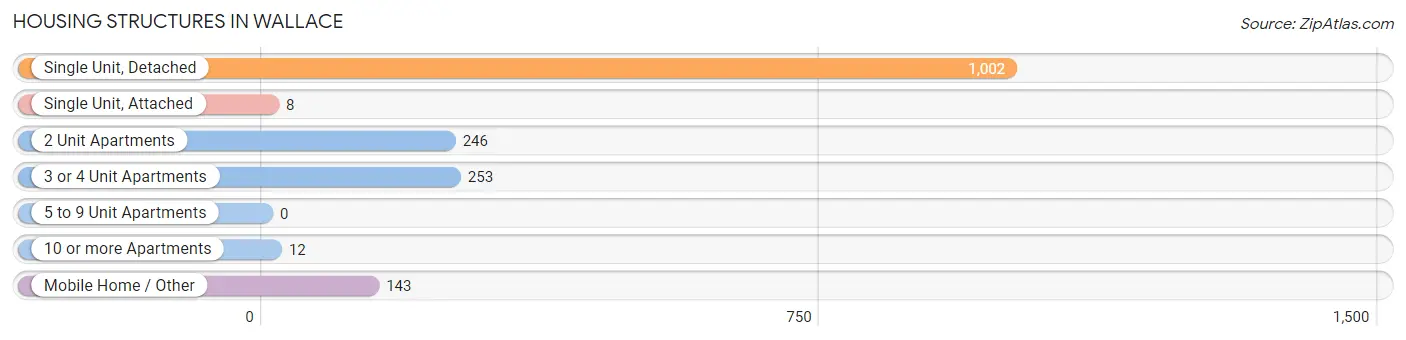
| Structure Type | # Housing Units | % Housing Units |
| Single Unit, Detached | 1,002 | 60.2% |
| Single Unit, Attached | 8 | 0.5% |
| 2 Unit Apartments | 246 | 14.8% |
| 3 or 4 Unit Apartments | 253 | 15.2% |
| 5 to 9 Unit Apartments | 0 | 0.0% |
| 10 or more Apartments | 12 | 0.7% |
| Mobile Home / Other | 143 | 8.6% |
| Total | 1,664 | 100.0% |
Housing Structures by Occupancy in Wallace
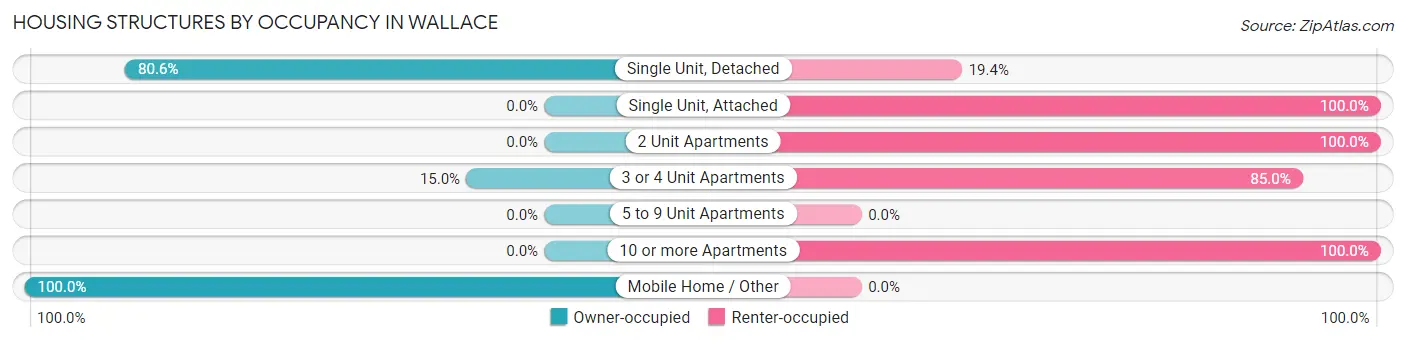
| Structure Type | Owner-occupied | Renter-occupied |
| Single Unit, Detached | 808 (80.6%) | 194 (19.4%) |
| Single Unit, Attached | 0 (0.0%) | 8 (100.0%) |
| 2 Unit Apartments | 0 (0.0%) | 246 (100.0%) |
| 3 or 4 Unit Apartments | 38 (15.0%) | 215 (85.0%) |
| 5 to 9 Unit Apartments | 0 (0.0%) | 0 (0.0%) |
| 10 or more Apartments | 0 (0.0%) | 12 (100.0%) |
| Mobile Home / Other | 143 (100.0%) | 0 (0.0%) |
| Total | 989 (59.4%) | 675 (40.6%) |
Housing Structures by Number of Rooms in Wallace
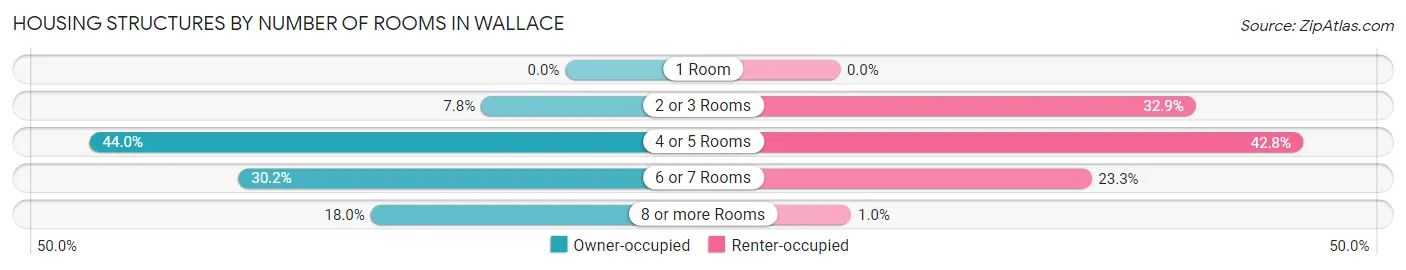
| Number of Rooms | Owner-occupied | Renter-occupied |
| 1 Room | 0 (0.0%) | 0 (0.0%) |
| 2 or 3 Rooms | 77 (7.8%) | 222 (32.9%) |
| 4 or 5 Rooms | 435 (44.0%) | 289 (42.8%) |
| 6 or 7 Rooms | 299 (30.2%) | 157 (23.3%) |
| 8 or more Rooms | 178 (18.0%) | 7 (1.0%) |
| Total | 989 (100.0%) | 675 (100.0%) |
Housing Structure by Heating Type in Wallace
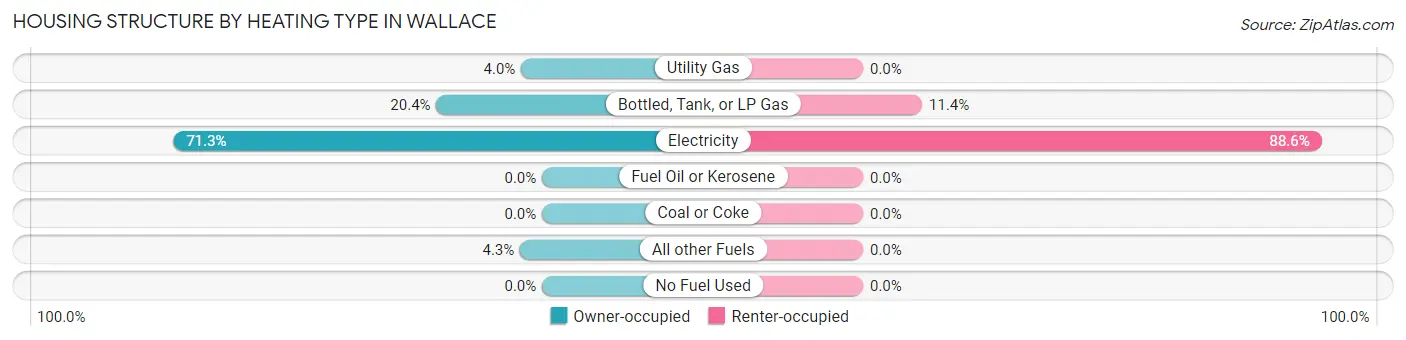
| Heating Type | Owner-occupied | Renter-occupied |
| Utility Gas | 40 (4.0%) | 0 (0.0%) |
| Bottled, Tank, or LP Gas | 202 (20.4%) | 77 (11.4%) |
| Electricity | 705 (71.3%) | 598 (88.6%) |
| Fuel Oil or Kerosene | 0 (0.0%) | 0 (0.0%) |
| Coal or Coke | 0 (0.0%) | 0 (0.0%) |
| All other Fuels | 42 (4.3%) | 0 (0.0%) |
| No Fuel Used | 0 (0.0%) | 0 (0.0%) |
| Total | 989 (100.0%) | 675 (100.0%) |
Household Vehicle Usage in Wallace
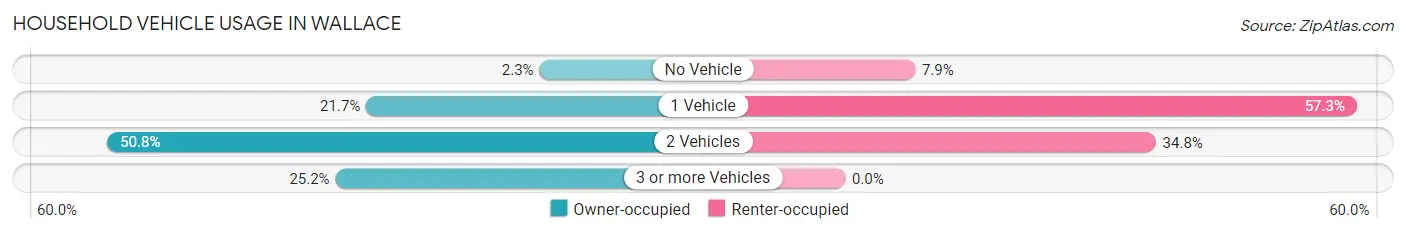
| Vehicles per Household | Owner-occupied | Renter-occupied |
| No Vehicle | 23 (2.3%) | 53 (7.9%) |
| 1 Vehicle | 215 (21.7%) | 387 (57.3%) |
| 2 Vehicles | 502 (50.8%) | 235 (34.8%) |
| 3 or more Vehicles | 249 (25.2%) | 0 (0.0%) |
| Total | 989 (100.0%) | 675 (100.0%) |
Real Estate & Mortgages in Wallace
Real Estate and Mortgage Overview in Wallace
| Characteristic | Without Mortgage | With Mortgage |
| Housing Units | 507 | 482 |
| Median Property Value | - | - |
| Median Household Income | $53,916 | $41 |
| Monthly Housing Costs | $504 | $0 |
| Real Estate Taxes | $1,045 | $60 |
Property Value by Mortgage Status in Wallace
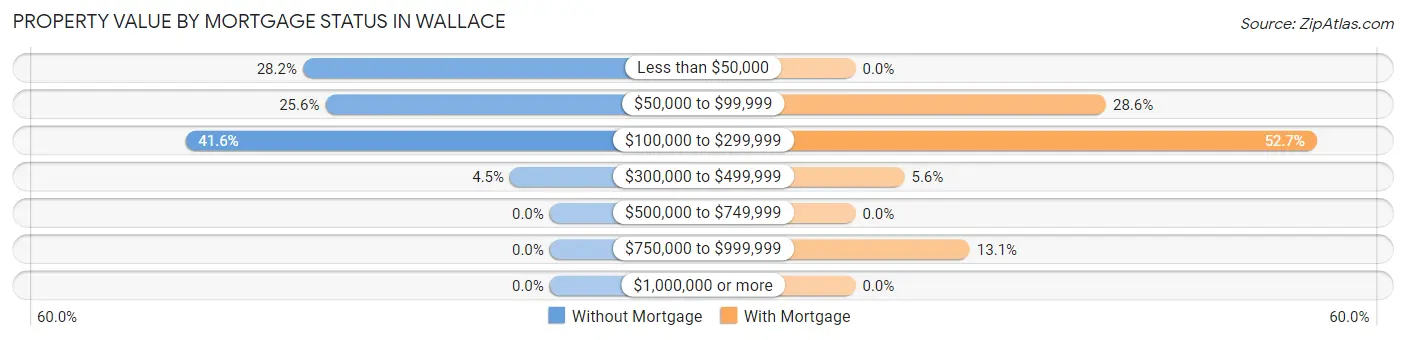
| Property Value | Without Mortgage | With Mortgage |
| Less than $50,000 | 143 (28.2%) | 0 (0.0%) |
| $50,000 to $99,999 | 130 (25.6%) | 138 (28.6%) |
| $100,000 to $299,999 | 211 (41.6%) | 254 (52.7%) |
| $300,000 to $499,999 | 23 (4.5%) | 27 (5.6%) |
| $500,000 to $749,999 | 0 (0.0%) | 0 (0.0%) |
| $750,000 to $999,999 | 0 (0.0%) | 63 (13.1%) |
| $1,000,000 or more | 0 (0.0%) | 0 (0.0%) |
| Total | 507 (100.0%) | 482 (100.0%) |
Household Income by Mortgage Status in Wallace
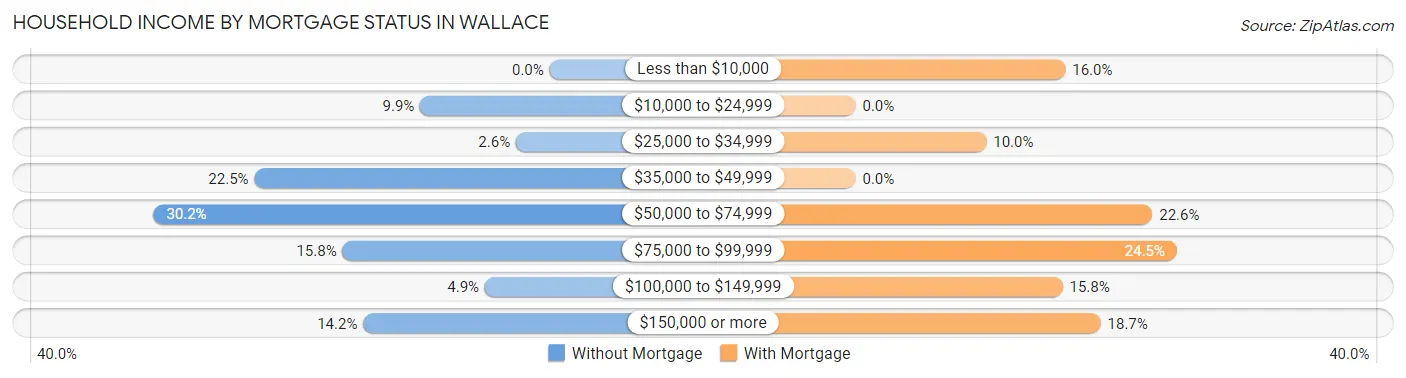
| Household Income | Without Mortgage | With Mortgage |
| Less than $10,000 | 0 (0.0%) | 77 (16.0%) |
| $10,000 to $24,999 | 50 (9.9%) | 0 (0.0%) |
| $25,000 to $34,999 | 13 (2.6%) | 48 (10.0%) |
| $35,000 to $49,999 | 114 (22.5%) | 0 (0.0%) |
| $50,000 to $74,999 | 153 (30.2%) | 109 (22.6%) |
| $75,000 to $99,999 | 80 (15.8%) | 118 (24.5%) |
| $100,000 to $149,999 | 25 (4.9%) | 76 (15.8%) |
| $150,000 or more | 72 (14.2%) | 90 (18.7%) |
| Total | 507 (100.0%) | 482 (100.0%) |
Property Value to Household Income Ratio in Wallace
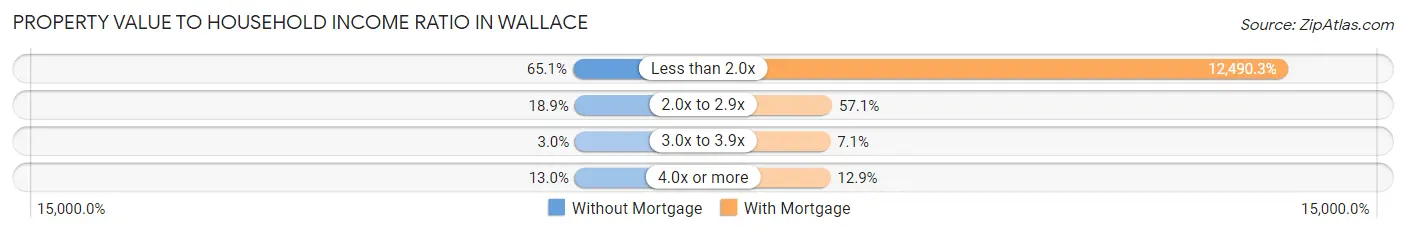
| Value-to-Income Ratio | Without Mortgage | With Mortgage |
| Less than 2.0x | 330 (65.1%) | 60,203 (12,490.3%) |
| 2.0x to 2.9x | 96 (18.9%) | 275 (57.1%) |
| 3.0x to 3.9x | 15 (3.0%) | 34 (7.0%) |
| 4.0x or more | 66 (13.0%) | 62 (12.9%) |
| Total | 507 (100.0%) | 482 (100.0%) |
Real Estate Taxes by Mortgage Status in Wallace
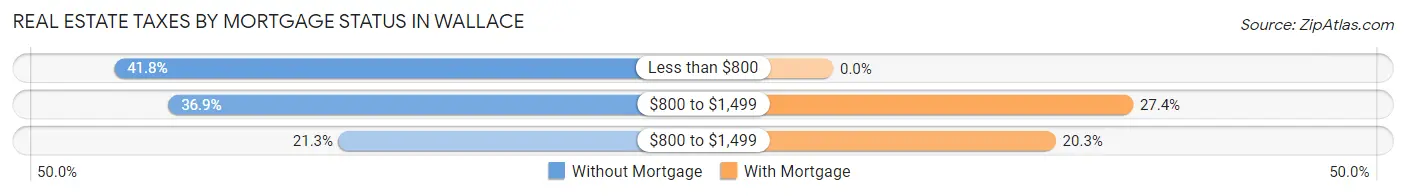
| Property Taxes | Without Mortgage | With Mortgage |
| Less than $800 | 212 (41.8%) | 0 (0.0%) |
| $800 to $1,499 | 187 (36.9%) | 132 (27.4%) |
| $800 to $1,499 | 108 (21.3%) | 98 (20.3%) |
| Total | 507 (100.0%) | 482 (100.0%) |
Health & Disability in Wallace
Health Insurance Coverage by Age in Wallace
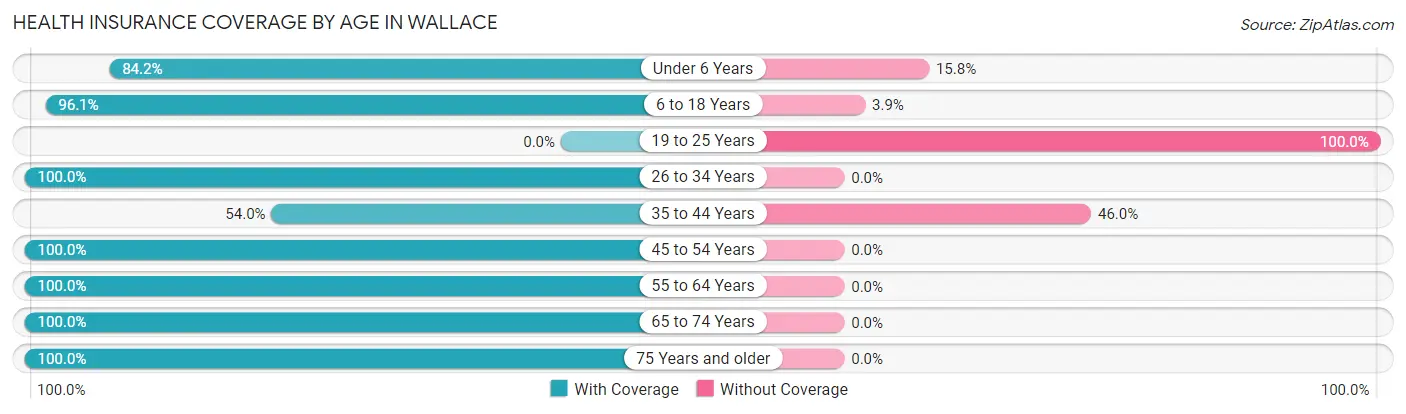
| Age Bracket | With Coverage | Without Coverage |
| Under 6 Years | 48 (84.2%) | 9 (15.8%) |
| 6 to 18 Years | 818 (96.1%) | 33 (3.9%) |
| 19 to 25 Years | 0 (0.0%) | 70 (100.0%) |
| 26 to 34 Years | 193 (100.0%) | 0 (0.0%) |
| 35 to 44 Years | 183 (54.0%) | 156 (46.0%) |
| 45 to 54 Years | 660 (100.0%) | 0 (0.0%) |
| 55 to 64 Years | 377 (100.0%) | 0 (0.0%) |
| 65 to 74 Years | 379 (100.0%) | 0 (0.0%) |
| 75 Years and older | 435 (100.0%) | 0 (0.0%) |
| Total | 3,093 (92.0%) | 268 (8.0%) |
Health Insurance Coverage by Citizenship Status in Wallace
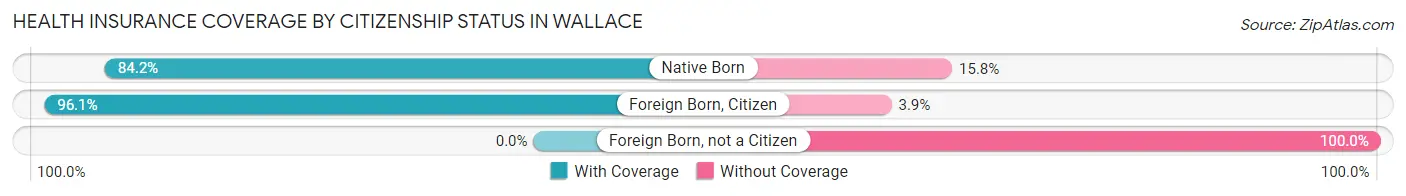
| Citizenship Status | With Coverage | Without Coverage |
| Native Born | 48 (84.2%) | 9 (15.8%) |
| Foreign Born, Citizen | 818 (96.1%) | 33 (3.9%) |
| Foreign Born, not a Citizen | 0 (0.0%) | 70 (100.0%) |
Health Insurance Coverage by Household Income in Wallace
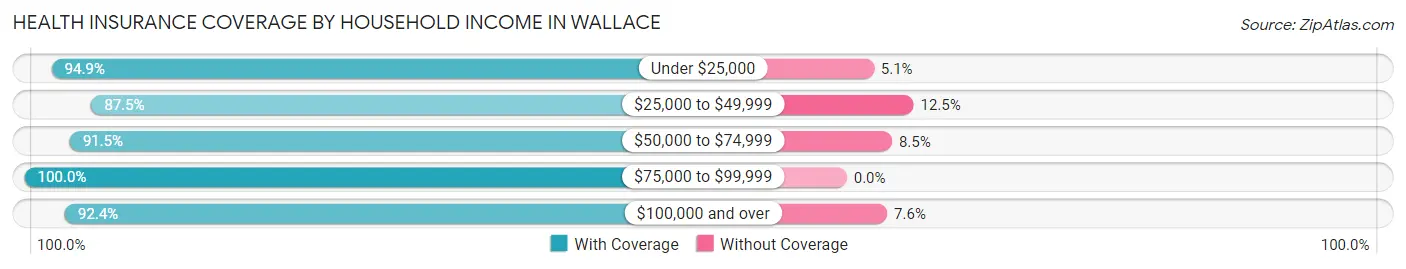
| Household Income | With Coverage | Without Coverage |
| Under $25,000 | 524 (94.9%) | 28 (5.1%) |
| $25,000 to $49,999 | 769 (87.5%) | 110 (12.5%) |
| $50,000 to $74,999 | 876 (91.5%) | 81 (8.5%) |
| $75,000 to $99,999 | 318 (100.0%) | 0 (0.0%) |
| $100,000 and over | 599 (92.4%) | 49 (7.6%) |
Public vs Private Health Insurance Coverage by Age in Wallace
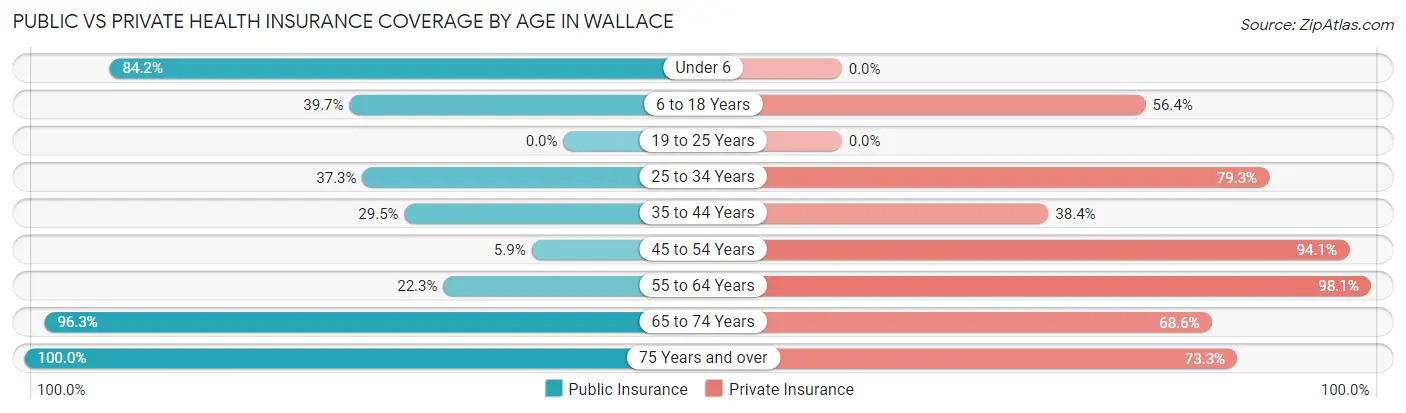
| Age Bracket | Public Insurance | Private Insurance |
| Under 6 | 48 (84.2%) | 0 (0.0%) |
| 6 to 18 Years | 338 (39.7%) | 480 (56.4%) |
| 19 to 25 Years | 0 (0.0%) | 0 (0.0%) |
| 25 to 34 Years | 72 (37.3%) | 153 (79.3%) |
| 35 to 44 Years | 100 (29.5%) | 130 (38.4%) |
| 45 to 54 Years | 39 (5.9%) | 621 (94.1%) |
| 55 to 64 Years | 84 (22.3%) | 370 (98.1%) |
| 65 to 74 Years | 365 (96.3%) | 260 (68.6%) |
| 75 Years and over | 435 (100.0%) | 319 (73.3%) |
| Total | 1,481 (44.1%) | 2,333 (69.4%) |
Disability Status by Sex by Age in Wallace
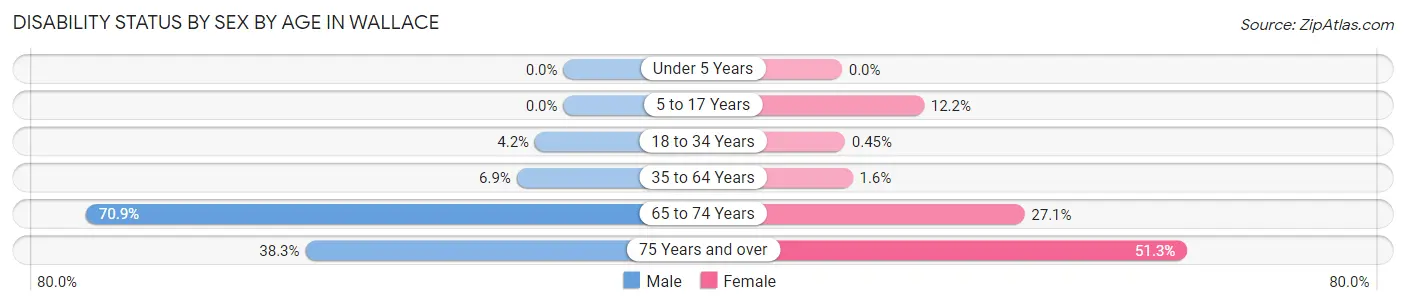
| Age Bracket | Male | Female |
| Under 5 Years | 0 (0.0%) | 0 (0.0%) |
| 5 to 17 Years | 0 (0.0%) | 43 (12.2%) |
| 18 to 34 Years | 7 (4.2%) | 1 (0.4%) |
| 35 to 64 Years | 30 (6.9%) | 15 (1.6%) |
| 65 to 74 Years | 151 (70.9%) | 45 (27.1%) |
| 75 Years and over | 77 (38.3%) | 120 (51.3%) |
Disability Class by Sex by Age in Wallace
Disability Class: Hearing Difficulty
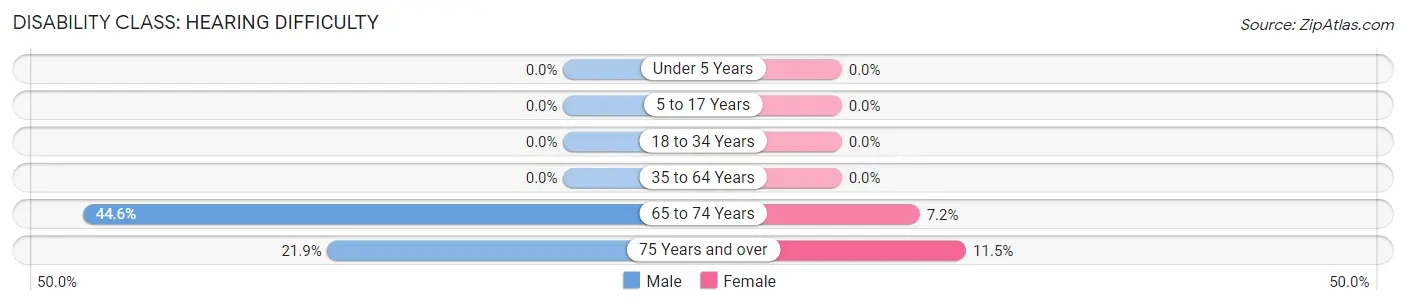
| Age Bracket | Male | Female |
| Under 5 Years | 0 (0.0%) | 0 (0.0%) |
| 5 to 17 Years | 0 (0.0%) | 0 (0.0%) |
| 18 to 34 Years | 0 (0.0%) | 0 (0.0%) |
| 35 to 64 Years | 0 (0.0%) | 0 (0.0%) |
| 65 to 74 Years | 95 (44.6%) | 12 (7.2%) |
| 75 Years and over | 44 (21.9%) | 27 (11.5%) |
Disability Class: Vision Difficulty
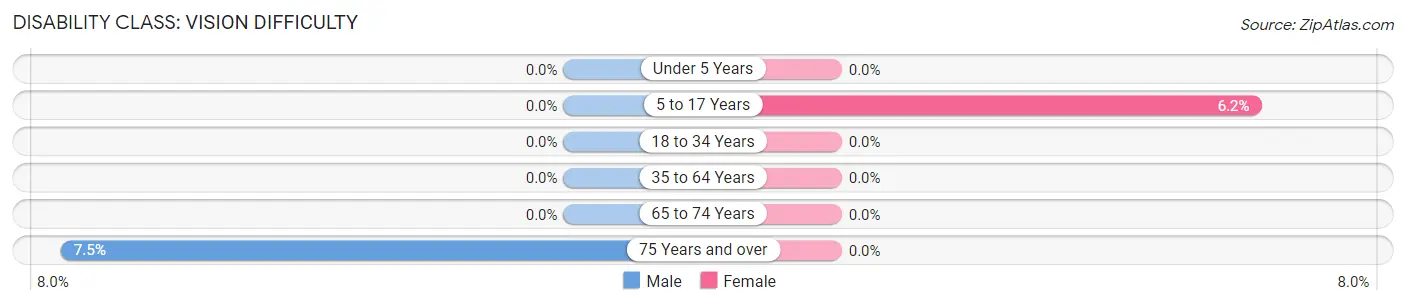
| Age Bracket | Male | Female |
| Under 5 Years | 0 (0.0%) | 0 (0.0%) |
| 5 to 17 Years | 0 (0.0%) | 22 (6.2%) |
| 18 to 34 Years | 0 (0.0%) | 0 (0.0%) |
| 35 to 64 Years | 0 (0.0%) | 0 (0.0%) |
| 65 to 74 Years | 0 (0.0%) | 0 (0.0%) |
| 75 Years and over | 15 (7.5%) | 0 (0.0%) |
Disability Class: Cognitive Difficulty
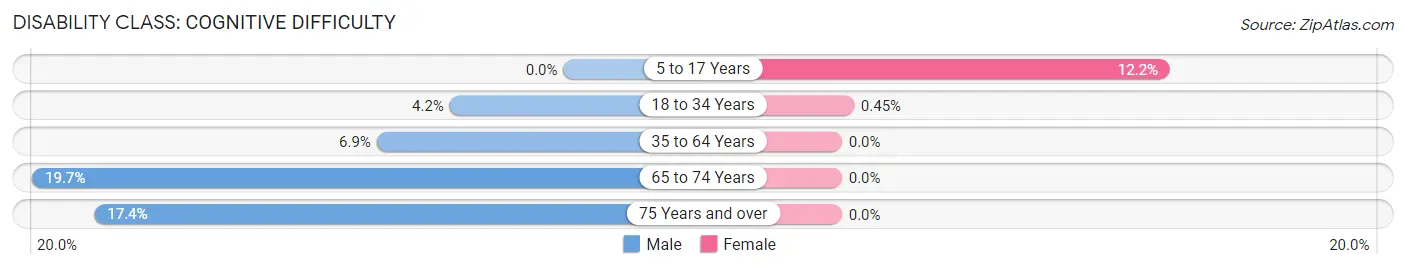
| Age Bracket | Male | Female |
| 5 to 17 Years | 0 (0.0%) | 43 (12.2%) |
| 18 to 34 Years | 7 (4.2%) | 1 (0.4%) |
| 35 to 64 Years | 30 (6.9%) | 0 (0.0%) |
| 65 to 74 Years | 42 (19.7%) | 0 (0.0%) |
| 75 Years and over | 35 (17.4%) | 0 (0.0%) |
Disability Class: Ambulatory Difficulty
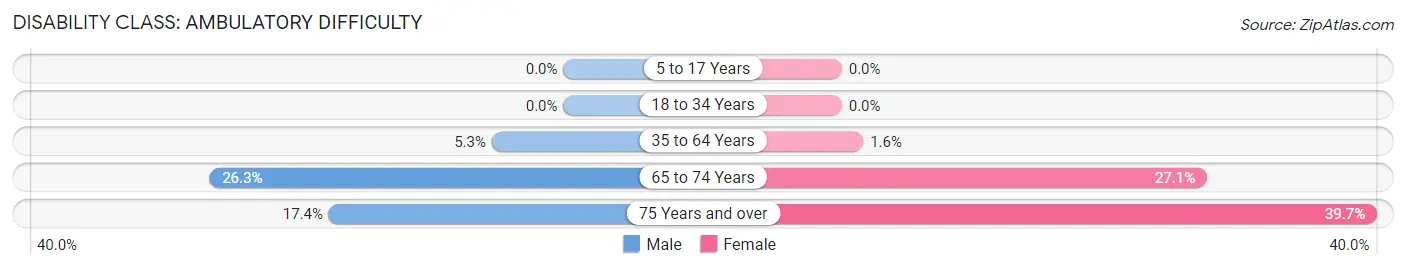
| Age Bracket | Male | Female |
| 5 to 17 Years | 0 (0.0%) | 0 (0.0%) |
| 18 to 34 Years | 0 (0.0%) | 0 (0.0%) |
| 35 to 64 Years | 23 (5.3%) | 15 (1.6%) |
| 65 to 74 Years | 56 (26.3%) | 45 (27.1%) |
| 75 Years and over | 35 (17.4%) | 93 (39.7%) |
Disability Class: Self-Care Difficulty
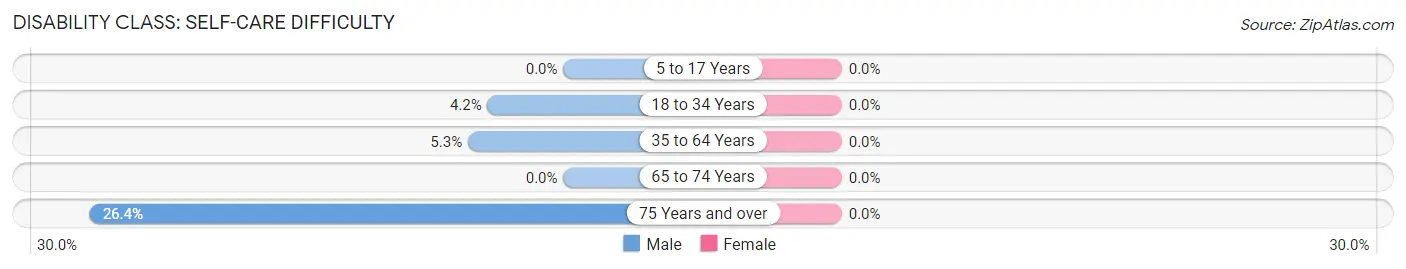
| Age Bracket | Male | Female |
| 5 to 17 Years | 0 (0.0%) | 0 (0.0%) |
| 18 to 34 Years | 7 (4.2%) | 0 (0.0%) |
| 35 to 64 Years | 23 (5.3%) | 0 (0.0%) |
| 65 to 74 Years | 0 (0.0%) | 0 (0.0%) |
| 75 Years and over | 53 (26.4%) | 0 (0.0%) |
Technology Access in Wallace
Computing Device Access in Wallace
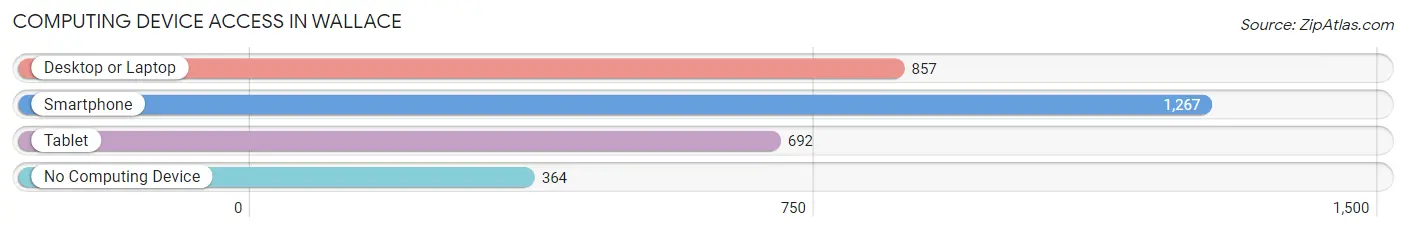
| Device Type | # Households | % Households |
| Desktop or Laptop | 857 | 51.5% |
| Smartphone | 1,267 | 76.1% |
| Tablet | 692 | 41.6% |
| No Computing Device | 364 | 21.9% |
| Total | 1,664 | 100.0% |
Internet Access in Wallace
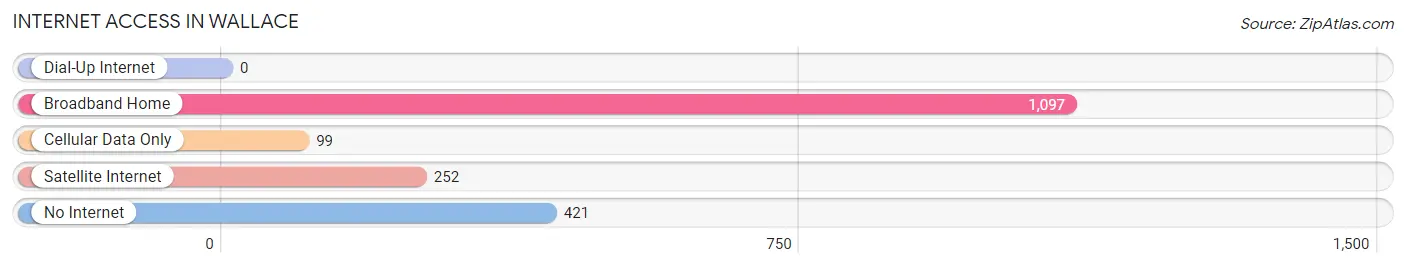
| Internet Type | # Households | % Households |
| Dial-Up Internet | 0 | 0.0% |
| Broadband Home | 1,097 | 65.9% |
| Cellular Data Only | 99 | 5.9% |
| Satellite Internet | 252 | 15.1% |
| No Internet | 421 | 25.3% |
| Total | 1,664 | 100.0% |
Wallace Summary
Wallace, North Carolina is a small town located in Duplin County, North Carolina. It is situated in the southeastern part of the state, approximately 40 miles east of Wilmington and 40 miles west of Jacksonville. The town has a population of approximately 4,000 people and is part of the larger Wallace-Rose Hill Micropolitan Statistical Area.
Geography
Wallace is located in the Coastal Plain region of North Carolina, which is characterized by flat terrain and sandy soils. The town is situated on the banks of the Northeast Cape Fear River, which provides a natural boundary between Wallace and the neighboring town of Rose Hill. The town is also located near the intersection of US Highway 117 and NC Highway 41.
The climate in Wallace is humid subtropical, with hot, humid summers and mild winters. The average annual temperature is around 70 degrees Fahrenheit, with average highs in the summer reaching the mid-90s and average lows in the winter reaching the mid-30s. The area receives an average of 48 inches of precipitation per year, with most of it falling in the summer months.
Economy
The economy of Wallace is largely based on agriculture, with the town being home to several large farms and agricultural businesses. The town is also home to several manufacturing and industrial businesses, including a paper mill, a furniture factory, and a plastics plant.
The town is also home to several retail businesses, including a grocery store, a hardware store, and several restaurants. There are also several small businesses in the area, including a barber shop, a beauty salon, and a florist.
Demographics
As of the 2010 census, the population of Wallace was 4,068. The racial makeup of the town was 79.3% White, 16.2% African American, 0.7% Native American, 0.4% Asian, 0.1% Pacific Islander, and 3.3% from other races. Hispanic or Latino of any race were 2.2% of the population.
The median household income in Wallace was $31,944, and the median family income was $41,250. The per capita income was $17,845. About 17.2% of families and 21.2% of the population were below the poverty line, including 28.3% of those under age 18 and 16.2% of those age 65 or over.
Conclusion
Wallace, North Carolina is a small town located in Duplin County, North Carolina. It is situated in the southeastern part of the state, approximately 40 miles east of Wilmington and 40 miles west of Jacksonville. The town has a population of approximately 4,000 people and is part of the larger Wallace-Rose Hill Micropolitan Statistical Area. The economy of Wallace is largely based on agriculture, with the town being home to several large farms and agricultural businesses. The town is also home to several manufacturing and industrial businesses, as well as several retail businesses and small businesses. The racial makeup of the town is 79.3% White, 16.2% African American, 0.7% Native American, 0.4% Asian, 0.1% Pacific Islander, and 3.3% from other races. The median household income in Wallace was $31,944, and the median family income was $41,250. The per capita income was $17,845. About 17.2% of families and 21.2% of the population were below the poverty line.
Common Questions
What is Per Capita Income in Wallace?
Per Capita income in Wallace is $28,395.
What is the Median Family Income in Wallace?
Median Family Income in Wallace is $62,878.
What is the Median Household income in Wallace?
Median Household Income in Wallace is $47,318.
What is Income or Wage Gap in Wallace?
Income or Wage Gap in Wallace is 4.2%.
Women in Wallace earn 95.8 cents for every dollar earned by a man.
What is Inequality or Gini Index in Wallace?
Inequality or Gini Index in Wallace is 0.38.
What is the Total Population of Wallace?
Total Population of Wallace is 3,443.
What is the Total Male Population of Wallace?
Total Male Population of Wallace is 1,487.
What is the Total Female Population of Wallace?
Total Female Population of Wallace is 1,956.
What is the Ratio of Males per 100 Females in Wallace?
There are 76.02 Males per 100 Females in Wallace.
What is the Ratio of Females per 100 Males in Wallace?
There are 131.54 Females per 100 Males in Wallace.
What is the Median Population Age in Wallace?
Median Population Age in Wallace is 46.2 Years.
What is the Average Family Size in Wallace
Average Family Size in Wallace is 2.7 People.
What is the Average Household Size in Wallace
Average Household Size in Wallace is 2.0 People.
How Large is the Labor Force in Wallace?
There are 1,554 People in the Labor Forcein in Wallace.
What is the Percentage of People in the Labor Force in Wallace?
56.8% of People are in the Labor Force in Wallace.
What is the Unemployment Rate in Wallace?
Unemployment Rate in Wallace is 13.1%.