Mocksville, NC Map & Demographics
Mocksville Map
Mocksville Overview
$27,804
PER CAPITA INCOME
$76,161
AVG FAMILY INCOME
$46,553
AVG HOUSEHOLD INCOME
49.4%
WAGE / INCOME GAP [ % ]
50.6¢/ $1
WAGE / INCOME GAP [ $ ]
$17,845
FAMILY INCOME DEFICIT
0.45
INEQUALITY / GINI INDEX
5,908
TOTAL POPULATION
2,886
MALE POPULATION
3,022
FEMALE POPULATION
95.50
MALES / 100 FEMALES
104.71
FEMALES / 100 MALES
34.2
MEDIAN AGE
3.8
AVG FAMILY SIZE
2.6
AVG HOUSEHOLD SIZE
2,895
LABOR FORCE [ PEOPLE ]
62.6%
PERCENT IN LABOR FORCE
5.9%
UNEMPLOYMENT RATE
Mocksville Zip Codes
Mocksville Area Codes
Income in Mocksville
Income Overview in Mocksville
Per Capita Income in Mocksville is $27,804, while median incomes of families and households are $76,161 and $46,553 respectively.
| Characteristic | Number | Measure |
| Per Capita Income | 5,908 | $27,804 |
| Median Family Income | 1,171 | $76,161 |
| Mean Family Income | 1,171 | $89,341 |
| Median Household Income | 2,202 | $46,553 |
| Mean Household Income | 2,202 | $66,283 |
| Income Deficit | 1,171 | $17,845 |
| Wage / Income Gap (%) | 5,908 | 49.41% |
| Wage / Income Gap ($) | 5,908 | 50.59¢ per $1 |
| Gini / Inequality Index | 5,908 | 0.45 |
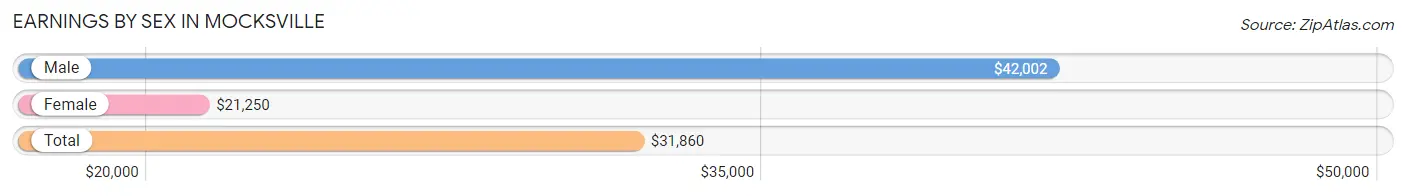
Earnings by Sex in Mocksville
Average Earnings in Mocksville are $31,860, $42,002 for men and $21,250 for women, a difference of 49.4%.
| Sex | Number | Average Earnings |
| Male | 1,561 (51.1%) | $42,002 |
| Female | 1,493 (48.9%) | $21,250 |
| Total | 3,054 (100.0%) | $31,860 |
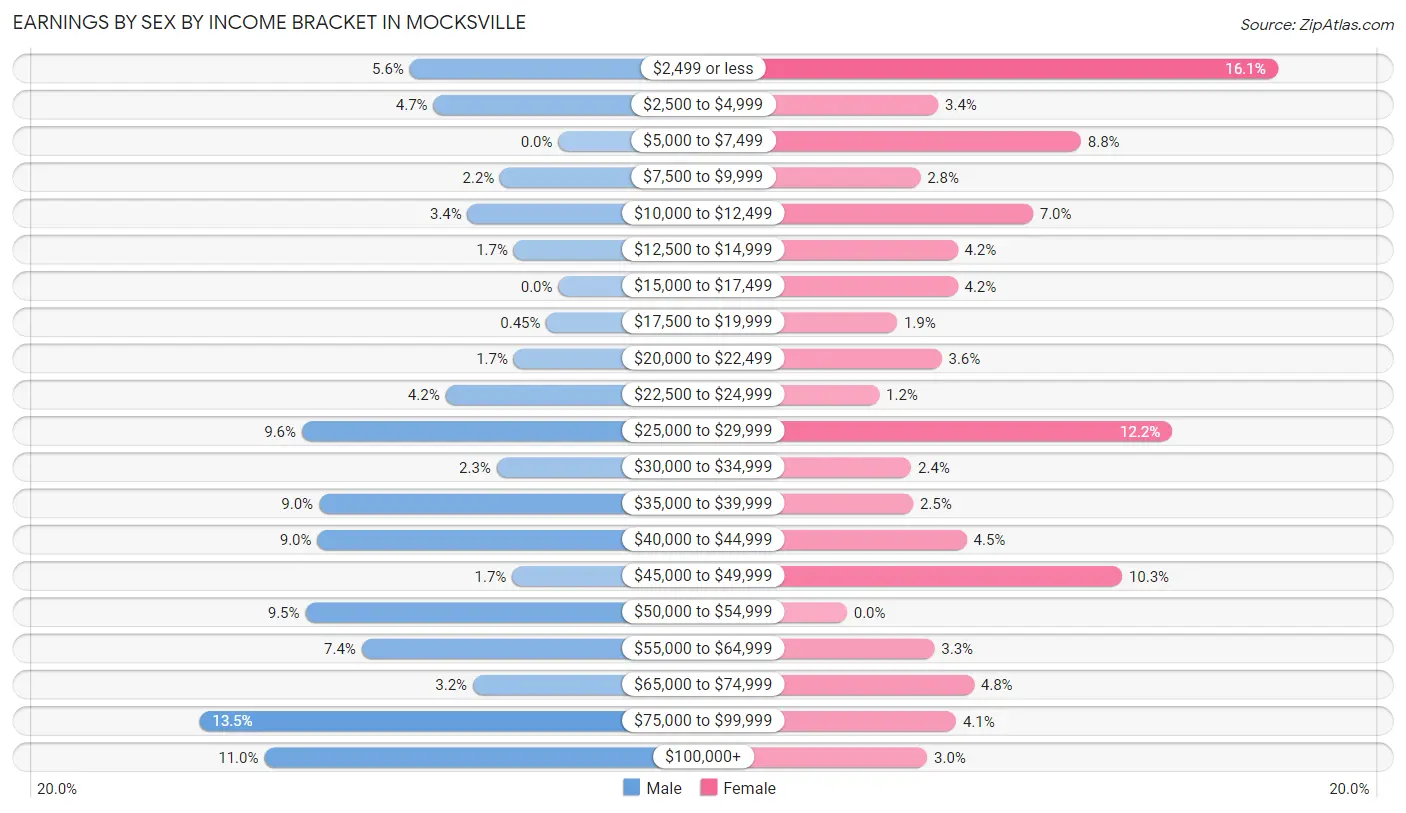
Earnings by Sex by Income Bracket in Mocksville
The most common earnings brackets in Mocksville are $75,000 to $99,999 for men (210 | 13.5%) and $2,499 or less for women (241 | 16.1%).
| Income | Male | Female |
| $2,499 or less | 87 (5.6%) | 241 (16.1%) |
| $2,500 to $4,999 | 73 (4.7%) | 51 (3.4%) |
| $5,000 to $7,499 | 0 (0.0%) | 131 (8.8%) |
| $7,500 to $9,999 | 34 (2.2%) | 41 (2.8%) |
| $10,000 to $12,499 | 53 (3.4%) | 104 (7.0%) |
| $12,500 to $14,999 | 26 (1.7%) | 62 (4.2%) |
| $15,000 to $17,499 | 0 (0.0%) | 62 (4.2%) |
| $17,500 to $19,999 | 7 (0.4%) | 28 (1.9%) |
| $20,000 to $22,499 | 26 (1.7%) | 53 (3.5%) |
| $22,500 to $24,999 | 66 (4.2%) | 18 (1.2%) |
| $25,000 to $29,999 | 150 (9.6%) | 182 (12.2%) |
| $30,000 to $34,999 | 36 (2.3%) | 36 (2.4%) |
| $35,000 to $39,999 | 140 (9.0%) | 37 (2.5%) |
| $40,000 to $44,999 | 141 (9.0%) | 67 (4.5%) |
| $45,000 to $49,999 | 27 (1.7%) | 154 (10.3%) |
| $50,000 to $54,999 | 148 (9.5%) | 0 (0.0%) |
| $55,000 to $64,999 | 115 (7.4%) | 49 (3.3%) |
| $65,000 to $74,999 | 50 (3.2%) | 71 (4.8%) |
| $75,000 to $99,999 | 210 (13.5%) | 61 (4.1%) |
| $100,000+ | 172 (11.0%) | 45 (3.0%) |
| Total | 1,561 (100.0%) | 1,493 (100.0%) |
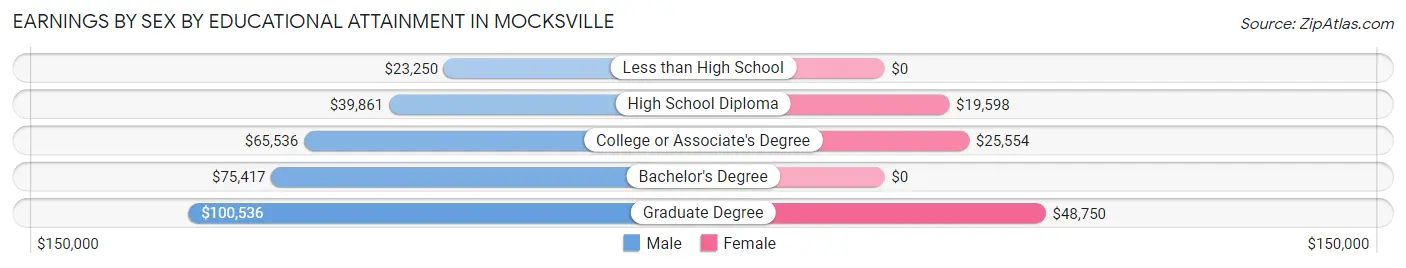
Earnings by Sex by Educational Attainment in Mocksville
Average earnings in Mocksville are $44,750 for men and $26,742 for women, a difference of 40.2%. Men with an educational attainment of graduate degree enjoy the highest average annual earnings of $100,536, while those with less than high school education earn the least with $23,250. Women with an educational attainment of graduate degree earn the most with the average annual earnings of $48,750, while those with high school diploma education have the smallest earnings of $19,598.
| Educational Attainment | Male Income | Female Income |
| Less than High School | $23,250 | $0 |
| High School Diploma | $39,861 | $19,598 |
| College or Associate's Degree | $65,536 | $25,554 |
| Bachelor's Degree | $75,417 | $0 |
| Graduate Degree | $100,536 | $48,750 |
| Total | $44,750 | $26,742 |
Family Income in Mocksville
Family Income Brackets in Mocksville
According to the Mocksville family income data, there are 271 families falling into the $100,000 to $149,999 income range, which is the most common income bracket and makes up 23.1% of all families. Conversely, the $10,000 to $14,999 income bracket is the least frequent group with only 13 families (1.1%) belonging to this category.
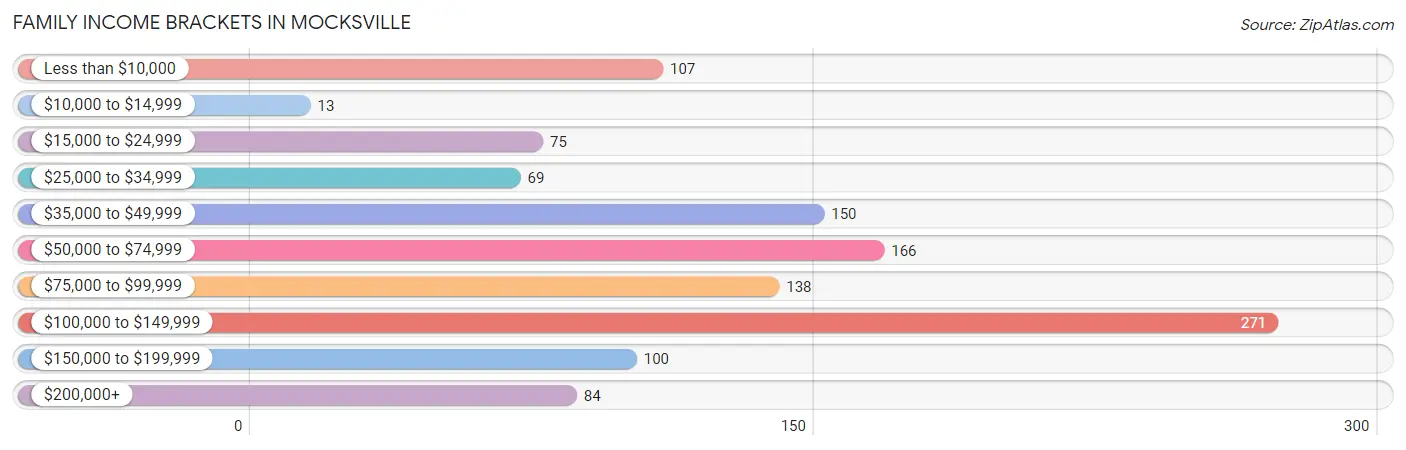
| Income Bracket | # Families | % Families |
| Less than $10,000 | 107 | 9.1% |
| $10,000 to $14,999 | 13 | 1.1% |
| $15,000 to $24,999 | 75 | 6.4% |
| $25,000 to $34,999 | 69 | 5.9% |
| $35,000 to $49,999 | 150 | 12.8% |
| $50,000 to $74,999 | 166 | 14.2% |
| $75,000 to $99,999 | 138 | 11.8% |
| $100,000 to $149,999 | 271 | 23.1% |
| $150,000 to $199,999 | 100 | 8.5% |
| $200,000+ | 84 | 7.2% |
Family Income by Famaliy Size in Mocksville
4-person families (241 | 20.6%) account for the highest median family income in Mocksville with $99,625 per family, while 2-person families (427 | 36.5%) have the highest median income of $36,646 per family member.
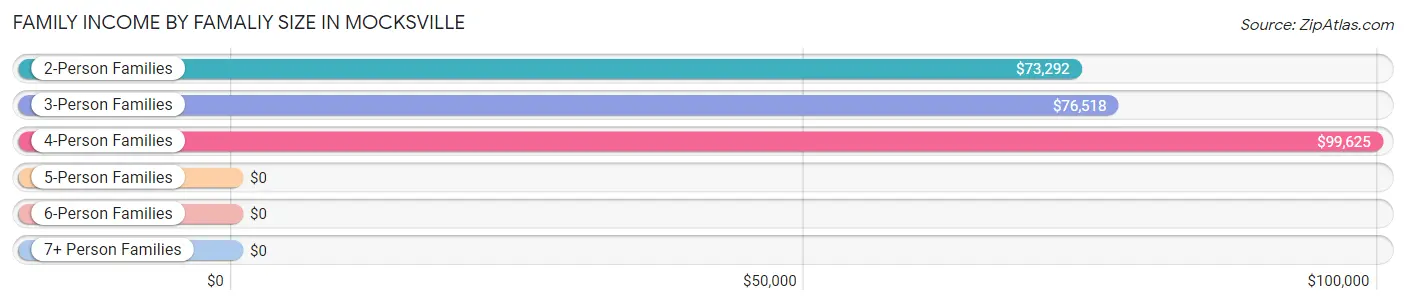
| Income Bracket | # Families | Median Income |
| 2-Person Families | 427 (36.5%) | $73,292 |
| 3-Person Families | 363 (31.0%) | $76,518 |
| 4-Person Families | 241 (20.6%) | $99,625 |
| 5-Person Families | 75 (6.4%) | $0 |
| 6-Person Families | 12 (1.0%) | $0 |
| 7+ Person Families | 53 (4.5%) | $0 |
| Total | 1,171 (100.0%) | $76,161 |
Family Income by Number of Earners in Mocksville
The median family income in Mocksville is $76,161, with families comprising 3+ earners (149) having the highest median family income of $123,036, while families with 1 earner (399) have the lowest median family income of $36,625, accounting for 12.7% and 34.1% of families, respectively.
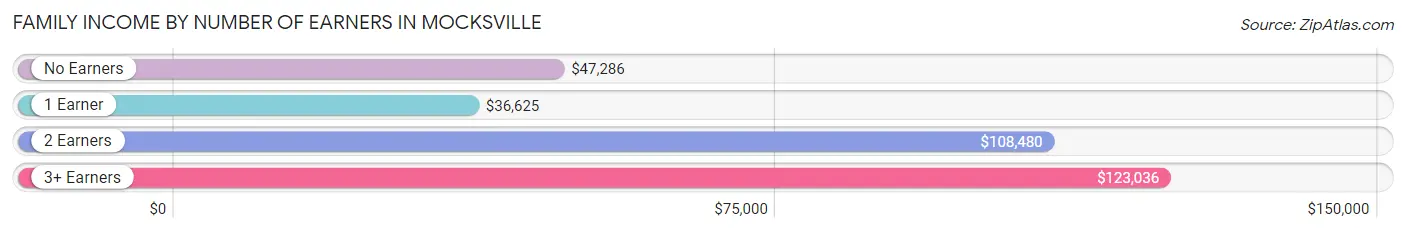
| Number of Earners | # Families | Median Income |
| No Earners | 192 (16.4%) | $47,286 |
| 1 Earner | 399 (34.1%) | $36,625 |
| 2 Earners | 431 (36.8%) | $108,480 |
| 3+ Earners | 149 (12.7%) | $123,036 |
| Total | 1,171 (100.0%) | $76,161 |
Household Income in Mocksville
Household Income Brackets in Mocksville
With 498 households falling in the category, the $35,000 to $49,999 income range is the most frequent in Mocksville, accounting for 22.6% of all households. In contrast, only 84 households (3.8%) fall into the $200,000+ income bracket, making it the least populous group.
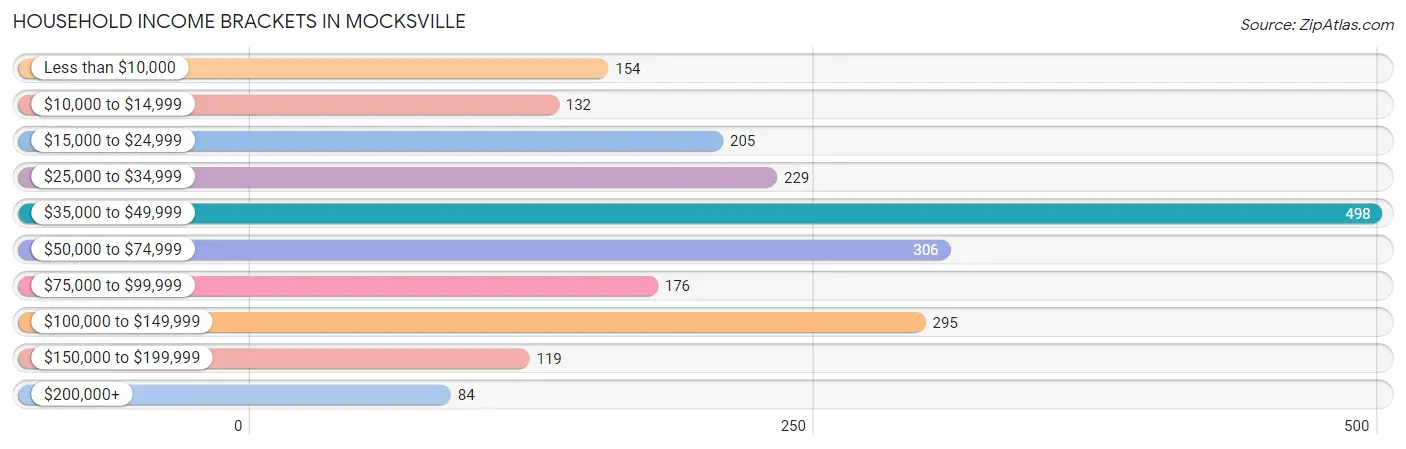
| Income Bracket | # Households | % Households |
| Less than $10,000 | 154 | 7.0% |
| $10,000 to $14,999 | 132 | 6.0% |
| $15,000 to $24,999 | 205 | 9.3% |
| $25,000 to $34,999 | 229 | 10.4% |
| $35,000 to $49,999 | 498 | 22.6% |
| $50,000 to $74,999 | 306 | 13.9% |
| $75,000 to $99,999 | 176 | 8.0% |
| $100,000 to $149,999 | 295 | 13.4% |
| $150,000 to $199,999 | 119 | 5.4% |
| $200,000+ | 84 | 3.8% |
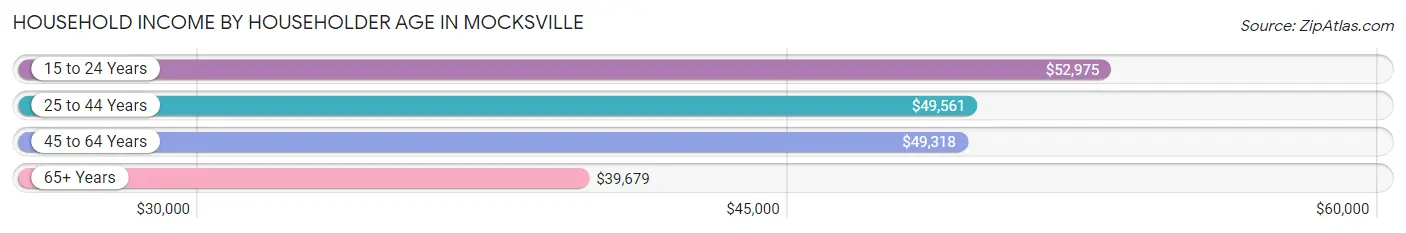
Household Income by Householder Age in Mocksville
The median household income in Mocksville is $46,553, with the highest median household income of $52,975 found in the 15 to 24 years age bracket for the primary householder. A total of 159 households (7.2%) fall into this category. Meanwhile, the 65+ years age bracket for the primary householder has the lowest median household income of $39,679, with 621 households (28.2%) in this group.
| Income Bracket | # Households | Median Income |
| 15 to 24 Years | 159 (7.2%) | $52,975 |
| 25 to 44 Years | 678 (30.8%) | $49,561 |
| 45 to 64 Years | 744 (33.8%) | $49,318 |
| 65+ Years | 621 (28.2%) | $39,679 |
| Total | 2,202 (100.0%) | $46,553 |
Poverty in Mocksville
Income Below Poverty by Sex and Age in Mocksville
With 20.1% poverty level for males and 27.0% for females among the residents of Mocksville, 5 year old males and 12 to 14 year old females are the most vulnerable to poverty, with 45 males (95.7%) and 70 females (87.5%) in their respective age groups living below the poverty level.
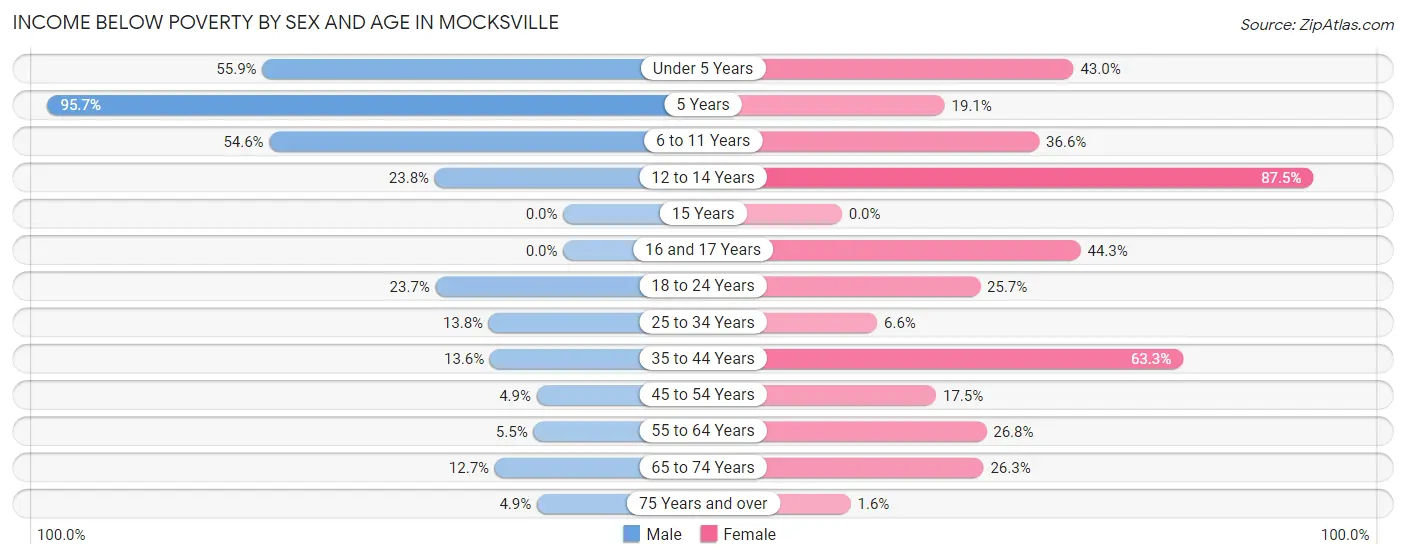
| Age Bracket | Male | Female |
| Under 5 Years | 181 (55.9%) | 80 (43.0%) |
| 5 Years | 45 (95.7%) | 33 (19.1%) |
| 6 to 11 Years | 60 (54.5%) | 63 (36.6%) |
| 12 to 14 Years | 36 (23.8%) | 70 (87.5%) |
| 15 Years | 0 (0.0%) | 0 (0.0%) |
| 16 and 17 Years | 0 (0.0%) | 39 (44.3%) |
| 18 to 24 Years | 64 (23.7%) | 67 (25.7%) |
| 25 to 34 Years | 78 (13.8%) | 33 (6.6%) |
| 35 to 44 Years | 31 (13.6%) | 171 (63.3%) |
| 45 to 54 Years | 15 (4.9%) | 42 (17.5%) |
| 55 to 64 Years | 17 (5.5%) | 136 (26.8%) |
| 65 to 74 Years | 24 (12.7%) | 71 (26.3%) |
| 75 Years and over | 10 (4.9%) | 4 (1.6%) |
| Total | 561 (20.1%) | 809 (27.0%) |
Income Above Poverty by Sex and Age in Mocksville
According to the poverty statistics in Mocksville, males aged 15 years and females aged 75 years and over are the age groups that are most secure financially, with 100.0% of males and 98.4% of females in these age groups living above the poverty line.
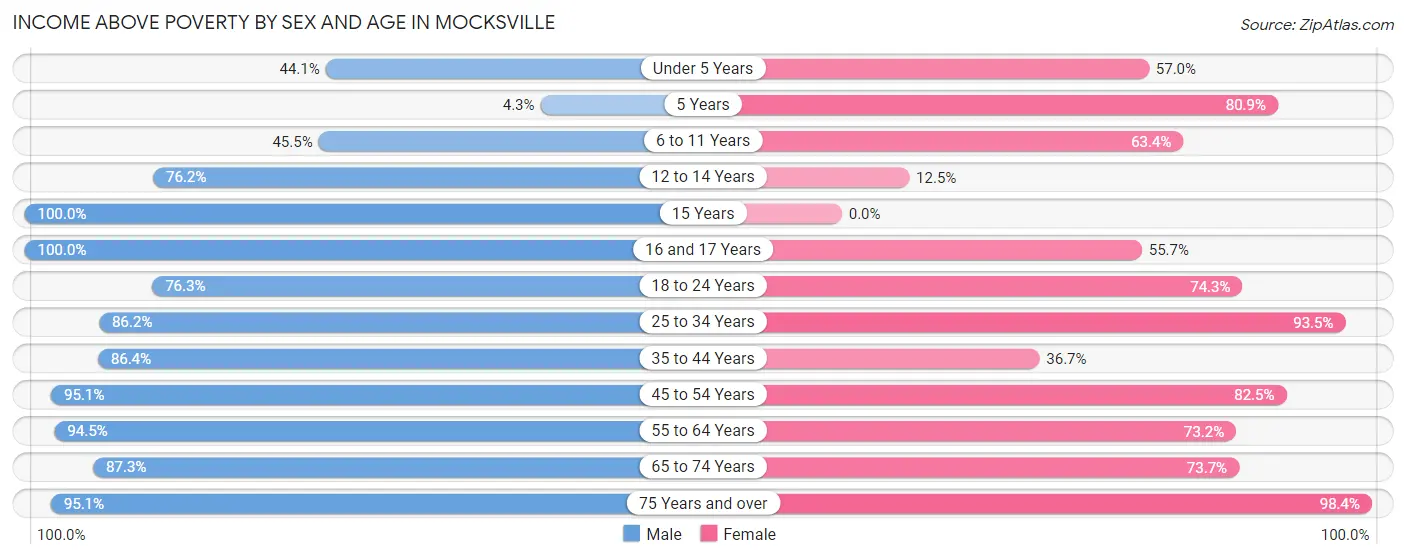
| Age Bracket | Male | Female |
| Under 5 Years | 143 (44.1%) | 106 (57.0%) |
| 5 Years | 2 (4.3%) | 140 (80.9%) |
| 6 to 11 Years | 50 (45.5%) | 109 (63.4%) |
| 12 to 14 Years | 115 (76.2%) | 10 (12.5%) |
| 15 Years | 30 (100.0%) | 0 (0.0%) |
| 16 and 17 Years | 56 (100.0%) | 49 (55.7%) |
| 18 to 24 Years | 206 (76.3%) | 194 (74.3%) |
| 25 to 34 Years | 487 (86.2%) | 471 (93.4%) |
| 35 to 44 Years | 197 (86.4%) | 99 (36.7%) |
| 45 to 54 Years | 290 (95.1%) | 198 (82.5%) |
| 55 to 64 Years | 290 (94.5%) | 371 (73.2%) |
| 65 to 74 Years | 165 (87.3%) | 199 (73.7%) |
| 75 Years and over | 195 (95.1%) | 242 (98.4%) |
| Total | 2,226 (79.9%) | 2,188 (73.0%) |
Income Below Poverty Among Married-Couple Families in Mocksville
The poverty statistics for married-couple families in Mocksville show that 6.8% or 57 of the total 836 families live below the poverty line. Families with 3 or 4 children have the highest poverty rate of 91.2%, comprising of 31 families. On the other hand, families with no children have the lowest poverty rate of 2.5%, which includes 9 families.
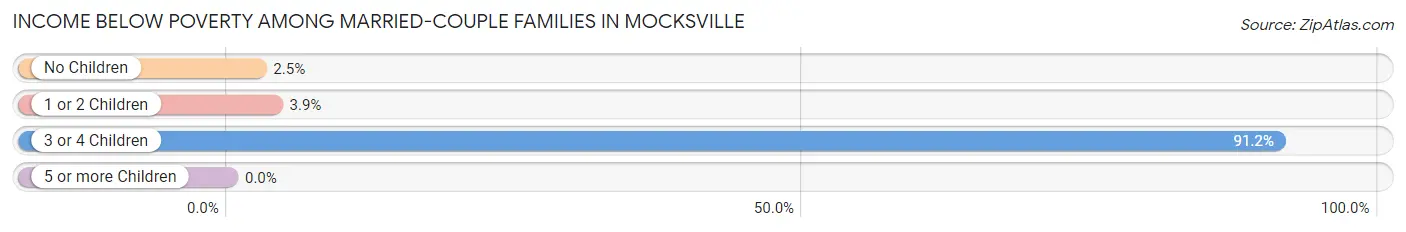
| Children | Above Poverty | Below Poverty |
| No Children | 355 (97.5%) | 9 (2.5%) |
| 1 or 2 Children | 421 (96.1%) | 17 (3.9%) |
| 3 or 4 Children | 3 (8.8%) | 31 (91.2%) |
| 5 or more Children | 0 (0.0%) | 0 (0.0%) |
| Total | 779 (93.2%) | 57 (6.8%) |
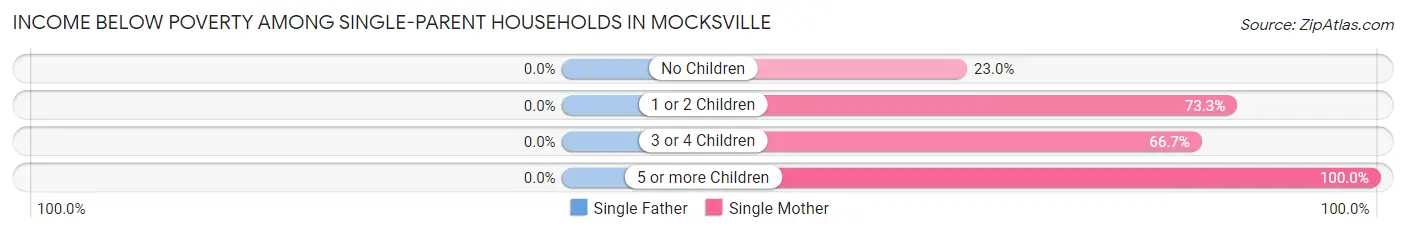
Income Below Poverty Among Single-Parent Households in Mocksville
| Children | Single Father | Single Mother |
| No Children | 0 (0.0%) | 23 (23.0%) |
| 1 or 2 Children | 0 (0.0%) | 74 (73.3%) |
| 3 or 4 Children | 0 (0.0%) | 16 (66.7%) |
| 5 or more Children | 0 (0.0%) | 41 (100.0%) |
| Total | 0 (0.0%) | 154 (57.9%) |
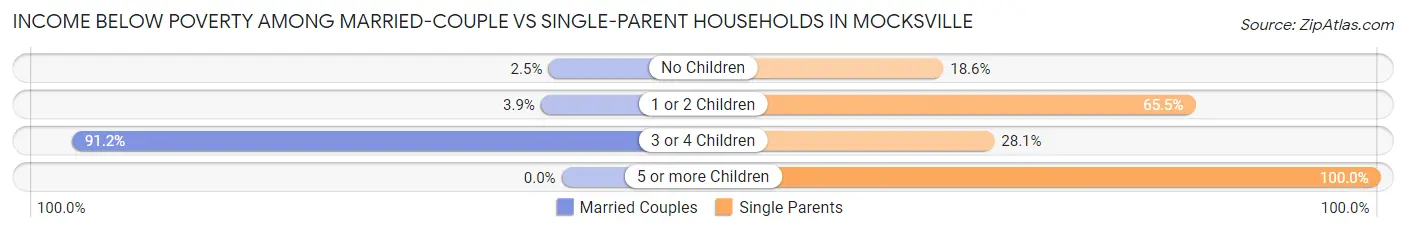
Income Below Poverty Among Married-Couple vs Single-Parent Households in Mocksville
The poverty data for Mocksville shows that 57 of the married-couple family households (6.8%) and 154 of the single-parent households (46.0%) are living below the poverty level. Within the married-couple family households, those with 3 or 4 children have the highest poverty rate, with 31 households (91.2%) falling below the poverty line. Among the single-parent households, those with 5 or more children have the highest poverty rate, with 41 household (100.0%) living below poverty.
| Children | Married-Couple Families | Single-Parent Households |
| No Children | 9 (2.5%) | 23 (18.5%) |
| 1 or 2 Children | 17 (3.9%) | 74 (65.5%) |
| 3 or 4 Children | 31 (91.2%) | 16 (28.1%) |
| 5 or more Children | 0 (0.0%) | 41 (100.0%) |
| Total | 57 (6.8%) | 154 (46.0%) |
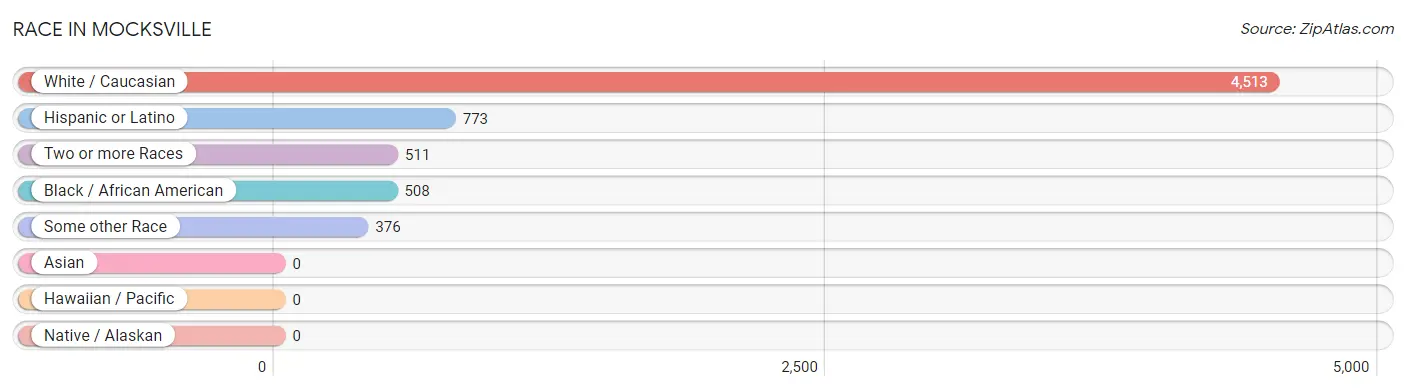
Race in Mocksville
The most populous races in Mocksville are White / Caucasian (4,513 | 76.4%), Hispanic or Latino (773 | 13.1%), and Two or more Races (511 | 8.6%).
| Race | # Population | % Population |
| Asian | 0 | 0.0% |
| Black / African American | 508 | 8.6% |
| Hawaiian / Pacific | 0 | 0.0% |
| Hispanic or Latino | 773 | 13.1% |
| Native / Alaskan | 0 | 0.0% |
| White / Caucasian | 4,513 | 76.4% |
| Two or more Races | 511 | 8.6% |
| Some other Race | 376 | 6.4% |
| Total | 5,908 | 100.0% |
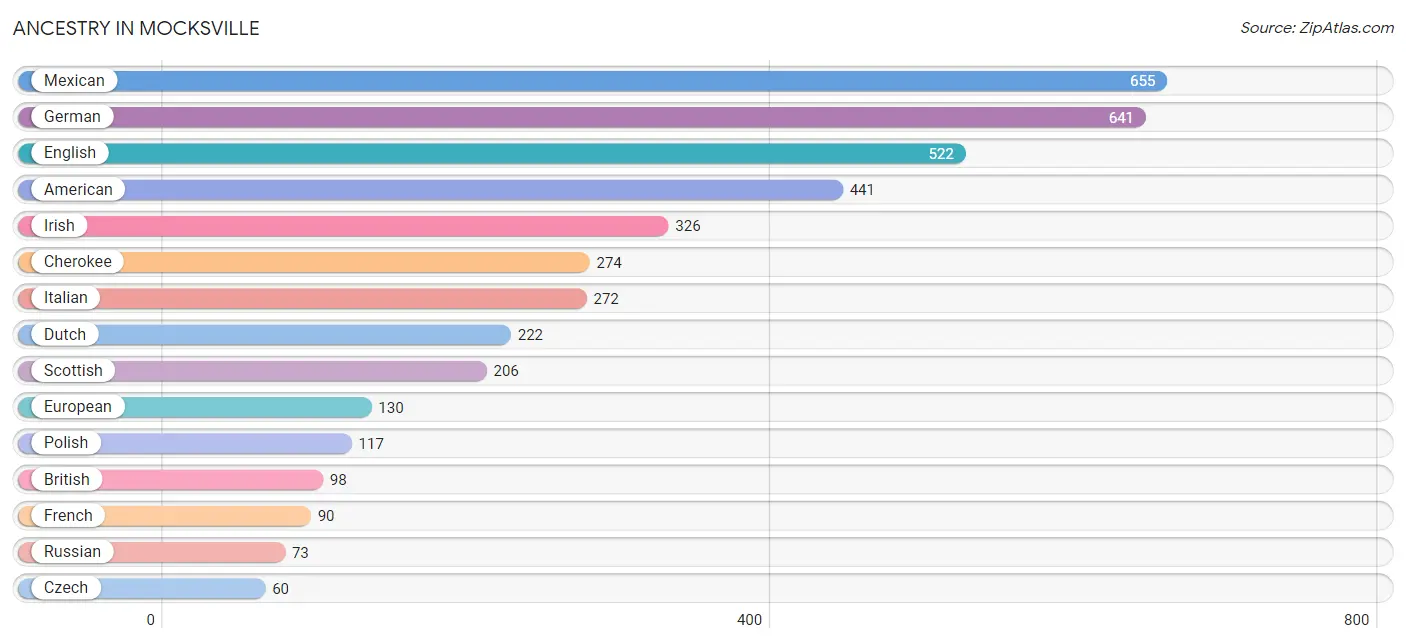
Ancestry in Mocksville
The most populous ancestries reported in Mocksville are Mexican (655 | 11.1%), German (641 | 10.8%), English (522 | 8.8%), American (441 | 7.5%), and Irish (326 | 5.5%), together accounting for 43.8% of all Mocksville residents.
| Ancestry | # Population | % Population |
| American | 441 | 7.5% |
| Arab | 10 | 0.2% |
| Blackfeet | 2 | 0.0% |
| British | 98 | 1.7% |
| Burmese | 6 | 0.1% |
| Canadian | 5 | 0.1% |
| Central American | 27 | 0.5% |
| Cherokee | 274 | 4.6% |
| Colombian | 30 | 0.5% |
| Czech | 60 | 1.0% |
| Dutch | 222 | 3.8% |
| Ecuadorian | 17 | 0.3% |
| English | 522 | 8.8% |
| European | 130 | 2.2% |
| French | 90 | 1.5% |
| German | 641 | 10.8% |
| Greek | 17 | 0.3% |
| Honduran | 27 | 0.5% |
| Irish | 326 | 5.5% |
| Italian | 272 | 4.6% |
| Lebanese | 10 | 0.2% |
| Mexican | 655 | 11.1% |
| Norwegian | 15 | 0.3% |
| Pennsylvania German | 12 | 0.2% |
| Polish | 117 | 2.0% |
| Portuguese | 13 | 0.2% |
| Puerto Rican | 44 | 0.7% |
| Russian | 73 | 1.2% |
| Scotch-Irish | 28 | 0.5% |
| Scottish | 206 | 3.5% |
| Serbian | 14 | 0.2% |
| Sioux | 5 | 0.1% |
| South American | 47 | 0.8% |
| Swedish | 2 | 0.0% |
| Swiss | 10 | 0.2% |
| Welsh | 51 | 0.9% | View All 36 Rows |
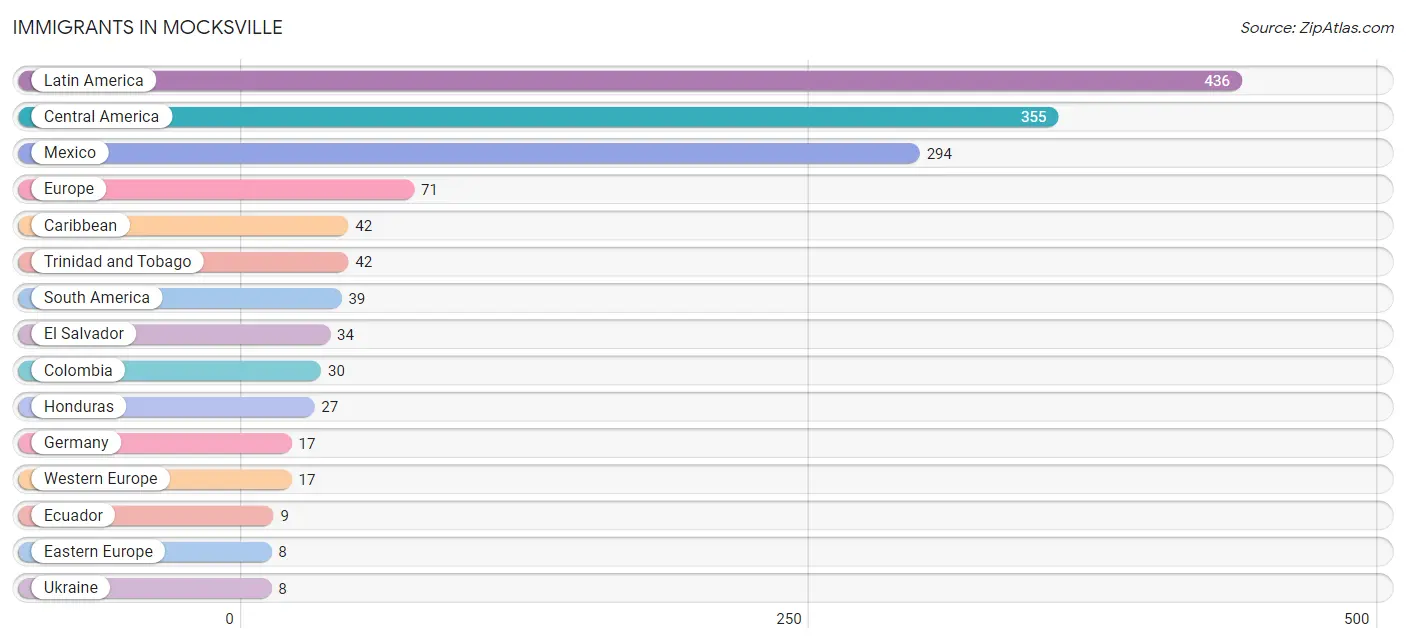
Immigrants in Mocksville
The most numerous immigrant groups reported in Mocksville came from Latin America (436 | 7.4%), Central America (355 | 6.0%), Mexico (294 | 5.0%), Europe (71 | 1.2%), and Caribbean (42 | 0.7%), together accounting for 20.3% of all Mocksville residents.
| Immigration Origin | # Population | % Population |
| Caribbean | 42 | 0.7% |
| Central America | 355 | 6.0% |
| Colombia | 30 | 0.5% |
| Eastern Europe | 8 | 0.1% |
| Ecuador | 9 | 0.2% |
| El Salvador | 34 | 0.6% |
| Europe | 71 | 1.2% |
| Germany | 17 | 0.3% |
| Honduras | 27 | 0.5% |
| Latin America | 436 | 7.4% |
| Mexico | 294 | 5.0% |
| South America | 39 | 0.7% |
| Trinidad and Tobago | 42 | 0.7% |
| Ukraine | 8 | 0.1% |
| Western Europe | 17 | 0.3% | View All 15 Rows |
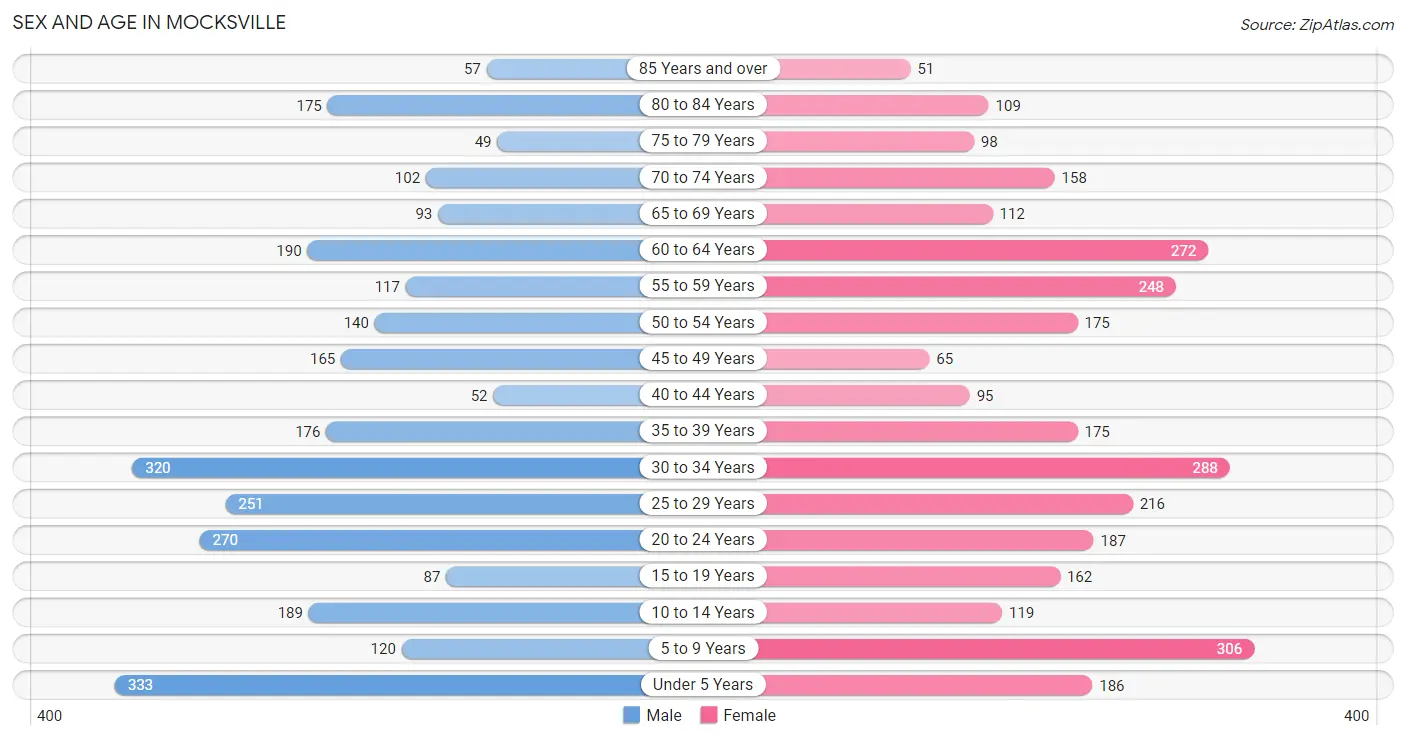
Sex and Age in Mocksville
Sex and Age in Mocksville
The most populous age groups in Mocksville are Under 5 Years (333 | 11.5%) for men and 5 to 9 Years (306 | 10.1%) for women.
| Age Bracket | Male | Female |
| Under 5 Years | 333 (11.5%) | 186 (6.1%) |
| 5 to 9 Years | 120 (4.2%) | 306 (10.1%) |
| 10 to 14 Years | 189 (6.6%) | 119 (3.9%) |
| 15 to 19 Years | 87 (3.0%) | 162 (5.4%) |
| 20 to 24 Years | 270 (9.4%) | 187 (6.2%) |
| 25 to 29 Years | 251 (8.7%) | 216 (7.1%) |
| 30 to 34 Years | 320 (11.1%) | 288 (9.5%) |
| 35 to 39 Years | 176 (6.1%) | 175 (5.8%) |
| 40 to 44 Years | 52 (1.8%) | 95 (3.1%) |
| 45 to 49 Years | 165 (5.7%) | 65 (2.1%) |
| 50 to 54 Years | 140 (4.9%) | 175 (5.8%) |
| 55 to 59 Years | 117 (4.1%) | 248 (8.2%) |
| 60 to 64 Years | 190 (6.6%) | 272 (9.0%) |
| 65 to 69 Years | 93 (3.2%) | 112 (3.7%) |
| 70 to 74 Years | 102 (3.5%) | 158 (5.2%) |
| 75 to 79 Years | 49 (1.7%) | 98 (3.2%) |
| 80 to 84 Years | 175 (6.1%) | 109 (3.6%) |
| 85 Years and over | 57 (2.0%) | 51 (1.7%) |
| Total | 2,886 (100.0%) | 3,022 (100.0%) |
Families and Households in Mocksville
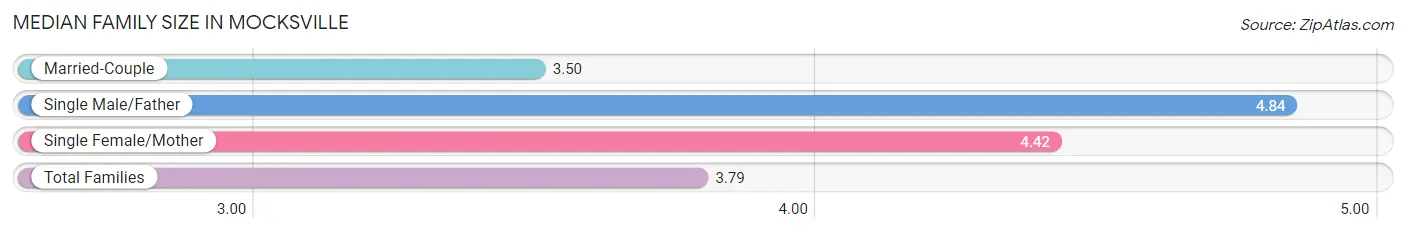
Median Family Size in Mocksville
The median family size in Mocksville is 3.79 persons per family, with single male/father families (69 | 5.9%) accounting for the largest median family size of 4.84 persons per family. On the other hand, married-couple families (836 | 71.4%) represent the smallest median family size with 3.50 persons per family.
| Family Type | # Families | Family Size |
| Married-Couple | 836 (71.4%) | 3.50 |
| Single Male/Father | 69 (5.9%) | 4.84 |
| Single Female/Mother | 266 (22.7%) | 4.42 |
| Total Families | 1,171 (100.0%) | 3.79 |
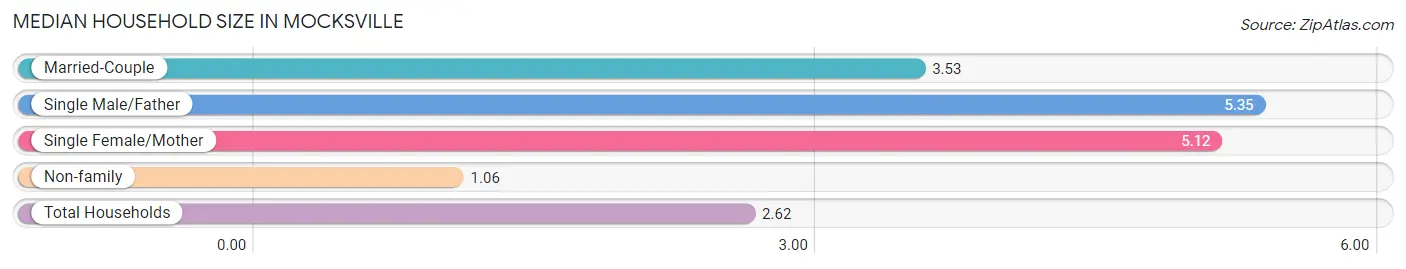
Median Household Size in Mocksville
The median household size in Mocksville is 2.62 persons per household, with single male/father households (69 | 3.1%) accounting for the largest median household size of 5.35 persons per household. non-family households (1,031 | 46.8%) represent the smallest median household size with 1.06 persons per household.
| Household Type | # Households | Household Size |
| Married-Couple | 836 (38.0%) | 3.53 |
| Single Male/Father | 69 (3.1%) | 5.35 |
| Single Female/Mother | 266 (12.1%) | 5.12 |
| Non-family | 1,031 (46.8%) | 1.06 |
| Total Households | 2,202 (100.0%) | 2.62 |
Household Size by Marriage Status in Mocksville
Out of a total of 2,202 households in Mocksville, 1,171 (53.2%) are family households, while 1,031 (46.8%) are nonfamily households. The most numerous type of family households are 2-person households, comprising 389, and the most common type of nonfamily households are 1-person households, comprising 996.
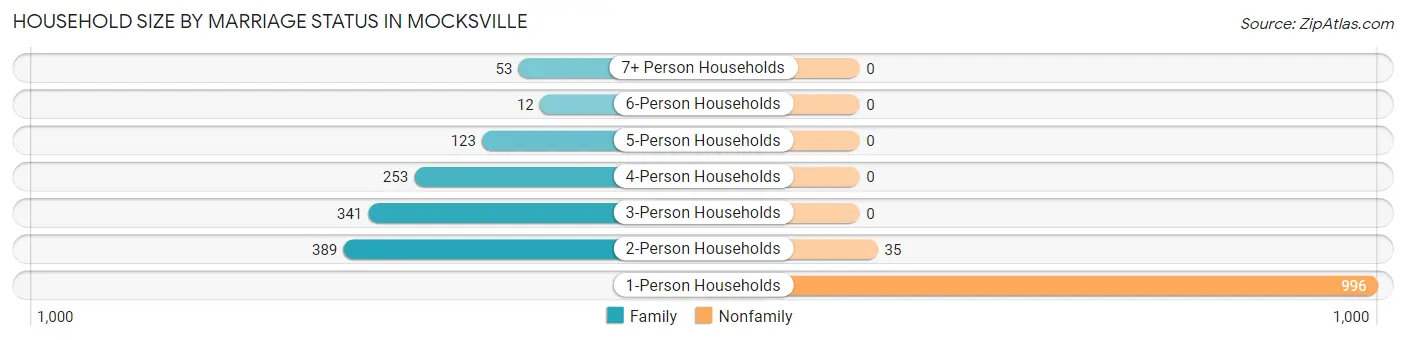
| Household Size | Family Households | Nonfamily Households |
| 1-Person Households | - | 996 (45.2%) |
| 2-Person Households | 389 (17.7%) | 35 (1.6%) |
| 3-Person Households | 341 (15.5%) | 0 (0.0%) |
| 4-Person Households | 253 (11.5%) | 0 (0.0%) |
| 5-Person Households | 123 (5.6%) | 0 (0.0%) |
| 6-Person Households | 12 (0.5%) | 0 (0.0%) |
| 7+ Person Households | 53 (2.4%) | 0 (0.0%) |
| Total | 1,171 (53.2%) | 1,031 (46.8%) |
Female Fertility in Mocksville
Fertility by Age in Mocksville
Average fertility rate in Mocksville is 63.0 births per 1,000 women. Women in the age bracket of 35 to 50 years have the highest fertility rate with 78.0 births per 1,000 women. Women in the age bracket of 20 to 34 years acount for 63.2% of all women with births.
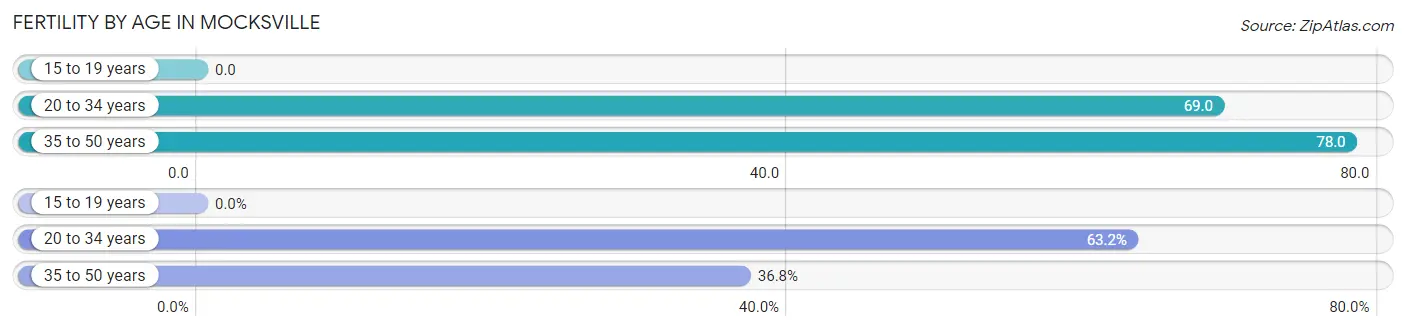
| Age Bracket | Women with Births | Births / 1,000 Women |
| 15 to 19 years | 0 (0.0%) | 0.0 |
| 20 to 34 years | 48 (63.2%) | 69.0 |
| 35 to 50 years | 28 (36.8%) | 78.0 |
| Total | 76 (100.0%) | 63.0 |
Fertility by Age by Marriage Status in Mocksville
31.6% of women with births (76) in Mocksville are married. The highest percentage of unmarried women with births falls into 20 to 34 years age bracket with 83.3% of them unmarried at the time of birth, while the lowest percentage of unmarried women with births belong to 35 to 50 years age bracket with 42.9% of them unmarried.
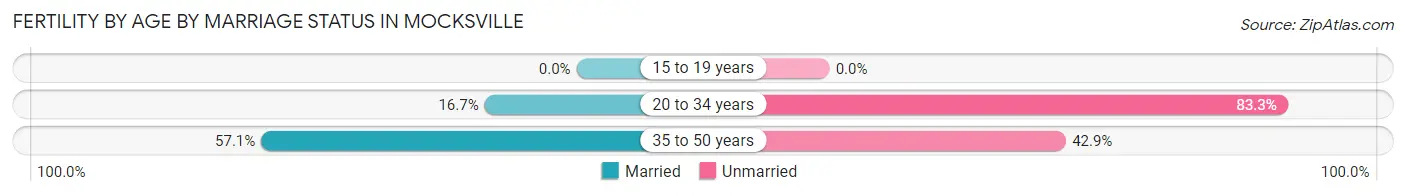
| Age Bracket | Married | Unmarried |
| 15 to 19 years | 0 (0.0%) | 0 (0.0%) |
| 20 to 34 years | 8 (16.7%) | 40 (83.3%) |
| 35 to 50 years | 16 (57.1%) | 12 (42.9%) |
| Total | 24 (31.6%) | 52 (68.4%) |
Fertility by Education in Mocksville
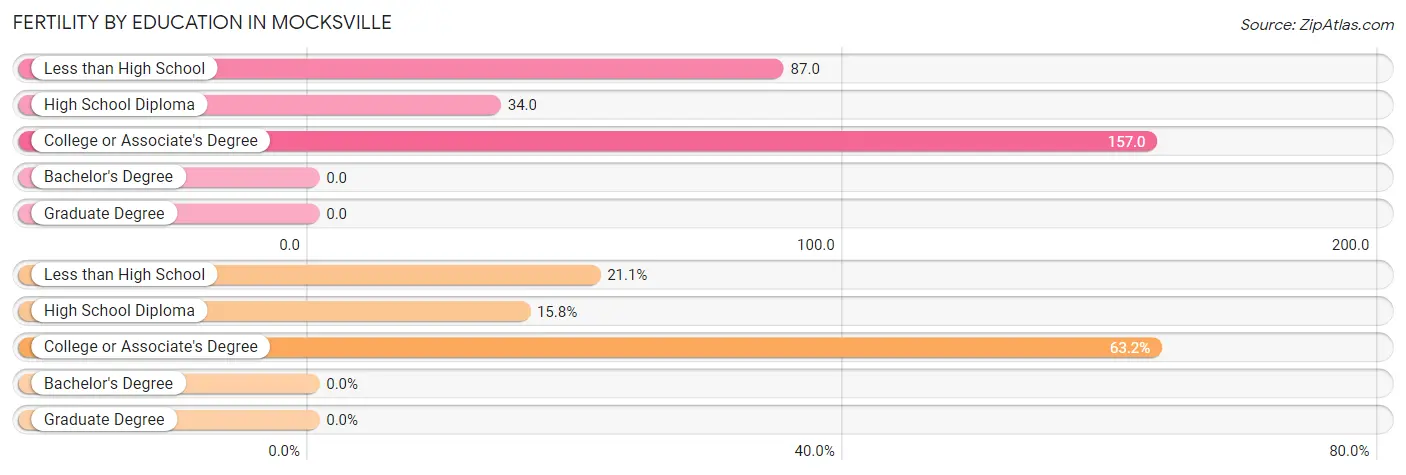
| Educational Attainment | Women with Births | Births / 1,000 Women |
| Less than High School | 16 (21.0%) | 87.0 |
| High School Diploma | 12 (15.8%) | 34.0 |
| College or Associate's Degree | 48 (63.2%) | 157.0 |
| Bachelor's Degree | 0 (0.0%) | 0.0 |
| Graduate Degree | 0 (0.0%) | 0.0 |
| Total | 76 (100.0%) | 63.0 |
Fertility by Education by Marriage Status in Mocksville
68.4% of women with births in Mocksville are unmarried. Women with the educational attainment of less than high school are most likely to be married with 100.0% of them married at childbirth, while women with the educational attainment of high school diploma are least likely to be married with 100.0% of them unmarried at childbirth.
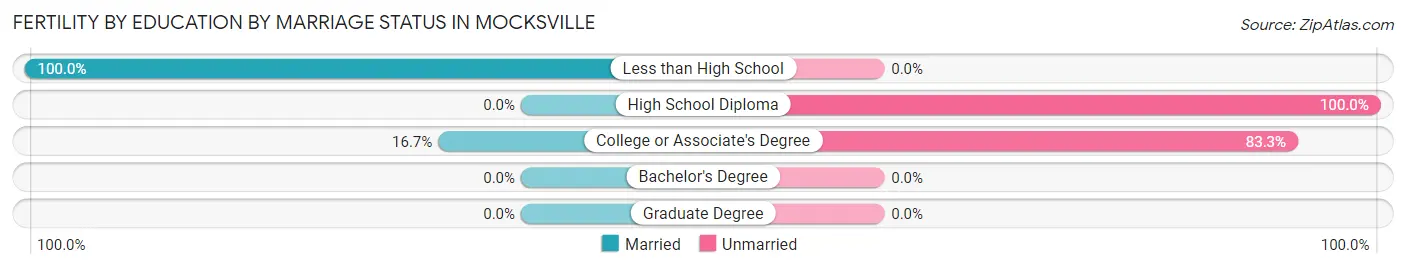
| Educational Attainment | Married | Unmarried |
| Less than High School | 16 (100.0%) | 0 (0.0%) |
| High School Diploma | 0 (0.0%) | 12 (100.0%) |
| College or Associate's Degree | 8 (16.7%) | 40 (83.3%) |
| Bachelor's Degree | 0 (0.0%) | 0 (0.0%) |
| Graduate Degree | 0 (0.0%) | 0 (0.0%) |
| Total | 24 (31.6%) | 52 (68.4%) |
Employment Characteristics in Mocksville
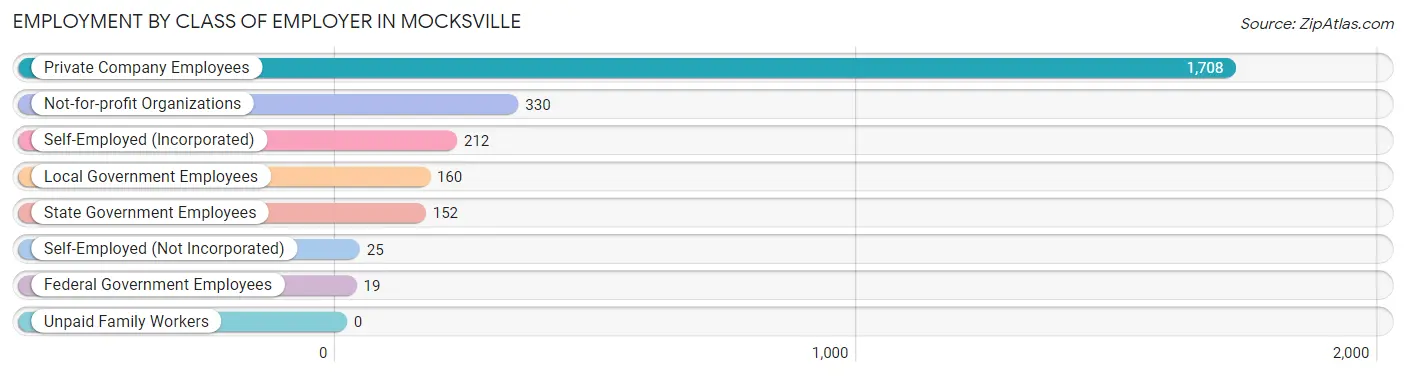
Employment by Class of Employer in Mocksville
Among the 2,606 employed individuals in Mocksville, private company employees (1,708 | 65.5%), not-for-profit organizations (330 | 12.7%), and self-employed (incorporated) (212 | 8.1%) make up the most common classes of employment.
| Employer Class | # Employees | % Employees |
| Private Company Employees | 1,708 | 65.5% |
| Self-Employed (Incorporated) | 212 | 8.1% |
| Self-Employed (Not Incorporated) | 25 | 1.0% |
| Not-for-profit Organizations | 330 | 12.7% |
| Local Government Employees | 160 | 6.1% |
| State Government Employees | 152 | 5.8% |
| Federal Government Employees | 19 | 0.7% |
| Unpaid Family Workers | 0 | 0.0% |
| Total | 2,606 | 100.0% |
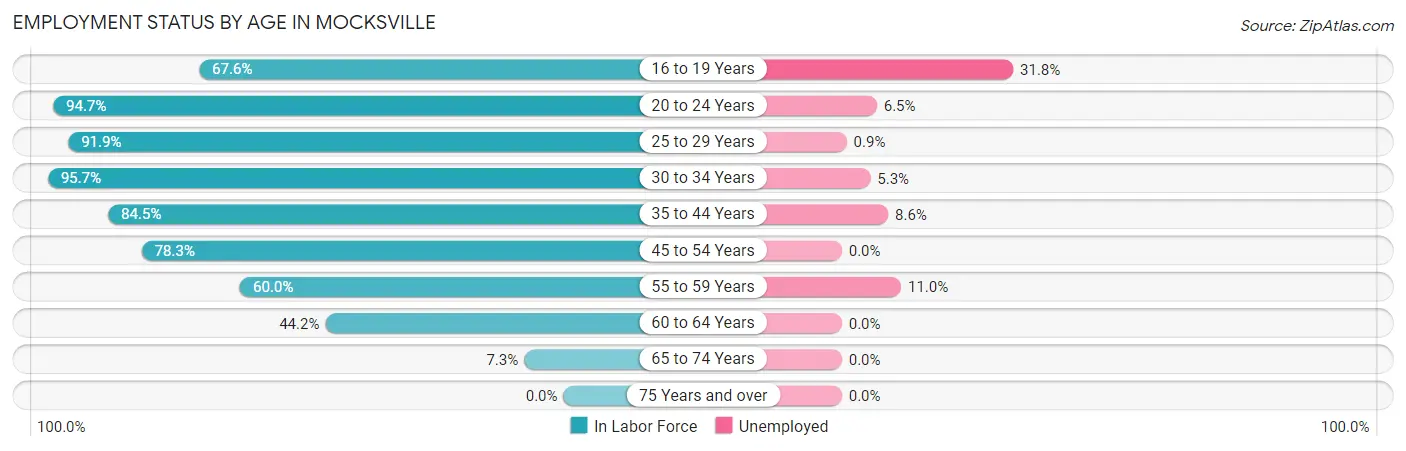
Employment Status by Age in Mocksville
According to the labor force statistics for Mocksville, out of the total population over 16 years of age (4,625), 62.6% or 2,895 individuals are in the labor force, with 5.9% or 171 of them unemployed. The age group with the highest labor force participation rate is 30 to 34 years, with 95.7% or 582 individuals in the labor force. Within the labor force, the 16 to 19 years age range has the highest percentage of unemployed individuals, with 31.8% or 47 of them being unemployed.
| Age Bracket | In Labor Force | Unemployed |
| 16 to 19 Years | 148 (67.6%) | 47 (31.8%) |
| 20 to 24 Years | 433 (94.7%) | 28 (6.5%) |
| 25 to 29 Years | 429 (91.9%) | 4 (0.9%) |
| 30 to 34 Years | 582 (95.7%) | 31 (5.3%) |
| 35 to 44 Years | 421 (84.5%) | 36 (8.6%) |
| 45 to 54 Years | 427 (78.3%) | 0 (0.0%) |
| 55 to 59 Years | 219 (60.0%) | 24 (11.0%) |
| 60 to 64 Years | 204 (44.2%) | 0 (0.0%) |
| 65 to 74 Years | 34 (7.3%) | 0 (0.0%) |
| 75 Years and over | 0 (0.0%) | 0 (0.0%) |
| Total | 2,895 (62.6%) | 171 (5.9%) |
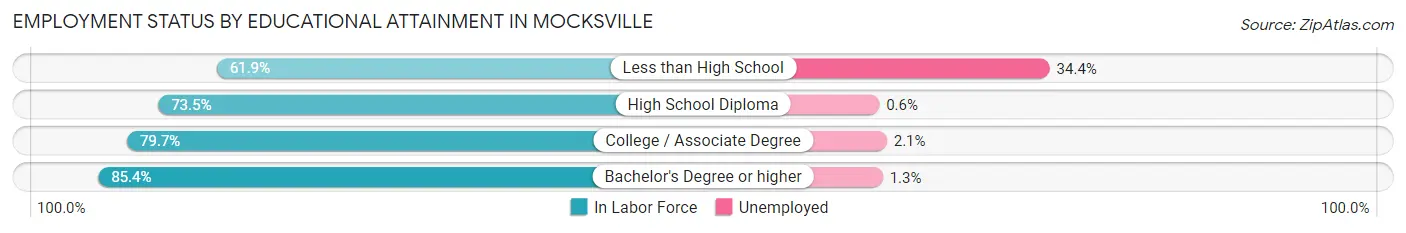
Employment Status by Educational Attainment in Mocksville
According to labor force statistics for Mocksville, 77.5% of individuals (2,282) out of the total population between 25 and 64 years of age (2,945) are in the labor force, with 4.2% or 96 of them being unemployed. The group with the highest labor force participation rate are those with the educational attainment of bachelor's degree or higher, with 85.4% or 711 individuals in the labor force. Within the labor force, individuals with less than high school education have the highest percentage of unemployment, with 34.4% or 67 of them being unemployed.
| Educational Attainment | In Labor Force | Unemployed |
| Less than High School | 195 (61.9%) | 108 (34.4%) |
| High School Diploma | 665 (73.5%) | 5 (0.6%) |
| College / Associate Degree | 711 (79.7%) | 19 (2.1%) |
| Bachelor's Degree or higher | 711 (85.4%) | 11 (1.3%) |
| Total | 2,282 (77.5%) | 124 (4.2%) |
Employment Occupations by Sex in Mocksville
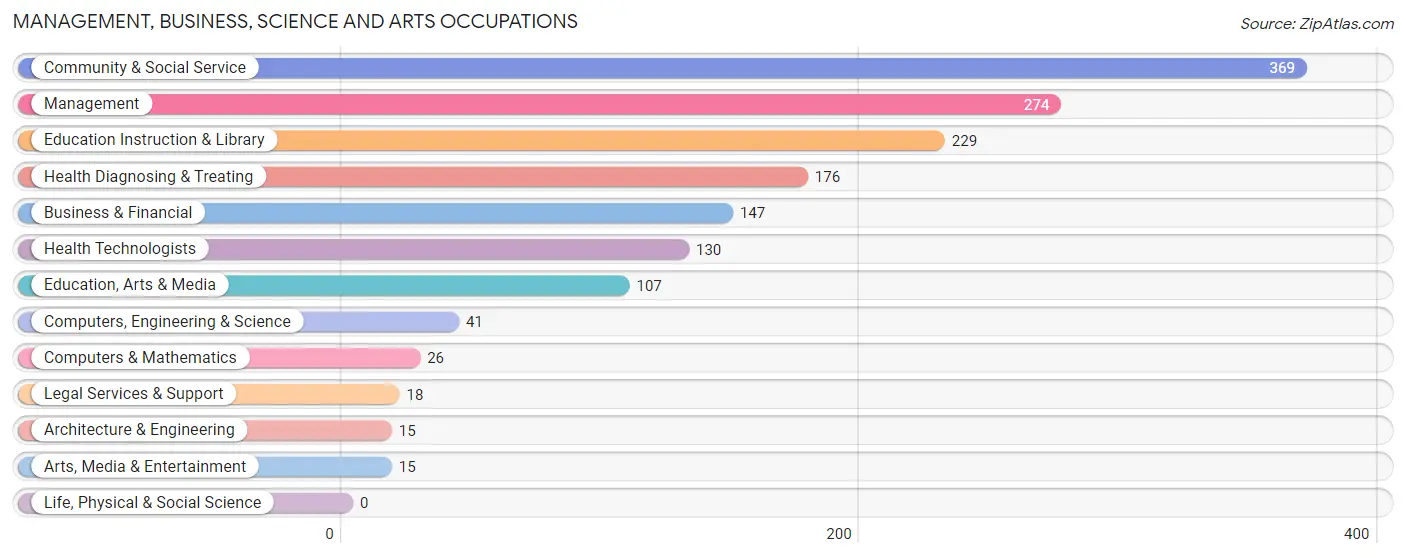
Management, Business, Science and Arts Occupations
The most common Management, Business, Science and Arts occupations in Mocksville are Community & Social Service (369 | 13.5%), Management (274 | 10.1%), Education Instruction & Library (229 | 8.4%), Health Diagnosing & Treating (176 | 6.5%), and Business & Financial (147 | 5.4%).
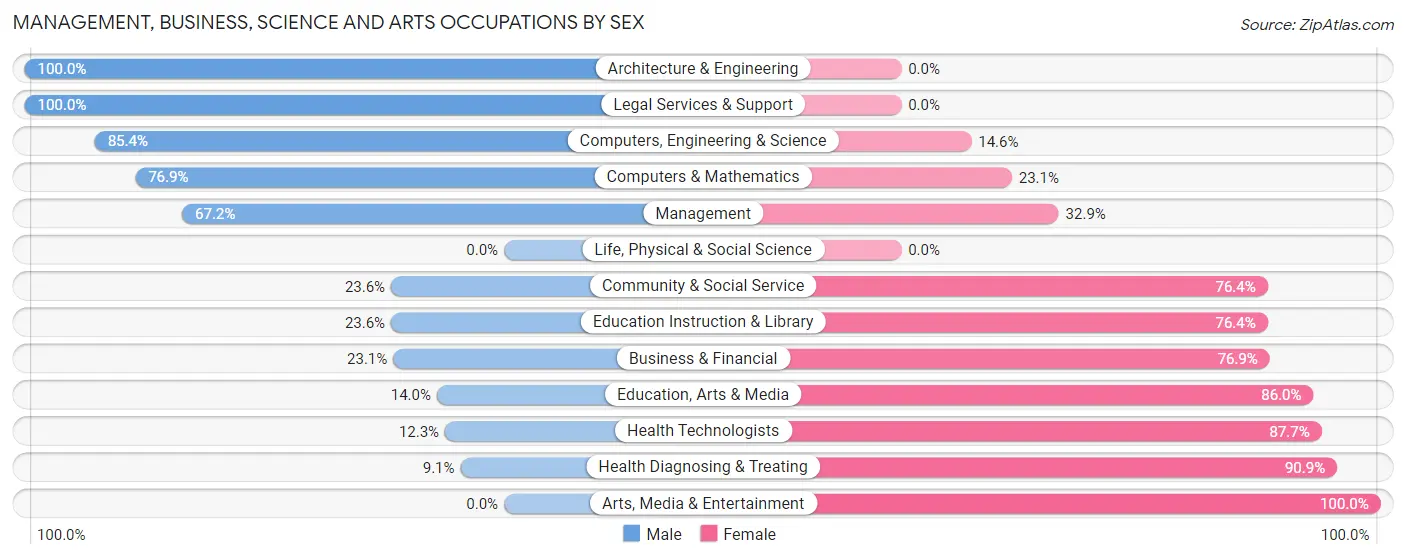
Management, Business, Science and Arts Occupations by Sex
Within the Management, Business, Science and Arts occupations in Mocksville, the most male-oriented occupations are Architecture & Engineering (100.0%), Legal Services & Support (100.0%), and Computers, Engineering & Science (85.4%), while the most female-oriented occupations are Arts, Media & Entertainment (100.0%), Health Diagnosing & Treating (90.9%), and Health Technologists (87.7%).
| Occupation | Male | Female |
| Management | 184 (67.1%) | 90 (32.9%) |
| Business & Financial | 34 (23.1%) | 113 (76.9%) |
| Computers, Engineering & Science | 35 (85.4%) | 6 (14.6%) |
| Computers & Mathematics | 20 (76.9%) | 6 (23.1%) |
| Architecture & Engineering | 15 (100.0%) | 0 (0.0%) |
| Life, Physical & Social Science | 0 (0.0%) | 0 (0.0%) |
| Community & Social Service | 87 (23.6%) | 282 (76.4%) |
| Education, Arts & Media | 15 (14.0%) | 92 (86.0%) |
| Legal Services & Support | 18 (100.0%) | 0 (0.0%) |
| Education Instruction & Library | 54 (23.6%) | 175 (76.4%) |
| Arts, Media & Entertainment | 0 (0.0%) | 15 (100.0%) |
| Health Diagnosing & Treating | 16 (9.1%) | 160 (90.9%) |
| Health Technologists | 16 (12.3%) | 114 (87.7%) |
| Total (Category) | 356 (35.3%) | 651 (64.6%) |
| Total (Overall) | 1,425 (52.3%) | 1,302 (47.7%) |
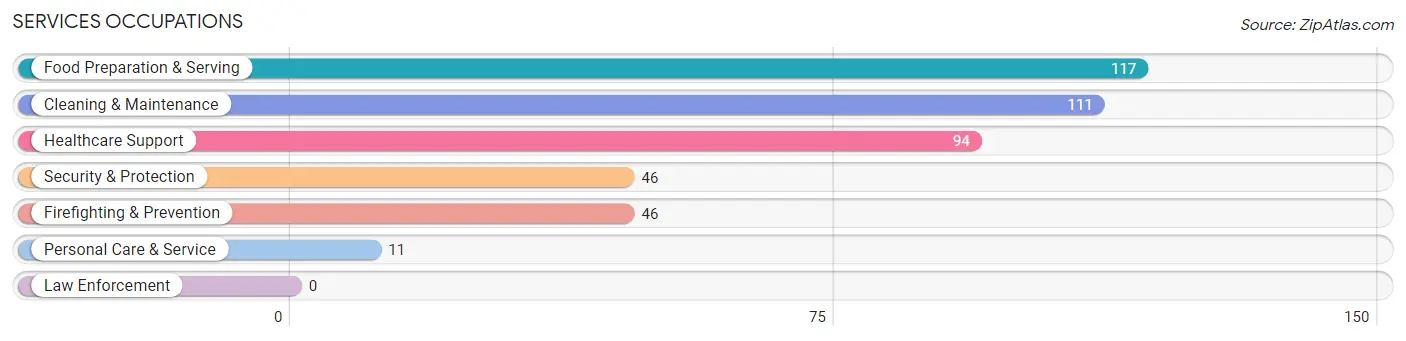
Services Occupations
The most common Services occupations in Mocksville are Food Preparation & Serving (117 | 4.3%), Cleaning & Maintenance (111 | 4.1%), Healthcare Support (94 | 3.5%), Security & Protection (46 | 1.7%), and Firefighting & Prevention (46 | 1.7%).
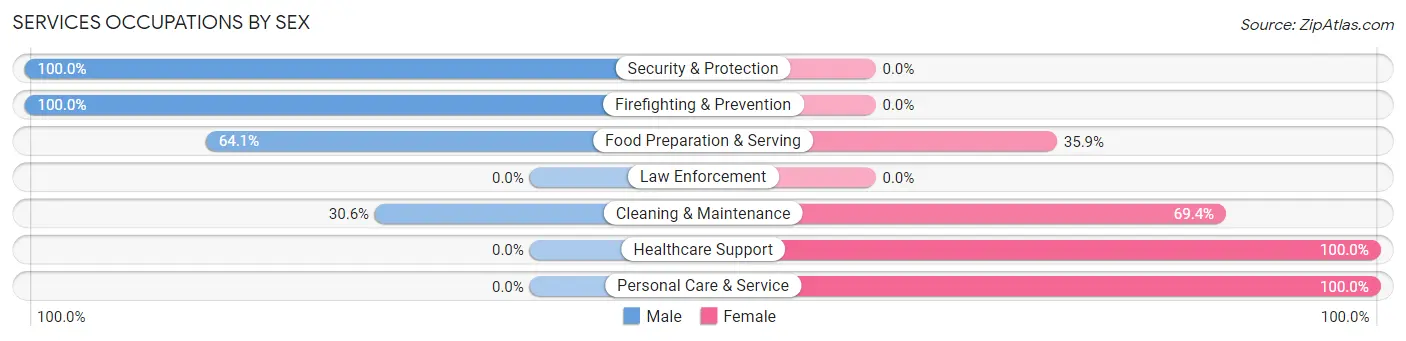
Services Occupations by Sex
Within the Services occupations in Mocksville, the most male-oriented occupations are Security & Protection (100.0%), Firefighting & Prevention (100.0%), and Food Preparation & Serving (64.1%), while the most female-oriented occupations are Healthcare Support (100.0%), Personal Care & Service (100.0%), and Cleaning & Maintenance (69.4%).
| Occupation | Male | Female |
| Healthcare Support | 0 (0.0%) | 94 (100.0%) |
| Security & Protection | 46 (100.0%) | 0 (0.0%) |
| Firefighting & Prevention | 46 (100.0%) | 0 (0.0%) |
| Law Enforcement | 0 (0.0%) | 0 (0.0%) |
| Food Preparation & Serving | 75 (64.1%) | 42 (35.9%) |
| Cleaning & Maintenance | 34 (30.6%) | 77 (69.4%) |
| Personal Care & Service | 0 (0.0%) | 11 (100.0%) |
| Total (Category) | 155 (40.9%) | 224 (59.1%) |
| Total (Overall) | 1,425 (52.3%) | 1,302 (47.7%) |
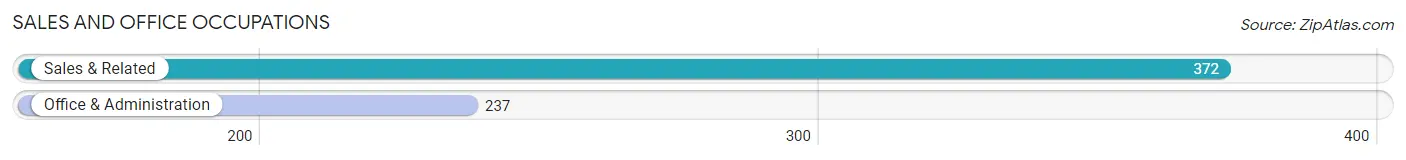
Sales and Office Occupations
The most common Sales and Office occupations in Mocksville are Sales & Related (372 | 13.6%), and Office & Administration (237 | 8.7%).
Sales and Office Occupations by Sex
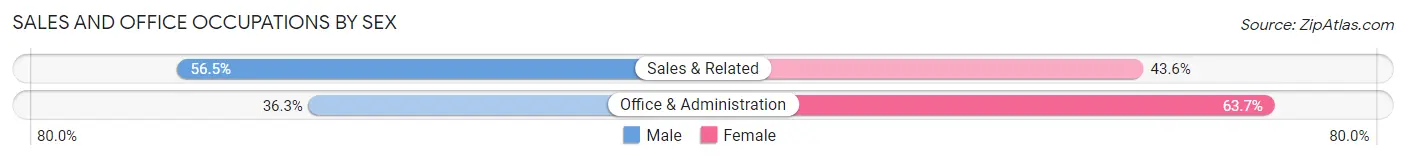
| Occupation | Male | Female |
| Sales & Related | 210 (56.5%) | 162 (43.5%) |
| Office & Administration | 86 (36.3%) | 151 (63.7%) |
| Total (Category) | 296 (48.6%) | 313 (51.4%) |
| Total (Overall) | 1,425 (52.3%) | 1,302 (47.7%) |
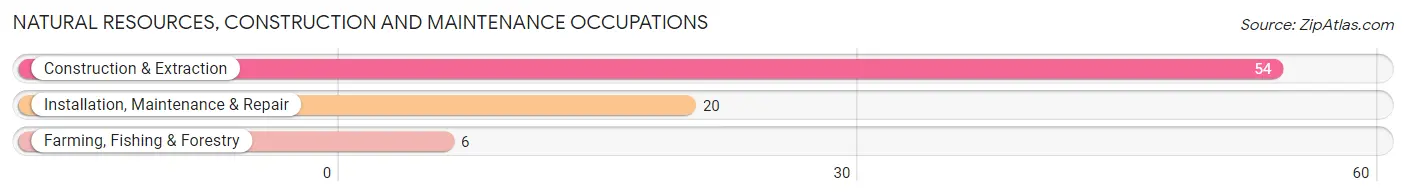
Natural Resources, Construction and Maintenance Occupations
The most common Natural Resources, Construction and Maintenance occupations in Mocksville are Construction & Extraction (54 | 2.0%), Installation, Maintenance & Repair (20 | 0.7%), and Farming, Fishing & Forestry (6 | 0.2%).
Natural Resources, Construction and Maintenance Occupations by Sex
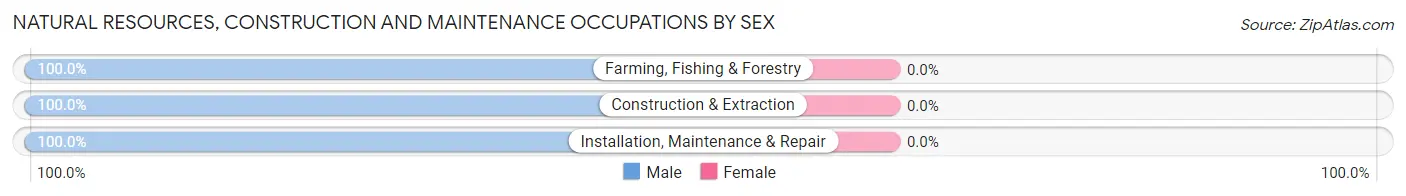
| Occupation | Male | Female |
| Farming, Fishing & Forestry | 6 (100.0%) | 0 (0.0%) |
| Construction & Extraction | 54 (100.0%) | 0 (0.0%) |
| Installation, Maintenance & Repair | 20 (100.0%) | 0 (0.0%) |
| Total (Category) | 80 (100.0%) | 0 (0.0%) |
| Total (Overall) | 1,425 (52.3%) | 1,302 (47.7%) |
Production, Transportation and Moving Occupations
The most common Production, Transportation and Moving occupations in Mocksville are Production (373 | 13.7%), Material Moving (215 | 7.9%), and Transportation (64 | 2.4%).
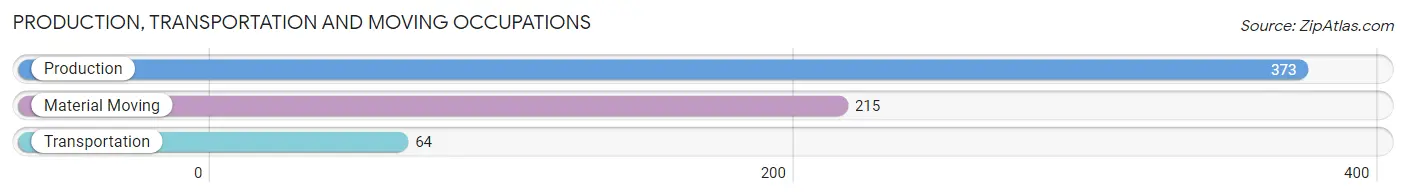
Production, Transportation and Moving Occupations by Sex
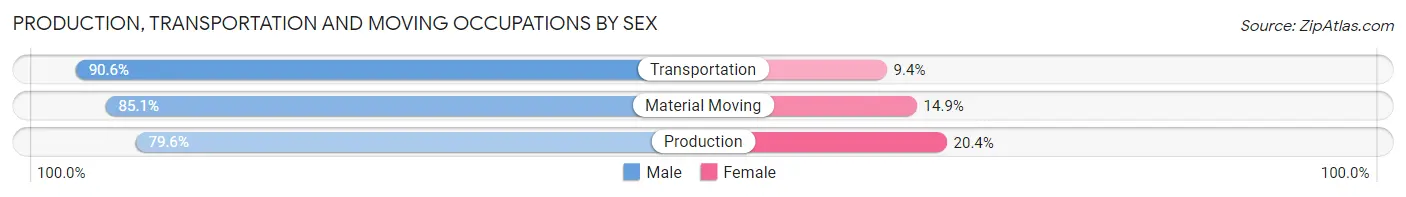
| Occupation | Male | Female |
| Production | 297 (79.6%) | 76 (20.4%) |
| Transportation | 58 (90.6%) | 6 (9.4%) |
| Material Moving | 183 (85.1%) | 32 (14.9%) |
| Total (Category) | 538 (82.5%) | 114 (17.5%) |
| Total (Overall) | 1,425 (52.3%) | 1,302 (47.7%) |
Employment Industries by Sex in Mocksville
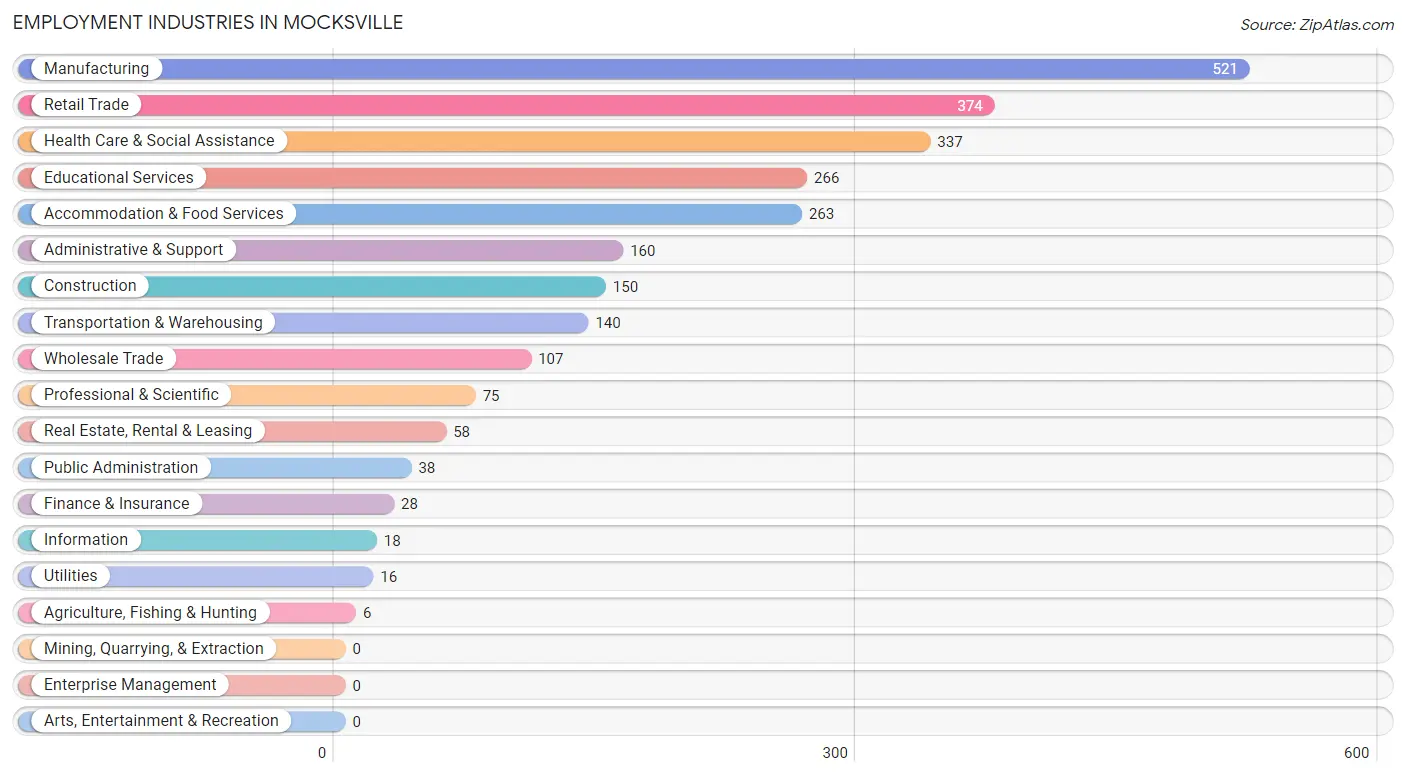
Employment Industries in Mocksville
The major employment industries in Mocksville include Manufacturing (521 | 19.1%), Retail Trade (374 | 13.7%), Health Care & Social Assistance (337 | 12.4%), Educational Services (266 | 9.8%), and Accommodation & Food Services (263 | 9.6%).
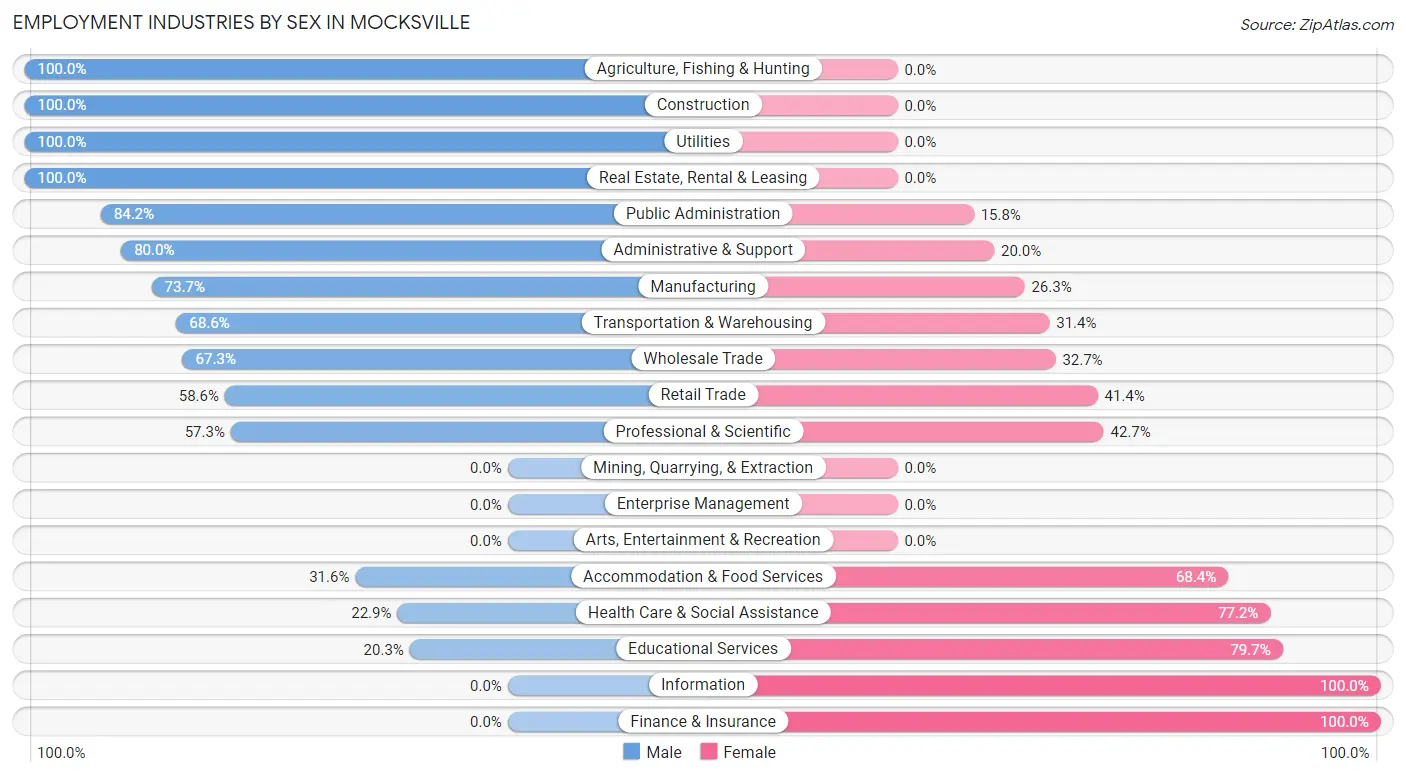
Employment Industries by Sex in Mocksville
The Mocksville industries that see more men than women are Agriculture, Fishing & Hunting (100.0%), Construction (100.0%), and Utilities (100.0%), whereas the industries that tend to have a higher number of women are Information (100.0%), Finance & Insurance (100.0%), and Educational Services (79.7%).
| Industry | Male | Female |
| Agriculture, Fishing & Hunting | 6 (100.0%) | 0 (0.0%) |
| Mining, Quarrying, & Extraction | 0 (0.0%) | 0 (0.0%) |
| Construction | 150 (100.0%) | 0 (0.0%) |
| Manufacturing | 384 (73.7%) | 137 (26.3%) |
| Wholesale Trade | 72 (67.3%) | 35 (32.7%) |
| Retail Trade | 219 (58.6%) | 155 (41.4%) |
| Transportation & Warehousing | 96 (68.6%) | 44 (31.4%) |
| Utilities | 16 (100.0%) | 0 (0.0%) |
| Information | 0 (0.0%) | 18 (100.0%) |
| Finance & Insurance | 0 (0.0%) | 28 (100.0%) |
| Real Estate, Rental & Leasing | 58 (100.0%) | 0 (0.0%) |
| Professional & Scientific | 43 (57.3%) | 32 (42.7%) |
| Enterprise Management | 0 (0.0%) | 0 (0.0%) |
| Administrative & Support | 128 (80.0%) | 32 (20.0%) |
| Educational Services | 54 (20.3%) | 212 (79.7%) |
| Health Care & Social Assistance | 77 (22.9%) | 260 (77.1%) |
| Arts, Entertainment & Recreation | 0 (0.0%) | 0 (0.0%) |
| Accommodation & Food Services | 83 (31.6%) | 180 (68.4%) |
| Public Administration | 32 (84.2%) | 6 (15.8%) |
| Total | 1,425 (52.3%) | 1,302 (47.7%) |
Education in Mocksville
School Enrollment in Mocksville
The most common levels of schooling among the 1,095 students in Mocksville are elementary school (233 | 21.3%), middle school (225 | 20.5%), and high school (215 | 19.6%).
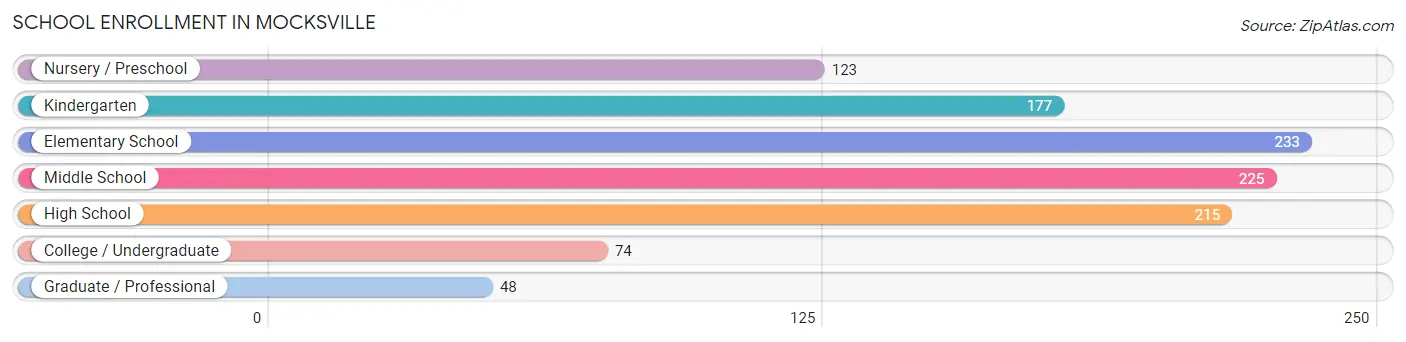
| School Level | # Students | % Students |
| Nursery / Preschool | 123 | 11.2% |
| Kindergarten | 177 | 16.2% |
| Elementary School | 233 | 21.3% |
| Middle School | 225 | 20.5% |
| High School | 215 | 19.6% |
| College / Undergraduate | 74 | 6.8% |
| Graduate / Professional | 48 | 4.4% |
| Total | 1,095 | 100.0% |
School Enrollment by Age by Funding Source in Mocksville
Out of a total of 1,095 students who are enrolled in schools in Mocksville, 204 (18.6%) attend a private institution, while the remaining 891 (81.4%) are enrolled in public schools. The age group of 20 to 24 year olds has the highest likelihood of being enrolled in private schools, with 9 (52.9% in the age bracket) enrolled. Conversely, the age group of 35 years and over has the lowest likelihood of being enrolled in a private school, with 18 (100.0% in the age bracket) attending a public institution.
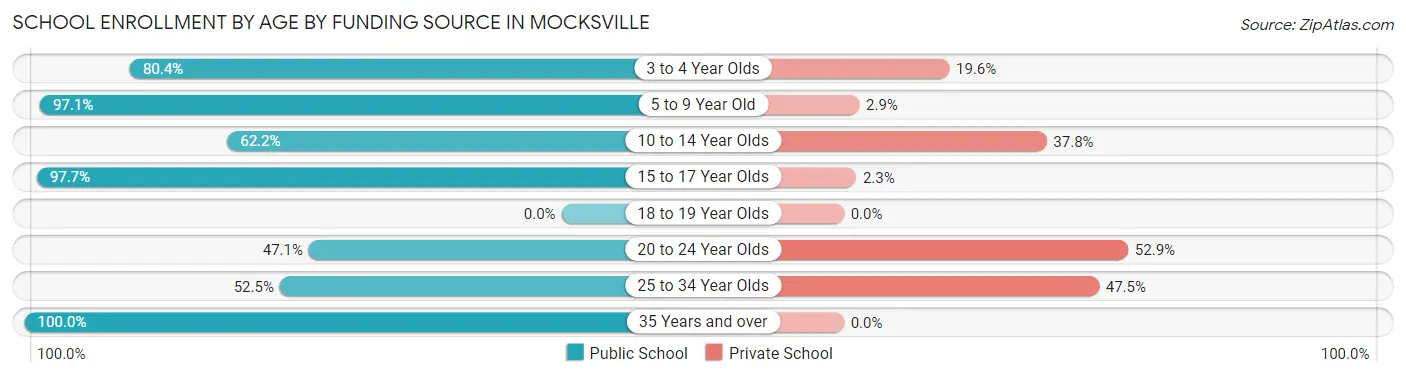
| Age Bracket | Public School | Private School |
| 3 to 4 Year Olds | 86 (80.4%) | 21 (19.6%) |
| 5 to 9 Year Old | 372 (97.1%) | 11 (2.9%) |
| 10 to 14 Year Olds | 183 (62.2%) | 111 (37.8%) |
| 15 to 17 Year Olds | 171 (97.7%) | 4 (2.3%) |
| 18 to 19 Year Olds | 0 (0.0%) | 0 (0.0%) |
| 20 to 24 Year Olds | 8 (47.1%) | 9 (52.9%) |
| 25 to 34 Year Olds | 53 (52.5%) | 48 (47.5%) |
| 35 Years and over | 18 (100.0%) | 0 (0.0%) |
| Total | 891 (81.4%) | 204 (18.6%) |
Educational Attainment by Field of Study in Mocksville
Business (188 | 15.7%), science & technology (182 | 15.2%), arts & humanities (181 | 15.1%), education (136 | 11.4%), and bio, nature & agricultural (125 | 10.4%) are the most common fields of study among 1,197 individuals in Mocksville who have obtained a bachelor's degree or higher.
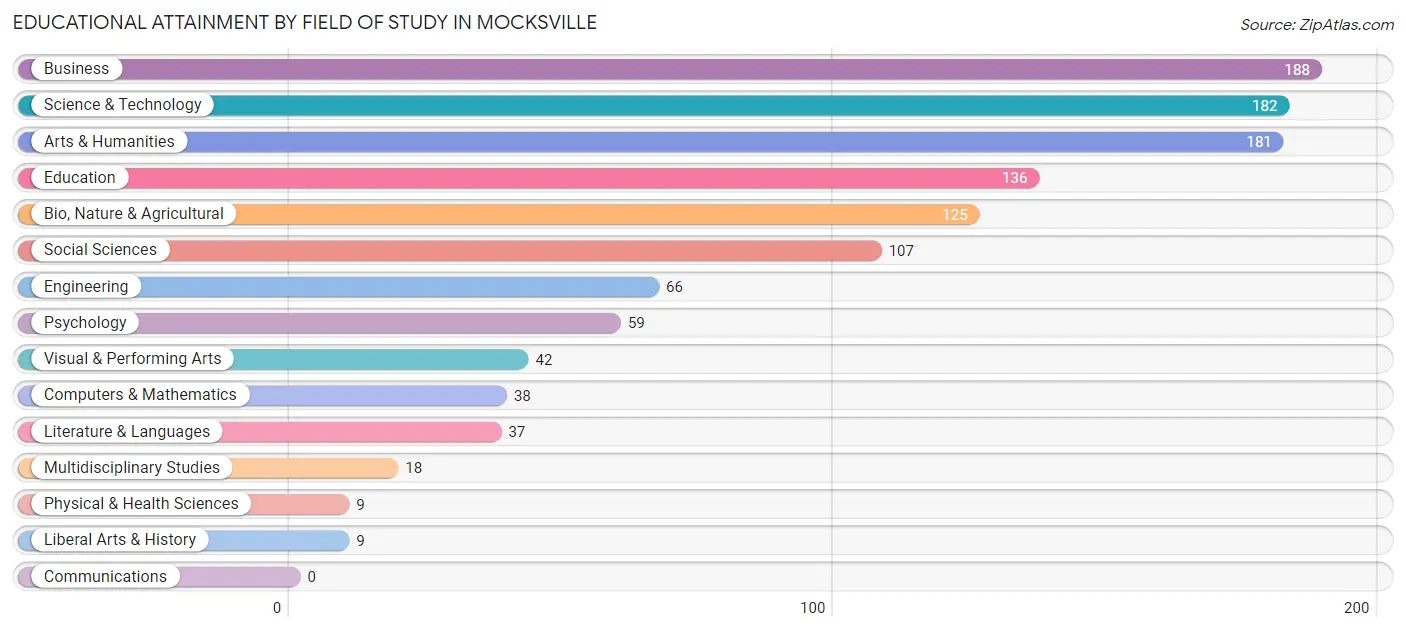
| Field of Study | # Graduates | % Graduates |
| Computers & Mathematics | 38 | 3.2% |
| Bio, Nature & Agricultural | 125 | 10.4% |
| Physical & Health Sciences | 9 | 0.7% |
| Psychology | 59 | 4.9% |
| Social Sciences | 107 | 8.9% |
| Engineering | 66 | 5.5% |
| Multidisciplinary Studies | 18 | 1.5% |
| Science & Technology | 182 | 15.2% |
| Business | 188 | 15.7% |
| Education | 136 | 11.4% |
| Literature & Languages | 37 | 3.1% |
| Liberal Arts & History | 9 | 0.7% |
| Visual & Performing Arts | 42 | 3.5% |
| Communications | 0 | 0.0% |
| Arts & Humanities | 181 | 15.1% |
| Total | 1,197 | 100.0% |
Transportation & Commute in Mocksville
Vehicle Availability by Sex in Mocksville
The most prevalent vehicle ownership categories in Mocksville are males with 2 vehicles (441, accounting for 32.1%) and females with 2 vehicles (425, making up 36.3%).
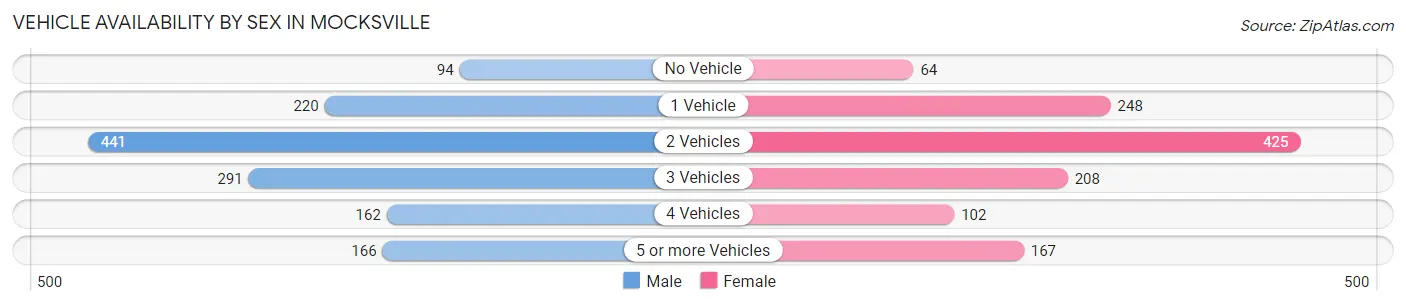
| Vehicles Available | Male | Female |
| No Vehicle | 94 (6.8%) | 64 (5.3%) |
| 1 Vehicle | 220 (16.0%) | 248 (20.4%) |
| 2 Vehicles | 441 (32.1%) | 425 (35.0%) |
| 3 Vehicles | 291 (21.2%) | 208 (17.1%) |
| 4 Vehicles | 162 (11.8%) | 102 (8.4%) |
| 5 or more Vehicles | 166 (12.1%) | 167 (13.8%) |
| Total | 1,374 (100.0%) | 1,214 (100.0%) |
Commute Time in Mocksville
The most frequently occuring commute durations in Mocksville are 10 to 14 minutes (638 commuters, 25.6%), 30 to 34 minutes (358 commuters, 14.3%), and 5 to 9 minutes (346 commuters, 13.9%).
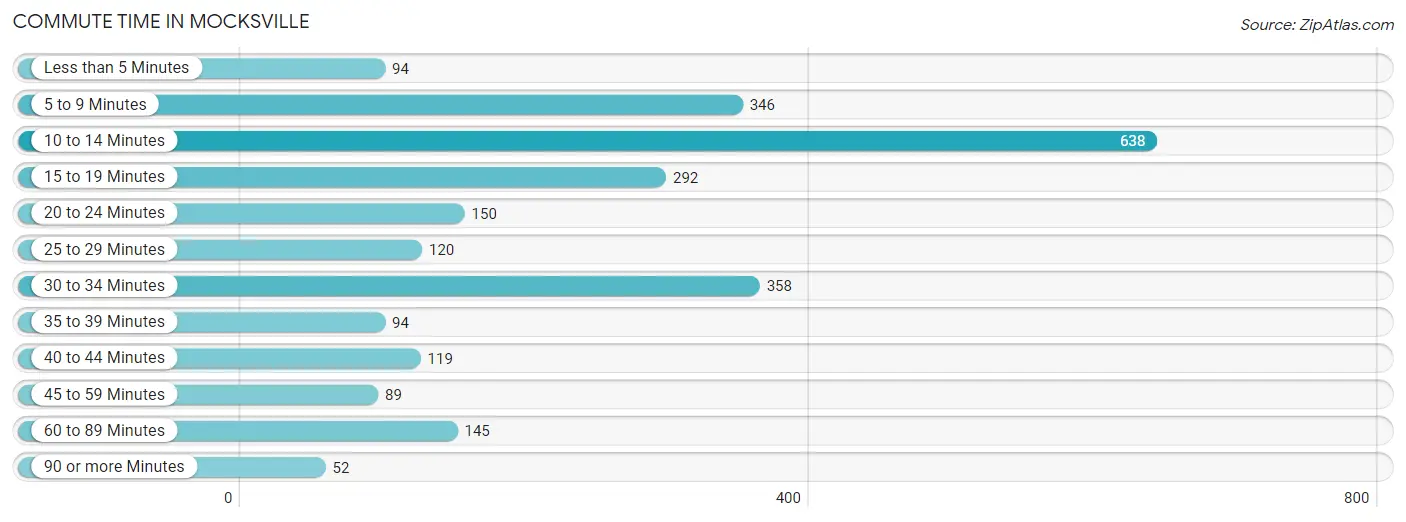
| Commute Time | # Commuters | % Commuters |
| Less than 5 Minutes | 94 | 3.8% |
| 5 to 9 Minutes | 346 | 13.9% |
| 10 to 14 Minutes | 638 | 25.6% |
| 15 to 19 Minutes | 292 | 11.7% |
| 20 to 24 Minutes | 150 | 6.0% |
| 25 to 29 Minutes | 120 | 4.8% |
| 30 to 34 Minutes | 358 | 14.3% |
| 35 to 39 Minutes | 94 | 3.8% |
| 40 to 44 Minutes | 119 | 4.8% |
| 45 to 59 Minutes | 89 | 3.6% |
| 60 to 89 Minutes | 145 | 5.8% |
| 90 or more Minutes | 52 | 2.1% |
Commute Time by Sex in Mocksville
The most common commute times in Mocksville are 10 to 14 minutes (406 commuters, 30.0%) for males and 5 to 9 minutes (295 commuters, 25.7%) for females.
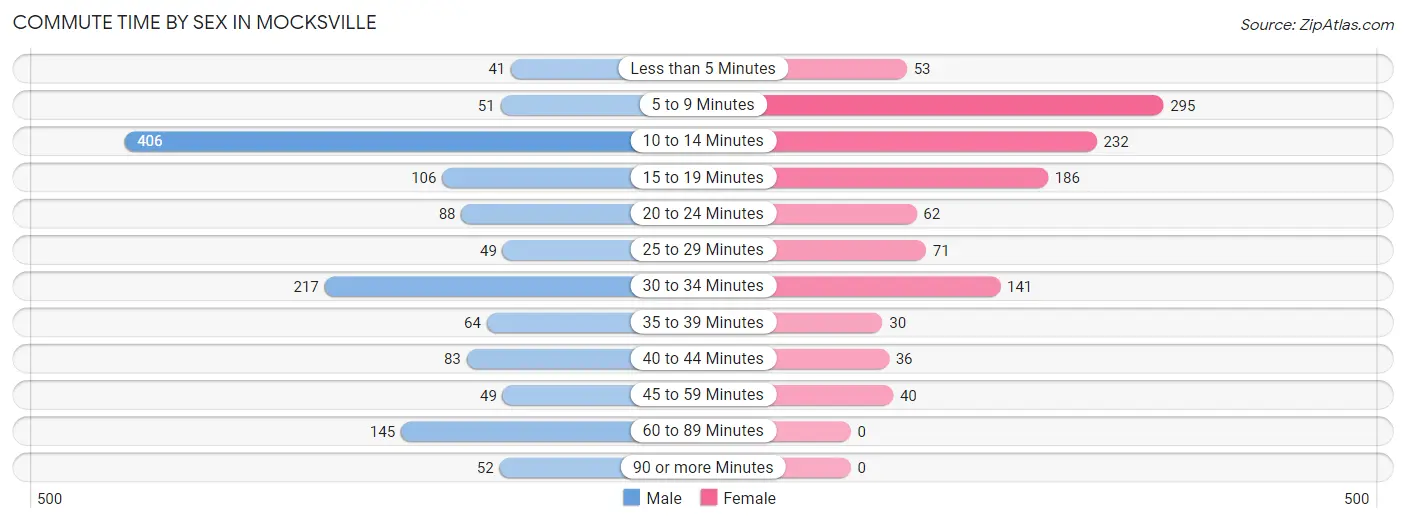
| Commute Time | Male | Female |
| Less than 5 Minutes | 41 (3.0%) | 53 (4.6%) |
| 5 to 9 Minutes | 51 (3.8%) | 295 (25.7%) |
| 10 to 14 Minutes | 406 (30.0%) | 232 (20.2%) |
| 15 to 19 Minutes | 106 (7.9%) | 186 (16.2%) |
| 20 to 24 Minutes | 88 (6.5%) | 62 (5.4%) |
| 25 to 29 Minutes | 49 (3.6%) | 71 (6.2%) |
| 30 to 34 Minutes | 217 (16.1%) | 141 (12.3%) |
| 35 to 39 Minutes | 64 (4.7%) | 30 (2.6%) |
| 40 to 44 Minutes | 83 (6.1%) | 36 (3.1%) |
| 45 to 59 Minutes | 49 (3.6%) | 40 (3.5%) |
| 60 to 89 Minutes | 145 (10.7%) | 0 (0.0%) |
| 90 or more Minutes | 52 (3.8%) | 0 (0.0%) |
Time of Departure to Work by Sex in Mocksville
The most frequent times of departure to work in Mocksville are 6:00 AM to 6:29 AM (165, 12.2%) for males and 7:00 AM to 7:29 AM (332, 29.0%) for females.
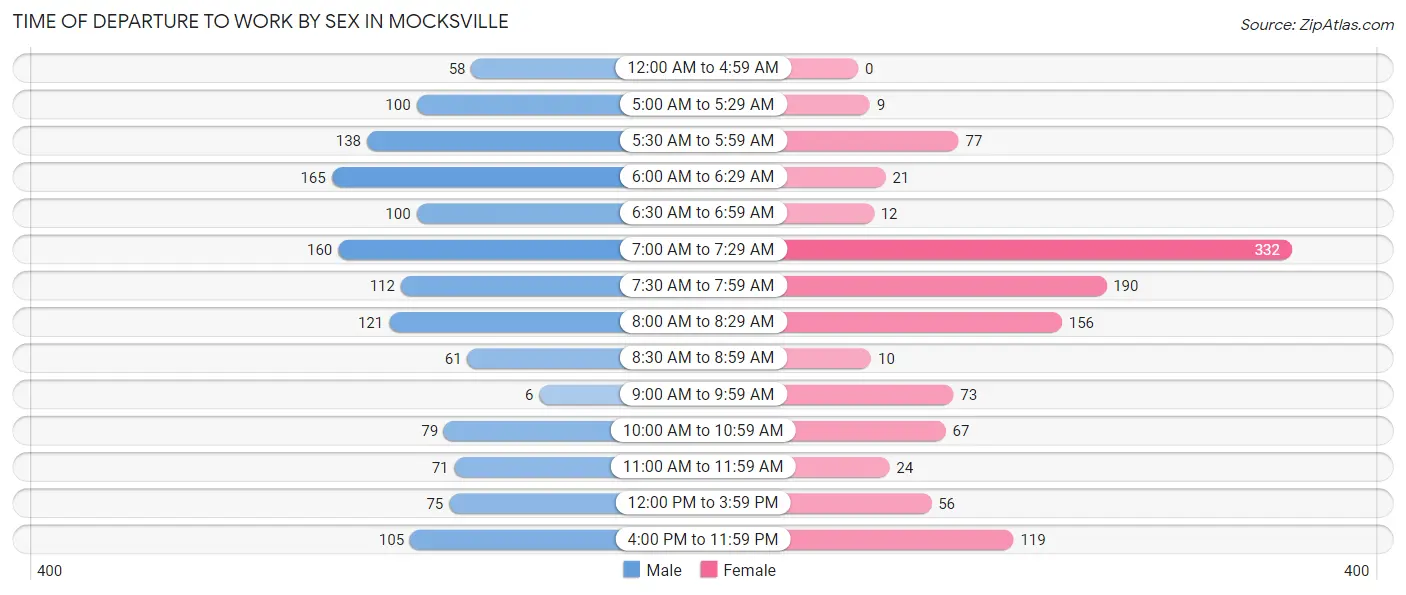
| Time of Departure | Male | Female |
| 12:00 AM to 4:59 AM | 58 (4.3%) | 0 (0.0%) |
| 5:00 AM to 5:29 AM | 100 (7.4%) | 9 (0.8%) |
| 5:30 AM to 5:59 AM | 138 (10.2%) | 77 (6.7%) |
| 6:00 AM to 6:29 AM | 165 (12.2%) | 21 (1.8%) |
| 6:30 AM to 6:59 AM | 100 (7.4%) | 12 (1.1%) |
| 7:00 AM to 7:29 AM | 160 (11.8%) | 332 (29.0%) |
| 7:30 AM to 7:59 AM | 112 (8.3%) | 190 (16.6%) |
| 8:00 AM to 8:29 AM | 121 (9.0%) | 156 (13.6%) |
| 8:30 AM to 8:59 AM | 61 (4.5%) | 10 (0.9%) |
| 9:00 AM to 9:59 AM | 6 (0.4%) | 73 (6.4%) |
| 10:00 AM to 10:59 AM | 79 (5.9%) | 67 (5.9%) |
| 11:00 AM to 11:59 AM | 71 (5.3%) | 24 (2.1%) |
| 12:00 PM to 3:59 PM | 75 (5.6%) | 56 (4.9%) |
| 4:00 PM to 11:59 PM | 105 (7.8%) | 119 (10.4%) |
| Total | 1,351 (100.0%) | 1,146 (100.0%) |
Housing Occupancy in Mocksville
Occupancy by Ownership in Mocksville
Of the total 2,202 dwellings in Mocksville, owner-occupied units account for 1,284 (58.3%), while renter-occupied units make up 918 (41.7%).
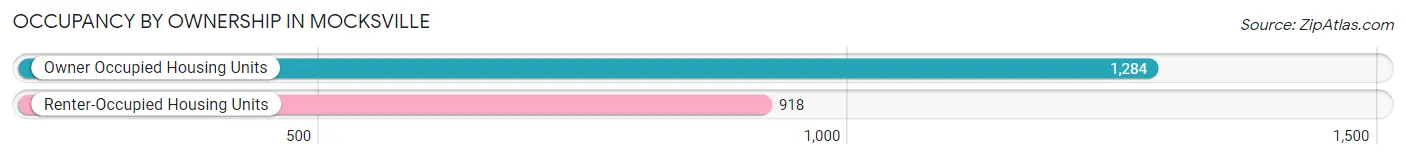
| Occupancy | # Housing Units | % Housing Units |
| Owner Occupied Housing Units | 1,284 | 58.3% |
| Renter-Occupied Housing Units | 918 | 41.7% |
| Total Occupied Housing Units | 2,202 | 100.0% |
Occupancy by Household Size in Mocksville
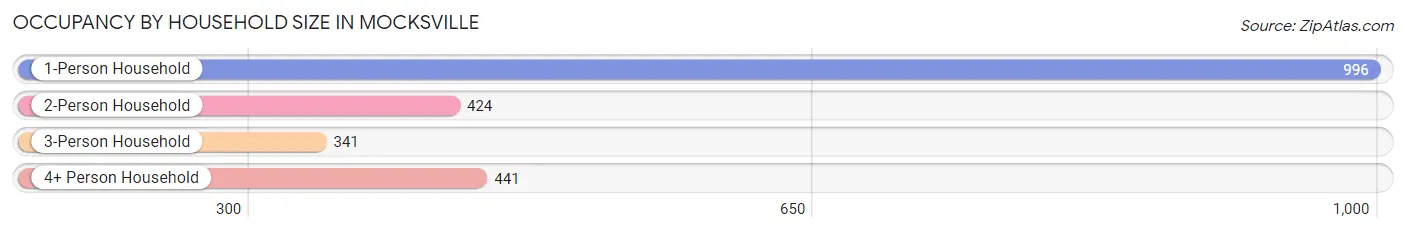
| Household Size | # Housing Units | % Housing Units |
| 1-Person Household | 996 | 45.2% |
| 2-Person Household | 424 | 19.3% |
| 3-Person Household | 341 | 15.5% |
| 4+ Person Household | 441 | 20.0% |
| Total Housing Units | 2,202 | 100.0% |
Occupancy by Ownership by Household Size in Mocksville
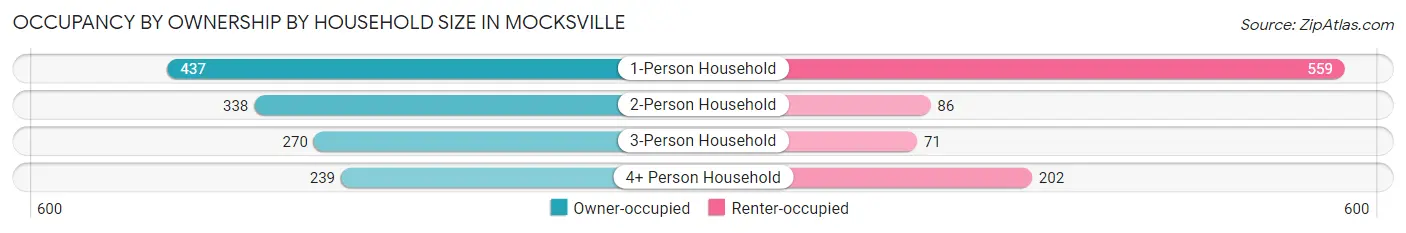
| Household Size | Owner-occupied | Renter-occupied |
| 1-Person Household | 437 (43.9%) | 559 (56.1%) |
| 2-Person Household | 338 (79.7%) | 86 (20.3%) |
| 3-Person Household | 270 (79.2%) | 71 (20.8%) |
| 4+ Person Household | 239 (54.2%) | 202 (45.8%) |
| Total Housing Units | 1,284 (58.3%) | 918 (41.7%) |
Occupancy by Educational Attainment in Mocksville
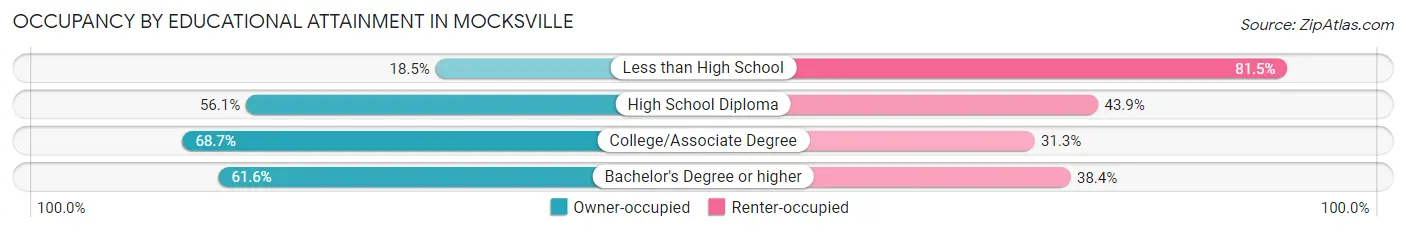
| Household Size | Owner-occupied | Renter-occupied |
| Less than High School | 32 (18.5%) | 141 (81.5%) |
| High School Diploma | 441 (56.1%) | 345 (43.9%) |
| College/Associate Degree | 441 (68.7%) | 201 (31.3%) |
| Bachelor's Degree or higher | 370 (61.6%) | 231 (38.4%) |
Occupancy by Age of Householder in Mocksville
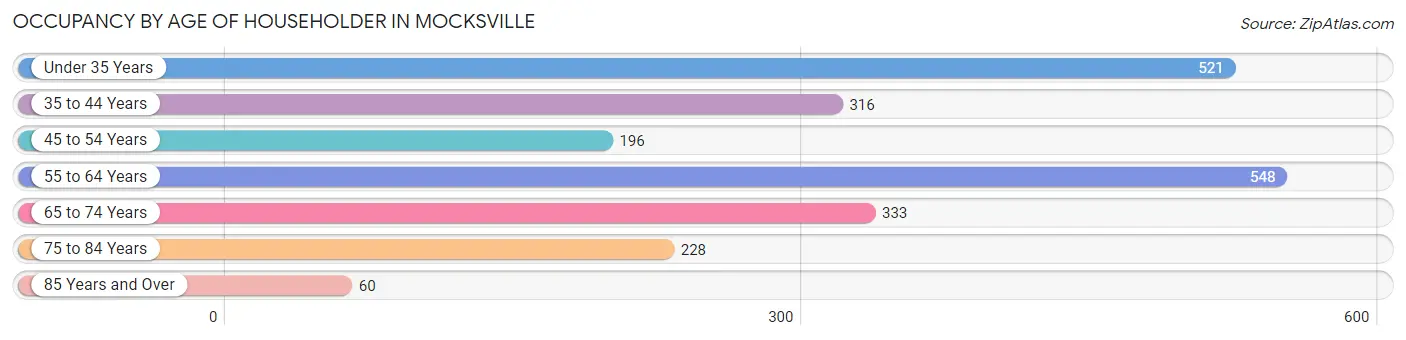
| Age Bracket | # Households | % Households |
| Under 35 Years | 521 | 23.7% |
| 35 to 44 Years | 316 | 14.3% |
| 45 to 54 Years | 196 | 8.9% |
| 55 to 64 Years | 548 | 24.9% |
| 65 to 74 Years | 333 | 15.1% |
| 75 to 84 Years | 228 | 10.3% |
| 85 Years and Over | 60 | 2.7% |
| Total | 2,202 | 100.0% |
Housing Finances in Mocksville
Median Income by Occupancy in Mocksville
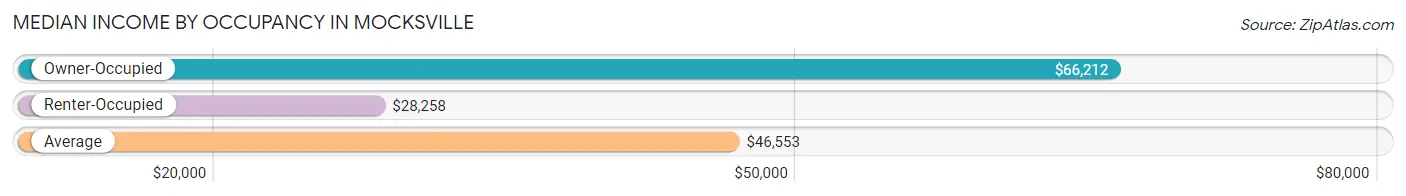
| Occupancy Type | # Households | Median Income |
| Owner-Occupied | 1,284 (58.3%) | $66,212 |
| Renter-Occupied | 918 (41.7%) | $28,258 |
| Average | 2,202 (100.0%) | $46,553 |
Occupancy by Householder Income Bracket in Mocksville
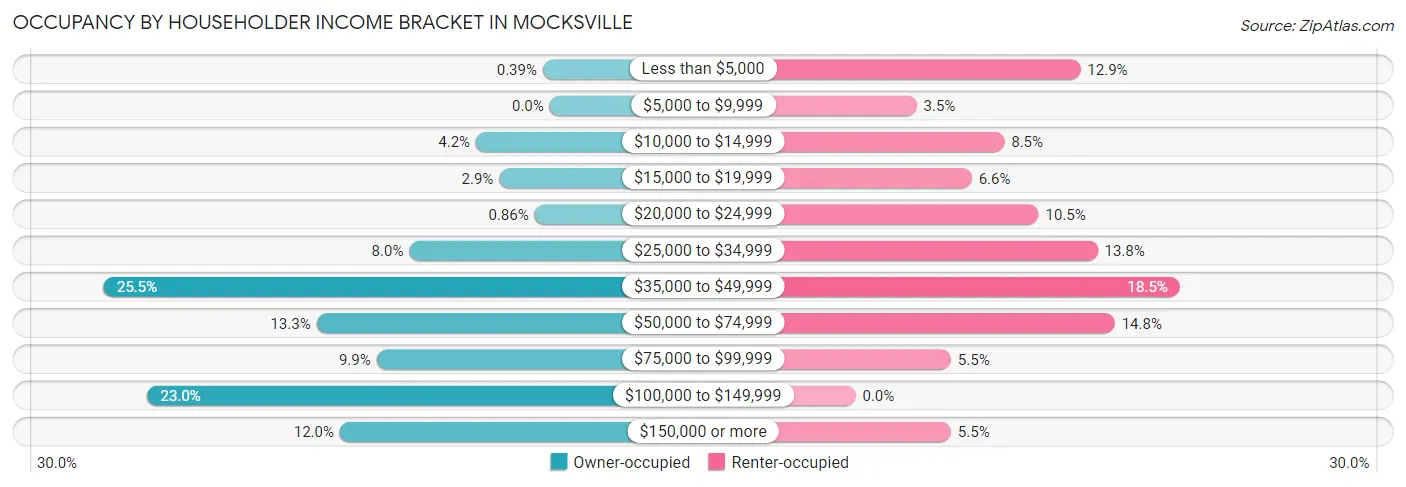
| Income Bracket | Owner-occupied | Renter-occupied |
| Less than $5,000 | 5 (0.4%) | 118 (12.9%) |
| $5,000 to $9,999 | 0 (0.0%) | 32 (3.5%) |
| $10,000 to $14,999 | 54 (4.2%) | 78 (8.5%) |
| $15,000 to $19,999 | 37 (2.9%) | 61 (6.6%) |
| $20,000 to $24,999 | 11 (0.9%) | 96 (10.5%) |
| $25,000 to $34,999 | 103 (8.0%) | 127 (13.8%) |
| $35,000 to $49,999 | 327 (25.5%) | 170 (18.5%) |
| $50,000 to $74,999 | 171 (13.3%) | 136 (14.8%) |
| $75,000 to $99,999 | 127 (9.9%) | 50 (5.4%) |
| $100,000 to $149,999 | 295 (23.0%) | 0 (0.0%) |
| $150,000 or more | 154 (12.0%) | 50 (5.4%) |
| Total | 1,284 (100.0%) | 918 (100.0%) |
Monthly Housing Cost Tiers in Mocksville
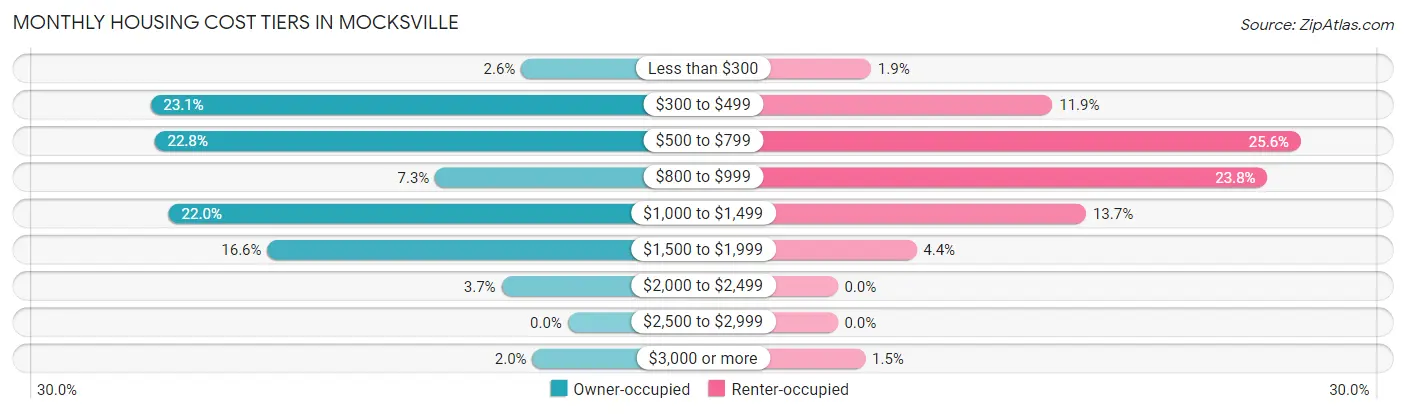
| Monthly Cost | Owner-occupied | Renter-occupied |
| Less than $300 | 33 (2.6%) | 17 (1.8%) |
| $300 to $499 | 296 (23.1%) | 109 (11.9%) |
| $500 to $799 | 293 (22.8%) | 235 (25.6%) |
| $800 to $999 | 94 (7.3%) | 218 (23.7%) |
| $1,000 to $1,499 | 283 (22.0%) | 126 (13.7%) |
| $1,500 to $1,999 | 213 (16.6%) | 40 (4.4%) |
| $2,000 to $2,499 | 47 (3.7%) | 0 (0.0%) |
| $2,500 to $2,999 | 0 (0.0%) | 0 (0.0%) |
| $3,000 or more | 25 (1.9%) | 14 (1.5%) |
| Total | 1,284 (100.0%) | 918 (100.0%) |
Physical Housing Characteristics in Mocksville
Housing Structures in Mocksville
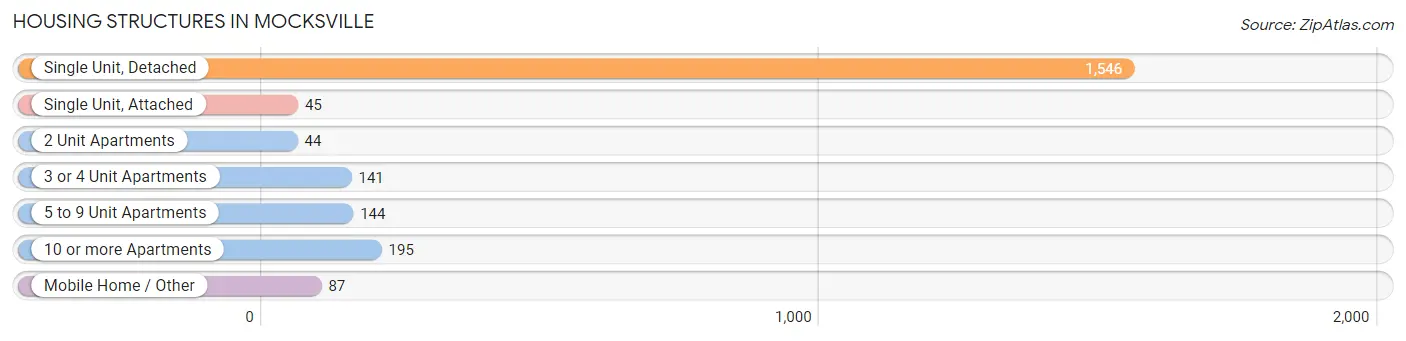
| Structure Type | # Housing Units | % Housing Units |
| Single Unit, Detached | 1,546 | 70.2% |
| Single Unit, Attached | 45 | 2.0% |
| 2 Unit Apartments | 44 | 2.0% |
| 3 or 4 Unit Apartments | 141 | 6.4% |
| 5 to 9 Unit Apartments | 144 | 6.5% |
| 10 or more Apartments | 195 | 8.9% |
| Mobile Home / Other | 87 | 4.0% |
| Total | 2,202 | 100.0% |
Housing Structures by Occupancy in Mocksville
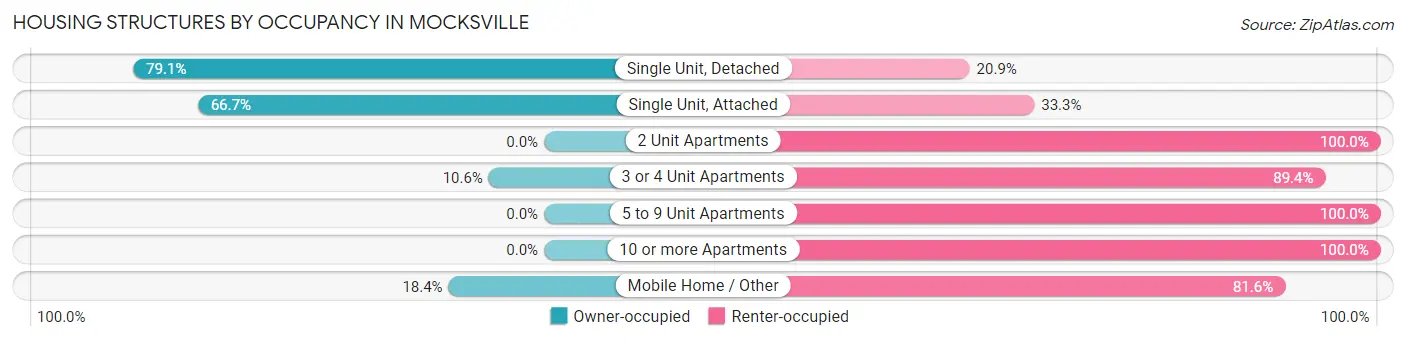
| Structure Type | Owner-occupied | Renter-occupied |
| Single Unit, Detached | 1,223 (79.1%) | 323 (20.9%) |
| Single Unit, Attached | 30 (66.7%) | 15 (33.3%) |
| 2 Unit Apartments | 0 (0.0%) | 44 (100.0%) |
| 3 or 4 Unit Apartments | 15 (10.6%) | 126 (89.4%) |
| 5 to 9 Unit Apartments | 0 (0.0%) | 144 (100.0%) |
| 10 or more Apartments | 0 (0.0%) | 195 (100.0%) |
| Mobile Home / Other | 16 (18.4%) | 71 (81.6%) |
| Total | 1,284 (58.3%) | 918 (41.7%) |
Housing Structures by Number of Rooms in Mocksville
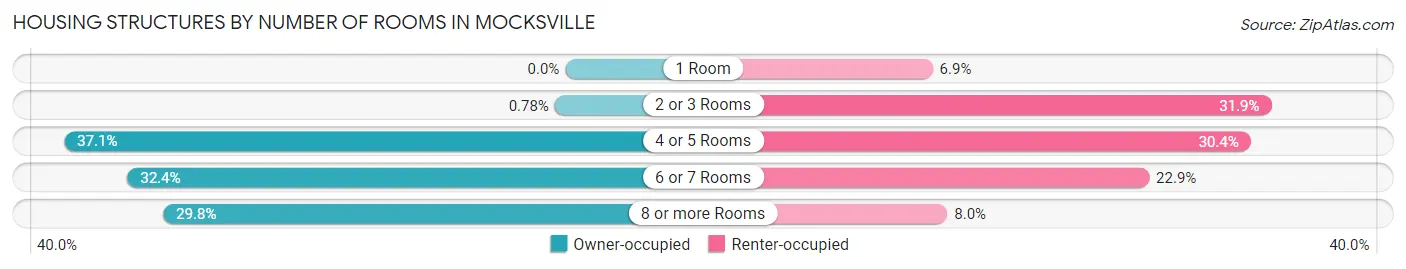
| Number of Rooms | Owner-occupied | Renter-occupied |
| 1 Room | 0 (0.0%) | 63 (6.9%) |
| 2 or 3 Rooms | 10 (0.8%) | 293 (31.9%) |
| 4 or 5 Rooms | 476 (37.1%) | 279 (30.4%) |
| 6 or 7 Rooms | 416 (32.4%) | 210 (22.9%) |
| 8 or more Rooms | 382 (29.7%) | 73 (8.0%) |
| Total | 1,284 (100.0%) | 918 (100.0%) |
Housing Structure by Heating Type in Mocksville
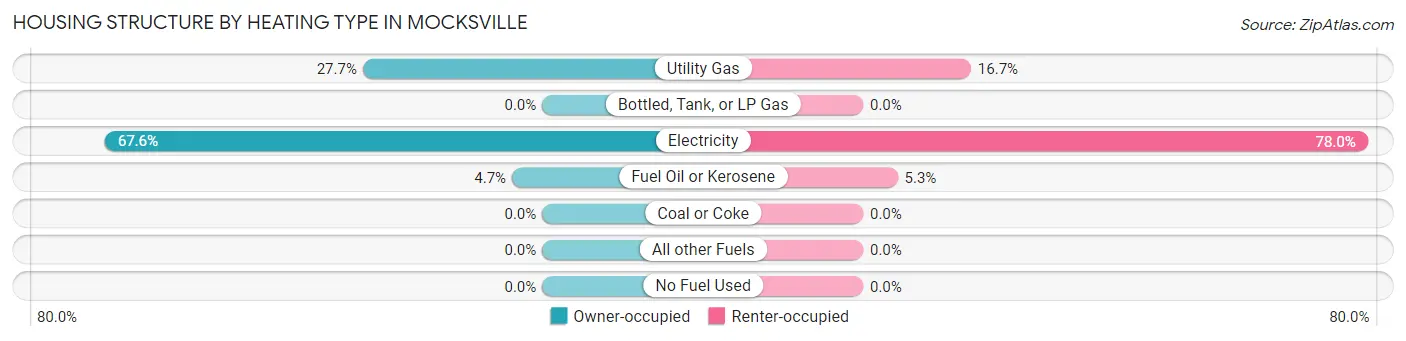
| Heating Type | Owner-occupied | Renter-occupied |
| Utility Gas | 356 (27.7%) | 153 (16.7%) |
| Bottled, Tank, or LP Gas | 0 (0.0%) | 0 (0.0%) |
| Electricity | 868 (67.6%) | 716 (78.0%) |
| Fuel Oil or Kerosene | 60 (4.7%) | 49 (5.3%) |
| Coal or Coke | 0 (0.0%) | 0 (0.0%) |
| All other Fuels | 0 (0.0%) | 0 (0.0%) |
| No Fuel Used | 0 (0.0%) | 0 (0.0%) |
| Total | 1,284 (100.0%) | 918 (100.0%) |
Household Vehicle Usage in Mocksville
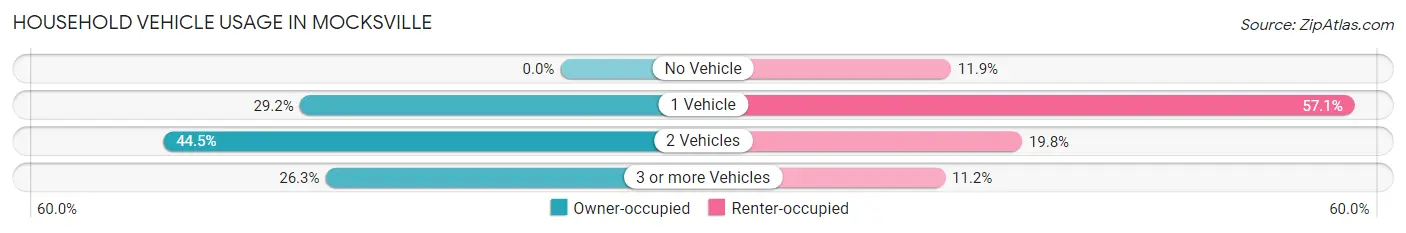
| Vehicles per Household | Owner-occupied | Renter-occupied |
| No Vehicle | 0 (0.0%) | 109 (11.9%) |
| 1 Vehicle | 375 (29.2%) | 524 (57.1%) |
| 2 Vehicles | 571 (44.5%) | 182 (19.8%) |
| 3 or more Vehicles | 338 (26.3%) | 103 (11.2%) |
| Total | 1,284 (100.0%) | 918 (100.0%) |
Real Estate & Mortgages in Mocksville
Real Estate and Mortgage Overview in Mocksville
| Characteristic | Without Mortgage | With Mortgage |
| Housing Units | 514 | 770 |
| Median Property Value | $181,600 | $177,000 |
| Median Household Income | $51,500 | $81 |
| Monthly Housing Costs | $434 | $25 |
| Real Estate Taxes | $1,300 | $0 |
Property Value by Mortgage Status in Mocksville
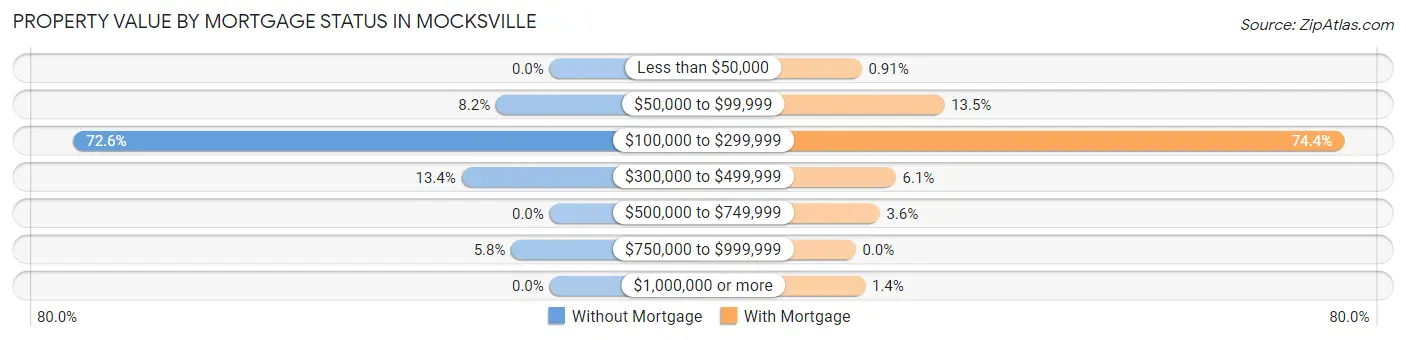
| Property Value | Without Mortgage | With Mortgage |
| Less than $50,000 | 0 (0.0%) | 7 (0.9%) |
| $50,000 to $99,999 | 42 (8.2%) | 104 (13.5%) |
| $100,000 to $299,999 | 373 (72.6%) | 573 (74.4%) |
| $300,000 to $499,999 | 69 (13.4%) | 47 (6.1%) |
| $500,000 to $749,999 | 0 (0.0%) | 28 (3.6%) |
| $750,000 to $999,999 | 30 (5.8%) | 0 (0.0%) |
| $1,000,000 or more | 0 (0.0%) | 11 (1.4%) |
| Total | 514 (100.0%) | 770 (100.0%) |
Household Income by Mortgage Status in Mocksville
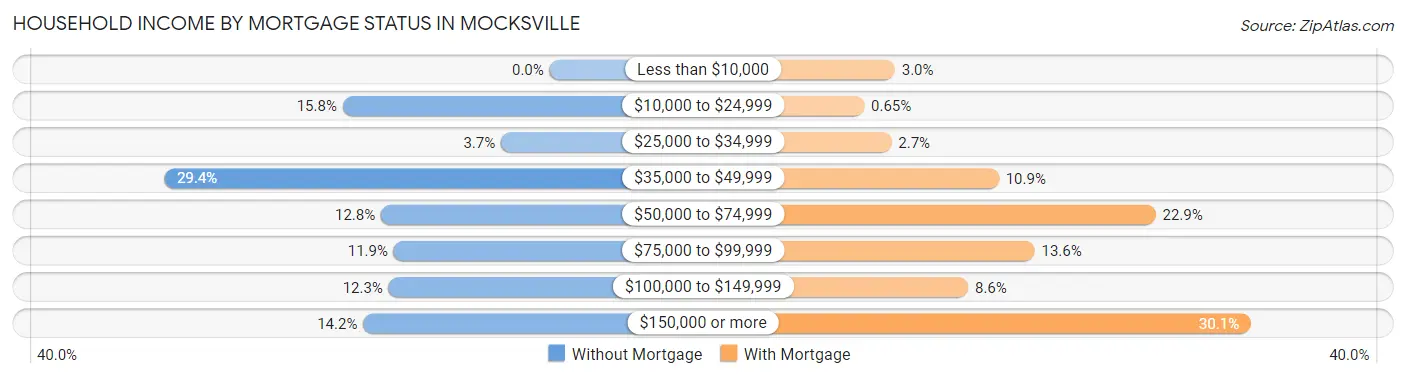
| Household Income | Without Mortgage | With Mortgage |
| Less than $10,000 | 0 (0.0%) | 23 (3.0%) |
| $10,000 to $24,999 | 81 (15.8%) | 5 (0.6%) |
| $25,000 to $34,999 | 19 (3.7%) | 21 (2.7%) |
| $35,000 to $49,999 | 151 (29.4%) | 84 (10.9%) |
| $50,000 to $74,999 | 66 (12.8%) | 176 (22.9%) |
| $75,000 to $99,999 | 61 (11.9%) | 105 (13.6%) |
| $100,000 to $149,999 | 63 (12.3%) | 66 (8.6%) |
| $150,000 or more | 73 (14.2%) | 232 (30.1%) |
| Total | 514 (100.0%) | 770 (100.0%) |
Property Value to Household Income Ratio in Mocksville
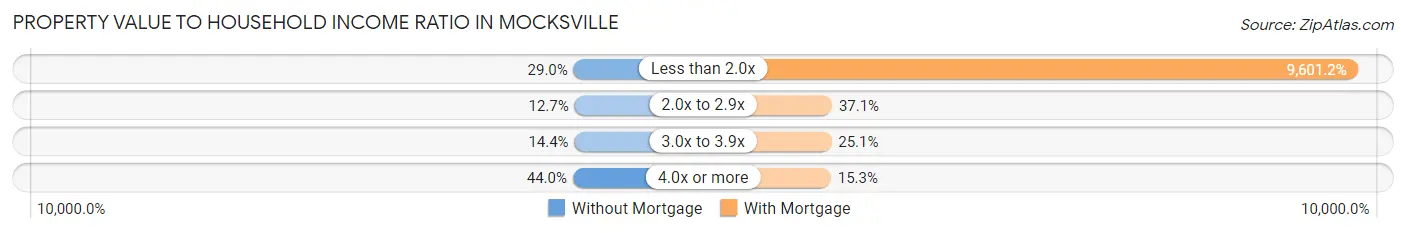
| Value-to-Income Ratio | Without Mortgage | With Mortgage |
| Less than 2.0x | 149 (29.0%) | 73,929 (9,601.2%) |
| 2.0x to 2.9x | 65 (12.7%) | 286 (37.1%) |
| 3.0x to 3.9x | 74 (14.4%) | 193 (25.1%) |
| 4.0x or more | 226 (44.0%) | 118 (15.3%) |
| Total | 514 (100.0%) | 770 (100.0%) |
Real Estate Taxes by Mortgage Status in Mocksville
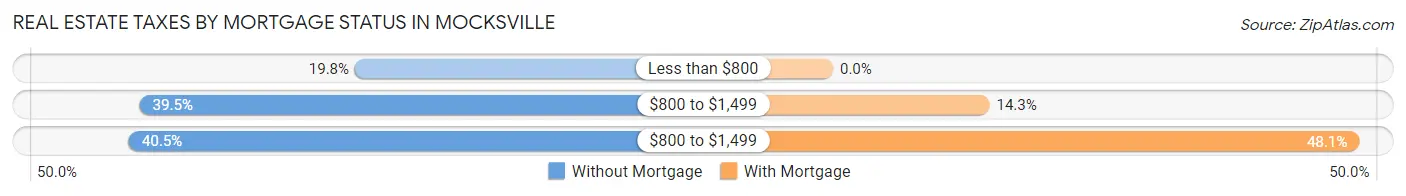
| Property Taxes | Without Mortgage | With Mortgage |
| Less than $800 | 102 (19.8%) | 0 (0.0%) |
| $800 to $1,499 | 203 (39.5%) | 110 (14.3%) |
| $800 to $1,499 | 208 (40.5%) | 370 (48.0%) |
| Total | 514 (100.0%) | 770 (100.0%) |
Health & Disability in Mocksville
Health Insurance Coverage by Age in Mocksville
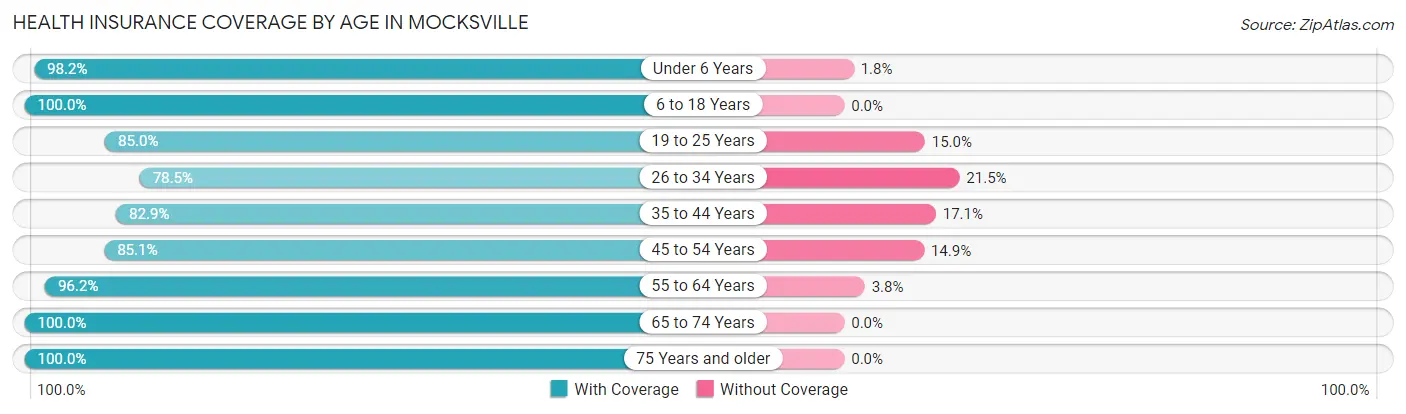
| Age Bracket | With Coverage | Without Coverage |
| Under 6 Years | 726 (98.2%) | 13 (1.8%) |
| 6 to 18 Years | 694 (100.0%) | 0 (0.0%) |
| 19 to 25 Years | 487 (85.0%) | 86 (15.0%) |
| 26 to 34 Years | 801 (78.5%) | 219 (21.5%) |
| 35 to 44 Years | 413 (82.9%) | 85 (17.1%) |
| 45 to 54 Years | 464 (85.1%) | 81 (14.9%) |
| 55 to 64 Years | 783 (96.2%) | 31 (3.8%) |
| 65 to 74 Years | 459 (100.0%) | 0 (0.0%) |
| 75 Years and older | 451 (100.0%) | 0 (0.0%) |
| Total | 5,278 (91.1%) | 515 (8.9%) |
Health Insurance Coverage by Citizenship Status in Mocksville
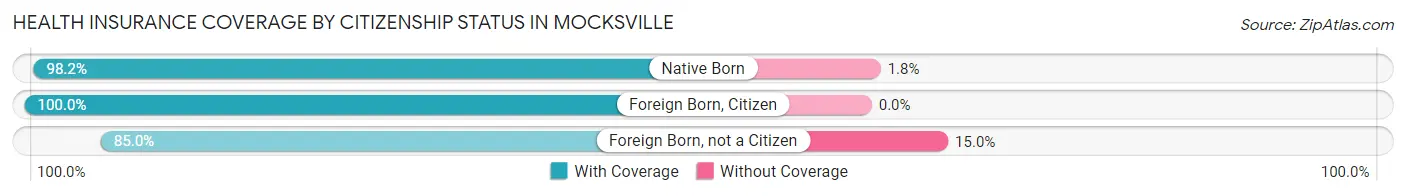
| Citizenship Status | With Coverage | Without Coverage |
| Native Born | 726 (98.2%) | 13 (1.8%) |
| Foreign Born, Citizen | 694 (100.0%) | 0 (0.0%) |
| Foreign Born, not a Citizen | 487 (85.0%) | 86 (15.0%) |
Health Insurance Coverage by Household Income in Mocksville
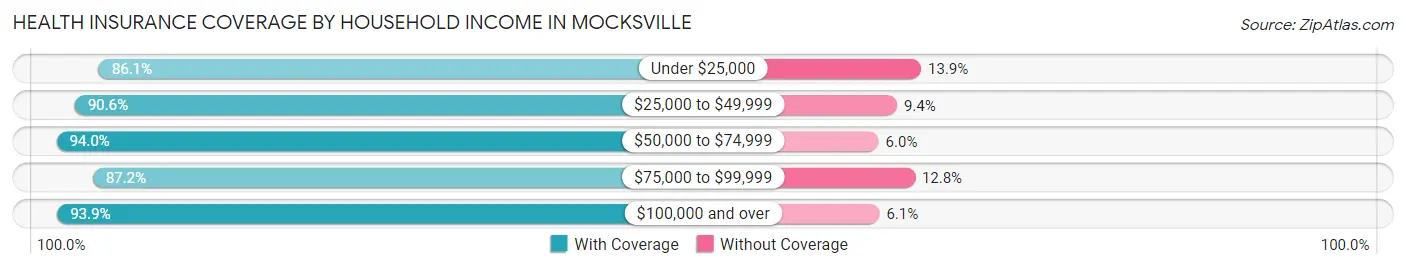
| Household Income | With Coverage | Without Coverage |
| Under $25,000 | 1,033 (86.1%) | 167 (13.9%) |
| $25,000 to $49,999 | 1,156 (90.6%) | 120 (9.4%) |
| $50,000 to $74,999 | 677 (94.0%) | 43 (6.0%) |
| $75,000 to $99,999 | 362 (87.2%) | 53 (12.8%) |
| $100,000 and over | 2,025 (93.9%) | 132 (6.1%) |
Public vs Private Health Insurance Coverage by Age in Mocksville
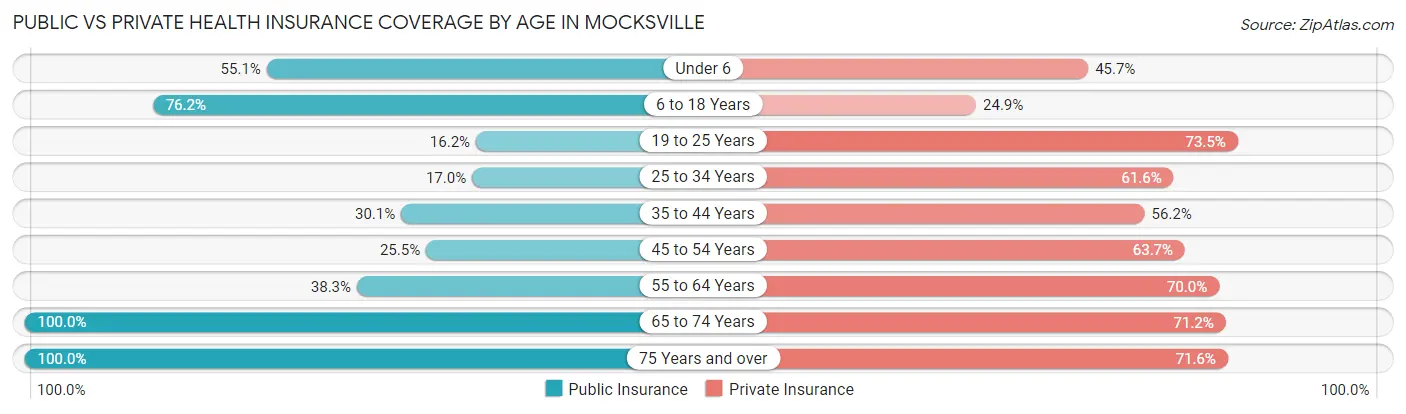
| Age Bracket | Public Insurance | Private Insurance |
| Under 6 | 407 (55.1%) | 338 (45.7%) |
| 6 to 18 Years | 529 (76.2%) | 173 (24.9%) |
| 19 to 25 Years | 93 (16.2%) | 421 (73.5%) |
| 25 to 34 Years | 173 (17.0%) | 628 (61.6%) |
| 35 to 44 Years | 150 (30.1%) | 280 (56.2%) |
| 45 to 54 Years | 139 (25.5%) | 347 (63.7%) |
| 55 to 64 Years | 312 (38.3%) | 570 (70.0%) |
| 65 to 74 Years | 459 (100.0%) | 327 (71.2%) |
| 75 Years and over | 451 (100.0%) | 323 (71.6%) |
| Total | 2,713 (46.8%) | 3,407 (58.8%) |
Disability Status by Sex by Age in Mocksville
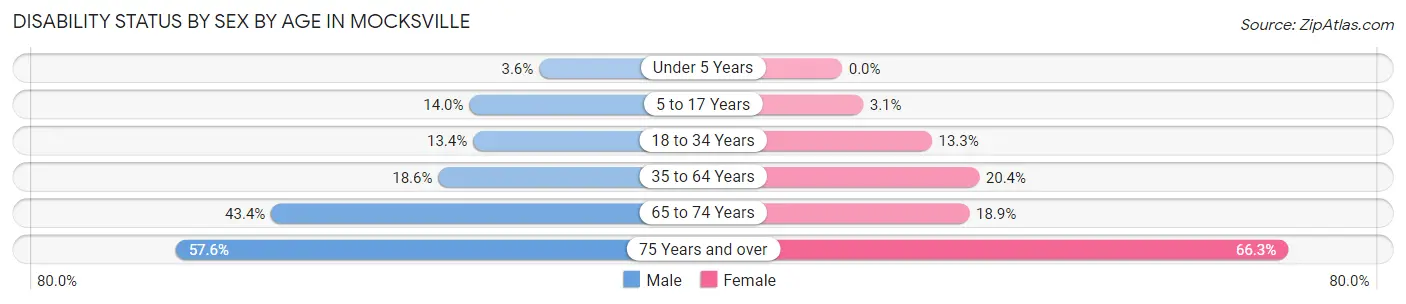
| Age Bracket | Male | Female |
| Under 5 Years | 12 (3.6%) | 0 (0.0%) |
| 5 to 17 Years | 55 (14.0%) | 16 (3.1%) |
| 18 to 34 Years | 112 (13.4%) | 102 (13.3%) |
| 35 to 64 Years | 156 (18.6%) | 207 (20.3%) |
| 65 to 74 Years | 82 (43.4%) | 51 (18.9%) |
| 75 Years and over | 118 (57.6%) | 163 (66.3%) |
Disability Class by Sex by Age in Mocksville
Disability Class: Hearing Difficulty
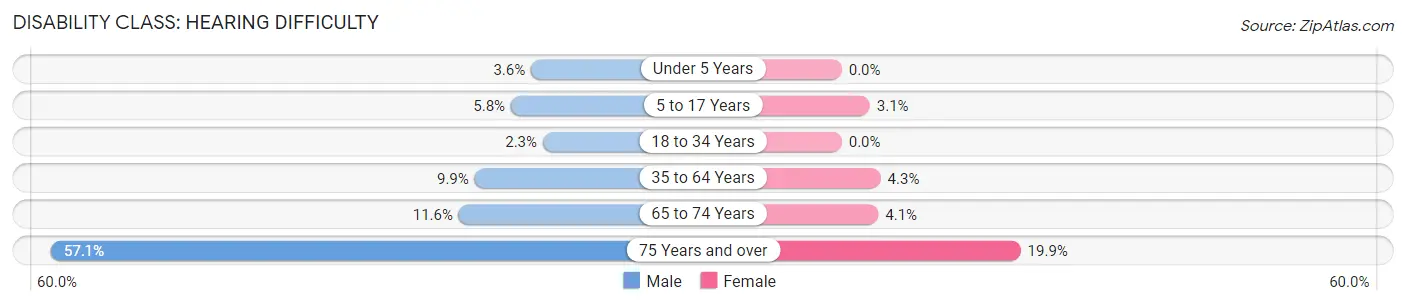
| Age Bracket | Male | Female |
| Under 5 Years | 12 (3.6%) | 0 (0.0%) |
| 5 to 17 Years | 23 (5.8%) | 16 (3.1%) |
| 18 to 34 Years | 19 (2.3%) | 0 (0.0%) |
| 35 to 64 Years | 83 (9.9%) | 44 (4.3%) |
| 65 to 74 Years | 22 (11.6%) | 11 (4.1%) |
| 75 Years and over | 117 (57.1%) | 49 (19.9%) |
Disability Class: Vision Difficulty
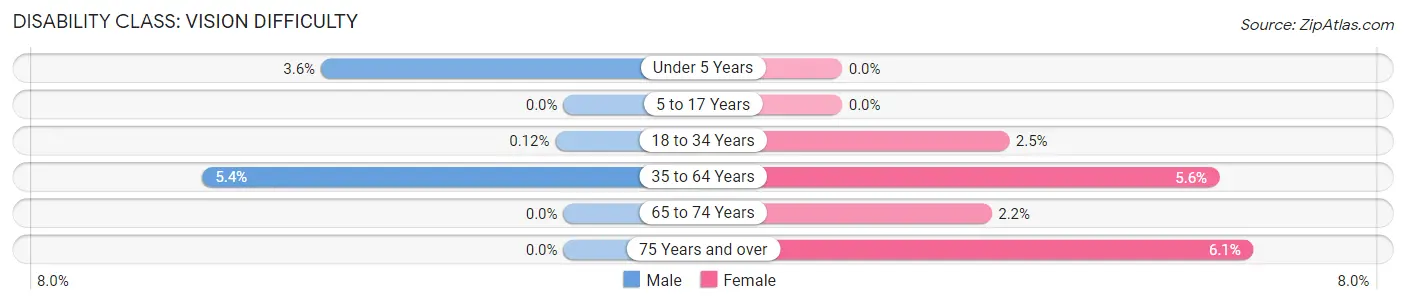
| Age Bracket | Male | Female |
| Under 5 Years | 12 (3.6%) | 0 (0.0%) |
| 5 to 17 Years | 0 (0.0%) | 0 (0.0%) |
| 18 to 34 Years | 1 (0.1%) | 19 (2.5%) |
| 35 to 64 Years | 45 (5.4%) | 57 (5.6%) |
| 65 to 74 Years | 0 (0.0%) | 6 (2.2%) |
| 75 Years and over | 0 (0.0%) | 15 (6.1%) |
Disability Class: Cognitive Difficulty
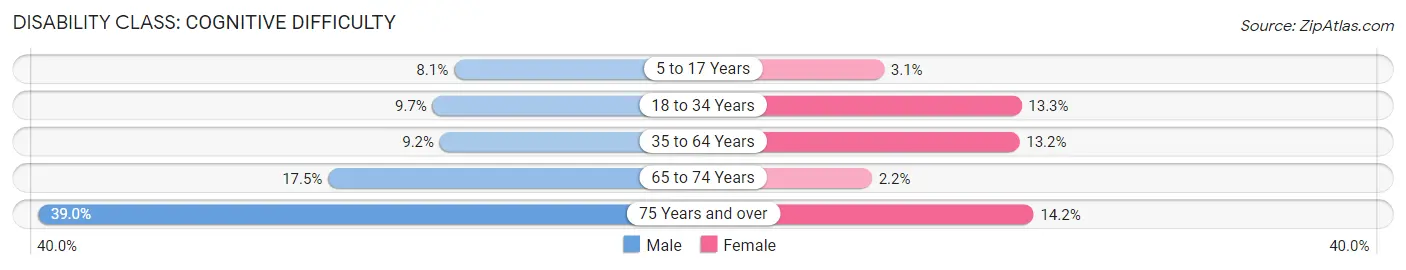
| Age Bracket | Male | Female |
| 5 to 17 Years | 32 (8.1%) | 16 (3.1%) |
| 18 to 34 Years | 81 (9.7%) | 102 (13.3%) |
| 35 to 64 Years | 77 (9.2%) | 134 (13.2%) |
| 65 to 74 Years | 33 (17.5%) | 6 (2.2%) |
| 75 Years and over | 80 (39.0%) | 35 (14.2%) |
Disability Class: Ambulatory Difficulty
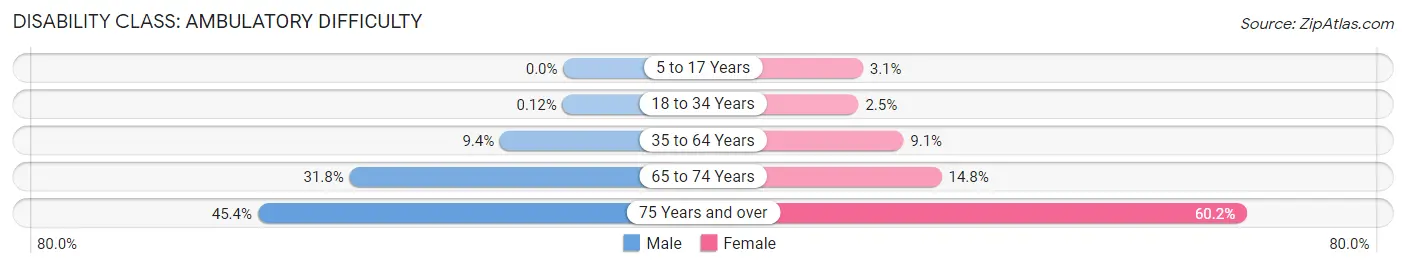
| Age Bracket | Male | Female |
| 5 to 17 Years | 0 (0.0%) | 16 (3.1%) |
| 18 to 34 Years | 1 (0.1%) | 19 (2.5%) |
| 35 to 64 Years | 79 (9.4%) | 93 (9.1%) |
| 65 to 74 Years | 60 (31.8%) | 40 (14.8%) |
| 75 Years and over | 93 (45.4%) | 148 (60.2%) |
Disability Class: Self-Care Difficulty
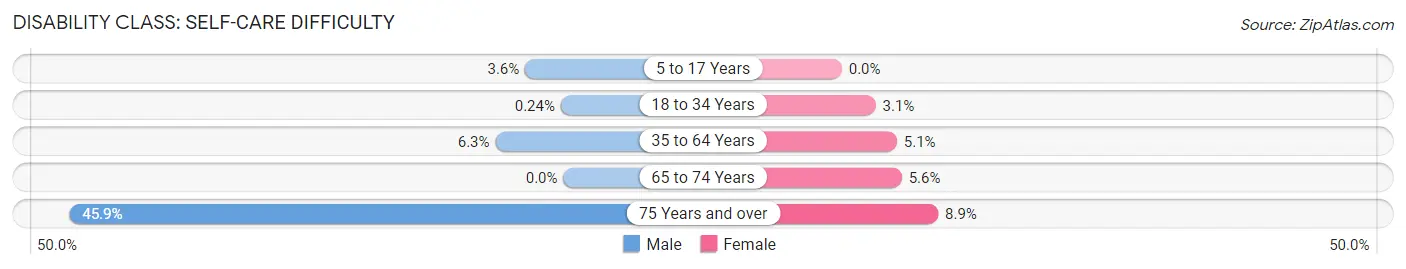
| Age Bracket | Male | Female |
| 5 to 17 Years | 14 (3.5%) | 0 (0.0%) |
| 18 to 34 Years | 2 (0.2%) | 24 (3.1%) |
| 35 to 64 Years | 53 (6.3%) | 52 (5.1%) |
| 65 to 74 Years | 0 (0.0%) | 15 (5.6%) |
| 75 Years and over | 94 (45.9%) | 22 (8.9%) |
Technology Access in Mocksville
Computing Device Access in Mocksville
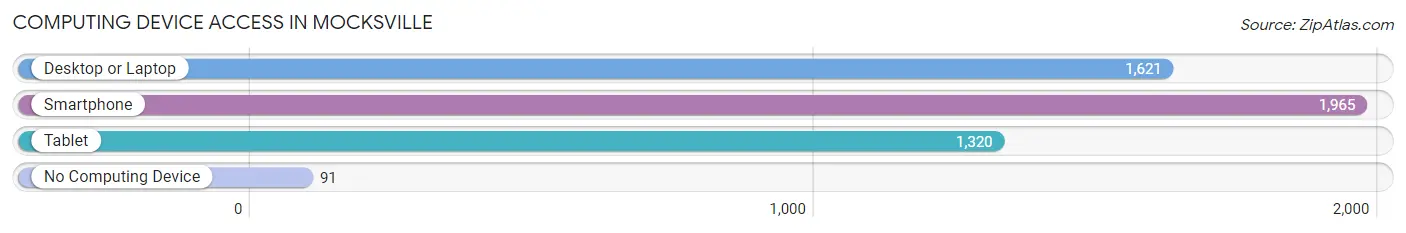
| Device Type | # Households | % Households |
| Desktop or Laptop | 1,621 | 73.6% |
| Smartphone | 1,965 | 89.2% |
| Tablet | 1,320 | 60.0% |
| No Computing Device | 91 | 4.1% |
| Total | 2,202 | 100.0% |
Internet Access in Mocksville
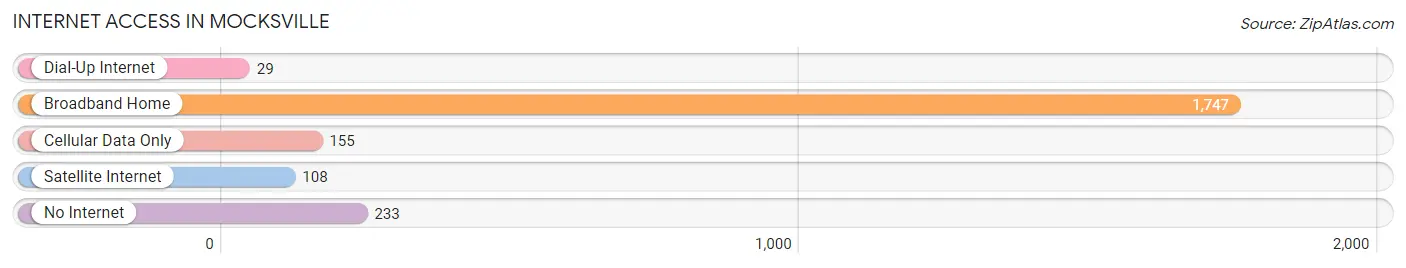
| Internet Type | # Households | % Households |
| Dial-Up Internet | 29 | 1.3% |
| Broadband Home | 1,747 | 79.3% |
| Cellular Data Only | 155 | 7.0% |
| Satellite Internet | 108 | 4.9% |
| No Internet | 233 | 10.6% |
| Total | 2,202 | 100.0% |
Mocksville Summary
Mocksville, North Carolina is a small town located in Davie County, in the Piedmont region of the state. It is situated in the Yadkin Valley, about 25 miles north of Winston-Salem. The town was founded in 1753 and named after the Mocks family, who were among the first settlers in the area. The town has a population of 5,051 as of the 2010 census.
History
Mocksville was founded in 1753 by the Mocks family, who were among the first settlers in the area. The town was originally known as Mocksville Crossroads, and was a stop on the stagecoach route between Salisbury and Winston-Salem. The town was officially incorporated in 1835.
During the Civil War, Mocksville was the site of a Confederate camp and a skirmish between Union and Confederate forces. The town was also the site of a major battle in 1865, when Union forces under General George Stoneman attacked the Confederate camp. The Union forces were eventually defeated, and the town was spared from destruction.
Geography
Mocksville is located in the Piedmont region of North Carolina, in the Yadkin Valley. The town is situated at the intersection of US Highway 64 and NC Highway 801. The town is surrounded by rolling hills and farmland, and is located about 25 miles north of Winston-Salem.
Economy
Mocksville’s economy is largely based on agriculture and manufacturing. The town is home to several large manufacturing companies, including Mocksville Furniture, Mocksville Textiles, and Mocksville Plastics. The town is also home to several small businesses, including restaurants, retail stores, and service providers.
Demographics
As of the 2010 census, Mocksville had a population of 5,051. The racial makeup of the town was 87.3% White, 8.3% African American, 0.7% Native American, 0.7% Asian, 0.1% Pacific Islander, 1.2% from other races, and 1.9% from two or more races. Hispanic or Latino of any race were 3.2% of the population.
The median income for a household in Mocksville was $37,917, and the median income for a family was $45,938. The per capita income for the town was $19,945. About 11.2% of families and 14.2% of the population were below the poverty line, including 19.2% of those under age 18 and 11.2% of those age 65 or over.
Conclusion
Mocksville, North Carolina is a small town located in Davie County, in the Piedmont region of the state. It was founded in 1753 and has a population of 5,051 as of the 2010 census. The town’s economy is largely based on agriculture and manufacturing, and it is home to several large companies and small businesses. The racial makeup of the town is 87.3% White, 8.3% African American, 0.7% Native American, 0.7% Asian, 0.1% Pacific Islander, 1.2% from other races, and 1.9% from two or more races. The median income for a household in Mocksville was $37,917, and the median income for a family was $45,938.
Common Questions
What is Per Capita Income in Mocksville?
Per Capita income in Mocksville is $27,804.
What is the Median Family Income in Mocksville?
Median Family Income in Mocksville is $76,161.
What is the Median Household income in Mocksville?
Median Household Income in Mocksville is $46,553.
What is Income or Wage Gap in Mocksville?
Income or Wage Gap in Mocksville is 49.4%.
Women in Mocksville earn 50.6 cents for every dollar earned by a man.
What is Family Income Deficit in Mocksville?
Family Income Deficit in Mocksville is $17,845.
Families that are below poverty line in Mocksville earn $17,845 less on average than the poverty threshold level.
What is Inequality or Gini Index in Mocksville?
Inequality or Gini Index in Mocksville is 0.45.
What is the Total Population of Mocksville?
Total Population of Mocksville is 5,908.
What is the Total Male Population of Mocksville?
Total Male Population of Mocksville is 2,886.
What is the Total Female Population of Mocksville?
Total Female Population of Mocksville is 3,022.
What is the Ratio of Males per 100 Females in Mocksville?
There are 95.50 Males per 100 Females in Mocksville.
What is the Ratio of Females per 100 Males in Mocksville?
There are 104.71 Females per 100 Males in Mocksville.
What is the Median Population Age in Mocksville?
Median Population Age in Mocksville is 34.2 Years.
What is the Average Family Size in Mocksville
Average Family Size in Mocksville is 3.8 People.
What is the Average Household Size in Mocksville
Average Household Size in Mocksville is 2.6 People.
How Large is the Labor Force in Mocksville?
There are 2,895 People in the Labor Forcein in Mocksville.
What is the Percentage of People in the Labor Force in Mocksville?
62.6% of People are in the Labor Force in Mocksville.
What is the Unemployment Rate in Mocksville?
Unemployment Rate in Mocksville is 5.9%.