Lenoir, NC Map & Demographics
Lenoir Map
Lenoir Overview
$25,697
PER CAPITA INCOME
$65,259
AVG FAMILY INCOME
$44,802
AVG HOUSEHOLD INCOME
18.9%
WAGE / INCOME GAP [ % ]
81.1¢/ $1
WAGE / INCOME GAP [ $ ]
$12,608
FAMILY INCOME DEFICIT
0.43
INEQUALITY / GINI INDEX
18,301
TOTAL POPULATION
8,251
MALE POPULATION
10,050
FEMALE POPULATION
82.10
MALES / 100 FEMALES
121.80
FEMALES / 100 MALES
43.2
MEDIAN AGE
3.1
AVG FAMILY SIZE
2.3
AVG HOUSEHOLD SIZE
8,069
LABOR FORCE [ PEOPLE ]
53.9%
PERCENT IN LABOR FORCE
6.8%
UNEMPLOYMENT RATE
Lenoir Zip Codes
Lenoir Area Codes
Income in Lenoir
Income Overview in Lenoir
Per Capita Income in Lenoir is $25,697, while median incomes of families and households are $65,259 and $44,802 respectively.
| Characteristic | Number | Measure |
| Per Capita Income | 18,301 | $25,697 |
| Median Family Income | 4,468 | $65,259 |
| Mean Family Income | 4,468 | $75,490 |
| Median Household Income | 7,612 | $44,802 |
| Mean Household Income | 7,612 | $59,582 |
| Income Deficit | 4,468 | $12,608 |
| Wage / Income Gap (%) | 18,301 | 18.88% |
| Wage / Income Gap ($) | 18,301 | 81.12¢ per $1 |
| Gini / Inequality Index | 18,301 | 0.43 |
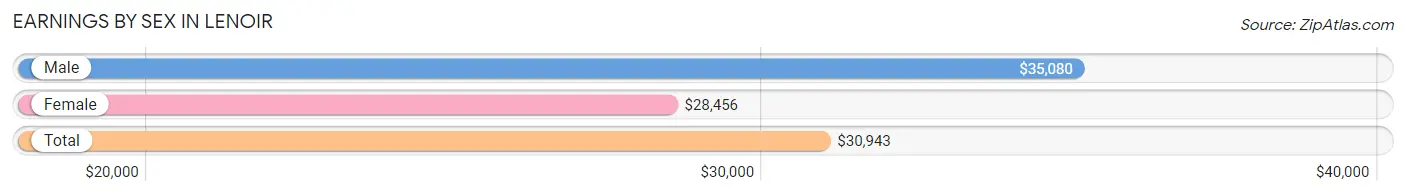
Earnings by Sex in Lenoir
Average Earnings in Lenoir are $30,943, $35,080 for men and $28,456 for women, a difference of 18.9%.
| Sex | Number | Average Earnings |
| Male | 4,295 (50.4%) | $35,080 |
| Female | 4,234 (49.6%) | $28,456 |
| Total | 8,529 (100.0%) | $30,943 |
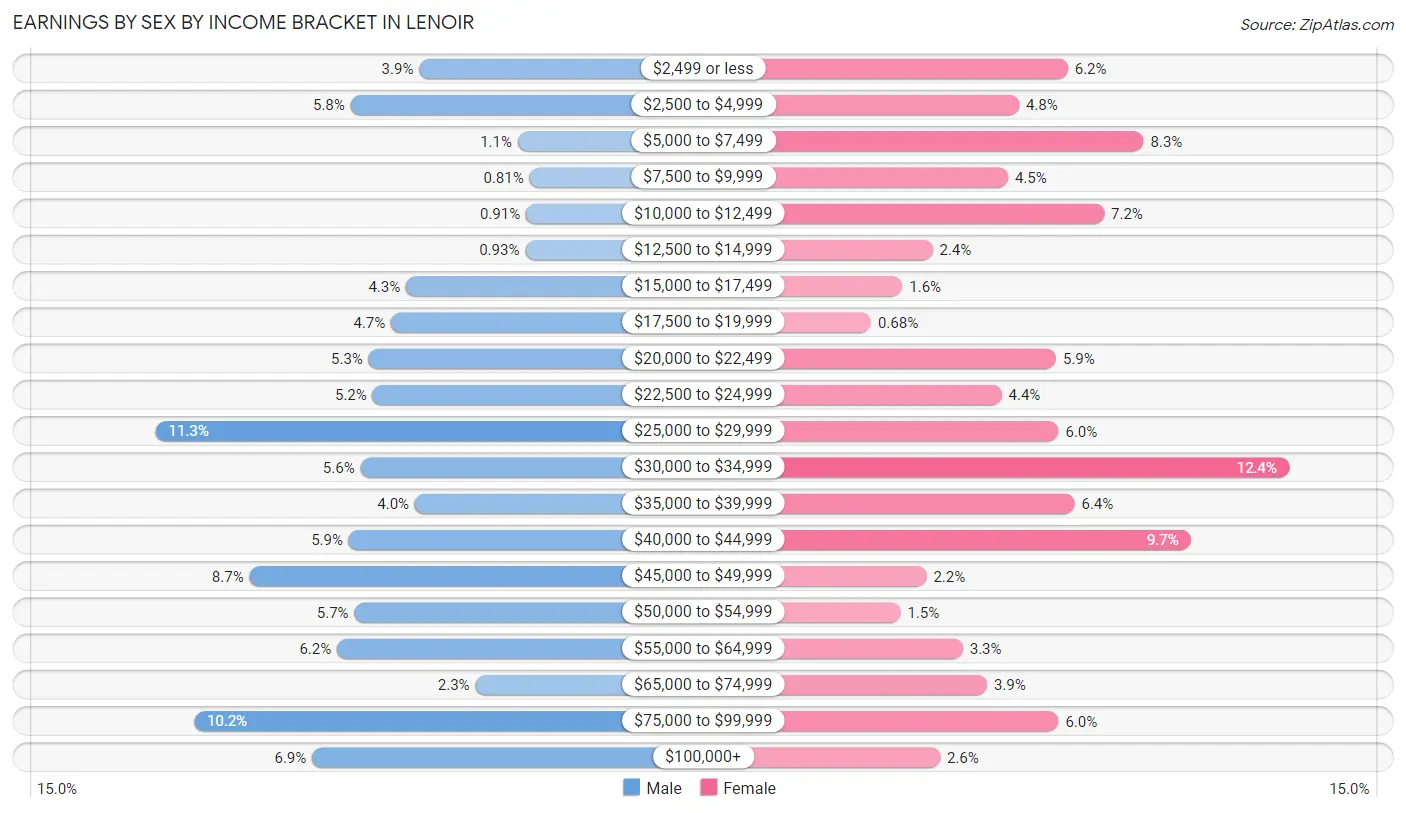
Earnings by Sex by Income Bracket in Lenoir
The most common earnings brackets in Lenoir are $25,000 to $29,999 for men (486 | 11.3%) and $30,000 to $34,999 for women (526 | 12.4%).
| Income | Male | Female |
| $2,499 or less | 168 (3.9%) | 263 (6.2%) |
| $2,500 to $4,999 | 251 (5.8%) | 205 (4.8%) |
| $5,000 to $7,499 | 49 (1.1%) | 353 (8.3%) |
| $7,500 to $9,999 | 35 (0.8%) | 192 (4.5%) |
| $10,000 to $12,499 | 39 (0.9%) | 306 (7.2%) |
| $12,500 to $14,999 | 40 (0.9%) | 102 (2.4%) |
| $15,000 to $17,499 | 184 (4.3%) | 66 (1.6%) |
| $17,500 to $19,999 | 202 (4.7%) | 29 (0.7%) |
| $20,000 to $22,499 | 229 (5.3%) | 249 (5.9%) |
| $22,500 to $24,999 | 224 (5.2%) | 184 (4.3%) |
| $25,000 to $29,999 | 486 (11.3%) | 252 (5.9%) |
| $30,000 to $34,999 | 239 (5.6%) | 526 (12.4%) |
| $35,000 to $39,999 | 173 (4.0%) | 271 (6.4%) |
| $40,000 to $44,999 | 253 (5.9%) | 409 (9.7%) |
| $45,000 to $49,999 | 373 (8.7%) | 95 (2.2%) |
| $50,000 to $54,999 | 246 (5.7%) | 64 (1.5%) |
| $55,000 to $64,999 | 267 (6.2%) | 138 (3.3%) |
| $65,000 to $74,999 | 100 (2.3%) | 167 (3.9%) |
| $75,000 to $99,999 | 440 (10.2%) | 252 (5.9%) |
| $100,000+ | 297 (6.9%) | 111 (2.6%) |
| Total | 4,295 (100.0%) | 4,234 (100.0%) |
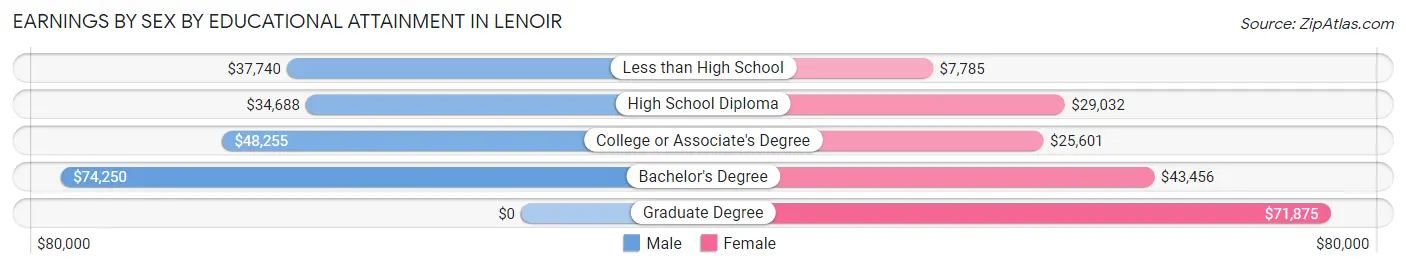
Earnings by Sex by Educational Attainment in Lenoir
Average earnings in Lenoir are $43,924 for men and $31,141 for women, a difference of 29.1%. Men with an educational attainment of bachelor's degree enjoy the highest average annual earnings of $74,250, while those with high school diploma education earn the least with $34,688. Women with an educational attainment of graduate degree earn the most with the average annual earnings of $71,875, while those with less than high school education have the smallest earnings of $7,785.
| Educational Attainment | Male Income | Female Income |
| Less than High School | $37,740 | $7,785 |
| High School Diploma | $34,688 | $29,032 |
| College or Associate's Degree | $48,255 | $25,601 |
| Bachelor's Degree | $74,250 | $43,456 |
| Graduate Degree | - | - |
| Total | $43,924 | $31,141 |
Family Income in Lenoir
Family Income Brackets in Lenoir
According to the Lenoir family income data, there are 1,023 families falling into the $50,000 to $74,999 income range, which is the most common income bracket and makes up 22.9% of all families. Conversely, the $10,000 to $14,999 income bracket is the least frequent group with only 143 families (3.2%) belonging to this category.
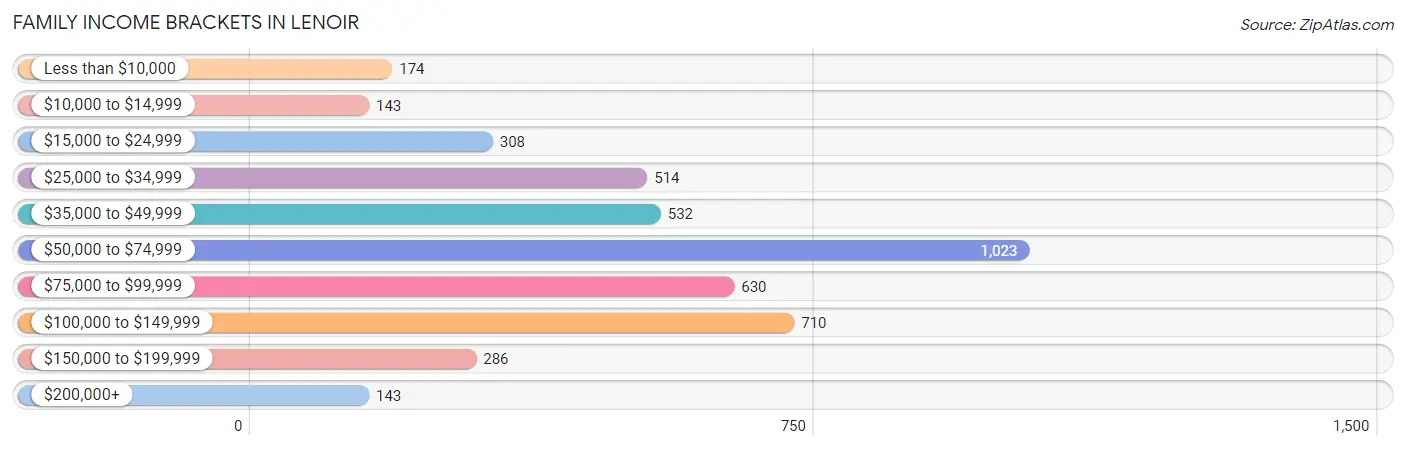
| Income Bracket | # Families | % Families |
| Less than $10,000 | 174 | 3.9% |
| $10,000 to $14,999 | 143 | 3.2% |
| $15,000 to $24,999 | 308 | 6.9% |
| $25,000 to $34,999 | 514 | 11.5% |
| $35,000 to $49,999 | 532 | 11.9% |
| $50,000 to $74,999 | 1,023 | 22.9% |
| $75,000 to $99,999 | 630 | 14.1% |
| $100,000 to $149,999 | 710 | 15.9% |
| $150,000 to $199,999 | 286 | 6.4% |
| $200,000+ | 143 | 3.2% |
Family Income by Famaliy Size in Lenoir
7+ person families (118 | 2.6%) account for the highest median family income in Lenoir with $118,173 per family, while 2-person families (2,363 | 52.9%) have the highest median income of $28,966 per family member.
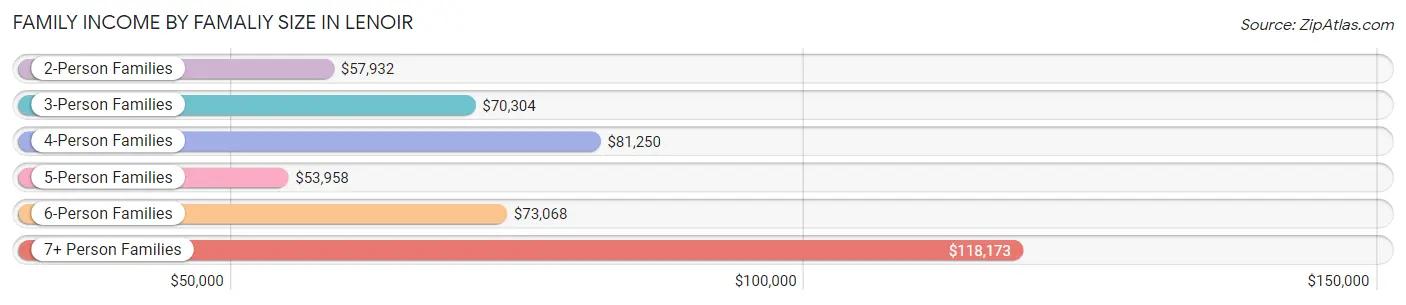
| Income Bracket | # Families | Median Income |
| 2-Person Families | 2,363 (52.9%) | $57,932 |
| 3-Person Families | 824 (18.4%) | $70,304 |
| 4-Person Families | 786 (17.6%) | $81,250 |
| 5-Person Families | 312 (7.0%) | $53,958 |
| 6-Person Families | 65 (1.5%) | $73,068 |
| 7+ Person Families | 118 (2.6%) | $118,173 |
| Total | 4,468 (100.0%) | $65,259 |
Family Income by Number of Earners in Lenoir
The median family income in Lenoir is $65,259, with families comprising 2 earners (1,807) having the highest median family income of $82,784, while families with 1 earner (1,644) have the lowest median family income of $42,227, accounting for 40.4% and 36.8% of families, respectively.
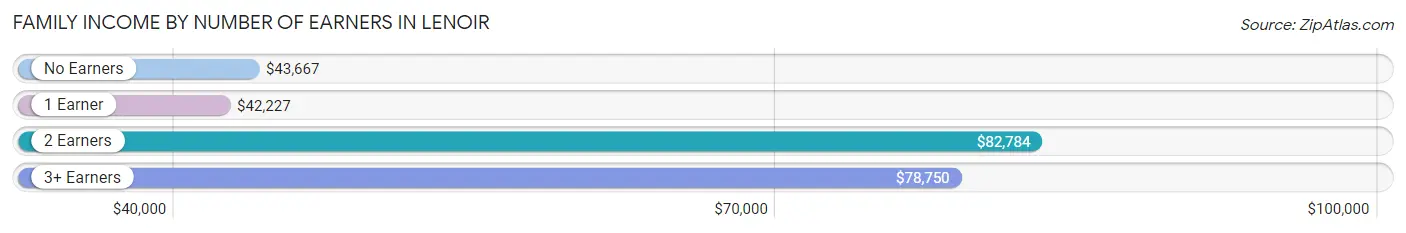
| Number of Earners | # Families | Median Income |
| No Earners | 764 (17.1%) | $43,667 |
| 1 Earner | 1,644 (36.8%) | $42,227 |
| 2 Earners | 1,807 (40.4%) | $82,784 |
| 3+ Earners | 253 (5.7%) | $78,750 |
| Total | 4,468 (100.0%) | $65,259 |
Household Income in Lenoir
Household Income Brackets in Lenoir
With 1,500 households falling in the category, the $50,000 to $74,999 income range is the most frequent in Lenoir, accounting for 19.7% of all households. In contrast, only 145 households (1.9%) fall into the $200,000+ income bracket, making it the least populous group.
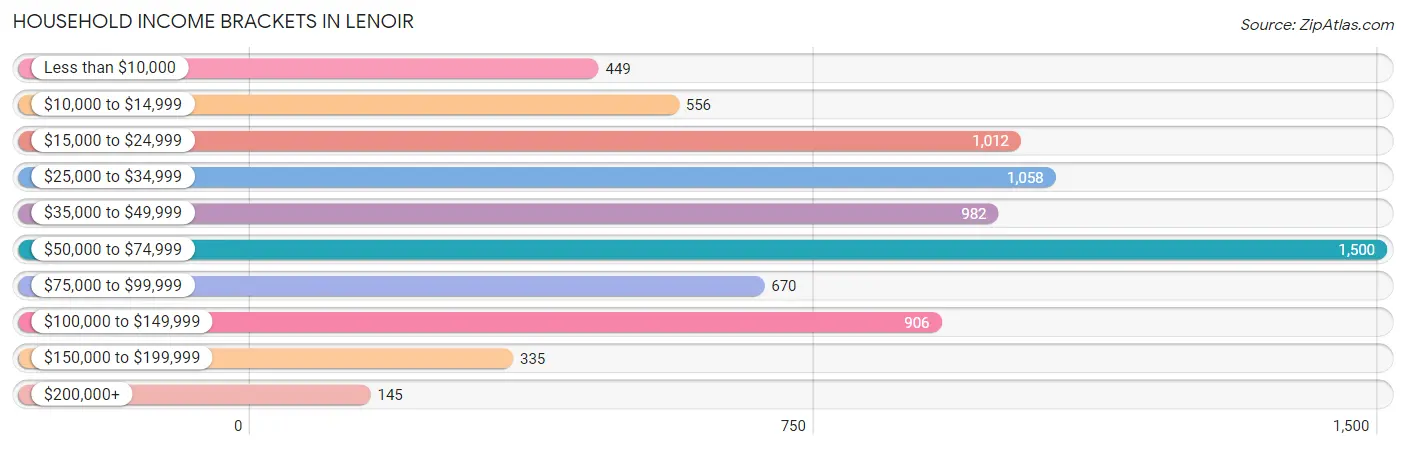
| Income Bracket | # Households | % Households |
| Less than $10,000 | 449 | 5.9% |
| $10,000 to $14,999 | 556 | 7.3% |
| $15,000 to $24,999 | 1,012 | 13.3% |
| $25,000 to $34,999 | 1,058 | 13.9% |
| $35,000 to $49,999 | 982 | 12.9% |
| $50,000 to $74,999 | 1,500 | 19.7% |
| $75,000 to $99,999 | 670 | 8.8% |
| $100,000 to $149,999 | 906 | 11.9% |
| $150,000 to $199,999 | 335 | 4.4% |
| $200,000+ | 145 | 1.9% |
Household Income by Householder Age in Lenoir
The median household income in Lenoir is $44,802, with the highest median household income of $66,236 found in the 45 to 64 years age bracket for the primary householder. A total of 2,877 households (37.8%) fall into this category. Meanwhile, the 65+ years age bracket for the primary householder has the lowest median household income of $29,766, with 2,578 households (33.9%) in this group.
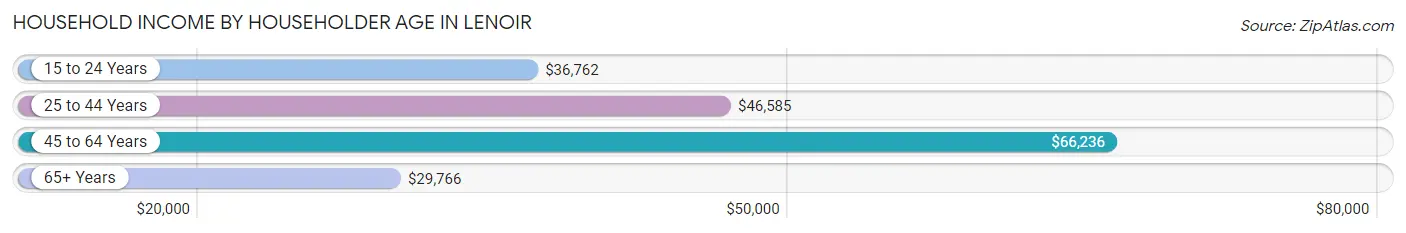
| Income Bracket | # Households | Median Income |
| 15 to 24 Years | 244 (3.2%) | $36,762 |
| 25 to 44 Years | 1,913 (25.1%) | $46,585 |
| 45 to 64 Years | 2,877 (37.8%) | $66,236 |
| 65+ Years | 2,578 (33.9%) | $29,766 |
| Total | 7,612 (100.0%) | $44,802 |
Poverty in Lenoir
Income Below Poverty by Sex and Age in Lenoir
With 15.9% poverty level for males and 16.1% for females among the residents of Lenoir, under 5 year old males and 5 year old females are the most vulnerable to poverty, with 266 males (39.6%) and 23 females (37.7%) in their respective age groups living below the poverty level.
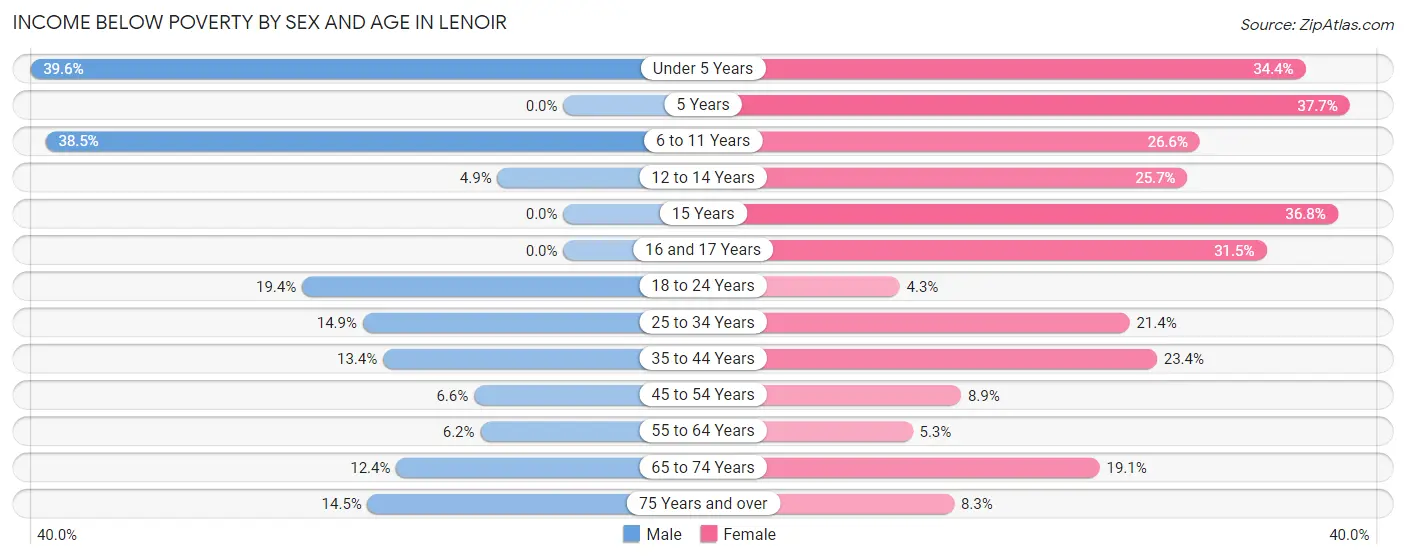
| Age Bracket | Male | Female |
| Under 5 Years | 266 (39.6%) | 137 (34.4%) |
| 5 Years | 0 (0.0%) | 23 (37.7%) |
| 6 to 11 Years | 248 (38.5%) | 164 (26.6%) |
| 12 to 14 Years | 13 (4.9%) | 87 (25.7%) |
| 15 Years | 0 (0.0%) | 53 (36.8%) |
| 16 and 17 Years | 0 (0.0%) | 75 (31.5%) |
| 18 to 24 Years | 193 (19.4%) | 40 (4.3%) |
| 25 to 34 Years | 137 (14.9%) | 220 (21.4%) |
| 35 to 44 Years | 111 (13.4%) | 225 (23.4%) |
| 45 to 54 Years | 64 (6.6%) | 128 (8.8%) |
| 55 to 64 Years | 74 (6.2%) | 62 (5.2%) |
| 65 to 74 Years | 89 (12.4%) | 286 (19.1%) |
| 75 Years and over | 69 (14.5%) | 81 (8.3%) |
| Total | 1,264 (15.9%) | 1,581 (16.1%) |
Income Above Poverty by Sex and Age in Lenoir
According to the poverty statistics in Lenoir, males aged 5 years and females aged 18 to 24 years are the age groups that are most secure financially, with 100.0% of males and 95.7% of females in these age groups living above the poverty line.
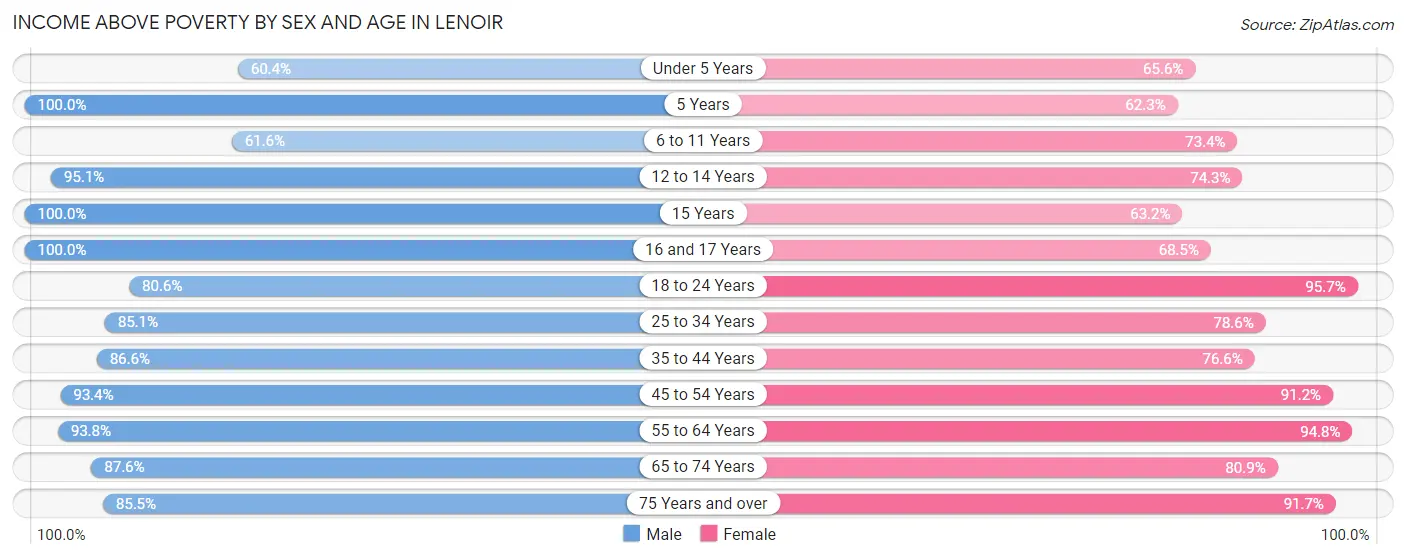
| Age Bracket | Male | Female |
| Under 5 Years | 406 (60.4%) | 261 (65.6%) |
| 5 Years | 48 (100.0%) | 38 (62.3%) |
| 6 to 11 Years | 397 (61.6%) | 453 (73.4%) |
| 12 to 14 Years | 253 (95.1%) | 252 (74.3%) |
| 15 Years | 68 (100.0%) | 91 (63.2%) |
| 16 and 17 Years | 167 (100.0%) | 163 (68.5%) |
| 18 to 24 Years | 802 (80.6%) | 893 (95.7%) |
| 25 to 34 Years | 783 (85.1%) | 810 (78.6%) |
| 35 to 44 Years | 718 (86.6%) | 737 (76.6%) |
| 45 to 54 Years | 901 (93.4%) | 1,319 (91.1%) |
| 55 to 64 Years | 1,128 (93.8%) | 1,119 (94.8%) |
| 65 to 74 Years | 629 (87.6%) | 1,208 (80.9%) |
| 75 Years and over | 406 (85.5%) | 891 (91.7%) |
| Total | 6,706 (84.1%) | 8,235 (83.9%) |
Income Below Poverty Among Married-Couple Families in Lenoir
The poverty statistics for married-couple families in Lenoir show that 4.7% or 129 of the total 2,768 families live below the poverty line. Families with 5 or more children have the highest poverty rate of 35.0%, comprising of 28 families. On the other hand, families with no children have the lowest poverty rate of 1.9%, which includes 33 families.
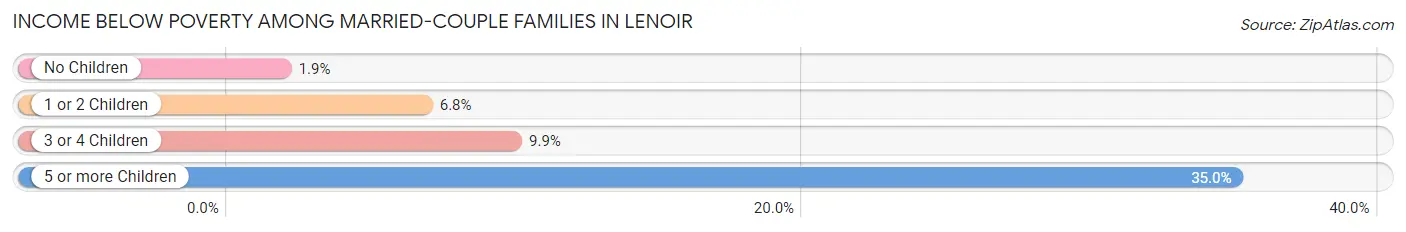
| Children | Above Poverty | Below Poverty |
| No Children | 1,735 (98.1%) | 33 (1.9%) |
| 1 or 2 Children | 688 (93.2%) | 50 (6.8%) |
| 3 or 4 Children | 164 (90.1%) | 18 (9.9%) |
| 5 or more Children | 52 (65.0%) | 28 (35.0%) |
| Total | 2,639 (95.3%) | 129 (4.7%) |
Income Below Poverty Among Single-Parent Households in Lenoir
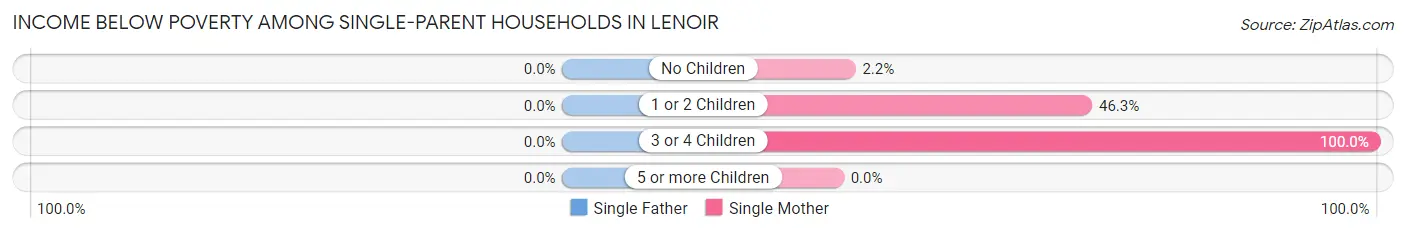
| Children | Single Father | Single Mother |
| No Children | 0 (0.0%) | 15 (2.2%) |
| 1 or 2 Children | 0 (0.0%) | 297 (46.3%) |
| 3 or 4 Children | 0 (0.0%) | 58 (100.0%) |
| 5 or more Children | 0 (0.0%) | 0 (0.0%) |
| Total | 0 (0.0%) | 370 (26.6%) |
Income Below Poverty Among Married-Couple vs Single-Parent Households in Lenoir
The poverty data for Lenoir shows that 129 of the married-couple family households (4.7%) and 370 of the single-parent households (21.8%) are living below the poverty level. Within the married-couple family households, those with 5 or more children have the highest poverty rate, with 28 households (35.0%) falling below the poverty line. Among the single-parent households, those with 3 or 4 children have the highest poverty rate, with 58 household (85.3%) living below poverty.
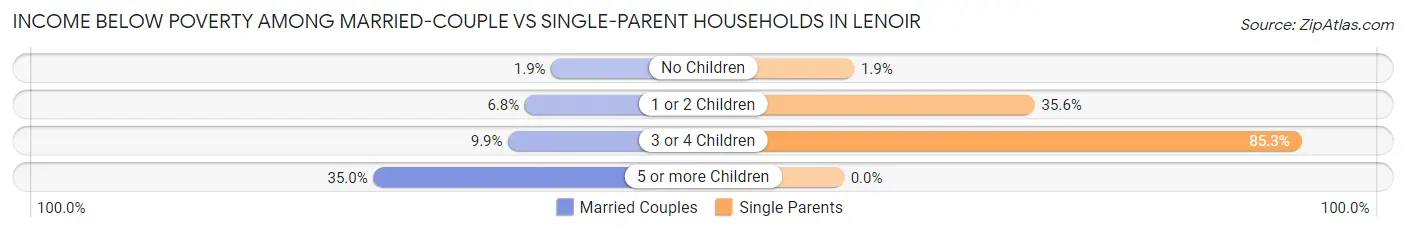
| Children | Married-Couple Families | Single-Parent Households |
| No Children | 33 (1.9%) | 15 (1.9%) |
| 1 or 2 Children | 50 (6.8%) | 297 (35.6%) |
| 3 or 4 Children | 18 (9.9%) | 58 (85.3%) |
| 5 or more Children | 28 (35.0%) | 0 (0.0%) |
| Total | 129 (4.7%) | 370 (21.8%) |
Race in Lenoir
The most populous races in Lenoir are White / Caucasian (13,182 | 72.0%), Black / African American (2,578 | 14.1%), and Hispanic or Latino (2,182 | 11.9%).
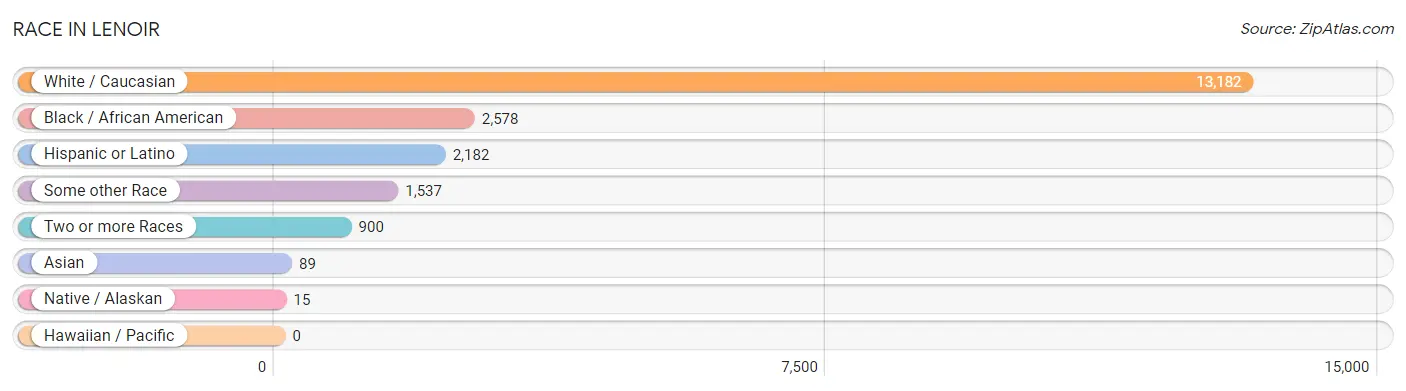
| Race | # Population | % Population |
| Asian | 89 | 0.5% |
| Black / African American | 2,578 | 14.1% |
| Hawaiian / Pacific | 0 | 0.0% |
| Hispanic or Latino | 2,182 | 11.9% |
| Native / Alaskan | 15 | 0.1% |
| White / Caucasian | 13,182 | 72.0% |
| Two or more Races | 900 | 4.9% |
| Some other Race | 1,537 | 8.4% |
| Total | 18,301 | 100.0% |
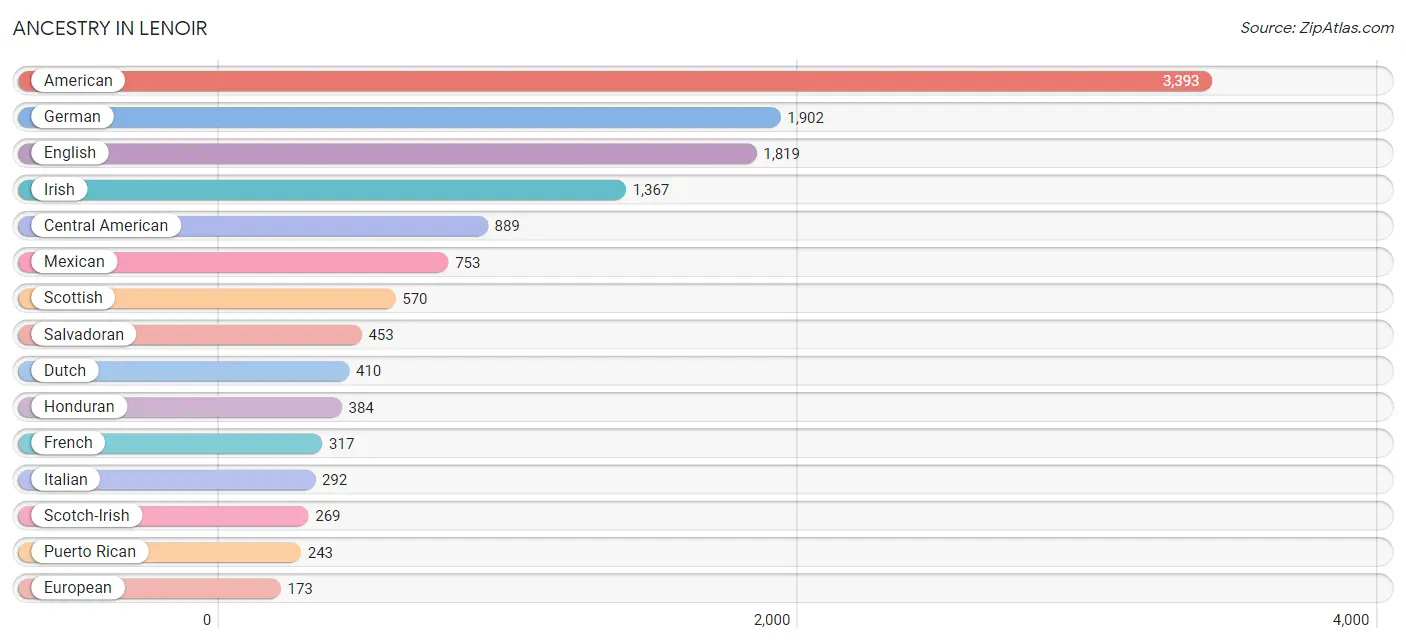
Ancestry in Lenoir
The most populous ancestries reported in Lenoir are American (3,393 | 18.5%), German (1,902 | 10.4%), English (1,819 | 9.9%), Irish (1,367 | 7.5%), and Central American (889 | 4.9%), together accounting for 51.2% of all Lenoir residents.
| Ancestry | # Population | % Population |
| African | 81 | 0.4% |
| American | 3,393 | 18.5% |
| Australian | 9 | 0.1% |
| Belgian | 36 | 0.2% |
| Blackfeet | 33 | 0.2% |
| British | 24 | 0.1% |
| Burmese | 58 | 0.3% |
| Cambodian | 58 | 0.3% |
| Canadian | 44 | 0.2% |
| Central American | 889 | 4.9% |
| Cherokee | 6 | 0.0% |
| Colombian | 139 | 0.8% |
| Croatian | 11 | 0.1% |
| Danish | 13 | 0.1% |
| Dutch | 410 | 2.2% |
| English | 1,819 | 9.9% |
| European | 173 | 0.9% |
| French | 317 | 1.7% |
| French Canadian | 15 | 0.1% |
| German | 1,902 | 10.4% |
| Guatemalan | 52 | 0.3% |
| Honduran | 384 | 2.1% |
| Indian (Asian) | 83 | 0.4% |
| Irish | 1,367 | 7.5% |
| Italian | 292 | 1.6% |
| Jamaican | 51 | 0.3% |
| Korean | 70 | 0.4% |
| Mexican | 753 | 4.1% |
| Nigerian | 9 | 0.1% |
| Northern European | 18 | 0.1% |
| Norwegian | 46 | 0.3% |
| Polish | 8 | 0.0% |
| Puerto Rican | 243 | 1.3% |
| Russian | 8 | 0.0% |
| Salvadoran | 453 | 2.5% |
| Scotch-Irish | 269 | 1.5% |
| Scottish | 570 | 3.1% |
| South American | 157 | 0.9% |
| South American Indian | 41 | 0.2% |
| Spaniard | 38 | 0.2% |
| Spanish | 39 | 0.2% |
| Subsaharan African | 90 | 0.5% |
| Swedish | 106 | 0.6% |
| Swiss | 10 | 0.1% |
| Thai | 55 | 0.3% |
| Ukrainian | 18 | 0.1% |
| Venezuelan | 18 | 0.1% |
| Welsh | 43 | 0.2% | View All 48 Rows |
Immigrants in Lenoir
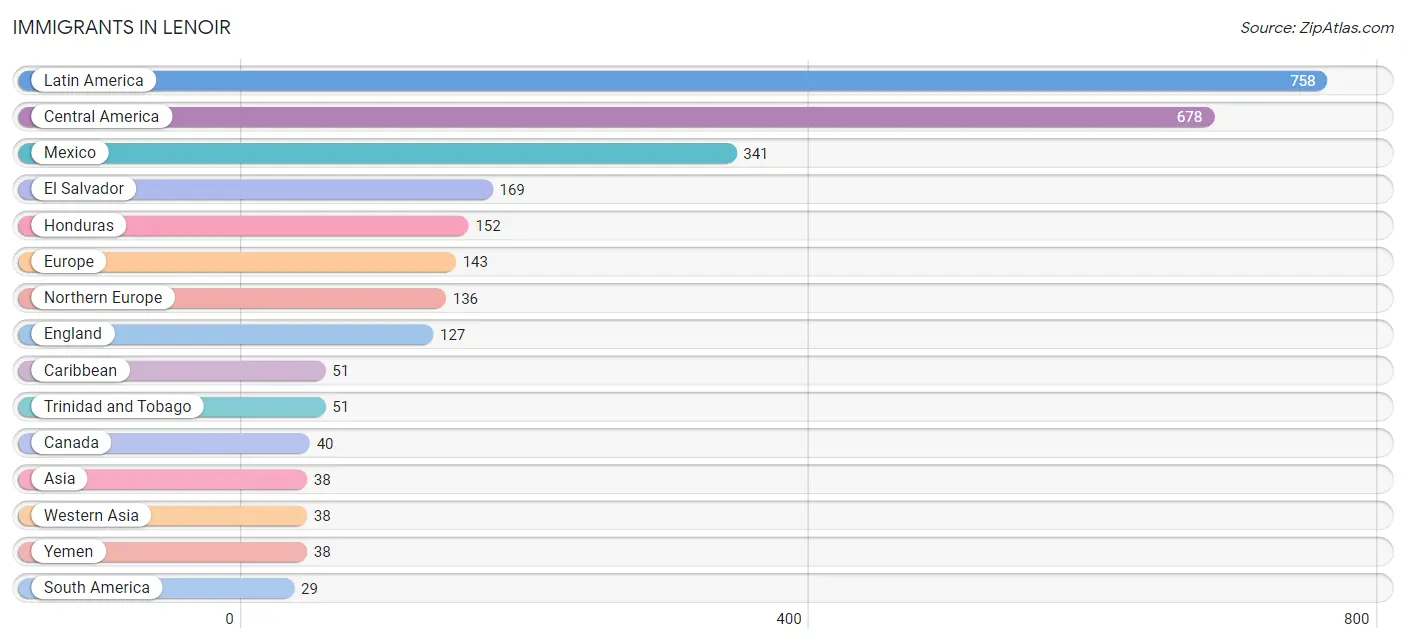
The most numerous immigrant groups reported in Lenoir came from Latin America (758 | 4.1%), Central America (678 | 3.7%), Mexico (341 | 1.9%), El Salvador (169 | 0.9%), and Honduras (152 | 0.8%), together accounting for 11.5% of all Lenoir residents.
| Immigration Origin | # Population | % Population |
| Africa | 9 | 0.1% |
| Asia | 38 | 0.2% |
| Canada | 40 | 0.2% |
| Caribbean | 51 | 0.3% |
| Central America | 678 | 3.7% |
| Colombia | 11 | 0.1% |
| El Salvador | 169 | 0.9% |
| England | 127 | 0.7% |
| Europe | 143 | 0.8% |
| Germany | 7 | 0.0% |
| Guatemala | 16 | 0.1% |
| Honduras | 152 | 0.8% |
| Latin America | 758 | 4.1% |
| Mexico | 341 | 1.9% |
| Nigeria | 9 | 0.1% |
| Northern Europe | 136 | 0.7% |
| South America | 29 | 0.2% |
| Sweden | 9 | 0.1% |
| Trinidad and Tobago | 51 | 0.3% |
| Venezuela | 18 | 0.1% |
| Western Africa | 9 | 0.1% |
| Western Asia | 38 | 0.2% |
| Western Europe | 7 | 0.0% |
| Yemen | 38 | 0.2% | View All 24 Rows |
Sex and Age in Lenoir
Sex and Age in Lenoir
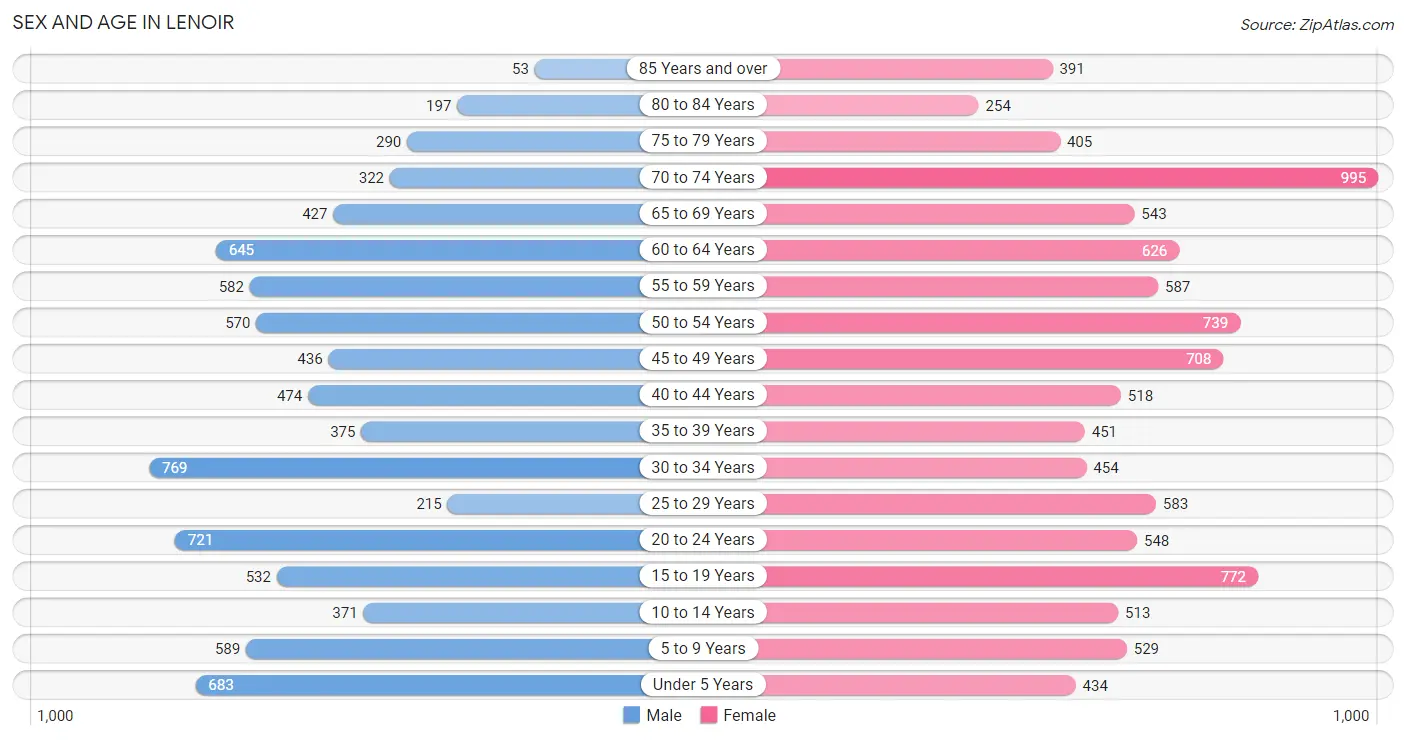
The most populous age groups in Lenoir are 30 to 34 Years (769 | 9.3%) for men and 70 to 74 Years (995 | 9.9%) for women.
| Age Bracket | Male | Female |
| Under 5 Years | 683 (8.3%) | 434 (4.3%) |
| 5 to 9 Years | 589 (7.1%) | 529 (5.3%) |
| 10 to 14 Years | 371 (4.5%) | 513 (5.1%) |
| 15 to 19 Years | 532 (6.5%) | 772 (7.7%) |
| 20 to 24 Years | 721 (8.7%) | 548 (5.4%) |
| 25 to 29 Years | 215 (2.6%) | 583 (5.8%) |
| 30 to 34 Years | 769 (9.3%) | 454 (4.5%) |
| 35 to 39 Years | 375 (4.5%) | 451 (4.5%) |
| 40 to 44 Years | 474 (5.7%) | 518 (5.1%) |
| 45 to 49 Years | 436 (5.3%) | 708 (7.0%) |
| 50 to 54 Years | 570 (6.9%) | 739 (7.3%) |
| 55 to 59 Years | 582 (7.0%) | 587 (5.8%) |
| 60 to 64 Years | 645 (7.8%) | 626 (6.2%) |
| 65 to 69 Years | 427 (5.2%) | 543 (5.4%) |
| 70 to 74 Years | 322 (3.9%) | 995 (9.9%) |
| 75 to 79 Years | 290 (3.5%) | 405 (4.0%) |
| 80 to 84 Years | 197 (2.4%) | 254 (2.5%) |
| 85 Years and over | 53 (0.6%) | 391 (3.9%) |
| Total | 8,251 (100.0%) | 10,050 (100.0%) |
Families and Households in Lenoir
Median Family Size in Lenoir
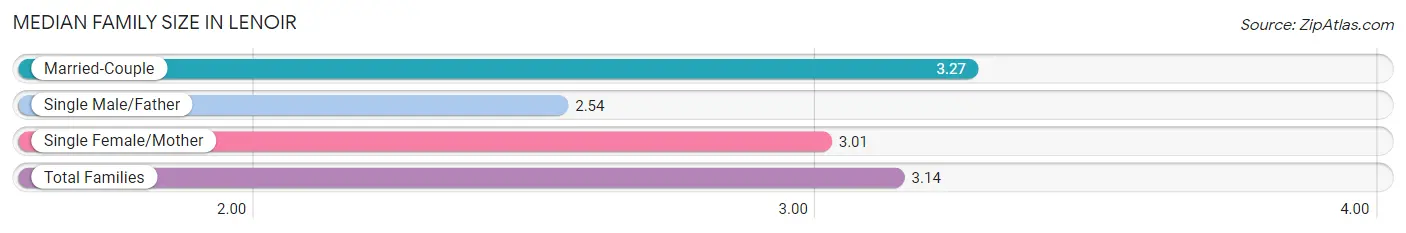
The median family size in Lenoir is 3.14 persons per family, with married-couple families (2,768 | 62.0%) accounting for the largest median family size of 3.27 persons per family. On the other hand, single male/father families (307 | 6.9%) represent the smallest median family size with 2.54 persons per family.
| Family Type | # Families | Family Size |
| Married-Couple | 2,768 (62.0%) | 3.27 |
| Single Male/Father | 307 (6.9%) | 2.54 |
| Single Female/Mother | 1,393 (31.2%) | 3.01 |
| Total Families | 4,468 (100.0%) | 3.14 |
Median Household Size in Lenoir
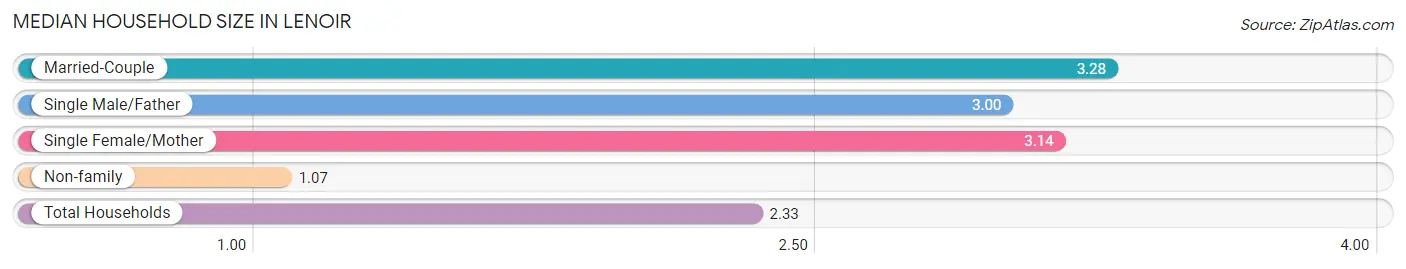
The median household size in Lenoir is 2.33 persons per household, with married-couple households (2,768 | 36.4%) accounting for the largest median household size of 3.28 persons per household. non-family households (3,144 | 41.3%) represent the smallest median household size with 1.07 persons per household.
| Household Type | # Households | Household Size |
| Married-Couple | 2,768 (36.4%) | 3.28 |
| Single Male/Father | 307 (4.0%) | 3.00 |
| Single Female/Mother | 1,393 (18.3%) | 3.14 |
| Non-family | 3,144 (41.3%) | 1.07 |
| Total Households | 7,612 (100.0%) | 2.33 |
Household Size by Marriage Status in Lenoir
Out of a total of 7,612 households in Lenoir, 4,468 (58.7%) are family households, while 3,144 (41.3%) are nonfamily households. The most numerous type of family households are 2-person households, comprising 2,273, and the most common type of nonfamily households are 1-person households, comprising 2,988.
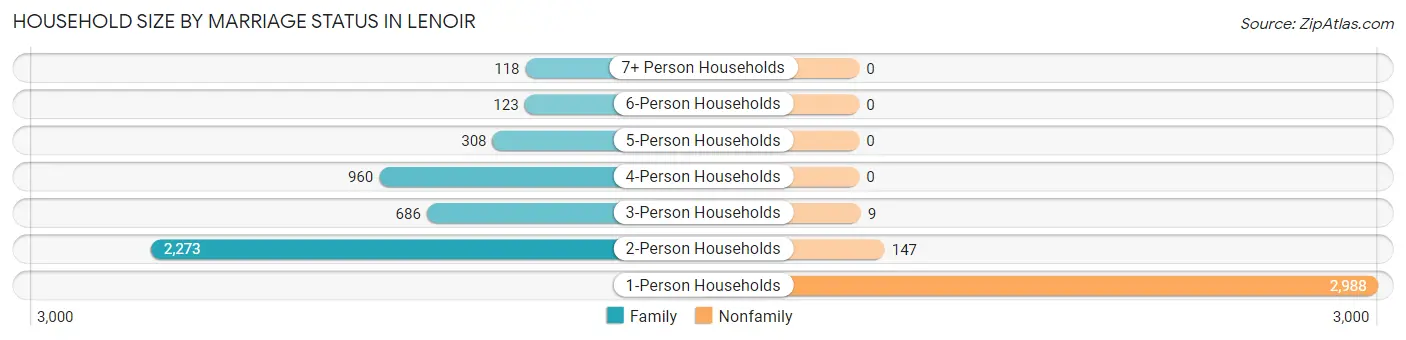
| Household Size | Family Households | Nonfamily Households |
| 1-Person Households | - | 2,988 (39.3%) |
| 2-Person Households | 2,273 (29.9%) | 147 (1.9%) |
| 3-Person Households | 686 (9.0%) | 9 (0.1%) |
| 4-Person Households | 960 (12.6%) | 0 (0.0%) |
| 5-Person Households | 308 (4.1%) | 0 (0.0%) |
| 6-Person Households | 123 (1.6%) | 0 (0.0%) |
| 7+ Person Households | 118 (1.5%) | 0 (0.0%) |
| Total | 4,468 (58.7%) | 3,144 (41.3%) |
Female Fertility in Lenoir
Fertility by Age in Lenoir
Average fertility rate in Lenoir is 52.0 births per 1,000 women. Women in the age bracket of 20 to 34 years have the highest fertility rate with 64.0 births per 1,000 women. Women in the age bracket of 35 to 50 years acount for 52.4% of all women with births.
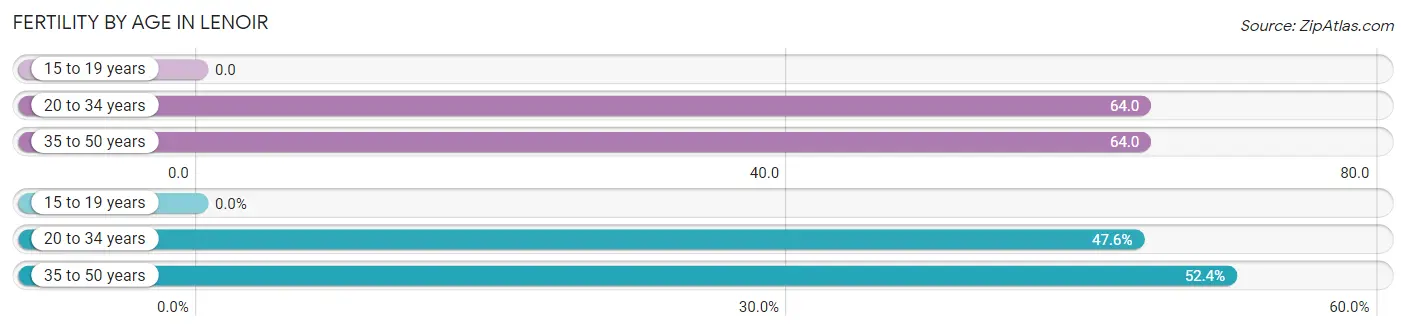
| Age Bracket | Women with Births | Births / 1,000 Women |
| 15 to 19 years | 0 (0.0%) | 0.0 |
| 20 to 34 years | 101 (47.6%) | 64.0 |
| 35 to 50 years | 111 (52.4%) | 64.0 |
| Total | 212 (100.0%) | 52.0 |
Fertility by Age by Marriage Status in Lenoir
42.0% of women with births (212) in Lenoir are married. The highest percentage of unmarried women with births falls into 35 to 50 years age bracket with 72.1% of them unmarried at the time of birth, while the lowest percentage of unmarried women with births belong to 20 to 34 years age bracket with 42.6% of them unmarried.
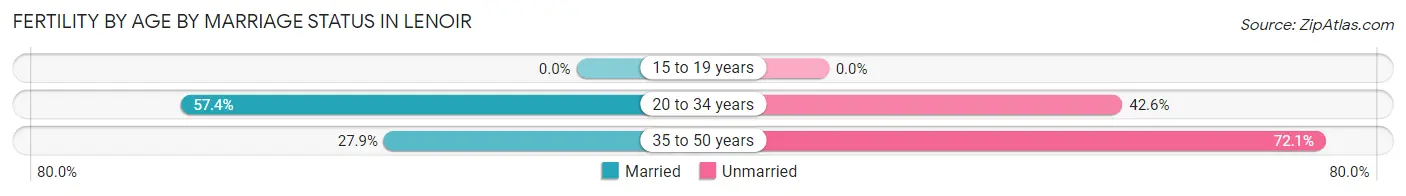
| Age Bracket | Married | Unmarried |
| 15 to 19 years | 0 (0.0%) | 0 (0.0%) |
| 20 to 34 years | 58 (57.4%) | 43 (42.6%) |
| 35 to 50 years | 31 (27.9%) | 80 (72.1%) |
| Total | 89 (42.0%) | 123 (58.0%) |
Fertility by Education in Lenoir
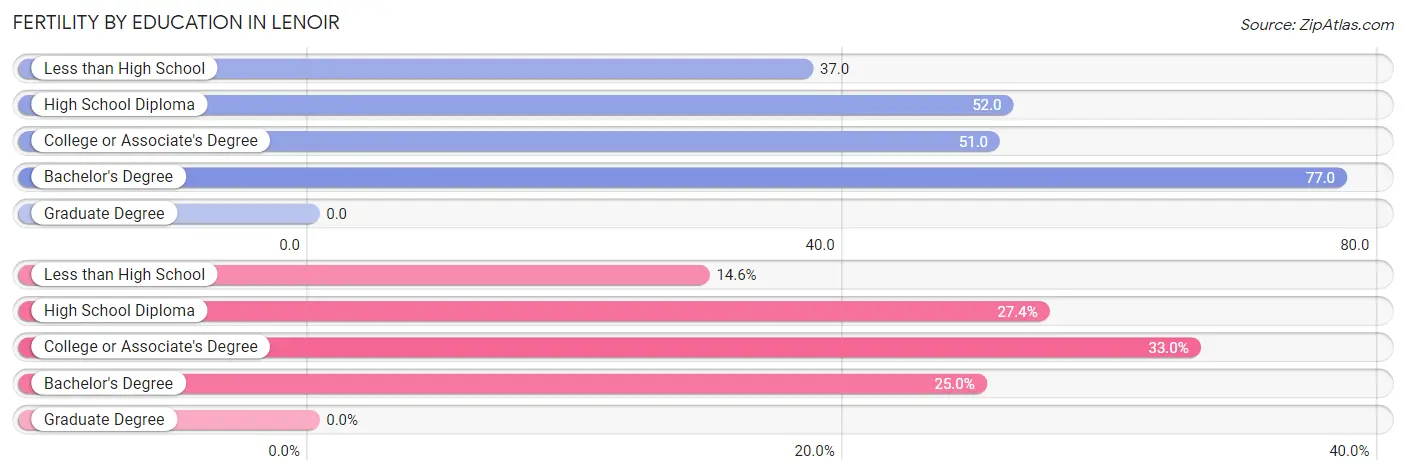
| Educational Attainment | Women with Births | Births / 1,000 Women |
| Less than High School | 31 (14.6%) | 37.0 |
| High School Diploma | 58 (27.4%) | 52.0 |
| College or Associate's Degree | 70 (33.0%) | 51.0 |
| Bachelor's Degree | 53 (25.0%) | 77.0 |
| Graduate Degree | 0 (0.0%) | 0.0 |
| Total | 212 (100.0%) | 52.0 |
Fertility by Education by Marriage Status in Lenoir
58.0% of women with births in Lenoir are unmarried. Women with the educational attainment of bachelor's degree are most likely to be married with 60.4% of them married at childbirth, while women with the educational attainment of college or associate's degree are least likely to be married with 84.3% of them unmarried at childbirth.
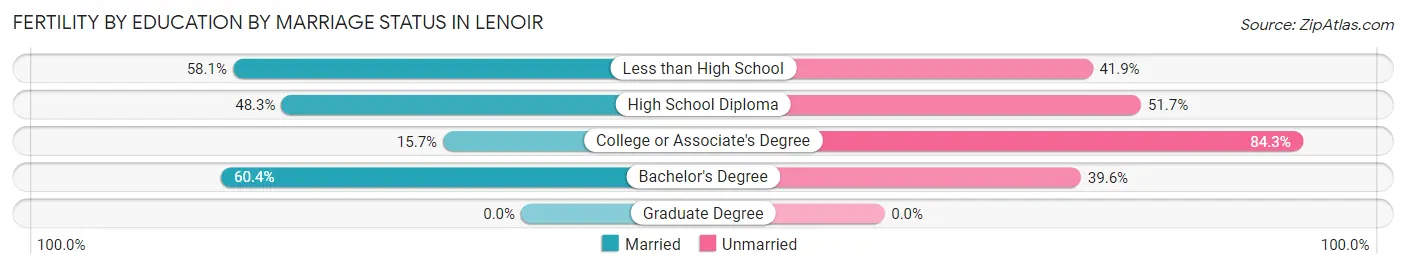
| Educational Attainment | Married | Unmarried |
| Less than High School | 18 (58.1%) | 13 (41.9%) |
| High School Diploma | 28 (48.3%) | 30 (51.7%) |
| College or Associate's Degree | 11 (15.7%) | 59 (84.3%) |
| Bachelor's Degree | 32 (60.4%) | 21 (39.6%) |
| Graduate Degree | 0 (0.0%) | 0 (0.0%) |
| Total | 89 (42.0%) | 123 (58.0%) |
Employment Characteristics in Lenoir
Employment by Class of Employer in Lenoir
Among the 7,227 employed individuals in Lenoir, private company employees (4,754 | 65.8%), not-for-profit organizations (718 | 9.9%), and self-employed (not incorporated) (476 | 6.6%) make up the most common classes of employment.
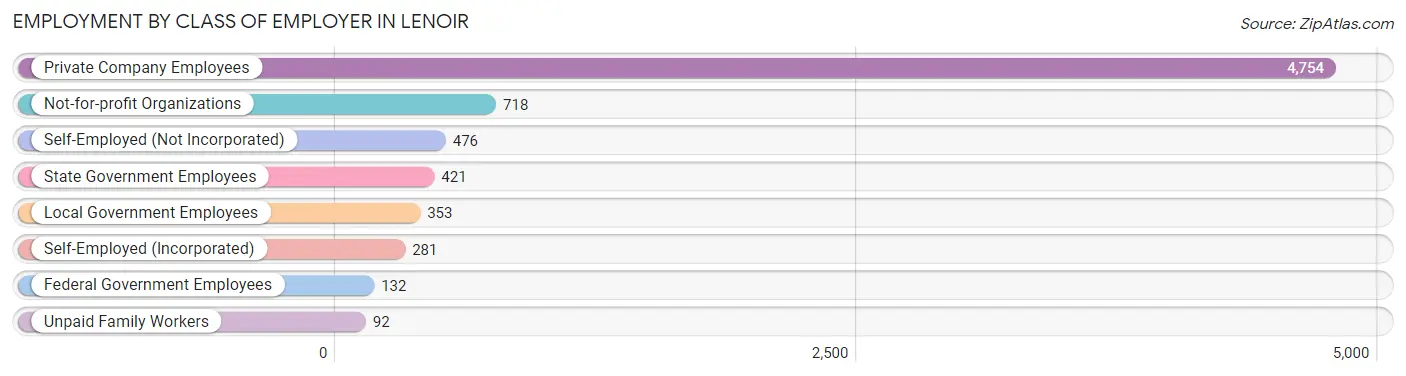
| Employer Class | # Employees | % Employees |
| Private Company Employees | 4,754 | 65.8% |
| Self-Employed (Incorporated) | 281 | 3.9% |
| Self-Employed (Not Incorporated) | 476 | 6.6% |
| Not-for-profit Organizations | 718 | 9.9% |
| Local Government Employees | 353 | 4.9% |
| State Government Employees | 421 | 5.8% |
| Federal Government Employees | 132 | 1.8% |
| Unpaid Family Workers | 92 | 1.3% |
| Total | 7,227 | 100.0% |
Employment Status by Age in Lenoir
According to the labor force statistics for Lenoir, out of the total population over 16 years of age (14,970), 53.9% or 8,069 individuals are in the labor force, with 6.8% or 549 of them unemployed. The age group with the highest labor force participation rate is 55 to 59 years, with 80.3% or 939 individuals in the labor force. Within the labor force, the 16 to 19 years age range has the highest percentage of unemployed individuals, with 32.5% or 190 of them being unemployed.
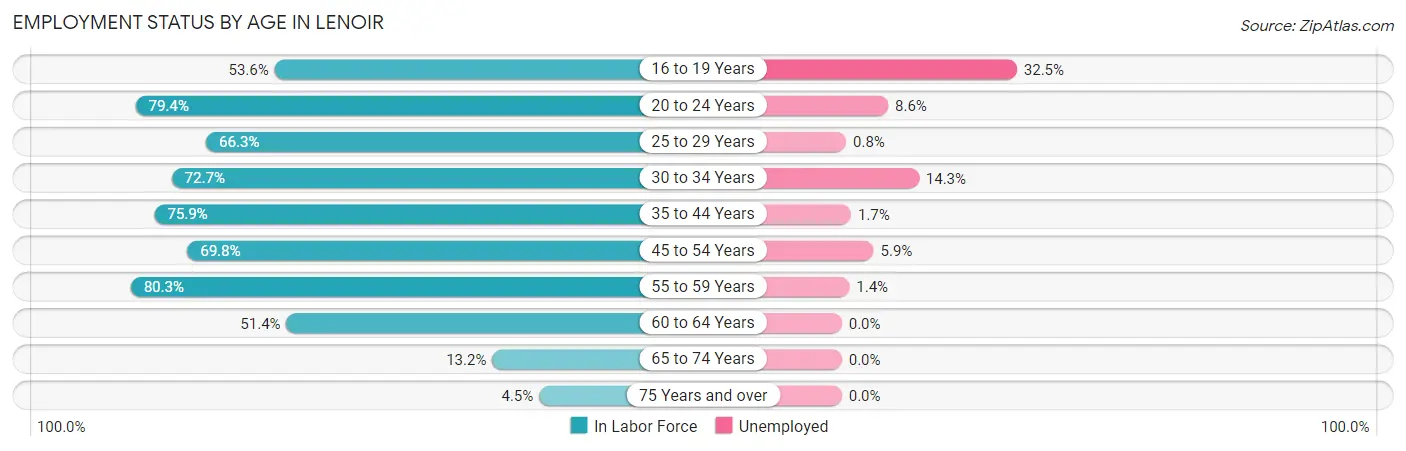
| Age Bracket | In Labor Force | Unemployed |
| 16 to 19 Years | 585 (53.6%) | 190 (32.5%) |
| 20 to 24 Years | 1,008 (79.4%) | 87 (8.6%) |
| 25 to 29 Years | 529 (66.3%) | 4 (0.8%) |
| 30 to 34 Years | 889 (72.7%) | 127 (14.3%) |
| 35 to 44 Years | 1,380 (75.9%) | 23 (1.7%) |
| 45 to 54 Years | 1,712 (69.8%) | 101 (5.9%) |
| 55 to 59 Years | 939 (80.3%) | 13 (1.4%) |
| 60 to 64 Years | 653 (51.4%) | 0 (0.0%) |
| 65 to 74 Years | 302 (13.2%) | 0 (0.0%) |
| 75 Years and over | 72 (4.5%) | 0 (0.0%) |
| Total | 8,069 (53.9%) | 549 (6.8%) |
Employment Status by Educational Attainment in Lenoir
According to labor force statistics for Lenoir, 69.9% of individuals (6,104) out of the total population between 25 and 64 years of age (8,732) are in the labor force, with 4.4% or 269 of them being unemployed. The group with the highest labor force participation rate are those with the educational attainment of bachelor's degree or higher, with 83.7% or 1,349 individuals in the labor force. Within the labor force, individuals with less than high school education have the highest percentage of unemployment, with 19.2% or 124 of them being unemployed.
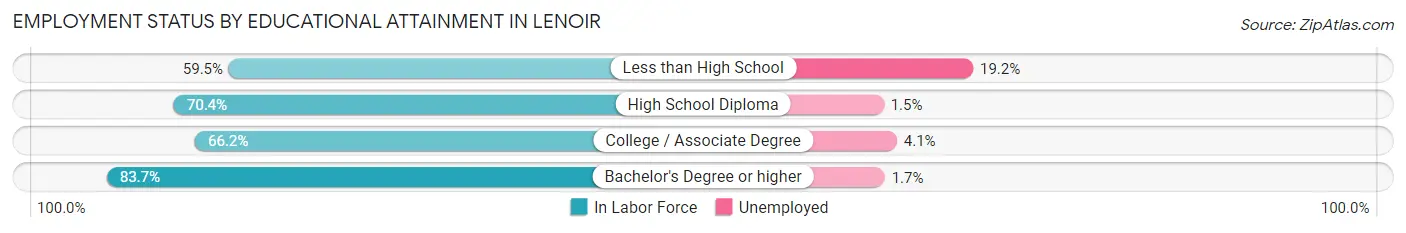
| Educational Attainment | In Labor Force | Unemployed |
| Less than High School | 646 (59.5%) | 208 (19.2%) |
| High School Diploma | 1,861 (70.4%) | 40 (1.5%) |
| College / Associate Degree | 2,245 (66.2%) | 139 (4.1%) |
| Bachelor's Degree or higher | 1,349 (83.7%) | 27 (1.7%) |
| Total | 6,104 (69.9%) | 384 (4.4%) |
Employment Occupations by Sex in Lenoir
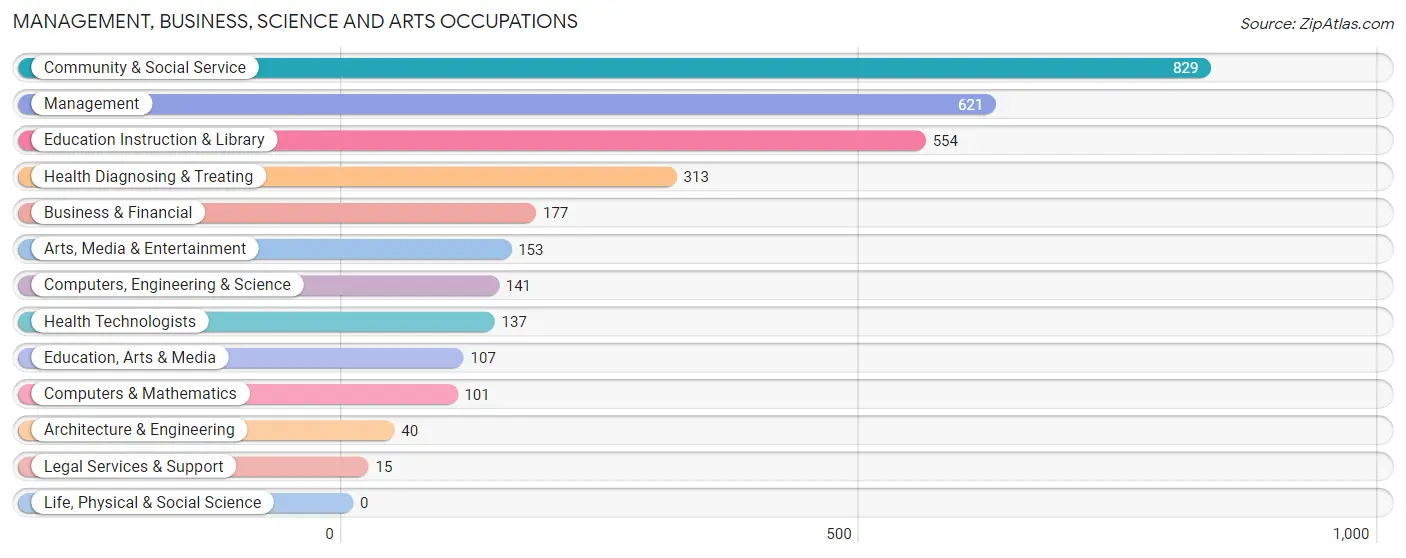
Management, Business, Science and Arts Occupations
The most common Management, Business, Science and Arts occupations in Lenoir are Community & Social Service (829 | 11.0%), Management (621 | 8.3%), Education Instruction & Library (554 | 7.4%), Health Diagnosing & Treating (313 | 4.2%), and Business & Financial (177 | 2.4%).
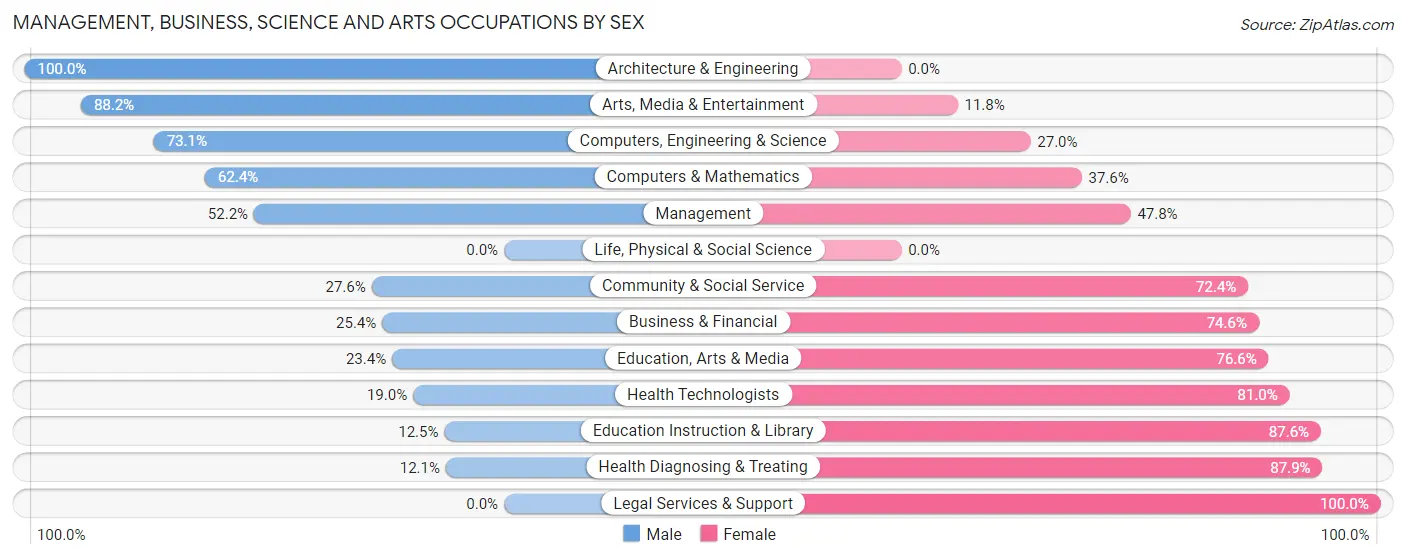
Management, Business, Science and Arts Occupations by Sex
Within the Management, Business, Science and Arts occupations in Lenoir, the most male-oriented occupations are Architecture & Engineering (100.0%), Arts, Media & Entertainment (88.2%), and Computers, Engineering & Science (73.1%), while the most female-oriented occupations are Legal Services & Support (100.0%), Health Diagnosing & Treating (87.9%), and Education Instruction & Library (87.5%).
| Occupation | Male | Female |
| Management | 324 (52.2%) | 297 (47.8%) |
| Business & Financial | 45 (25.4%) | 132 (74.6%) |
| Computers, Engineering & Science | 103 (73.1%) | 38 (27.0%) |
| Computers & Mathematics | 63 (62.4%) | 38 (37.6%) |
| Architecture & Engineering | 40 (100.0%) | 0 (0.0%) |
| Life, Physical & Social Science | 0 (0.0%) | 0 (0.0%) |
| Community & Social Service | 229 (27.6%) | 600 (72.4%) |
| Education, Arts & Media | 25 (23.4%) | 82 (76.6%) |
| Legal Services & Support | 0 (0.0%) | 15 (100.0%) |
| Education Instruction & Library | 69 (12.4%) | 485 (87.5%) |
| Arts, Media & Entertainment | 135 (88.2%) | 18 (11.8%) |
| Health Diagnosing & Treating | 38 (12.1%) | 275 (87.9%) |
| Health Technologists | 26 (19.0%) | 111 (81.0%) |
| Total (Category) | 739 (35.5%) | 1,342 (64.5%) |
| Total (Overall) | 3,874 (51.5%) | 3,647 (48.5%) |
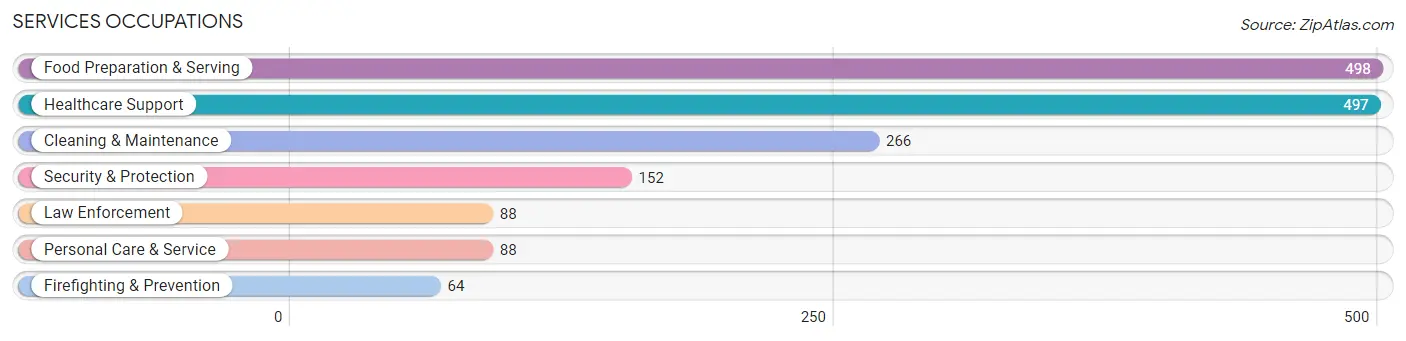
Services Occupations
The most common Services occupations in Lenoir are Food Preparation & Serving (498 | 6.6%), Healthcare Support (497 | 6.6%), Cleaning & Maintenance (266 | 3.5%), Security & Protection (152 | 2.0%), and Law Enforcement (88 | 1.2%).
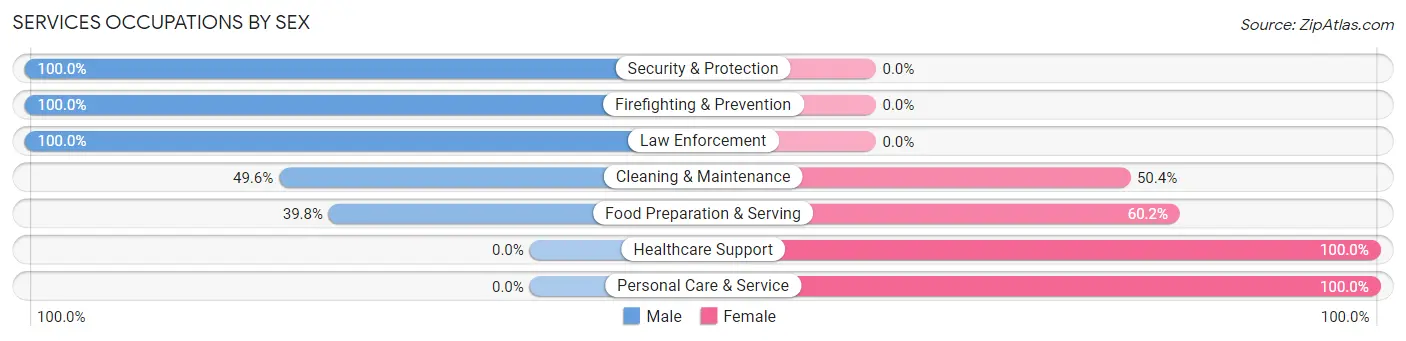
Services Occupations by Sex
Within the Services occupations in Lenoir, the most male-oriented occupations are Security & Protection (100.0%), Firefighting & Prevention (100.0%), and Law Enforcement (100.0%), while the most female-oriented occupations are Healthcare Support (100.0%), Personal Care & Service (100.0%), and Food Preparation & Serving (60.2%).
| Occupation | Male | Female |
| Healthcare Support | 0 (0.0%) | 497 (100.0%) |
| Security & Protection | 152 (100.0%) | 0 (0.0%) |
| Firefighting & Prevention | 64 (100.0%) | 0 (0.0%) |
| Law Enforcement | 88 (100.0%) | 0 (0.0%) |
| Food Preparation & Serving | 198 (39.8%) | 300 (60.2%) |
| Cleaning & Maintenance | 132 (49.6%) | 134 (50.4%) |
| Personal Care & Service | 0 (0.0%) | 88 (100.0%) |
| Total (Category) | 482 (32.1%) | 1,019 (67.9%) |
| Total (Overall) | 3,874 (51.5%) | 3,647 (48.5%) |
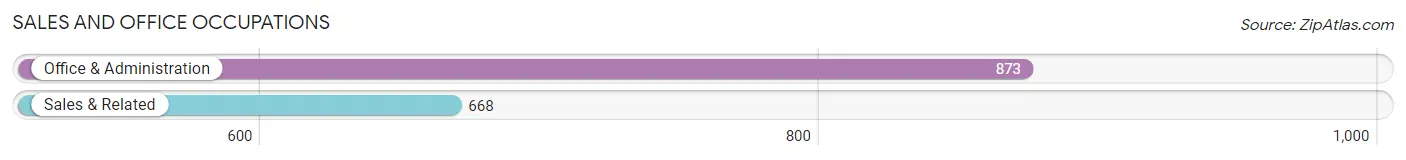
Sales and Office Occupations
The most common Sales and Office occupations in Lenoir are Office & Administration (873 | 11.6%), and Sales & Related (668 | 8.9%).
Sales and Office Occupations by Sex
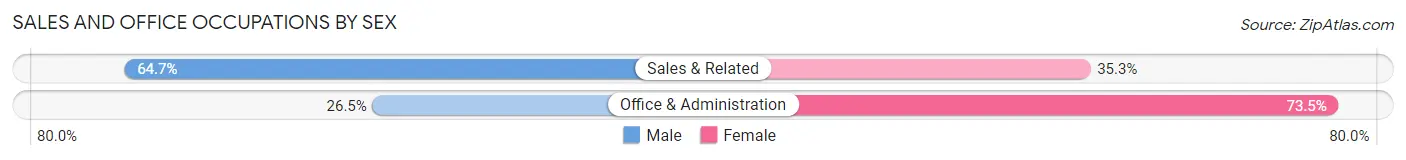
| Occupation | Male | Female |
| Sales & Related | 432 (64.7%) | 236 (35.3%) |
| Office & Administration | 231 (26.5%) | 642 (73.5%) |
| Total (Category) | 663 (43.0%) | 878 (57.0%) |
| Total (Overall) | 3,874 (51.5%) | 3,647 (48.5%) |
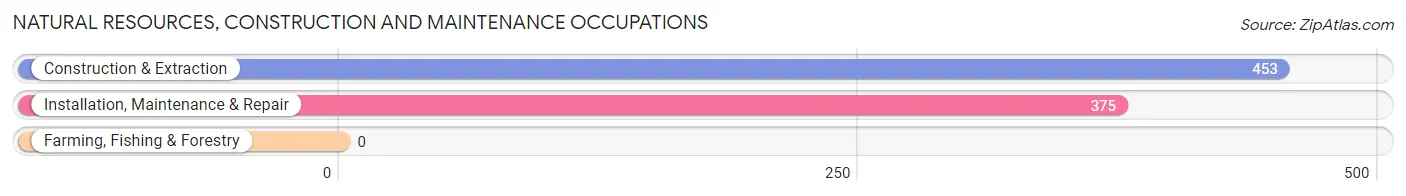
Natural Resources, Construction and Maintenance Occupations
The most common Natural Resources, Construction and Maintenance occupations in Lenoir are Construction & Extraction (453 | 6.0%), and Installation, Maintenance & Repair (375 | 5.0%).
Natural Resources, Construction and Maintenance Occupations by Sex
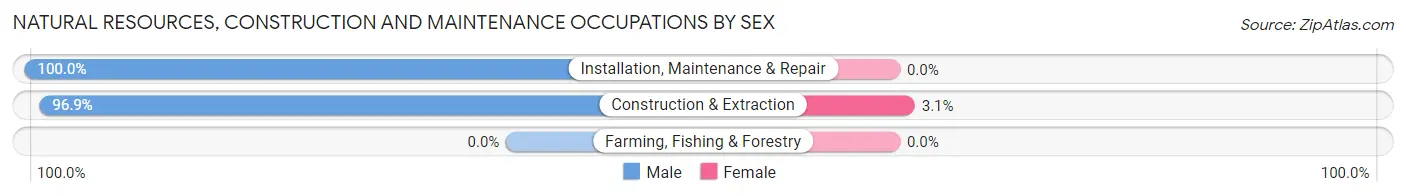
| Occupation | Male | Female |
| Farming, Fishing & Forestry | 0 (0.0%) | 0 (0.0%) |
| Construction & Extraction | 439 (96.9%) | 14 (3.1%) |
| Installation, Maintenance & Repair | 375 (100.0%) | 0 (0.0%) |
| Total (Category) | 814 (98.3%) | 14 (1.7%) |
| Total (Overall) | 3,874 (51.5%) | 3,647 (48.5%) |
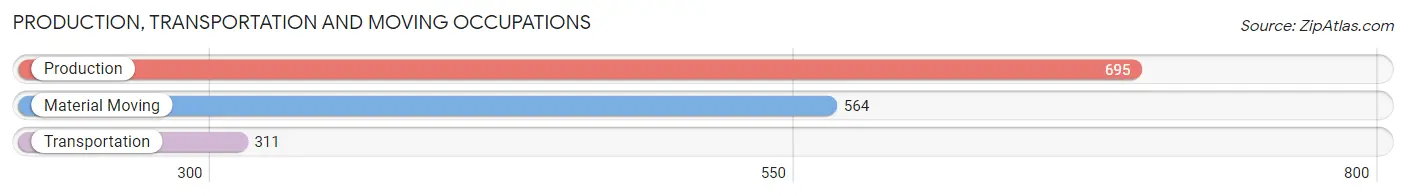
Production, Transportation and Moving Occupations
The most common Production, Transportation and Moving occupations in Lenoir are Production (695 | 9.2%), Material Moving (564 | 7.5%), and Transportation (311 | 4.1%).
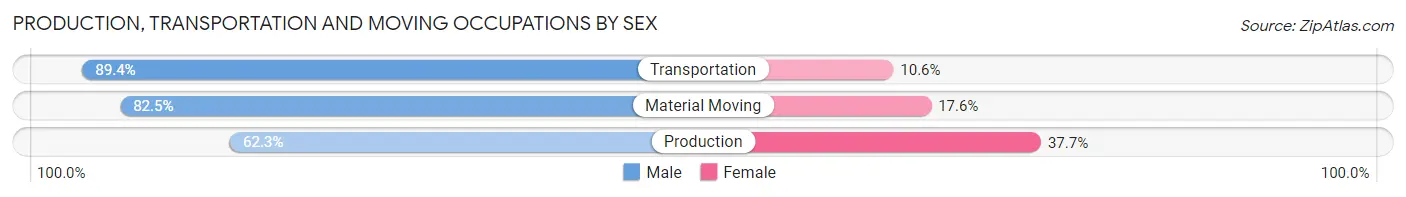
Production, Transportation and Moving Occupations by Sex
| Occupation | Male | Female |
| Production | 433 (62.3%) | 262 (37.7%) |
| Transportation | 278 (89.4%) | 33 (10.6%) |
| Material Moving | 465 (82.5%) | 99 (17.5%) |
| Total (Category) | 1,176 (74.9%) | 394 (25.1%) |
| Total (Overall) | 3,874 (51.5%) | 3,647 (48.5%) |
Employment Industries by Sex in Lenoir
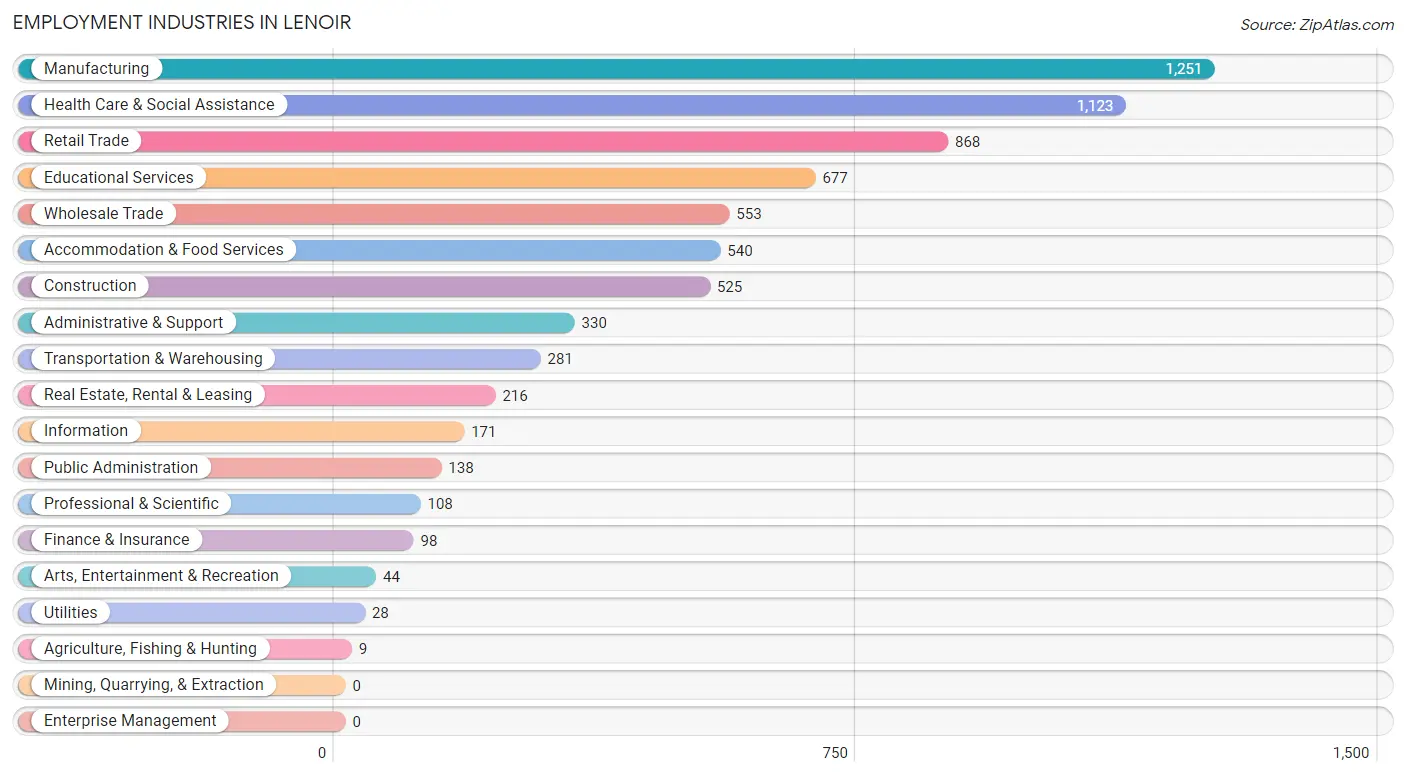
Employment Industries in Lenoir
The major employment industries in Lenoir include Manufacturing (1,251 | 16.6%), Health Care & Social Assistance (1,123 | 14.9%), Retail Trade (868 | 11.5%), Educational Services (677 | 9.0%), and Wholesale Trade (553 | 7.3%).
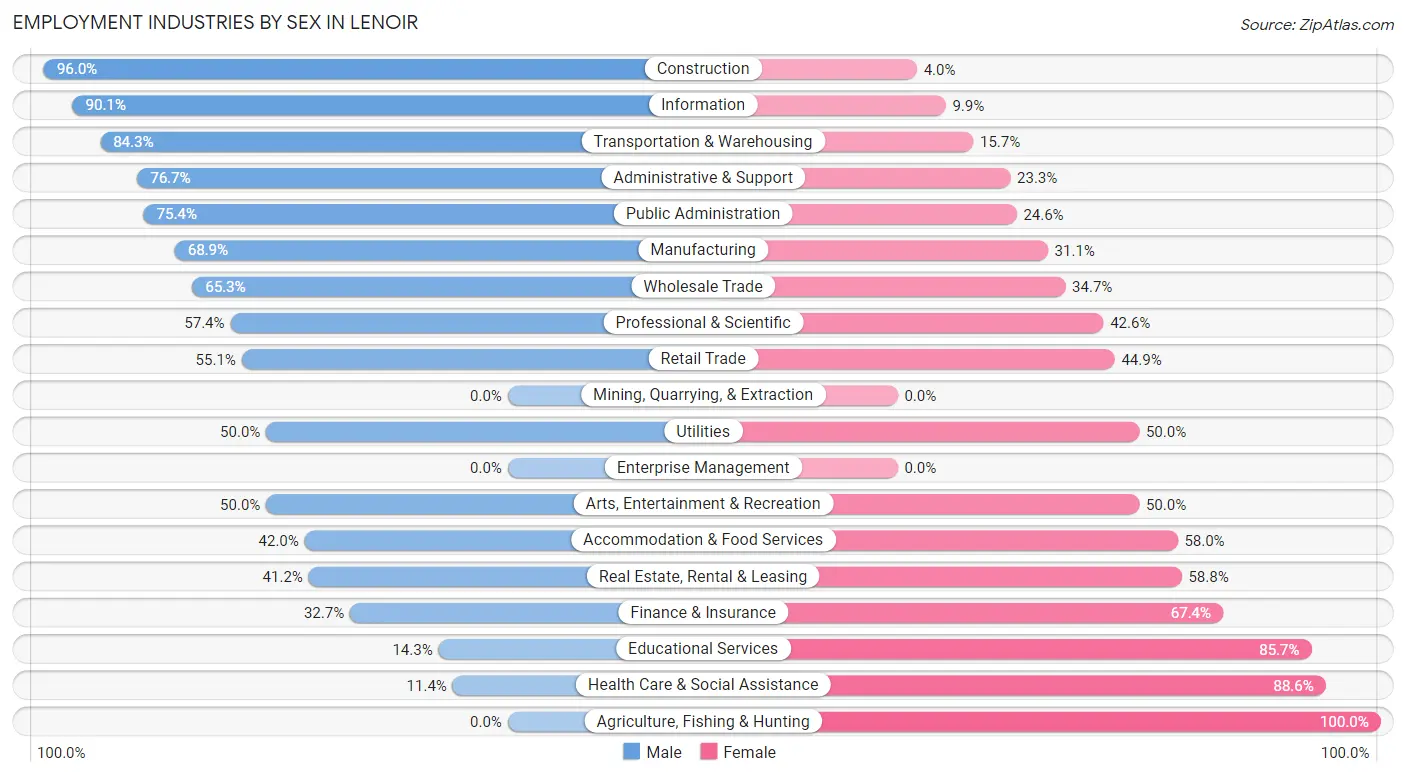
Employment Industries by Sex in Lenoir
The Lenoir industries that see more men than women are Construction (96.0%), Information (90.1%), and Transportation & Warehousing (84.3%), whereas the industries that tend to have a higher number of women are Agriculture, Fishing & Hunting (100.0%), Health Care & Social Assistance (88.6%), and Educational Services (85.7%).
| Industry | Male | Female |
| Agriculture, Fishing & Hunting | 0 (0.0%) | 9 (100.0%) |
| Mining, Quarrying, & Extraction | 0 (0.0%) | 0 (0.0%) |
| Construction | 504 (96.0%) | 21 (4.0%) |
| Manufacturing | 862 (68.9%) | 389 (31.1%) |
| Wholesale Trade | 361 (65.3%) | 192 (34.7%) |
| Retail Trade | 478 (55.1%) | 390 (44.9%) |
| Transportation & Warehousing | 237 (84.3%) | 44 (15.7%) |
| Utilities | 14 (50.0%) | 14 (50.0%) |
| Information | 154 (90.1%) | 17 (9.9%) |
| Finance & Insurance | 32 (32.7%) | 66 (67.3%) |
| Real Estate, Rental & Leasing | 89 (41.2%) | 127 (58.8%) |
| Professional & Scientific | 62 (57.4%) | 46 (42.6%) |
| Enterprise Management | 0 (0.0%) | 0 (0.0%) |
| Administrative & Support | 253 (76.7%) | 77 (23.3%) |
| Educational Services | 97 (14.3%) | 580 (85.7%) |
| Health Care & Social Assistance | 128 (11.4%) | 995 (88.6%) |
| Arts, Entertainment & Recreation | 22 (50.0%) | 22 (50.0%) |
| Accommodation & Food Services | 227 (42.0%) | 313 (58.0%) |
| Public Administration | 104 (75.4%) | 34 (24.6%) |
| Total | 3,874 (51.5%) | 3,647 (48.5%) |
Education in Lenoir
School Enrollment in Lenoir
The most common levels of schooling among the 3,630 students in Lenoir are high school (862 | 23.7%), middle school (829 | 22.8%), and elementary school (818 | 22.5%).
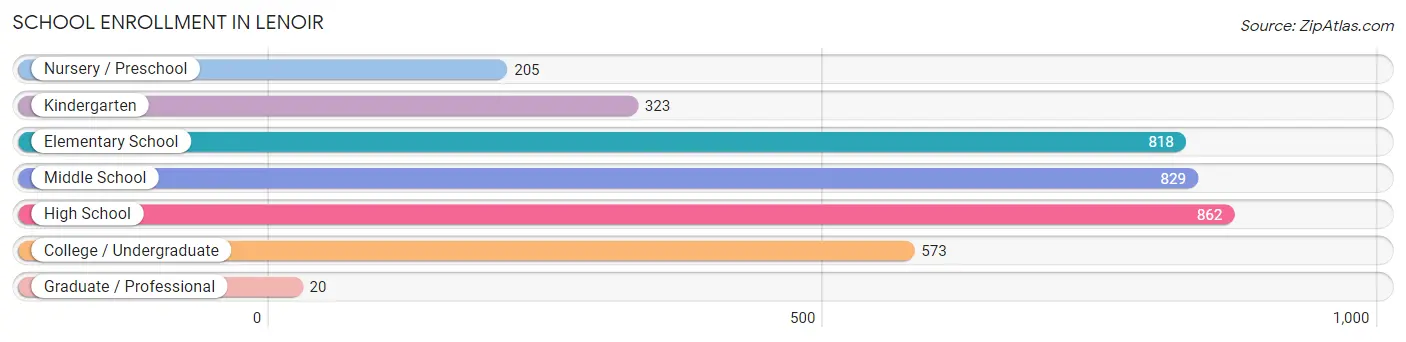
| School Level | # Students | % Students |
| Nursery / Preschool | 205 | 5.7% |
| Kindergarten | 323 | 8.9% |
| Elementary School | 818 | 22.5% |
| Middle School | 829 | 22.8% |
| High School | 862 | 23.7% |
| College / Undergraduate | 573 | 15.8% |
| Graduate / Professional | 20 | 0.5% |
| Total | 3,630 | 100.0% |
School Enrollment by Age by Funding Source in Lenoir
Out of a total of 3,630 students who are enrolled in schools in Lenoir, 697 (19.2%) attend a private institution, while the remaining 2,933 (80.8%) are enrolled in public schools. The age group of 3 to 4 year olds has the highest likelihood of being enrolled in private schools, with 79 (56.8% in the age bracket) enrolled. Conversely, the age group of 15 to 17 year olds has the lowest likelihood of being enrolled in a private school, with 511 (93.2% in the age bracket) attending a public institution.
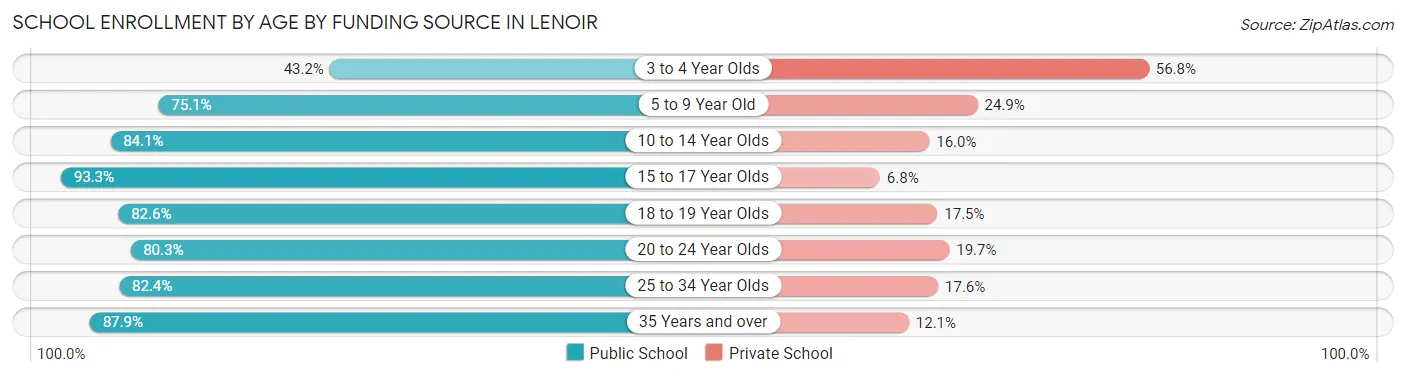
| Age Bracket | Public School | Private School |
| 3 to 4 Year Olds | 60 (43.2%) | 79 (56.8%) |
| 5 to 9 Year Old | 837 (75.1%) | 278 (24.9%) |
| 10 to 14 Year Olds | 743 (84.1%) | 141 (16.0%) |
| 15 to 17 Year Olds | 511 (93.2%) | 37 (6.8%) |
| 18 to 19 Year Olds | 369 (82.6%) | 78 (17.4%) |
| 20 to 24 Year Olds | 200 (80.3%) | 49 (19.7%) |
| 25 to 34 Year Olds | 89 (82.4%) | 19 (17.6%) |
| 35 Years and over | 123 (87.9%) | 17 (12.1%) |
| Total | 2,933 (80.8%) | 697 (19.2%) |
Educational Attainment by Field of Study in Lenoir
Education (657 | 27.8%), business (284 | 12.0%), arts & humanities (259 | 11.0%), science & technology (252 | 10.7%), and social sciences (159 | 6.7%) are the most common fields of study among 2,362 individuals in Lenoir who have obtained a bachelor's degree or higher.
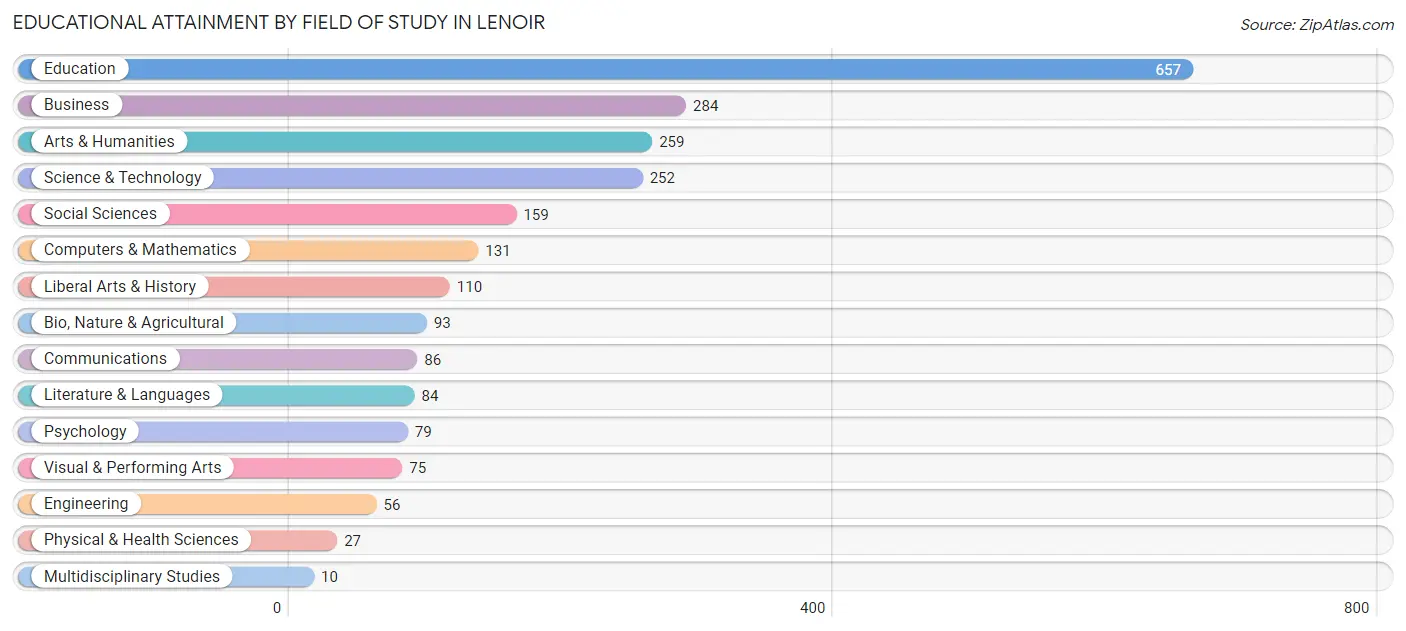
| Field of Study | # Graduates | % Graduates |
| Computers & Mathematics | 131 | 5.6% |
| Bio, Nature & Agricultural | 93 | 3.9% |
| Physical & Health Sciences | 27 | 1.1% |
| Psychology | 79 | 3.3% |
| Social Sciences | 159 | 6.7% |
| Engineering | 56 | 2.4% |
| Multidisciplinary Studies | 10 | 0.4% |
| Science & Technology | 252 | 10.7% |
| Business | 284 | 12.0% |
| Education | 657 | 27.8% |
| Literature & Languages | 84 | 3.6% |
| Liberal Arts & History | 110 | 4.7% |
| Visual & Performing Arts | 75 | 3.2% |
| Communications | 86 | 3.6% |
| Arts & Humanities | 259 | 11.0% |
| Total | 2,362 | 100.0% |
Transportation & Commute in Lenoir
Vehicle Availability by Sex in Lenoir
The most prevalent vehicle ownership categories in Lenoir are males with 2 vehicles (1,488, accounting for 39.4%) and females with 2 vehicles (1,089, making up 43.4%).
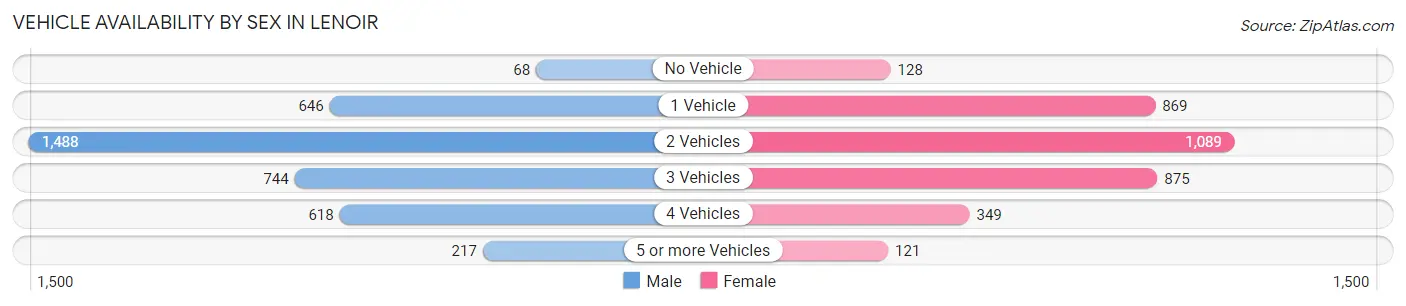
| Vehicles Available | Male | Female |
| No Vehicle | 68 (1.8%) | 128 (3.7%) |
| 1 Vehicle | 646 (17.1%) | 869 (25.3%) |
| 2 Vehicles | 1,488 (39.4%) | 1,089 (31.7%) |
| 3 Vehicles | 744 (19.7%) | 875 (25.5%) |
| 4 Vehicles | 618 (16.3%) | 349 (10.2%) |
| 5 or more Vehicles | 217 (5.7%) | 121 (3.5%) |
| Total | 3,781 (100.0%) | 3,431 (100.0%) |
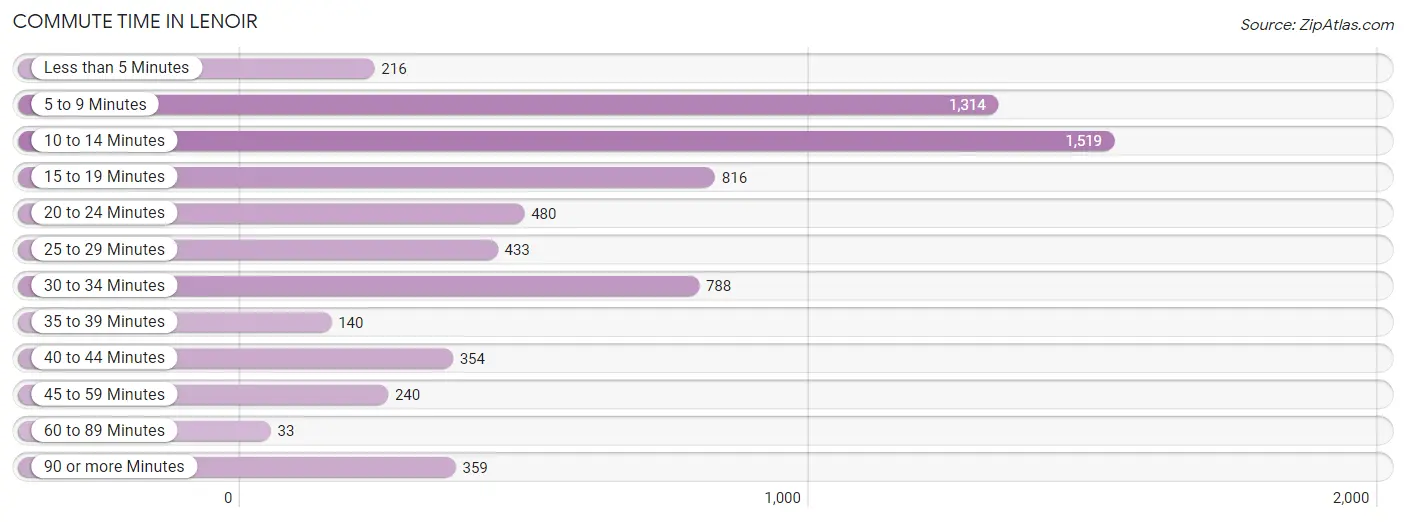
Commute Time in Lenoir
The most frequently occuring commute durations in Lenoir are 10 to 14 minutes (1,519 commuters, 22.7%), 5 to 9 minutes (1,314 commuters, 19.6%), and 15 to 19 minutes (816 commuters, 12.2%).
| Commute Time | # Commuters | % Commuters |
| Less than 5 Minutes | 216 | 3.2% |
| 5 to 9 Minutes | 1,314 | 19.6% |
| 10 to 14 Minutes | 1,519 | 22.7% |
| 15 to 19 Minutes | 816 | 12.2% |
| 20 to 24 Minutes | 480 | 7.2% |
| 25 to 29 Minutes | 433 | 6.5% |
| 30 to 34 Minutes | 788 | 11.8% |
| 35 to 39 Minutes | 140 | 2.1% |
| 40 to 44 Minutes | 354 | 5.3% |
| 45 to 59 Minutes | 240 | 3.6% |
| 60 to 89 Minutes | 33 | 0.5% |
| 90 or more Minutes | 359 | 5.4% |
Commute Time by Sex in Lenoir
The most common commute times in Lenoir are 10 to 14 minutes (905 commuters, 26.3%) for males and 5 to 9 minutes (812 commuters, 25.0%) for females.
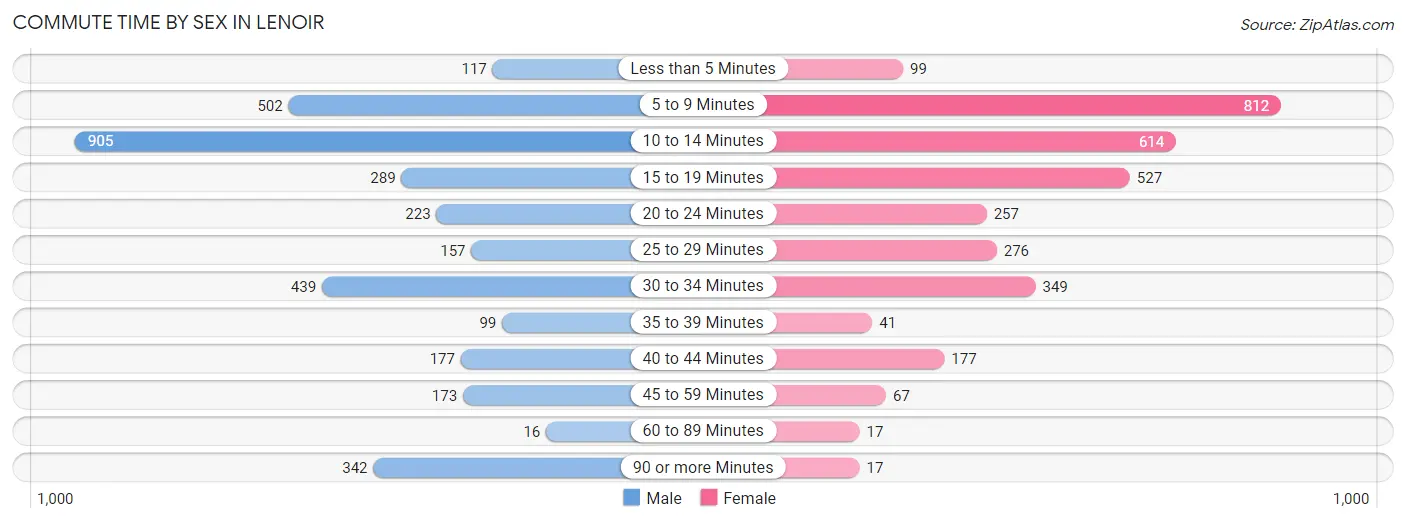
| Commute Time | Male | Female |
| Less than 5 Minutes | 117 (3.4%) | 99 (3.0%) |
| 5 to 9 Minutes | 502 (14.6%) | 812 (25.0%) |
| 10 to 14 Minutes | 905 (26.3%) | 614 (18.9%) |
| 15 to 19 Minutes | 289 (8.4%) | 527 (16.2%) |
| 20 to 24 Minutes | 223 (6.5%) | 257 (7.9%) |
| 25 to 29 Minutes | 157 (4.6%) | 276 (8.5%) |
| 30 to 34 Minutes | 439 (12.8%) | 349 (10.7%) |
| 35 to 39 Minutes | 99 (2.9%) | 41 (1.3%) |
| 40 to 44 Minutes | 177 (5.1%) | 177 (5.4%) |
| 45 to 59 Minutes | 173 (5.0%) | 67 (2.1%) |
| 60 to 89 Minutes | 16 (0.5%) | 17 (0.5%) |
| 90 or more Minutes | 342 (9.9%) | 17 (0.5%) |
Time of Departure to Work by Sex in Lenoir
The most frequent times of departure to work in Lenoir are 7:00 AM to 7:29 AM (641, 18.6%) for males and 7:00 AM to 7:29 AM (671, 20.6%) for females.
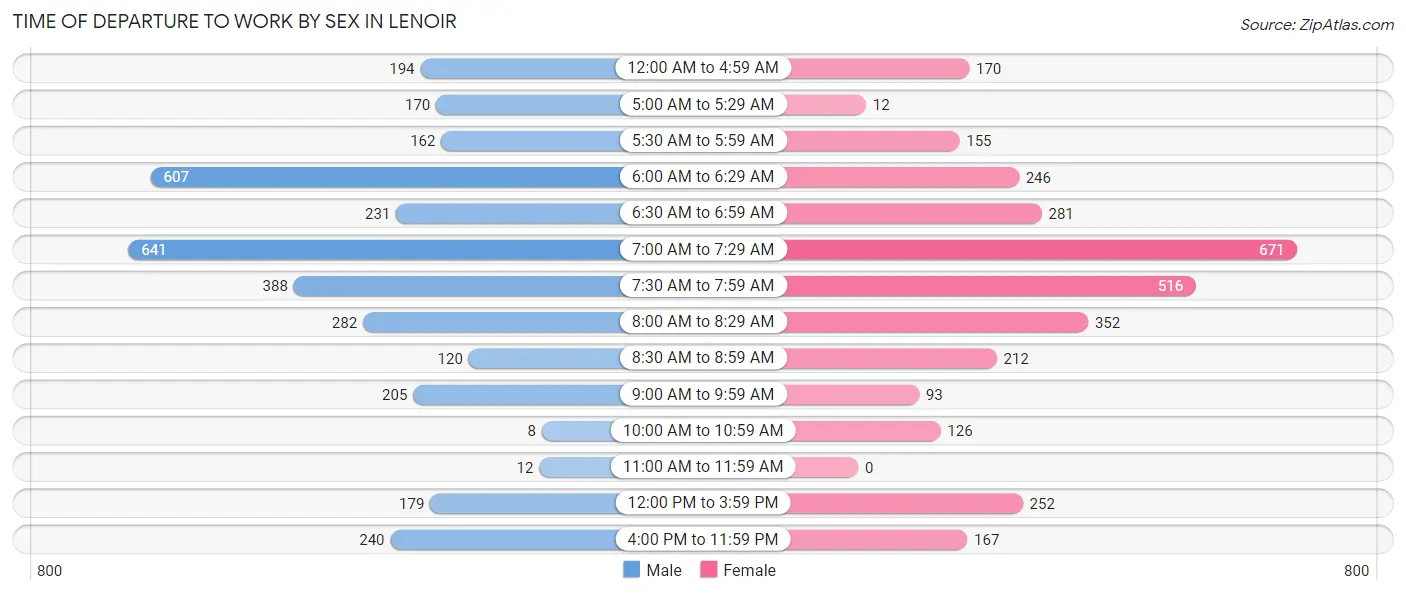
| Time of Departure | Male | Female |
| 12:00 AM to 4:59 AM | 194 (5.6%) | 170 (5.2%) |
| 5:00 AM to 5:29 AM | 170 (4.9%) | 12 (0.4%) |
| 5:30 AM to 5:59 AM | 162 (4.7%) | 155 (4.8%) |
| 6:00 AM to 6:29 AM | 607 (17.6%) | 246 (7.6%) |
| 6:30 AM to 6:59 AM | 231 (6.7%) | 281 (8.6%) |
| 7:00 AM to 7:29 AM | 641 (18.6%) | 671 (20.6%) |
| 7:30 AM to 7:59 AM | 388 (11.3%) | 516 (15.9%) |
| 8:00 AM to 8:29 AM | 282 (8.2%) | 352 (10.8%) |
| 8:30 AM to 8:59 AM | 120 (3.5%) | 212 (6.5%) |
| 9:00 AM to 9:59 AM | 205 (6.0%) | 93 (2.9%) |
| 10:00 AM to 10:59 AM | 8 (0.2%) | 126 (3.9%) |
| 11:00 AM to 11:59 AM | 12 (0.4%) | 0 (0.0%) |
| 12:00 PM to 3:59 PM | 179 (5.2%) | 252 (7.7%) |
| 4:00 PM to 11:59 PM | 240 (7.0%) | 167 (5.1%) |
| Total | 3,439 (100.0%) | 3,253 (100.0%) |
Housing Occupancy in Lenoir
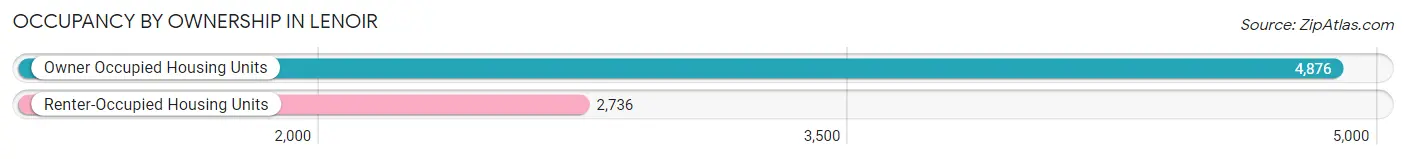
Occupancy by Ownership in Lenoir
Of the total 7,612 dwellings in Lenoir, owner-occupied units account for 4,876 (64.1%), while renter-occupied units make up 2,736 (35.9%).
| Occupancy | # Housing Units | % Housing Units |
| Owner Occupied Housing Units | 4,876 | 64.1% |
| Renter-Occupied Housing Units | 2,736 | 35.9% |
| Total Occupied Housing Units | 7,612 | 100.0% |
Occupancy by Household Size in Lenoir
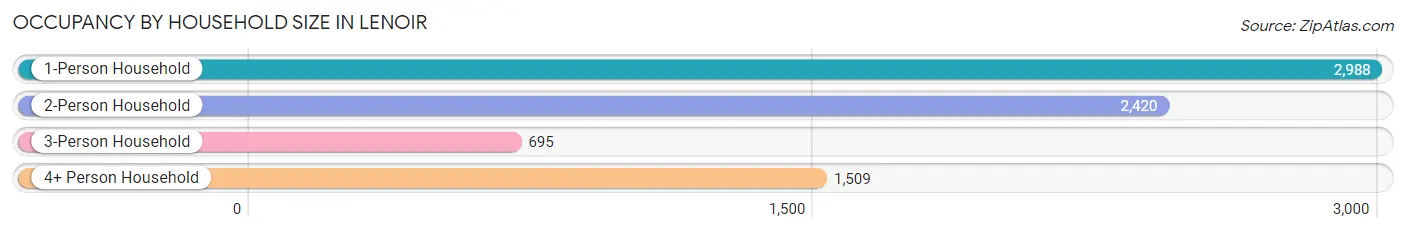
| Household Size | # Housing Units | % Housing Units |
| 1-Person Household | 2,988 | 39.3% |
| 2-Person Household | 2,420 | 31.8% |
| 3-Person Household | 695 | 9.1% |
| 4+ Person Household | 1,509 | 19.8% |
| Total Housing Units | 7,612 | 100.0% |
Occupancy by Ownership by Household Size in Lenoir
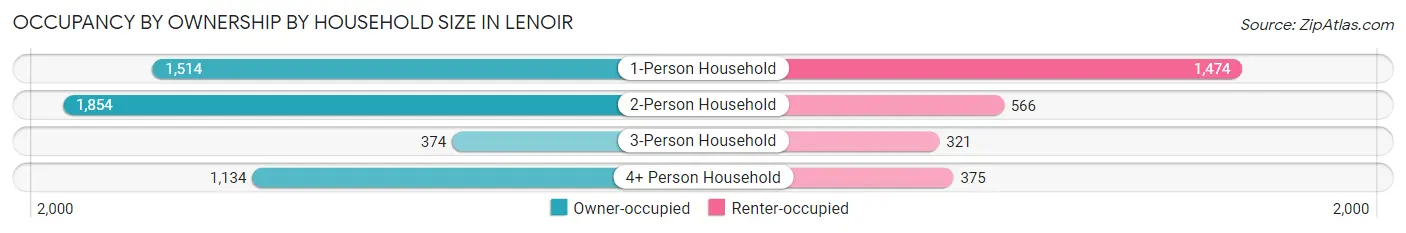
| Household Size | Owner-occupied | Renter-occupied |
| 1-Person Household | 1,514 (50.7%) | 1,474 (49.3%) |
| 2-Person Household | 1,854 (76.6%) | 566 (23.4%) |
| 3-Person Household | 374 (53.8%) | 321 (46.2%) |
| 4+ Person Household | 1,134 (75.1%) | 375 (24.8%) |
| Total Housing Units | 4,876 (64.1%) | 2,736 (35.9%) |
Occupancy by Educational Attainment in Lenoir
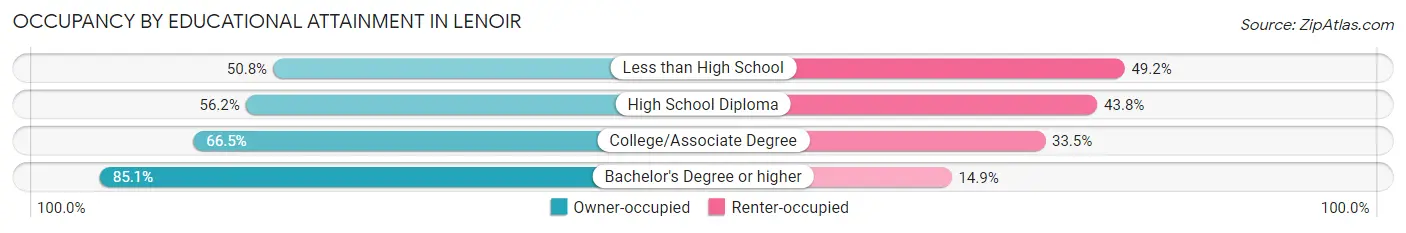
| Household Size | Owner-occupied | Renter-occupied |
| Less than High School | 592 (50.8%) | 574 (49.2%) |
| High School Diploma | 1,453 (56.2%) | 1,133 (43.8%) |
| College/Associate Degree | 1,623 (66.5%) | 817 (33.5%) |
| Bachelor's Degree or higher | 1,208 (85.1%) | 212 (14.9%) |
Occupancy by Age of Householder in Lenoir
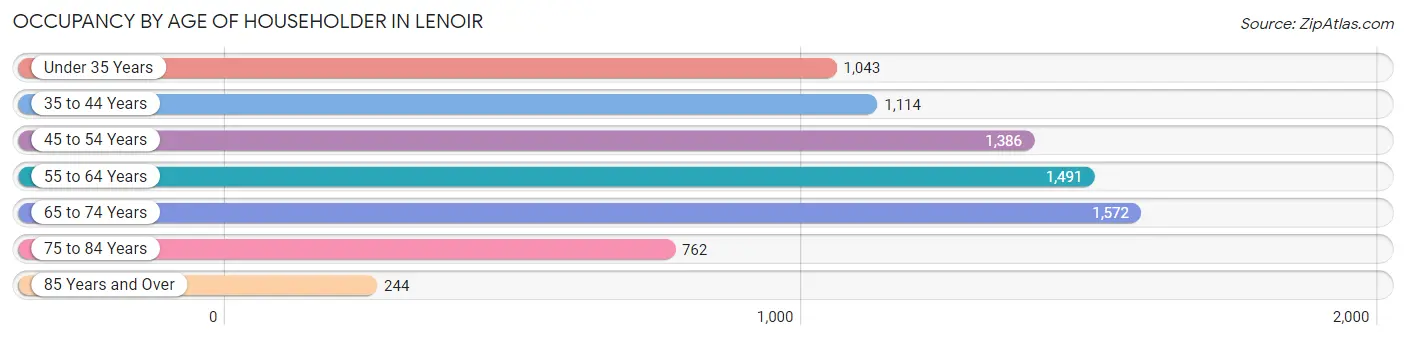
| Age Bracket | # Households | % Households |
| Under 35 Years | 1,043 | 13.7% |
| 35 to 44 Years | 1,114 | 14.6% |
| 45 to 54 Years | 1,386 | 18.2% |
| 55 to 64 Years | 1,491 | 19.6% |
| 65 to 74 Years | 1,572 | 20.6% |
| 75 to 84 Years | 762 | 10.0% |
| 85 Years and Over | 244 | 3.2% |
| Total | 7,612 | 100.0% |
Housing Finances in Lenoir
Median Income by Occupancy in Lenoir
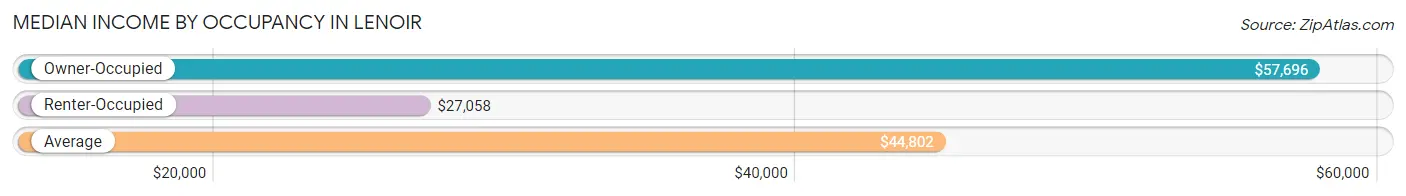
| Occupancy Type | # Households | Median Income |
| Owner-Occupied | 4,876 (64.1%) | $57,696 |
| Renter-Occupied | 2,736 (35.9%) | $27,058 |
| Average | 7,612 (100.0%) | $44,802 |
Occupancy by Householder Income Bracket in Lenoir
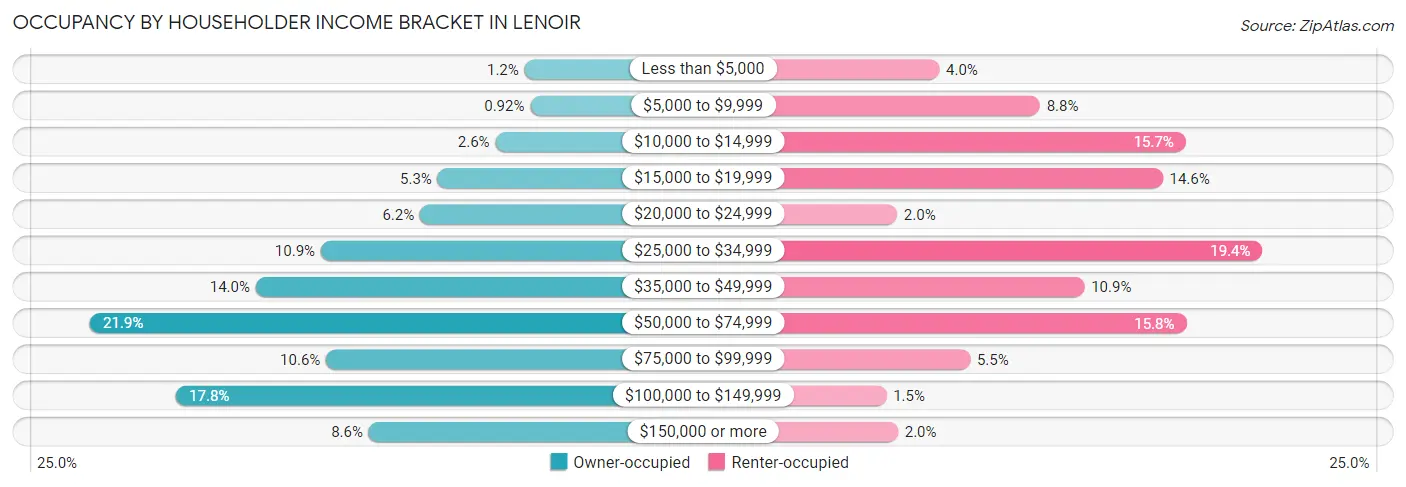
| Income Bracket | Owner-occupied | Renter-occupied |
| Less than $5,000 | 58 (1.2%) | 109 (4.0%) |
| $5,000 to $9,999 | 45 (0.9%) | 240 (8.8%) |
| $10,000 to $14,999 | 126 (2.6%) | 430 (15.7%) |
| $15,000 to $19,999 | 260 (5.3%) | 400 (14.6%) |
| $20,000 to $24,999 | 301 (6.2%) | 54 (2.0%) |
| $25,000 to $34,999 | 531 (10.9%) | 530 (19.4%) |
| $35,000 to $49,999 | 682 (14.0%) | 298 (10.9%) |
| $50,000 to $74,999 | 1,067 (21.9%) | 431 (15.8%) |
| $75,000 to $99,999 | 519 (10.6%) | 149 (5.4%) |
| $100,000 to $149,999 | 867 (17.8%) | 40 (1.5%) |
| $150,000 or more | 420 (8.6%) | 55 (2.0%) |
| Total | 4,876 (100.0%) | 2,736 (100.0%) |
Monthly Housing Cost Tiers in Lenoir
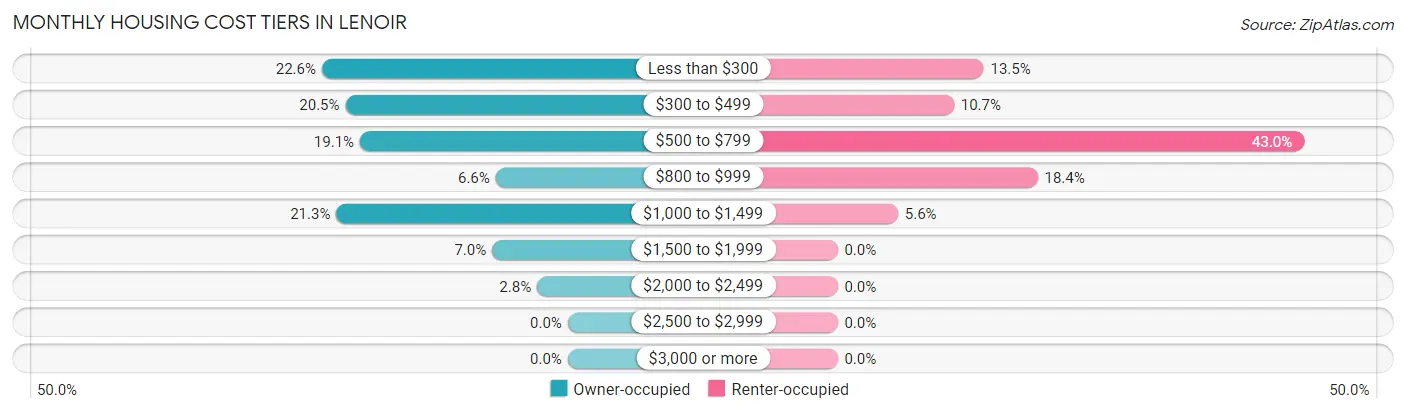
| Monthly Cost | Owner-occupied | Renter-occupied |
| Less than $300 | 1,104 (22.6%) | 368 (13.5%) |
| $300 to $499 | 998 (20.5%) | 293 (10.7%) |
| $500 to $799 | 933 (19.1%) | 1,175 (42.9%) |
| $800 to $999 | 324 (6.6%) | 504 (18.4%) |
| $1,000 to $1,499 | 1,039 (21.3%) | 152 (5.6%) |
| $1,500 to $1,999 | 340 (7.0%) | 0 (0.0%) |
| $2,000 to $2,499 | 138 (2.8%) | 0 (0.0%) |
| $2,500 to $2,999 | 0 (0.0%) | 0 (0.0%) |
| $3,000 or more | 0 (0.0%) | 0 (0.0%) |
| Total | 4,876 (100.0%) | 2,736 (100.0%) |
Physical Housing Characteristics in Lenoir
Housing Structures in Lenoir
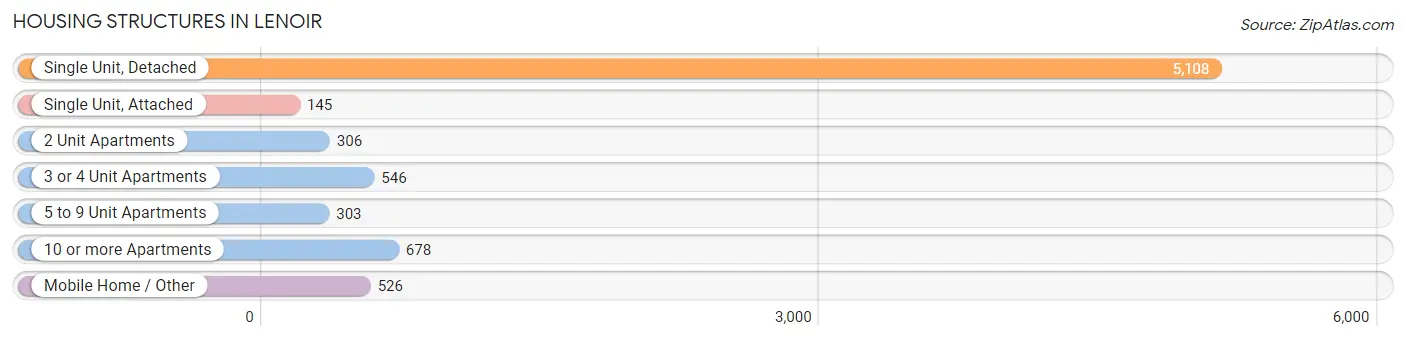
| Structure Type | # Housing Units | % Housing Units |
| Single Unit, Detached | 5,108 | 67.1% |
| Single Unit, Attached | 145 | 1.9% |
| 2 Unit Apartments | 306 | 4.0% |
| 3 or 4 Unit Apartments | 546 | 7.2% |
| 5 to 9 Unit Apartments | 303 | 4.0% |
| 10 or more Apartments | 678 | 8.9% |
| Mobile Home / Other | 526 | 6.9% |
| Total | 7,612 | 100.0% |
Housing Structures by Occupancy in Lenoir
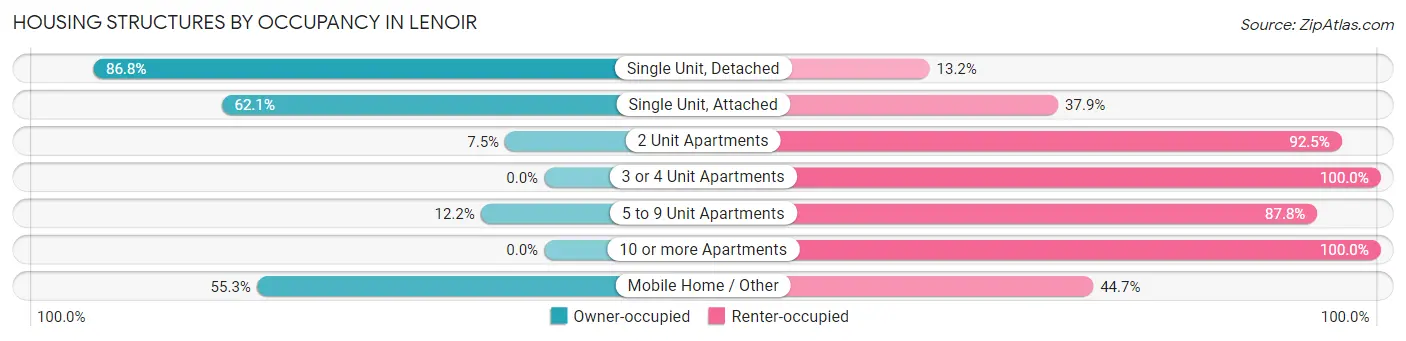
| Structure Type | Owner-occupied | Renter-occupied |
| Single Unit, Detached | 4,435 (86.8%) | 673 (13.2%) |
| Single Unit, Attached | 90 (62.1%) | 55 (37.9%) |
| 2 Unit Apartments | 23 (7.5%) | 283 (92.5%) |
| 3 or 4 Unit Apartments | 0 (0.0%) | 546 (100.0%) |
| 5 to 9 Unit Apartments | 37 (12.2%) | 266 (87.8%) |
| 10 or more Apartments | 0 (0.0%) | 678 (100.0%) |
| Mobile Home / Other | 291 (55.3%) | 235 (44.7%) |
| Total | 4,876 (64.1%) | 2,736 (35.9%) |
Housing Structures by Number of Rooms in Lenoir
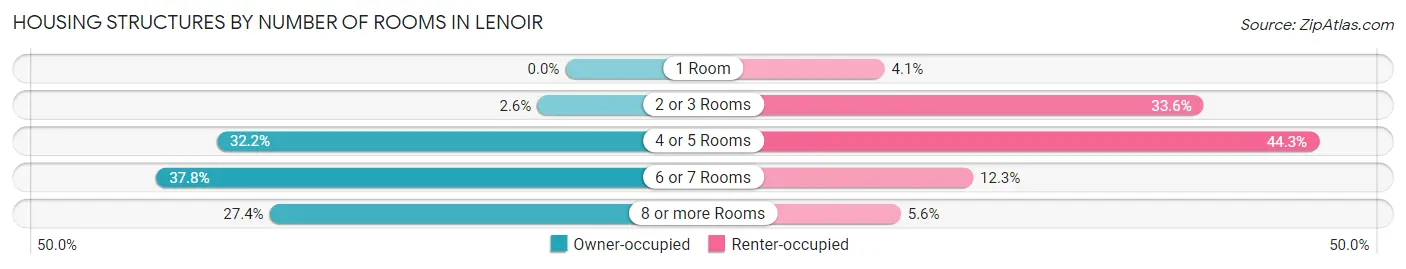
| Number of Rooms | Owner-occupied | Renter-occupied |
| 1 Room | 0 (0.0%) | 113 (4.1%) |
| 2 or 3 Rooms | 127 (2.6%) | 920 (33.6%) |
| 4 or 5 Rooms | 1,571 (32.2%) | 1,212 (44.3%) |
| 6 or 7 Rooms | 1,844 (37.8%) | 337 (12.3%) |
| 8 or more Rooms | 1,334 (27.4%) | 154 (5.6%) |
| Total | 4,876 (100.0%) | 2,736 (100.0%) |
Housing Structure by Heating Type in Lenoir
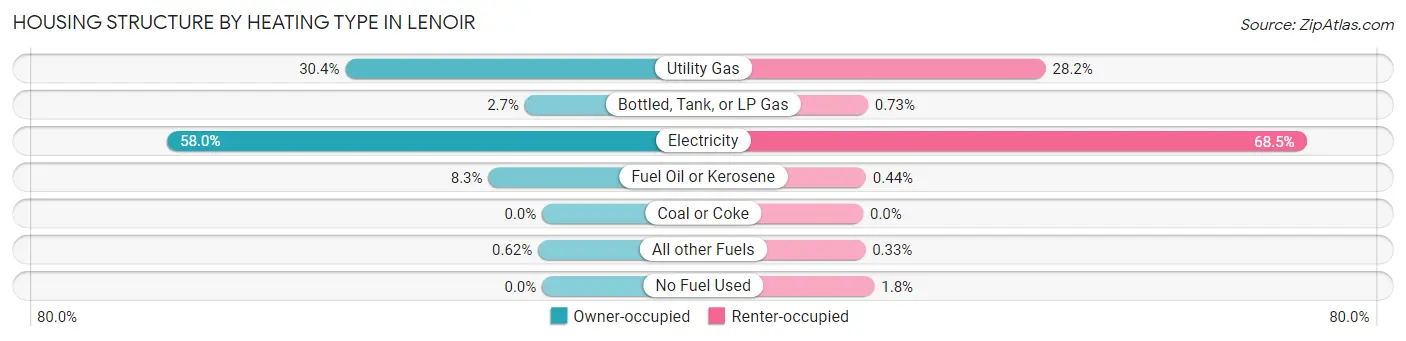
| Heating Type | Owner-occupied | Renter-occupied |
| Utility Gas | 1,484 (30.4%) | 772 (28.2%) |
| Bottled, Tank, or LP Gas | 130 (2.7%) | 20 (0.7%) |
| Electricity | 2,827 (58.0%) | 1,875 (68.5%) |
| Fuel Oil or Kerosene | 405 (8.3%) | 12 (0.4%) |
| Coal or Coke | 0 (0.0%) | 0 (0.0%) |
| All other Fuels | 30 (0.6%) | 9 (0.3%) |
| No Fuel Used | 0 (0.0%) | 48 (1.8%) |
| Total | 4,876 (100.0%) | 2,736 (100.0%) |
Household Vehicle Usage in Lenoir
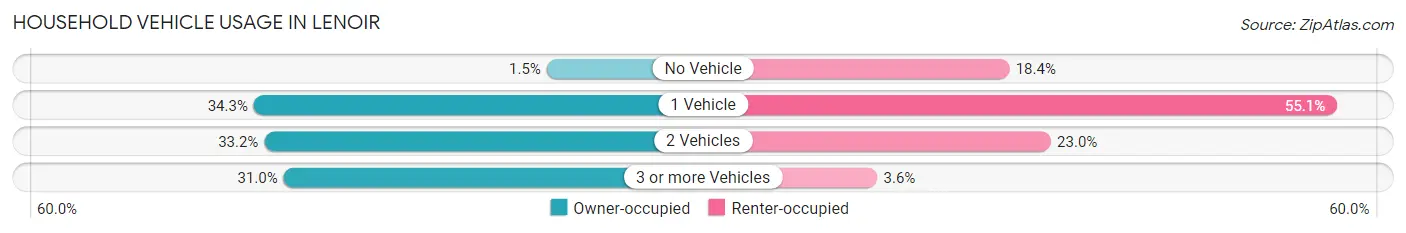
| Vehicles per Household | Owner-occupied | Renter-occupied |
| No Vehicle | 74 (1.5%) | 502 (18.3%) |
| 1 Vehicle | 1,674 (34.3%) | 1,508 (55.1%) |
| 2 Vehicles | 1,617 (33.2%) | 629 (23.0%) |
| 3 or more Vehicles | 1,511 (31.0%) | 97 (3.5%) |
| Total | 4,876 (100.0%) | 2,736 (100.0%) |
Real Estate & Mortgages in Lenoir
Real Estate and Mortgage Overview in Lenoir
| Characteristic | Without Mortgage | With Mortgage |
| Housing Units | 2,528 | 2,348 |
| Median Property Value | $122,700 | $168,500 |
| Median Household Income | $51,887 | $205 |
| Monthly Housing Costs | $333 | $0 |
| Real Estate Taxes | $1,052 | $23 |
Property Value by Mortgage Status in Lenoir
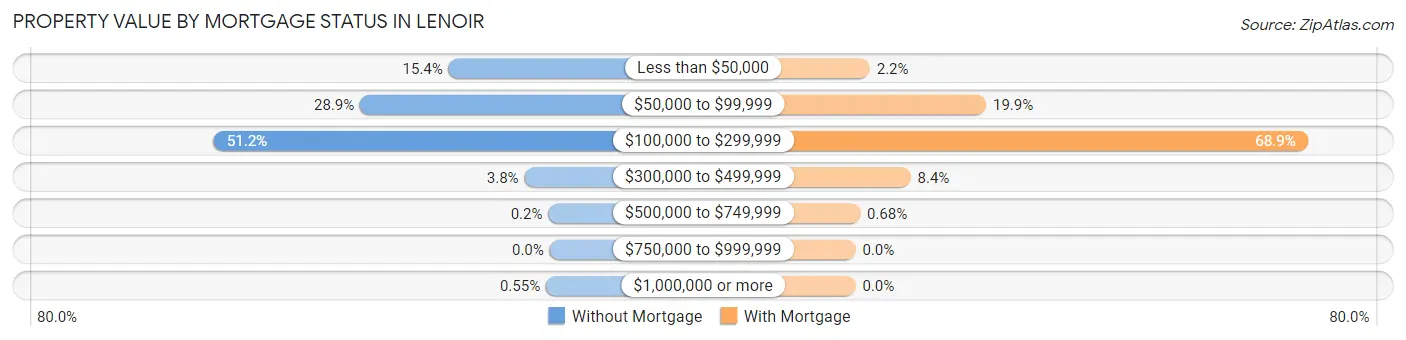
| Property Value | Without Mortgage | With Mortgage |
| Less than $50,000 | 389 (15.4%) | 51 (2.2%) |
| $50,000 to $99,999 | 730 (28.9%) | 467 (19.9%) |
| $100,000 to $299,999 | 1,293 (51.1%) | 1,617 (68.9%) |
| $300,000 to $499,999 | 97 (3.8%) | 197 (8.4%) |
| $500,000 to $749,999 | 5 (0.2%) | 16 (0.7%) |
| $750,000 to $999,999 | 0 (0.0%) | 0 (0.0%) |
| $1,000,000 or more | 14 (0.5%) | 0 (0.0%) |
| Total | 2,528 (100.0%) | 2,348 (100.0%) |
Household Income by Mortgage Status in Lenoir
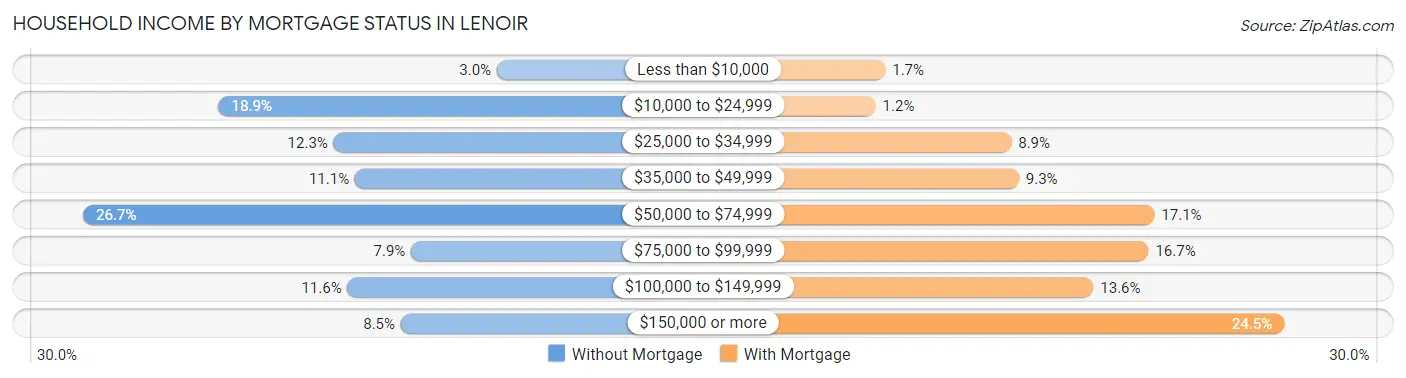
| Household Income | Without Mortgage | With Mortgage |
| Less than $10,000 | 76 (3.0%) | 40 (1.7%) |
| $10,000 to $24,999 | 478 (18.9%) | 27 (1.1%) |
| $25,000 to $34,999 | 312 (12.3%) | 209 (8.9%) |
| $35,000 to $49,999 | 281 (11.1%) | 219 (9.3%) |
| $50,000 to $74,999 | 674 (26.7%) | 401 (17.1%) |
| $75,000 to $99,999 | 200 (7.9%) | 393 (16.7%) |
| $100,000 to $149,999 | 292 (11.6%) | 319 (13.6%) |
| $150,000 or more | 215 (8.5%) | 575 (24.5%) |
| Total | 2,528 (100.0%) | 2,348 (100.0%) |
Property Value to Household Income Ratio in Lenoir
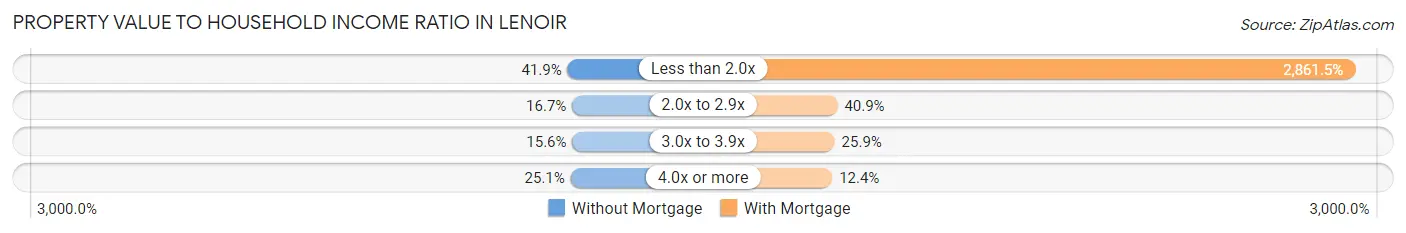
| Value-to-Income Ratio | Without Mortgage | With Mortgage |
| Less than 2.0x | 1,059 (41.9%) | 67,188 (2,861.5%) |
| 2.0x to 2.9x | 423 (16.7%) | 961 (40.9%) |
| 3.0x to 3.9x | 395 (15.6%) | 609 (25.9%) |
| 4.0x or more | 634 (25.1%) | 291 (12.4%) |
| Total | 2,528 (100.0%) | 2,348 (100.0%) |
Real Estate Taxes by Mortgage Status in Lenoir
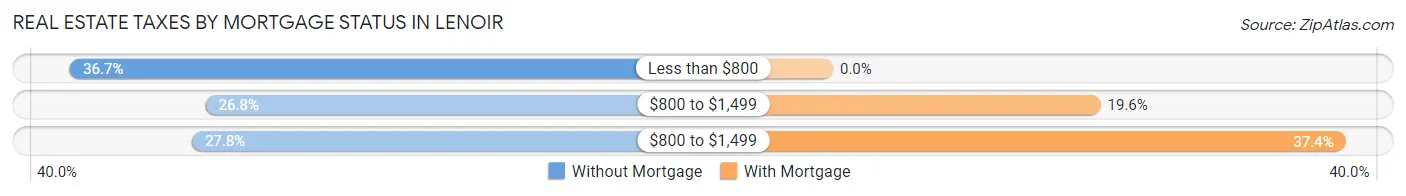
| Property Taxes | Without Mortgage | With Mortgage |
| Less than $800 | 927 (36.7%) | 0 (0.0%) |
| $800 to $1,499 | 677 (26.8%) | 459 (19.6%) |
| $800 to $1,499 | 702 (27.8%) | 879 (37.4%) |
| Total | 2,528 (100.0%) | 2,348 (100.0%) |
Health & Disability in Lenoir
Health Insurance Coverage by Age in Lenoir
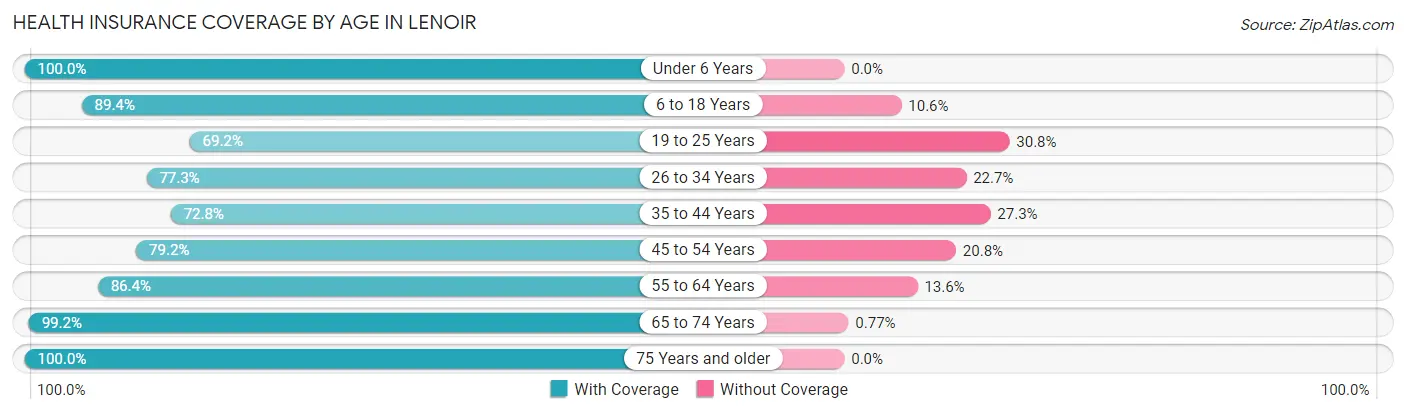
| Age Bracket | With Coverage | Without Coverage |
| Under 6 Years | 1,226 (100.0%) | 0 (0.0%) |
| 6 to 18 Years | 2,720 (89.4%) | 324 (10.6%) |
| 19 to 25 Years | 1,093 (69.2%) | 486 (30.8%) |
| 26 to 34 Years | 1,363 (77.3%) | 401 (22.7%) |
| 35 to 44 Years | 1,303 (72.8%) | 488 (27.3%) |
| 45 to 54 Years | 1,910 (79.2%) | 502 (20.8%) |
| 55 to 64 Years | 2,058 (86.4%) | 325 (13.6%) |
| 65 to 74 Years | 2,195 (99.2%) | 17 (0.8%) |
| 75 Years and older | 1,447 (100.0%) | 0 (0.0%) |
| Total | 15,315 (85.8%) | 2,543 (14.2%) |
Health Insurance Coverage by Citizenship Status in Lenoir
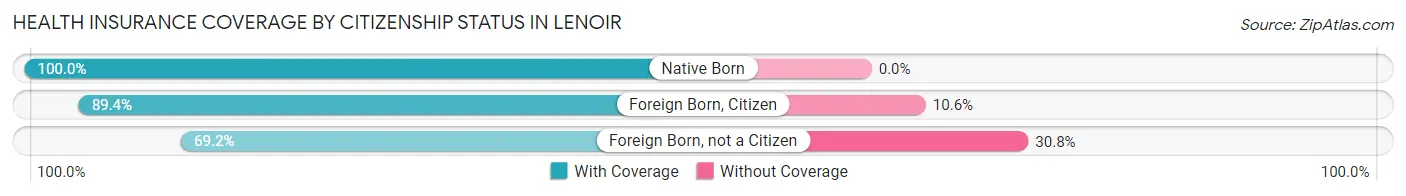
| Citizenship Status | With Coverage | Without Coverage |
| Native Born | 1,226 (100.0%) | 0 (0.0%) |
| Foreign Born, Citizen | 2,720 (89.4%) | 324 (10.6%) |
| Foreign Born, not a Citizen | 1,093 (69.2%) | 486 (30.8%) |
Health Insurance Coverage by Household Income in Lenoir
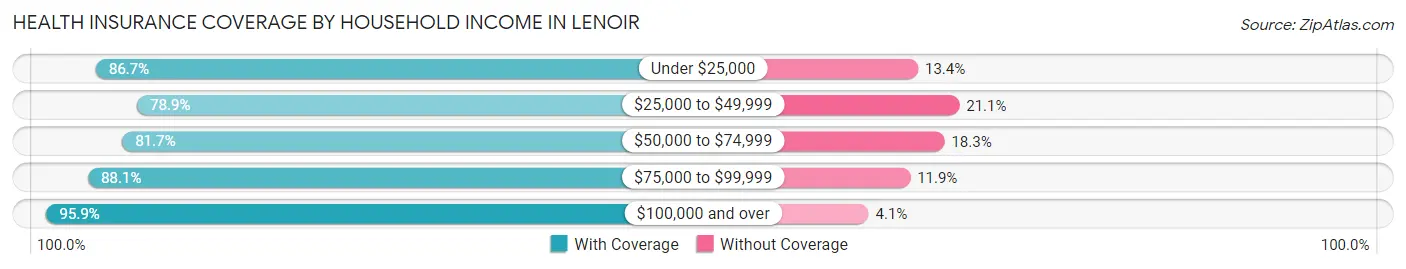
| Household Income | With Coverage | Without Coverage |
| Under $25,000 | 2,870 (86.7%) | 442 (13.4%) |
| $25,000 to $49,999 | 3,186 (78.9%) | 851 (21.1%) |
| $50,000 to $74,999 | 3,407 (81.7%) | 763 (18.3%) |
| $75,000 to $99,999 | 1,862 (88.1%) | 251 (11.9%) |
| $100,000 and over | 3,940 (95.9%) | 168 (4.1%) |
Public vs Private Health Insurance Coverage by Age in Lenoir
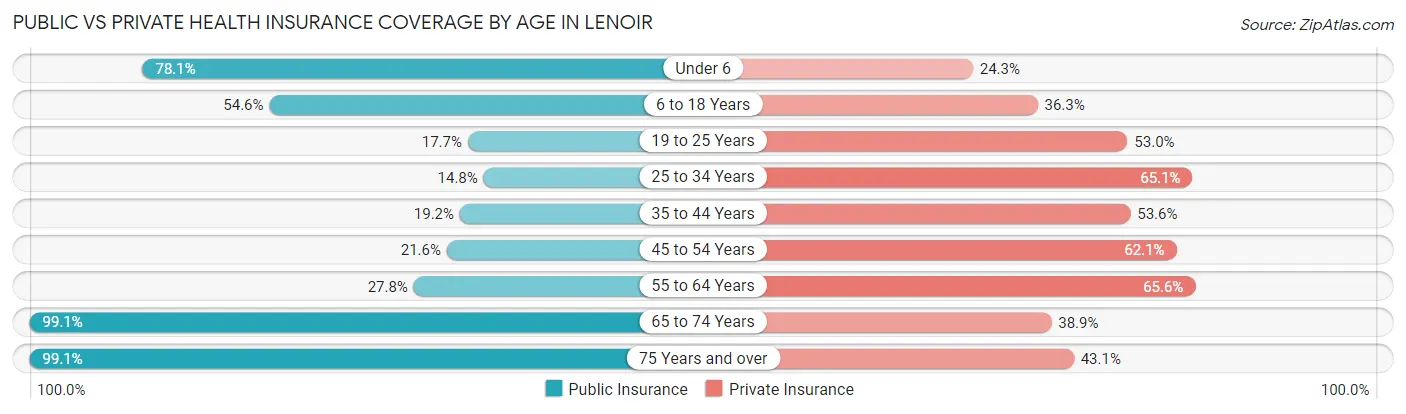
| Age Bracket | Public Insurance | Private Insurance |
| Under 6 | 958 (78.1%) | 298 (24.3%) |
| 6 to 18 Years | 1,661 (54.6%) | 1,106 (36.3%) |
| 19 to 25 Years | 280 (17.7%) | 837 (53.0%) |
| 25 to 34 Years | 261 (14.8%) | 1,148 (65.1%) |
| 35 to 44 Years | 344 (19.2%) | 959 (53.5%) |
| 45 to 54 Years | 522 (21.6%) | 1,498 (62.1%) |
| 55 to 64 Years | 662 (27.8%) | 1,563 (65.6%) |
| 65 to 74 Years | 2,192 (99.1%) | 860 (38.9%) |
| 75 Years and over | 1,434 (99.1%) | 623 (43.0%) |
| Total | 8,314 (46.6%) | 8,892 (49.8%) |
Disability Status by Sex by Age in Lenoir
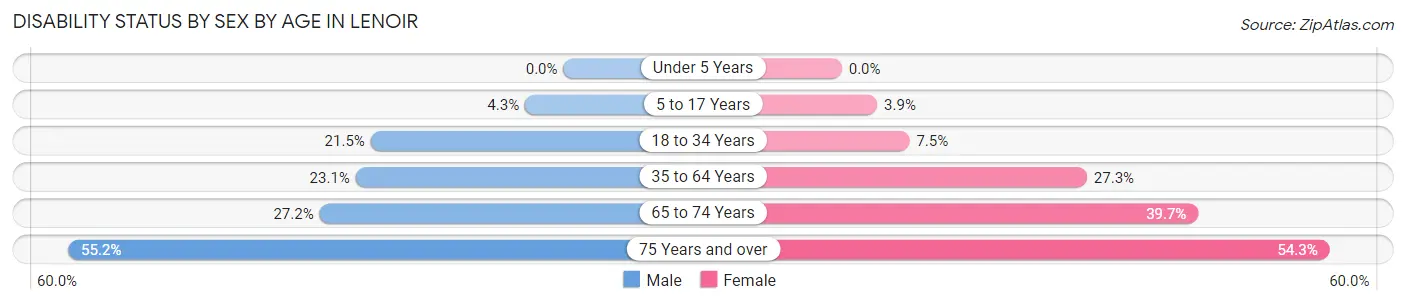
| Age Bracket | Male | Female |
| Under 5 Years | 0 (0.0%) | 0 (0.0%) |
| 5 to 17 Years | 51 (4.3%) | 56 (3.9%) |
| 18 to 34 Years | 411 (21.5%) | 148 (7.5%) |
| 35 to 64 Years | 693 (23.1%) | 980 (27.3%) |
| 65 to 74 Years | 195 (27.2%) | 593 (39.7%) |
| 75 Years and over | 262 (55.2%) | 528 (54.3%) |
Disability Class by Sex by Age in Lenoir
Disability Class: Hearing Difficulty
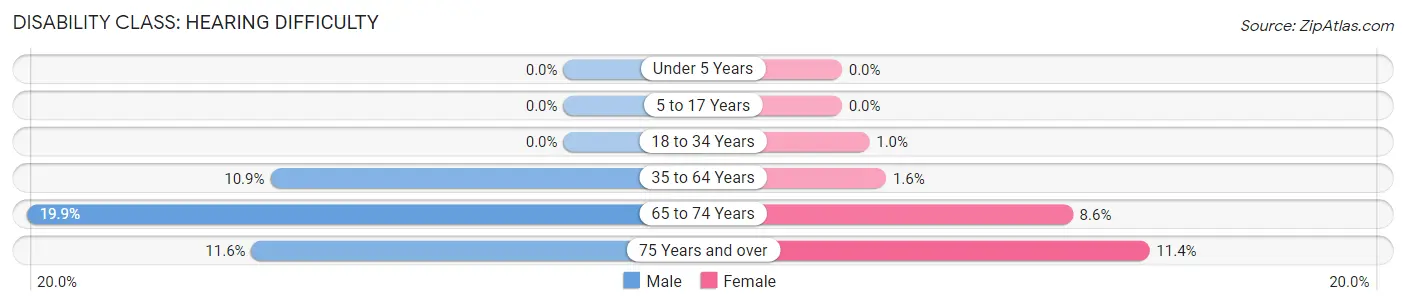
| Age Bracket | Male | Female |
| Under 5 Years | 0 (0.0%) | 0 (0.0%) |
| 5 to 17 Years | 0 (0.0%) | 0 (0.0%) |
| 18 to 34 Years | 0 (0.0%) | 20 (1.0%) |
| 35 to 64 Years | 326 (10.9%) | 59 (1.6%) |
| 65 to 74 Years | 143 (19.9%) | 128 (8.6%) |
| 75 Years and over | 55 (11.6%) | 111 (11.4%) |
Disability Class: Vision Difficulty
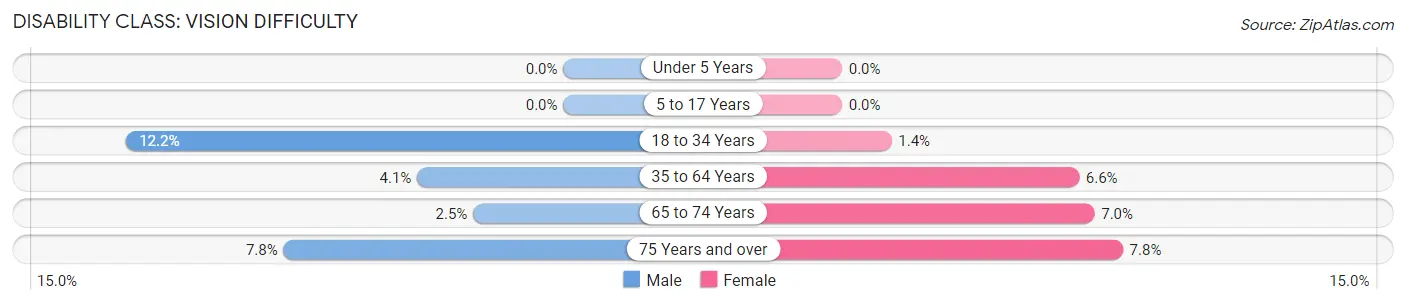
| Age Bracket | Male | Female |
| Under 5 Years | 0 (0.0%) | 0 (0.0%) |
| 5 to 17 Years | 0 (0.0%) | 0 (0.0%) |
| 18 to 34 Years | 233 (12.2%) | 27 (1.4%) |
| 35 to 64 Years | 122 (4.1%) | 237 (6.6%) |
| 65 to 74 Years | 18 (2.5%) | 105 (7.0%) |
| 75 Years and over | 37 (7.8%) | 76 (7.8%) |
Disability Class: Cognitive Difficulty
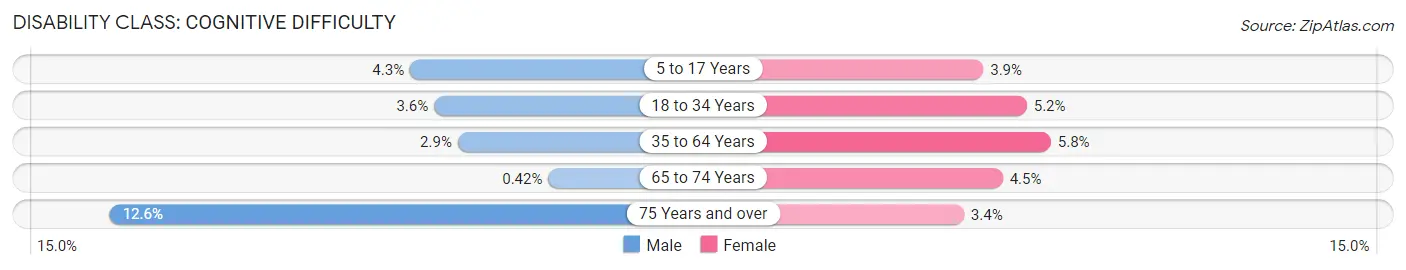
| Age Bracket | Male | Female |
| 5 to 17 Years | 51 (4.3%) | 56 (3.9%) |
| 18 to 34 Years | 69 (3.6%) | 101 (5.1%) |
| 35 to 64 Years | 88 (2.9%) | 209 (5.8%) |
| 65 to 74 Years | 3 (0.4%) | 67 (4.5%) |
| 75 Years and over | 60 (12.6%) | 33 (3.4%) |
Disability Class: Ambulatory Difficulty
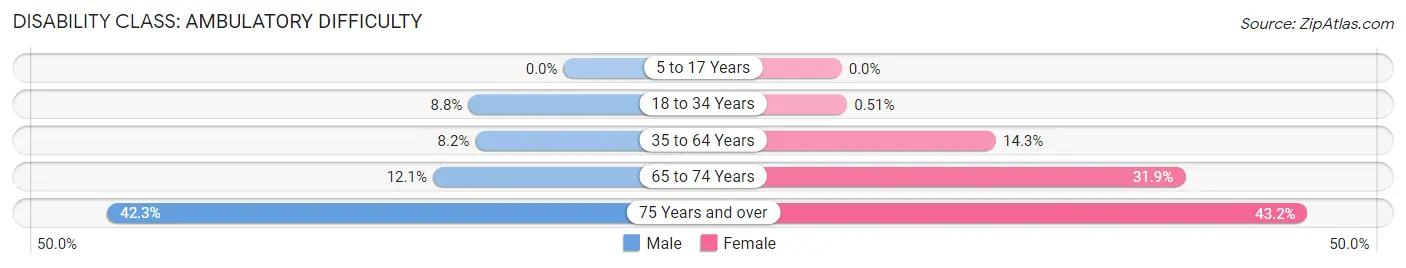
| Age Bracket | Male | Female |
| 5 to 17 Years | 0 (0.0%) | 0 (0.0%) |
| 18 to 34 Years | 169 (8.8%) | 10 (0.5%) |
| 35 to 64 Years | 245 (8.2%) | 514 (14.3%) |
| 65 to 74 Years | 87 (12.1%) | 476 (31.9%) |
| 75 Years and over | 201 (42.3%) | 420 (43.2%) |
Disability Class: Self-Care Difficulty
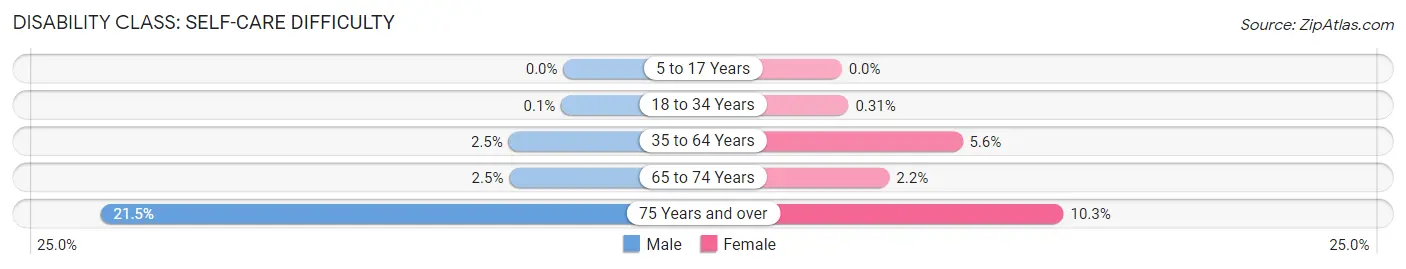
| Age Bracket | Male | Female |
| 5 to 17 Years | 0 (0.0%) | 0 (0.0%) |
| 18 to 34 Years | 2 (0.1%) | 6 (0.3%) |
| 35 to 64 Years | 76 (2.5%) | 201 (5.6%) |
| 65 to 74 Years | 18 (2.5%) | 33 (2.2%) |
| 75 Years and over | 102 (21.5%) | 100 (10.3%) |
Technology Access in Lenoir
Computing Device Access in Lenoir
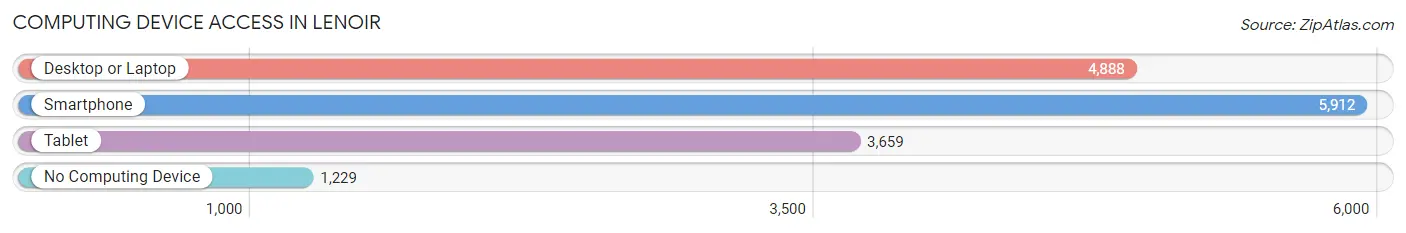
| Device Type | # Households | % Households |
| Desktop or Laptop | 4,888 | 64.2% |
| Smartphone | 5,912 | 77.7% |
| Tablet | 3,659 | 48.1% |
| No Computing Device | 1,229 | 16.2% |
| Total | 7,612 | 100.0% |
Internet Access in Lenoir
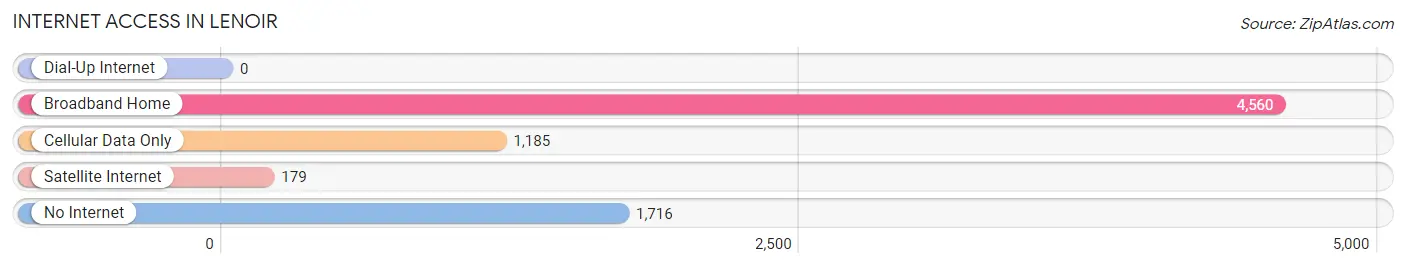
| Internet Type | # Households | % Households |
| Dial-Up Internet | 0 | 0.0% |
| Broadband Home | 4,560 | 59.9% |
| Cellular Data Only | 1,185 | 15.6% |
| Satellite Internet | 179 | 2.4% |
| No Internet | 1,716 | 22.5% |
| Total | 7,612 | 100.0% |
Lenoir Summary
History
The history of Lenoir, North Carolina dates back to the mid-1800s when the area was first settled by European settlers. The town was originally known as Tucker’s Crossroads, named after the family who owned the land. In 1855, the town was renamed Lenoir in honor of Revolutionary War hero General William Lenoir.
Lenoir was an important stop on the North Carolina Railroad, which connected the town to the larger cities of Charlotte and Raleigh. This allowed Lenoir to become an important center of commerce and industry. The town was home to several factories, including a cotton mill, a furniture factory, and a tobacco warehouse.
In the early 1900s, Lenoir was a thriving community with a population of over 3,000 people. The town was home to several churches, schools, and businesses. The town was also home to a number of prominent citizens, including the first African-American mayor of Lenoir, William J. White.
Lenoir experienced a period of decline in the mid-1900s as the railroad industry declined and the factories closed. The population of Lenoir decreased to just over 2,000 people by the 1970s.
In the late 1970s, Lenoir began to experience a period of revitalization. The town was designated as a Main Street Community in 1979, and the downtown area was revitalized with new businesses and restaurants. The population of Lenoir has grown steadily since then, and the town now has a population of over 18,000 people.
Geography
Lenoir is located in the foothills of the Blue Ridge Mountains in western North Carolina. The town is situated in Caldwell County, and is bordered by the towns of Granite Falls, Hudson, and Morganton. The town is located at the intersection of US Highway 321 and NC Highway 18.
Lenoir is located in a hilly region, with elevations ranging from 1,000 to 2,000 feet above sea level. The town is located in a temperate climate, with mild winters and hot, humid summers.
Economy
The economy of Lenoir is largely based on manufacturing and tourism. The town is home to several factories, including a furniture factory, a textile mill, and a plastics plant. The town is also home to several restaurants, shops, and other businesses.
Lenoir is also a popular tourist destination, with several attractions in the area. The town is home to the Caldwell County Historical Museum, the Lenoir Nature Preserve, and the Lenoir Aquatic Center. The town is also home to several wineries and breweries, as well as several golf courses.
Demographics
As of the 2010 census, the population of Lenoir was 18,228. The population is largely white (83.3%), with African-Americans making up 11.3% of the population. The median household income in Lenoir is $37,845, and the median age is 38.7 years. The town has a poverty rate of 17.3%.
Common Questions
What is Per Capita Income in Lenoir?
Per Capita income in Lenoir is $25,697.
What is the Median Family Income in Lenoir?
Median Family Income in Lenoir is $65,259.
What is the Median Household income in Lenoir?
Median Household Income in Lenoir is $44,802.
What is Income or Wage Gap in Lenoir?
Income or Wage Gap in Lenoir is 18.9%.
Women in Lenoir earn 81.1 cents for every dollar earned by a man.
What is Family Income Deficit in Lenoir?
Family Income Deficit in Lenoir is $12,608.
Families that are below poverty line in Lenoir earn $12,608 less on average than the poverty threshold level.
What is Inequality or Gini Index in Lenoir?
Inequality or Gini Index in Lenoir is 0.43.
What is the Total Population of Lenoir?
Total Population of Lenoir is 18,301.
What is the Total Male Population of Lenoir?
Total Male Population of Lenoir is 8,251.
What is the Total Female Population of Lenoir?
Total Female Population of Lenoir is 10,050.
What is the Ratio of Males per 100 Females in Lenoir?
There are 82.10 Males per 100 Females in Lenoir.
What is the Ratio of Females per 100 Males in Lenoir?
There are 121.80 Females per 100 Males in Lenoir.
What is the Median Population Age in Lenoir?
Median Population Age in Lenoir is 43.2 Years.
What is the Average Family Size in Lenoir
Average Family Size in Lenoir is 3.1 People.
What is the Average Household Size in Lenoir
Average Household Size in Lenoir is 2.3 People.
How Large is the Labor Force in Lenoir?
There are 8,069 People in the Labor Forcein in Lenoir.
What is the Percentage of People in the Labor Force in Lenoir?
53.9% of People are in the Labor Force in Lenoir.
What is the Unemployment Rate in Lenoir?
Unemployment Rate in Lenoir is 6.8%.